
Fractal Dimension of Digital 3D Rock Models with Different Pore Structures


1
Key Laboratory of Tectonics and Petroleum Resources, China University of Geosciences, Ministry of Education, Wuhan 430074, China
2
Institute of Geophysics and Geomatics, China University of Geosciences, Wuhan 430074, China
3
State Key Laboratory of Petroleum Resources and Prospecting, China University of Petroleum, Beijing 102249, China
*
Author to whom correspondence should be addressed.
Energies 2022, 15(20), 7461; https://doi.org/10.3390/en15207461
Submission received: 21 August 2022
/
Revised: 3 October 2022
/
Accepted: 7 October 2022
/
Published: 11 October 2022
(This article belongs to the Collection Flow and Transport in Porous Media)
Abstract
:The macroscopic physical properties of rocks are profoundly determined by their microstructure, and the research of accurately characterizing rock pore structure has been extensively carried out in the fields of petroleum engineering and geoscience. Fractal geometry is an effective means of quantitatively estimating the pore structure properties of porous media. In this study, the evolution law of the fractal dimension and the quantitative relationship between the fractal dimension and porosity were investigated based on the digital 3D rock models. First, three kinds of models with gradually changing pore structures, namely sedimentation, compaction, and cementation, were systematically reconstructed by the process-based approach. Then, the fractal dimensions of the skeleton, pore, and surface of the models were computed and analyzed. Finally, the relationships among the fractal dimension, porosity, and complexity were explored qualitatively. These works reveal the changing laws of three types of fractal dimensions for different pore structure models. The pore structure differences in sedimentation model can only be distinguished by the surface fractal dimension, while both pore and surface fractal dimensions are available parameters for characterizing different pore structures in compaction and cementation models. The quantitative relations between box-counting fractal dimension and porosity were established, which can be expressed by combining linear and logarithmic formulas. The comparison of fractal dimensions of compaction and cementation models proves that fractal dimensions can distinguish the subtle pore structure differences in digital 3D rock models. Understanding the evolution law between the fractal dimension and pore structure parameters provides more references for classifying and evaluating rock pore structure features using fractal dimensions.
1. Introduction
As a kind of complex porous medium, rock has the structural characteristics of being heterogeneous, discontinuous, anisotropic, and multiphase. The irregularity of rock pore structure occurs in different scales, which influences the physical properties, such as porosity, density, elasticity, permeability, and conductivity [1,2,3,4]. The microstructure is a significant factor determining the macroscopic properties of rock [5,6,7,8]. Therefore, determining how to establish a digital rock that can characterize the microscopic pore structure of real rocks and how to understand and describe the pore structure characteristics of digital rocks is a widely discussed issue.
The digital 3D core, which characterizes the microstructure of rock at the pore scale, has become the basis of quantitative analysis for pore structures and physical properties [9,10]. In the past few decades, digital rock modeling technology has been studied extensively. Generally, there are mainly two categories for constructing a digital core: physical experiment and numerical reconstruction [11,12]. The physical experiment is described as the use of high-precision scanning equipment to directly image rock samples to establish digital images. The specific methods include X-ray computed microtomography [13], focused ion beam [14], and the combination of a series of thin sections [15]. On the other hand, numerical reconstruction is described as the use of computer and mathematical algorithms to simulate and establish a reconstruction model that is consistent with the characteristics of rock properties. The input of modeling is based on the low-order statistical information of rock, such as porosity, particle size distribution, and two-point correlation function. The specific methods include simulated annealing method [16], sequential indicator simulation method [17], multiple point geostatistics method [18], Markov chain method [19], process-based method [20,21,22,23,24], and hybrid modeling [25,26]. Each modeling method has specific advantages, and digital rock provides a prerequisite for the in-depth and convenient study of the pore structure and physical properties of rock.
The process-based method is an effective tool for reconstructing digital rock models with different pore structures. Bryant and Blunt [27] proposed this method of simulating the rock formation process to reconstruct a digital core. Bakke and Øren [20] performed a systematical and profound study on the process-based method, which not only considered the distribution of grain size, but also simulated the quartz cement growth and the clay coating of the free surface. Øren and Bakke [28] reconstructed the digital rock model of Fontainebleau sandstone using this method, which well reflected the geometric and conductive properties. Jin et al. [22] discussed in detail the geometrical structure and mechanical properties of grains. Zhu et al. [23] reconstructed the digital core by using irregular grains in the sedimentation simulation. The process-based method, which is economical and efficient, has the prominent advantage of systematically establishing digital 3D rock models with gradually changing pore structure and porosity.
The pore space of rock presents extreme irregularities at different scales [29], and it is difficult to quantify the complexity of pore structure using the traditional Euclidean integer dimension. Therefore, fractal geometry has been rapidly and extensively developed in microstructure characterization of porous media since Mandelbrot [30] proposed the concept of fractals. Hansen and Skjeltorp [31] established a fractal model to describe the number-size distribution of fractures and faults produced by a tectonic process. Roy et al. [32] and Wu et al. [33] calculated the fractal dimension of rock fractures using the box-counting method. Anovitz et al. [34] and Li et al. [35] investigated the fractal properties of pore throat structure in porous media. Krohn [36], Vega and Jouini [37], and Liu and Ostadhassan [38] evaluated the fractal characteristics of pore structures of unconventional reservoirs such as carbonate and shale at different scales. Tao and Zhang [39] and Zhang et al. [40] proposed fractal models of the pore volume fraction, particle volume fraction, and size distribution of pores or particles to characterize the fractal characteristics of porous media. Dathe and Thullner [41] and Yu et al. [42] probed the relationship between the skeleton fractal dimension and pore fractal dimension. Li et al. [24] calculated and analyzed the fractal characteristics of the solid, pore, and interface of a digital 2D rock model. Many studies have shown that the fractal dimension is a practical tool to quantify the microscopic pore structures of porous media [43,44,45,46,47,48]. However, there is still no clear quantitative model for the relationships among porosity, pore structure complexity, and fractal dimension in digital rocks with different pore structures.
In addition, fractal parameters calculated from images are powerful standards in the characterization, classification, and evaluation of pore structures in porous media with the rapid development of computer technology [8,33,37,49]. The box-counting method has simple and executable properties in calculating the fractal dimension, so it is a common method for fractal estimation of 2D or 3D images [50,51]. However, the box-counting fractal dimension is affected by a wide range of factors, including the computational algorithm and the porous media image itself [52,53]; in particular, the porosity has a huge impact on the fractal dimension results. Therefore, exploring the relationship between pore structure parameters and fractal dimensions is the basis for extending its applicability. Researchers have conducted some related studies and have made some progress (Table 1). However, these works usually use a small number of digital rock samples, and/or the pore structure of the models does not have the characteristics of gradual change, so it is difficult to accurately grasp the evolution law and quantitative relationship of the fractal dimension.
In this work, the fractal dimension of digital 3D cores with gradually changing pore structure was computed by using the box-counting algorithm, and the characteristics of different fractal phases were discussed. Firstly, three kinds of models with different pore structures, namely the sedimentation model, compaction model, and cementation model, were systematically reconstructed utilizing the process-based approach. Next, the fractal dimensions of the skeleton, pore, and surface of the digital rock models were estimated and their changing laws were analyzed. Finally, the quantitative relations between fractal dimensions and porosity were discussed.
2. Methods
2.1. Process-Based Modeling
An effective method of obtaining digital rock microstructure is the simulation of the formation process of rock. Bakke and Øren [20] summarized the basic principle of the process-based method, which can be described as three main steps: sedimentation, compaction, and diagenesis. The basic information such as porosity, particle size distribution, two-point correlation function, and shale content obtained from 2D thin section images of rocks are usually used as input parameters for modeling. Using mathematical algorithms and computer technology to simulate the formation process of rock, the digital core model reflecting the microscopic pore structure can be obtained. The method does not attempt to accurately reproduce the complex formation processes of rocks, but to reconstruct digital rock models by simulating the results of the main sandstone-forming processes [20,28].
The code for reconstructing the 3D process-based models was developed, and it is implemented in MATLAB. Figure 1 shows the three procedures for reconstructing the digital core using the process-based approach. The first step in the simulation of sedimentation is to set up the grain size distribution and deposition area. Figure 1a shows the grain size distribution curve obtained from a sandstone. The grains can be selected based on the distribution curve, and the deposition area can be set quantitatively according to the grain size distribution and the required model size. Then, the most stable position of the grains needs to be determined. A new grain can be deposited only after the previous grain falls and stabilizes. When all the grains are deposited and meet the stable condition, the sedimentation model is obtained. Figure 1a–d illustrate the sedimentation step, in which a red grain is highlighted throughout the process. Then, the stable sedimentation model is binarized, where the particle skeleton is represented in black and the pore space is represented in white (Figure 1e).
In the compaction simulation, it is assumed that grains remaining constant in shape can be translated and interpenetrated, which forms a digital rock model with varying porosity and pore geometry, as shown in Figure 1f. The compaction is described as a linear process in which the Z-coordinate of each grain center is shifted vertically downward in proportion to the original Z0,
where Z0 and Z1 are the initial value and new value of the grain center in the Z-coordinate, respectively, and λ is the factor reflecting the compaction level.
In the cementation simulation, it is assumed that the minerals of different compositions and types are precipitated and consolidated on the grain surface, which changes the porosity and pore geometry of the initial model. Roberts and Schwartz [59] proposed the grain consolidation model, in which the spheres are transformed into polyhedrons by uniform growth to simulate the cementation process. Bryant and Blunt [27] introduced the geometric uniform growth model to simulate cement overgrowth by uniformly increasing the radii of all grains. Jin et al. [22] considered the effects of silica growth rate and grain size on cementation and summarized a strict formula with several parameters to control the direction and amount of cementation. To cause the pore structures of the cementation model to have the characteristics of gradual change, the geometric uniform growth model is adopted, which can be further interpreted as that the cement grows uniformly in all directions of the original grain surface, forming an equal-thickness cemented layer, as shown in Figure 1g, with black representing rock skeleton, white representing pore space, and blue representing cemented layer.
where D0 is the original grain diameter, D1 is the grain diameter after cementation, and β is the factor reflecting the cementation degree.
2.2. Calculation of Fractal Dimension
Many objects in nature, such as coastlines, mountains, and clouds, are extremely complex and cannot be described by traditional Euclidean geometry [60,61,62]. The fractal theory provides a scientific means for describing complex and irregular objects. It is significant for accurately characterizing and quantifying the pore structure complexity of porous media. Self-similarity, i.e., scale invariance, is an essential property of a fractal and is quantified by the fractal dimension.
Fractal is defined as a set (F) in which the Hausdorff dimension (DH) is strictly greater than its topological dimension (DT).
In most practical applications, it is difficult to calculate the Hausdorff dimension directly. Thus, various methods have been put forward to estimate the fractal dimension. Lopes and Betrouni [50] classified these methods into three main categories: box-counting method, fractional Brownian motion method, and area measurement method. Due to its reliability and applicability, the box-counting method is one of the most commonly used methods in various fields, especially for digital images [62,63].
The principle of calculating the fractal dimensions of 2D and 3D images using the box-counting method is basically the same. The only difference is that the 2D image is covered by squares, while the 3D image is covered by cubes [8]. To avoid errors caused by the cube size not completely covering the image, the sequence of divisors was applied to determine the cube size [56]. The calculation of the fractal dimension of an image using the box-counting algorithm is expressed as
where FD is the fractal dimension; r is the cube size, which ranges from the smallest unit in the voxel scale to 1/2 of the entire volume; and Nr is the total number of cubes containing the object of interest in the r scale.
Different fractal phases, including skeleton, pore, and surface, can be calculated by implementing the box-counting code to count different objects of interest [8,24,42,54,64]. Figure 2 illustrates the calculation process of different fractal phases of the digital core. Figure 2a displays the digital core model (6003 μm3) reconstructed by the process-based approach, whose central volume (5003 μm3) is selected for fractal calculation. Figure 2(b-1,b-2,b-3) shows three 3D images of the identical core after binarization, highlighting the phases of interest. The white voxels of b-1, b-2, and b-3, which are the objects of interest, represent the skeleton, pore, and surface, respectively. Figure 2(c-1,c-2,c-3) illustrates the process of obtaining the fractal dimension by fitting data points based on the corresponding fractal phase.
3. Digital Rock Model Material
To explore the relationship between the porosity, pore structure complexity, and fractal dimension, as well as the evolution law of the fractal dimension of various phases of interest, it is necessary to reconstruct the three-dimensional core models that meet the research needs. Three-dimensional core models with gradually varying pore structures were established simply and systematically, including a sedimentation model, a compaction model, and a cementation model. In terms of input parameters, different from using a specific particle size distribution, the modeling here refers to the gradually changing particle size of Luo et al. [58], so the pore structure of the reconstructed sedimentation model has the characteristics of progressive change. In terms of porosity, the compaction and cementation parameters were gradually changed to obtain the models of continuous evolution in porosity. In addition, the cementation process adopted the uniform growth mode, so there are slight differences between compaction and cementation models when the porosity is the same, which provides a model basis for verifying whether the fractal dimension can distinguish small differences in the pore structure.
The size of the representative volume elements of digital rocks is usually in the range of 500–3000 μm3. In order to improve the modeling efficiency, the deposition range of all models was set to 6003 μm3 under the condition of model homogeneity. Then only the volume of 5003 μm3 in the model center was employed for image processing and fractal calculation. Moreover, considering the capacity of computer modeling, the size of all models was set to 240 × 240 × 240 pixels.
During the modeling process, 10 random simulations were performed for each sub-model, so the mean and standard deviation could be calculated to evaluate the accuracy of the results of modeling and fractal dimension. The standard deviation reflects the degree of dispersion between a set of data. It is assumed that there is a set of data of x1, x2, …, xn, whose average () is expressed as
Further, the standard deviation (σ) is calculated as
The average and standard deviation of the relevant results were calculated in MATLAB based on 10 repeated simulations. Table 2 shows the modeling input parameters (including particle size distribution, compaction factor, and cementation factor) and porosity results (including mean and standard deviation) for the three models of sedimentation, compaction, and cementation.
3.1. Sedimentation Model
The sedimentation model was simulated by setting different grain sizes and contained eight sub-models, and the particle size parameters are shown in Table 2. Figure 3 shows the grain deposition images of the three sub-models. The corresponding three sub-models b-1, b-2, and b-3 were obtained by binarization, in which the black represents the grain skeleton and the white represents the pore space.
From A1 to A8, the types of grain size gradually increase, whereas the number of grains with different sizes in each sub-model is equal. The sub-model A1, containing only one kind of grain size with a diameter of 100 μm, has a uniform deposition arrangement, so it has a relatively regular and simple pore structure, as shown in Figure 3(a-1,b-1). The sub-model A8 containing eight kinds of grain sizes, since the pore space between larger grains is often filled by smaller grains, has more compact packing and more complex pore structure, as shown in Figure 3(a-3,b-3). The porosity evolution of the sedimentation model is depicted in Figure 3c, where (and in all subsequent figures of the same type) red dots and green error bars represent the arithmetic mean and standard deviation of 10 repeated simulations, respectively. The porosity exhibits an initial slight increase followed by a gradual decrease, which is usually closely related to the grain size distribution. The A1 sub-model shows regular packing because it contains only one grain size, but the A2 sub-model cannot be tightly packed because the two grain sizes do not change much, so the porosity increases slightly. With the change in grain size distribution, small grains can effectively fill the large pore space, so the porosity has a decreasing trend, but there is a small variation range with only 0.0197 from 0.3840 to 0.3643. Overall, the sedimentation model is characterized by a gradual change in the complexity of the pore structure.
3.2. Compaction Model
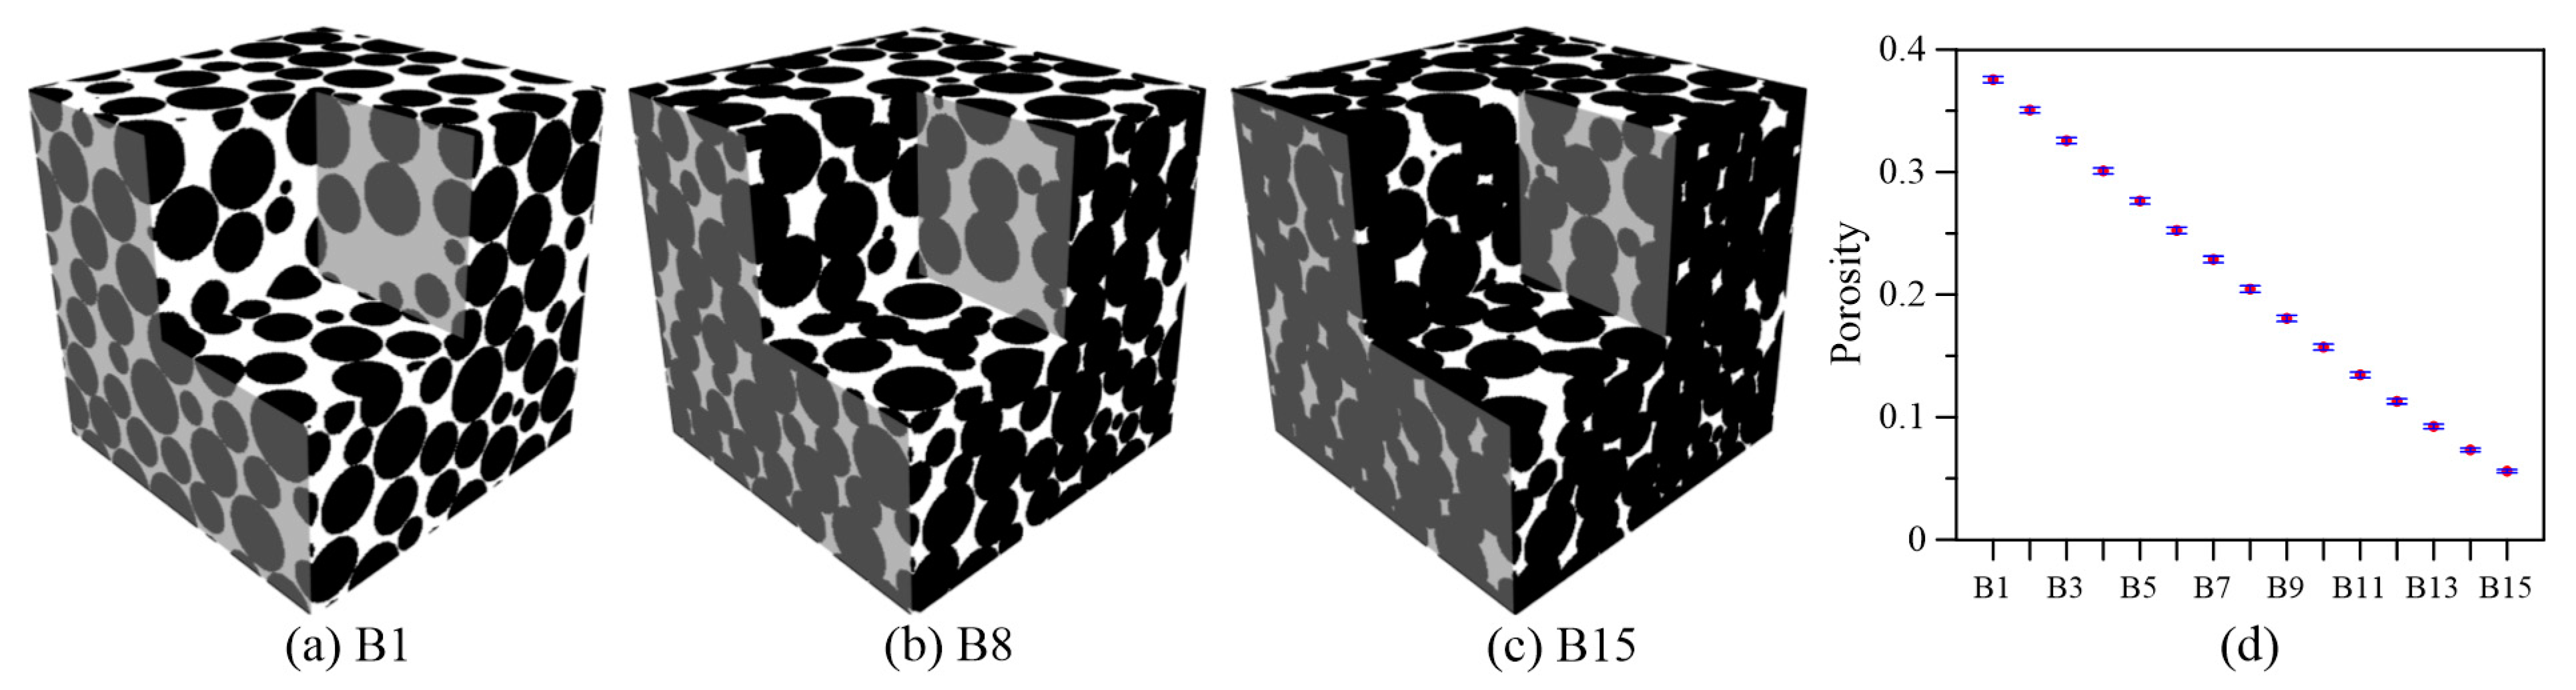
Taking sub-model A5 of the sedimentation model as the initial sub-model (i.e., B1 in compaction model), the compaction model including 15 sub-models was constructed by setting different compaction factors (Equation (1)). Figure 4 displays 3D images of B1, B8, and B15 and the porosity evolution of the model. As the compaction factor increases, the vertical movement between particles continuously occurs, so the entire model changes gradually, which reduces the complexity and heterogeneity of the pore structure to some extent (Figure 4a–c). However, the diameter and surface morphology of each grain remain unchanged, so it is considered that the complexity of a single grain is invariable.
Figure 4d shows the porosity evolution of the compaction model, which is obviously different from that of the sedimentation model. With the increase in the compaction factor, the porosity of the model decreases rapidly from 0.3755 to 0.0559, decreasing by 85.11%, indicating that compaction reduces the initial model porosity significantly. Meanwhile, the porosity standard deviation of 10 repeated simulations is far less than the porosity variation, indicating that the deviation of compaction is small and the final effect is consistent.
3.3. Cementation Model
Similarly, taking the sub-model A5 as the initial sub-model, the cementation model including 15 sub-models was simulated by setting different cementation factors (Table 2). Figure 5 displays 3D images of C1, C8, and C15 and the porosity evolution of the cementation model. From C1 to C15, the contact and overlap between grains cause the pore space to decrease (Figure 5a–c), which results in the complexity and dispersivity of the pore structure decreasing accordingly. In addition, compared with the compaction model, it is worth noting that the degree of surface curvature of the grain gradually decreases with the increase in grain diameter, resulting in a change in single-grain complexity. This can be understood as that when only a single sphere is considered, the surface of the small sphere is more curved than the large sphere, or the specific surface area of the small sphere is larger than that of the large one. The difference between the compaction and cementation models is that there is a slight variation in particle size which results in subtle differences in the complexity of the pore structure. Figure 5d shows the porosity evolution of the cementation model, which is similar to that of the compaction model. The porosity has a sharp decrease; it is reduced by 91.61% from 0.3755 to 0.0315.
In general, three types of models with gradually changing pore structures were reconstructed by the simulation of the rock formation process, providing the basis for fractal dimension calculation.
4. Results and Discussion
The digital 3D cores with different pore structures were modeled using the process-based approach, and the fractal dimensions of these models were then calculated using the box-counting method. The relations among porosity, pore structure complexity, and fractal dimension were qualitatively investigated.
4.1. Fractal Dimension of Sedimentation Model
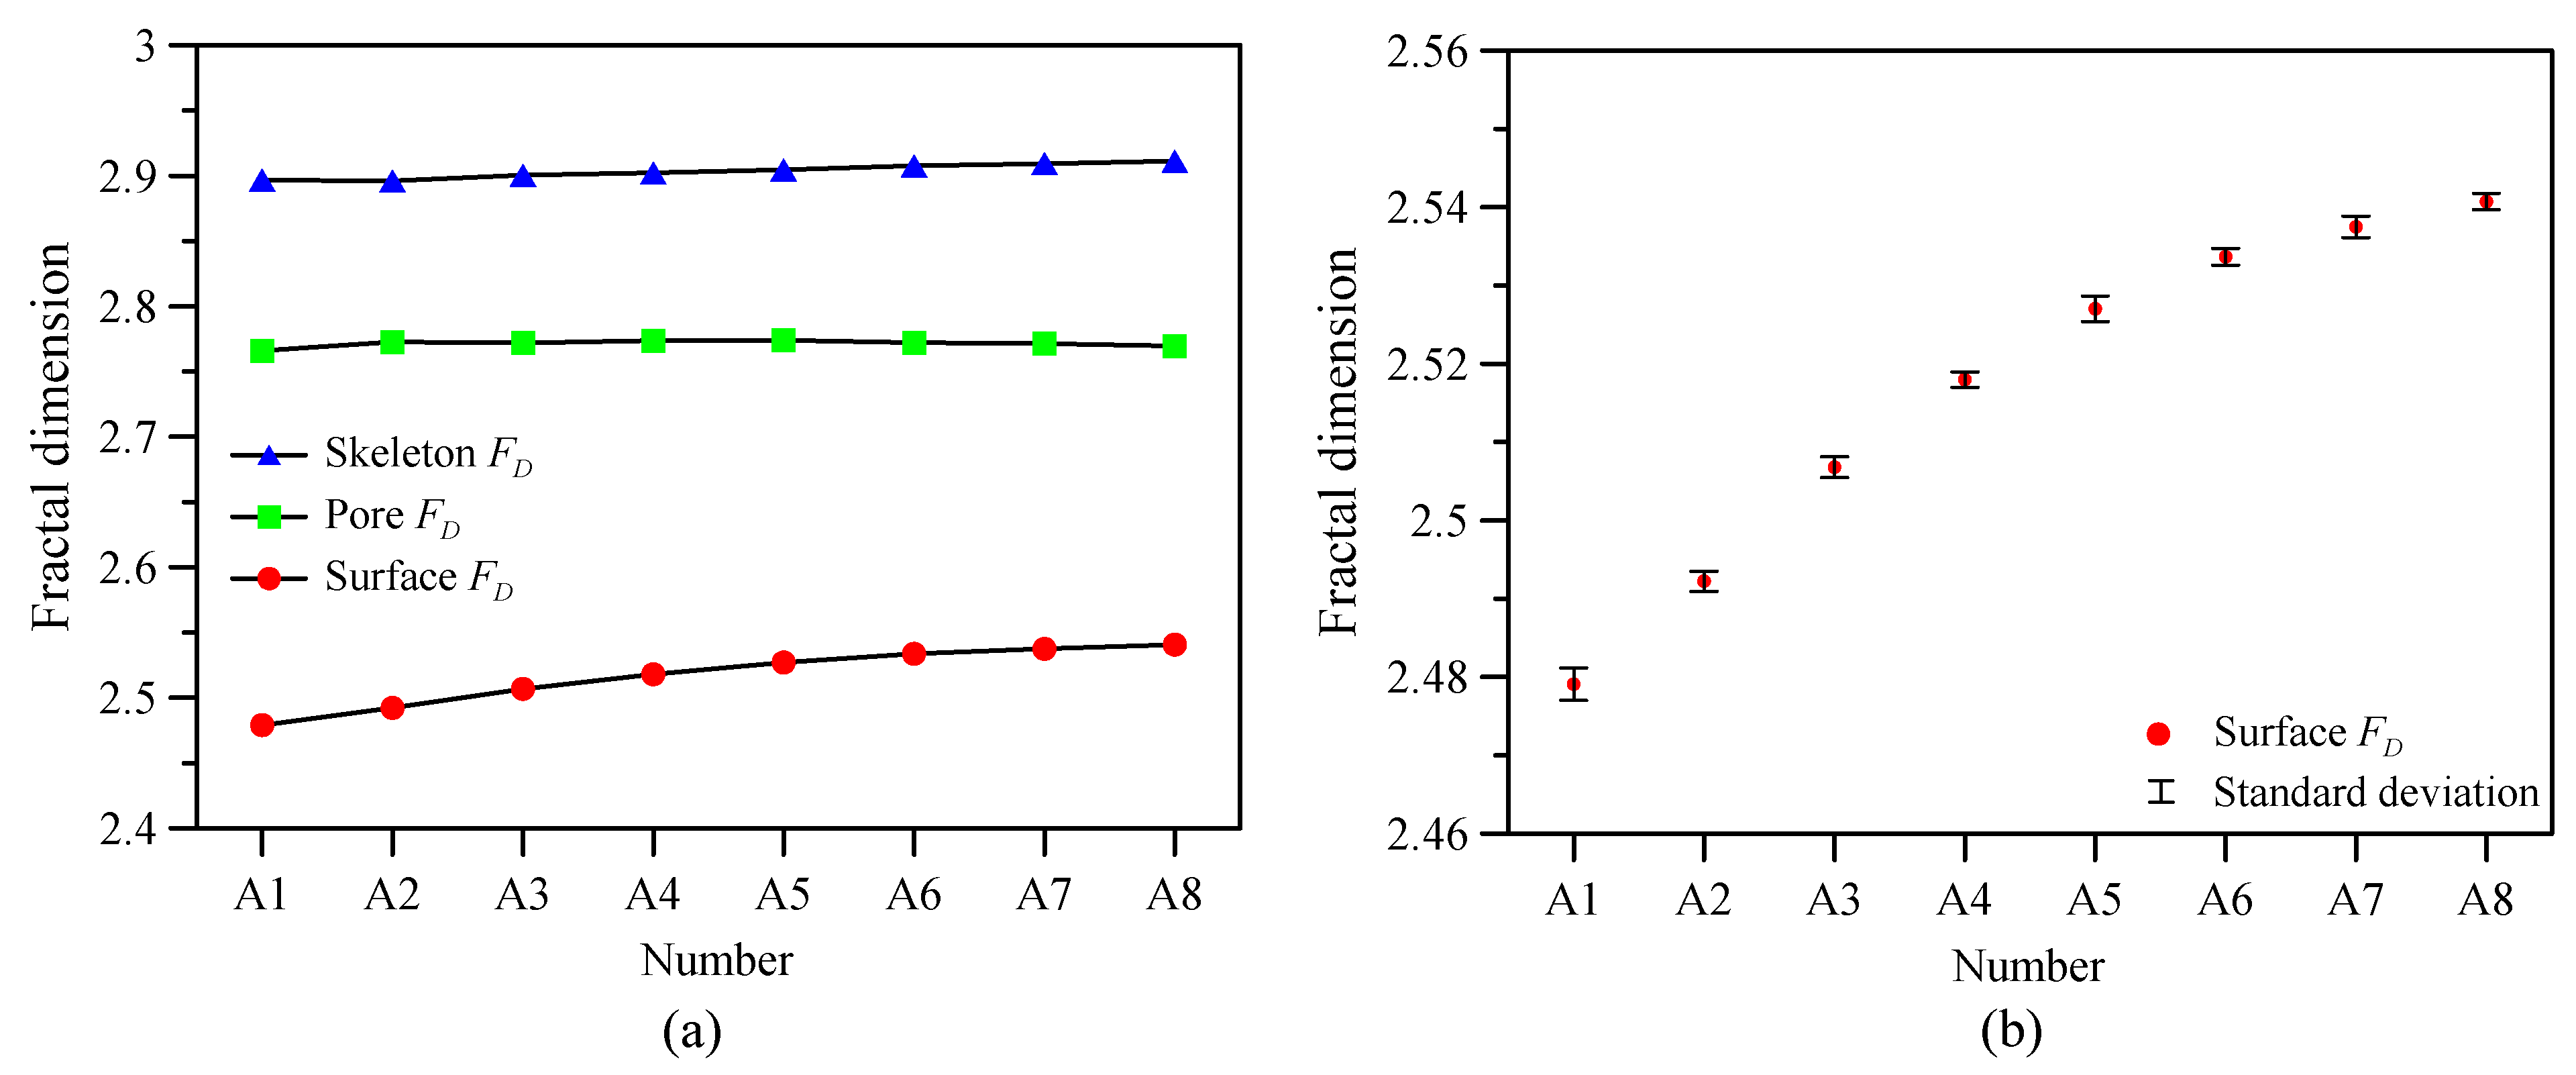
Figure 6 shows the variation in the fractal dimensions of the sedimentation model. The fractal dimensions of the skeleton, pore and surface are marked as blue triangles, green squares, and red dots respectively. Figure 6b highlights the surface fractal dimension and its standard deviation. It can be seen that the skeleton fractal dimension of the sedimentation model is the largest, while its variation range is small with only 0.0151 from 2.8960 to 2.9111. In addition, the value of the pore fractal dimension is between that of the skeleton and surface, and its variation range is only 0.0080 (2.7660–2.7740), which is even lower than that of the skeleton. The reason for this is that the pore fractal dimension is affected by both porosity and pore structure complexity; more specifically, it increases with the increase in porosity and pore structure complexity. With the increase in the number of particle types in the sedimentation model, the complexity of the pore structure has a slight rise, while the porosity has a slight decline, which eventually leads to a quite small change in the pore fractal dimension. Accordingly, it is clear that the fractal dimensions of the skeleton and pore cannot effectively reflect these pore structure differences in the sedimentation model.
Of the three kinds of fractal dimensions, the surface fractal dimension is the smallest, which is not only applicable to the process-based model, but also applicable to all digital images [41]. Figure 6b shows that the surface fractal dimension rises gradually from A1 to A8, which reflects that there is a steady increase in the complexity of pore structure in the sedimentation model. The standard error of 10 repeated simulations is very small, indicating that the results of random repetition are consistent. On the other hand, the variation range of the surface fractal dimension is 0.0616 from 2.4791 to 2.5407, which is overwhelmingly greater than that of the skeleton and pore. Therefore, it can be easily concluded that the surface fractal dimension is an effective parameter for characterizing and quantifying the pore structure complexity of the sedimentation model.
In the study of rock fractals, the complexity of rock pore structure is usually related to the value of the fractal dimension, and the effect of the fractal phase (i.e., the volume fraction of the considered object) is usually ignored. Moreover, more studies focus on evaluating the complexity of digital core images only using the pore fractal dimension and do not comprehensively consider the relationship between the three types of fractal dimensions of skeleton, pore, and surface. It is worth emphasizing that when using box counting to calculate the fractal dimension of digital cores that possess a small variation in porosity, the difference in pore structure between these rocks may not be able to be characterized by the fractal dimensions of the skeleton and pore, but it is a better choice to apply the surface fractal dimension. Therefore, it is of great significance for the comprehensive evaluation of rock pore structure to study the fundamental laws of the three kinds of fractal dimensions.
4.2. Fractal Dimension of Compaction Model
Figure 7a shows the evolution curves of fractal dimensions of the compaction model. It can be seen that as the value of λ (i.e., the model number) increases, the skeleton fractal dimension has a slight growth, and the increase value is 0.0869 (2.9047–2.9916), which cannot be understood as the increase in the skeleton phase complexity, but the dramatic rise in the volume fraction of the skeleton phase. In addition, the fractal dimension of the pore is between that of the skeleton and that of the surface. However, there is a considerable increase in the variation interval of the pore fractal dimension, reaching 0.4757 (2.2983–2.7740), which is even larger than that of the surface phase. The explanation for this is that with increasing compaction factor, the porosity has a sharp reduction, and the pore space irregularity has a certain degree of drop, which eventually results in the rapid decrease in pore fractal dimension. From B1 to B15, the surface fractal dimension has a steady drop, and the decrease value is 0.2985 (2.2291–2.5276). Overall, both pore and surface fractal dimensions have significant responses to the differences in pore structures for the compaction model.
Through further analysis in Figure 7a, it was found that the variation range of the pore fractal dimension is larger than that of the surface fractal dimension (i.e., the pore fractal dimension has a steeper decline), which indicates that with the increase in λ, pore fractal dimension has a stronger response and is a more sensitive parameter to reflect the comprehensive influence of porosity and pore structures.
Figure 7b shows the standard deviation of the fractal dimension of 10 repeated simulations in the compaction model. Only some sub-model data are highlighted to facilitate the observation of standard deviation results. It can be seen that the standard error has a very small value compared with the significant changes in the average of the fractal dimension. In particular, the standard deviation of the pore fractal dimension is extremely small. This indicates that the results of random repetition have little deviation and good consistency, which proves that digital rock modeling and fractal analysis have significant accuracy and reliability.
4.3. Fractal Dimension of Cementation Model
Figure 8a shows the evolution curves of the fractal dimension in the cementation model. Since the pore structure change of the cementation model is similar to that of the compaction model, there are extremely similar change trends in the fractal dimension between these two models. There is a slight growth in the skeleton fractal dimension to 0.0905 (2.9047–2.9952) with the increase in β (i.e., the model number). However, the pore and surface fractal dimensions decrease significantly by 0.6471 (2.1269–2.7740) and 0.4680 (2.0596–2.5276), respectively. The interpretation of the variation of the fractal dimension in the cementation model is similar to that of the compaction model. Both pore and surface fractal dimensions can significantly respond to the change in pore structure in the cementation model. In addition, the standard deviation of the fractal dimension of 10 repeated simulations for some sub-models is shown in Figure 8b, and all values are small, indicating that the fractal dimension results have significant reliability.
In practice, it is necessary and critical to accurately characterize and quantify the fractal attributes of real rock microstructure. If the porosity and complexity of real rock samples have a relatively large difference, the fractal dimensions of the pore and surface can be the active parameters for characterizing these rocks, and furthermore, the pore fractal dimension may have a higher sensitivity to the change in porosity. In addition, there are subtle differences in pore structure between the cementation model and the compaction model. It is important to understand the response law of the fractal dimension generated by these subtle differences and to prove the effectiveness of the fractal dimension in distinguishing pore structure differences. Therefore, further analysis of the relationship between the three kinds of fractal dimensions and the microscopic pore structure is significant for the fractal evaluation of porous media.
4.4. Quantitative Analysis of Fractal Dimension
The fractal dimension of rock is determined by the microscopic pore characteristics (i.e., the number, shape, and distribution of pore space), and it is of great significance to explore the relationship between them for the evaluation of rock complexity and the analysis of rock physical properties. The fractal data of the compaction and cementation models are depicted as black dots, which have a gradual drop with the decrease in porosity (ϕn), as shown in Figure 9. The effective fitting of these data points is important for understanding the relationship between porosity and fractal dimension. Through the detailed exploration of fractal data, it was found that the highest determination coefficient and good fitting curve can be obtained by considering both logarithmic and linear equations on both sides of the porosity of 0.2, as shown in Table 3. The determination coefficients (R2) of all the fitting formulas are greater than 0.95, which indicates that there is an excellent fitting relationship between porosity and fractal dimensions. In addition, Figure 9 demonstrates the fitting curves between the pore and surface fractal dimensions and the porosity of the two models.
It is noteworthy that when the porosity is greater than 0.2, the linear equation shows a good fitting effect. However, when the porosity is less than 0.2, the logarithmic formula can be better applied to characterize this relationship. This illustrates that with the decrease in porosity, especially when the porosity is less than 0.2, the fractal dimensions of the pore and surface have a decreasing trend of increasing rapidity.
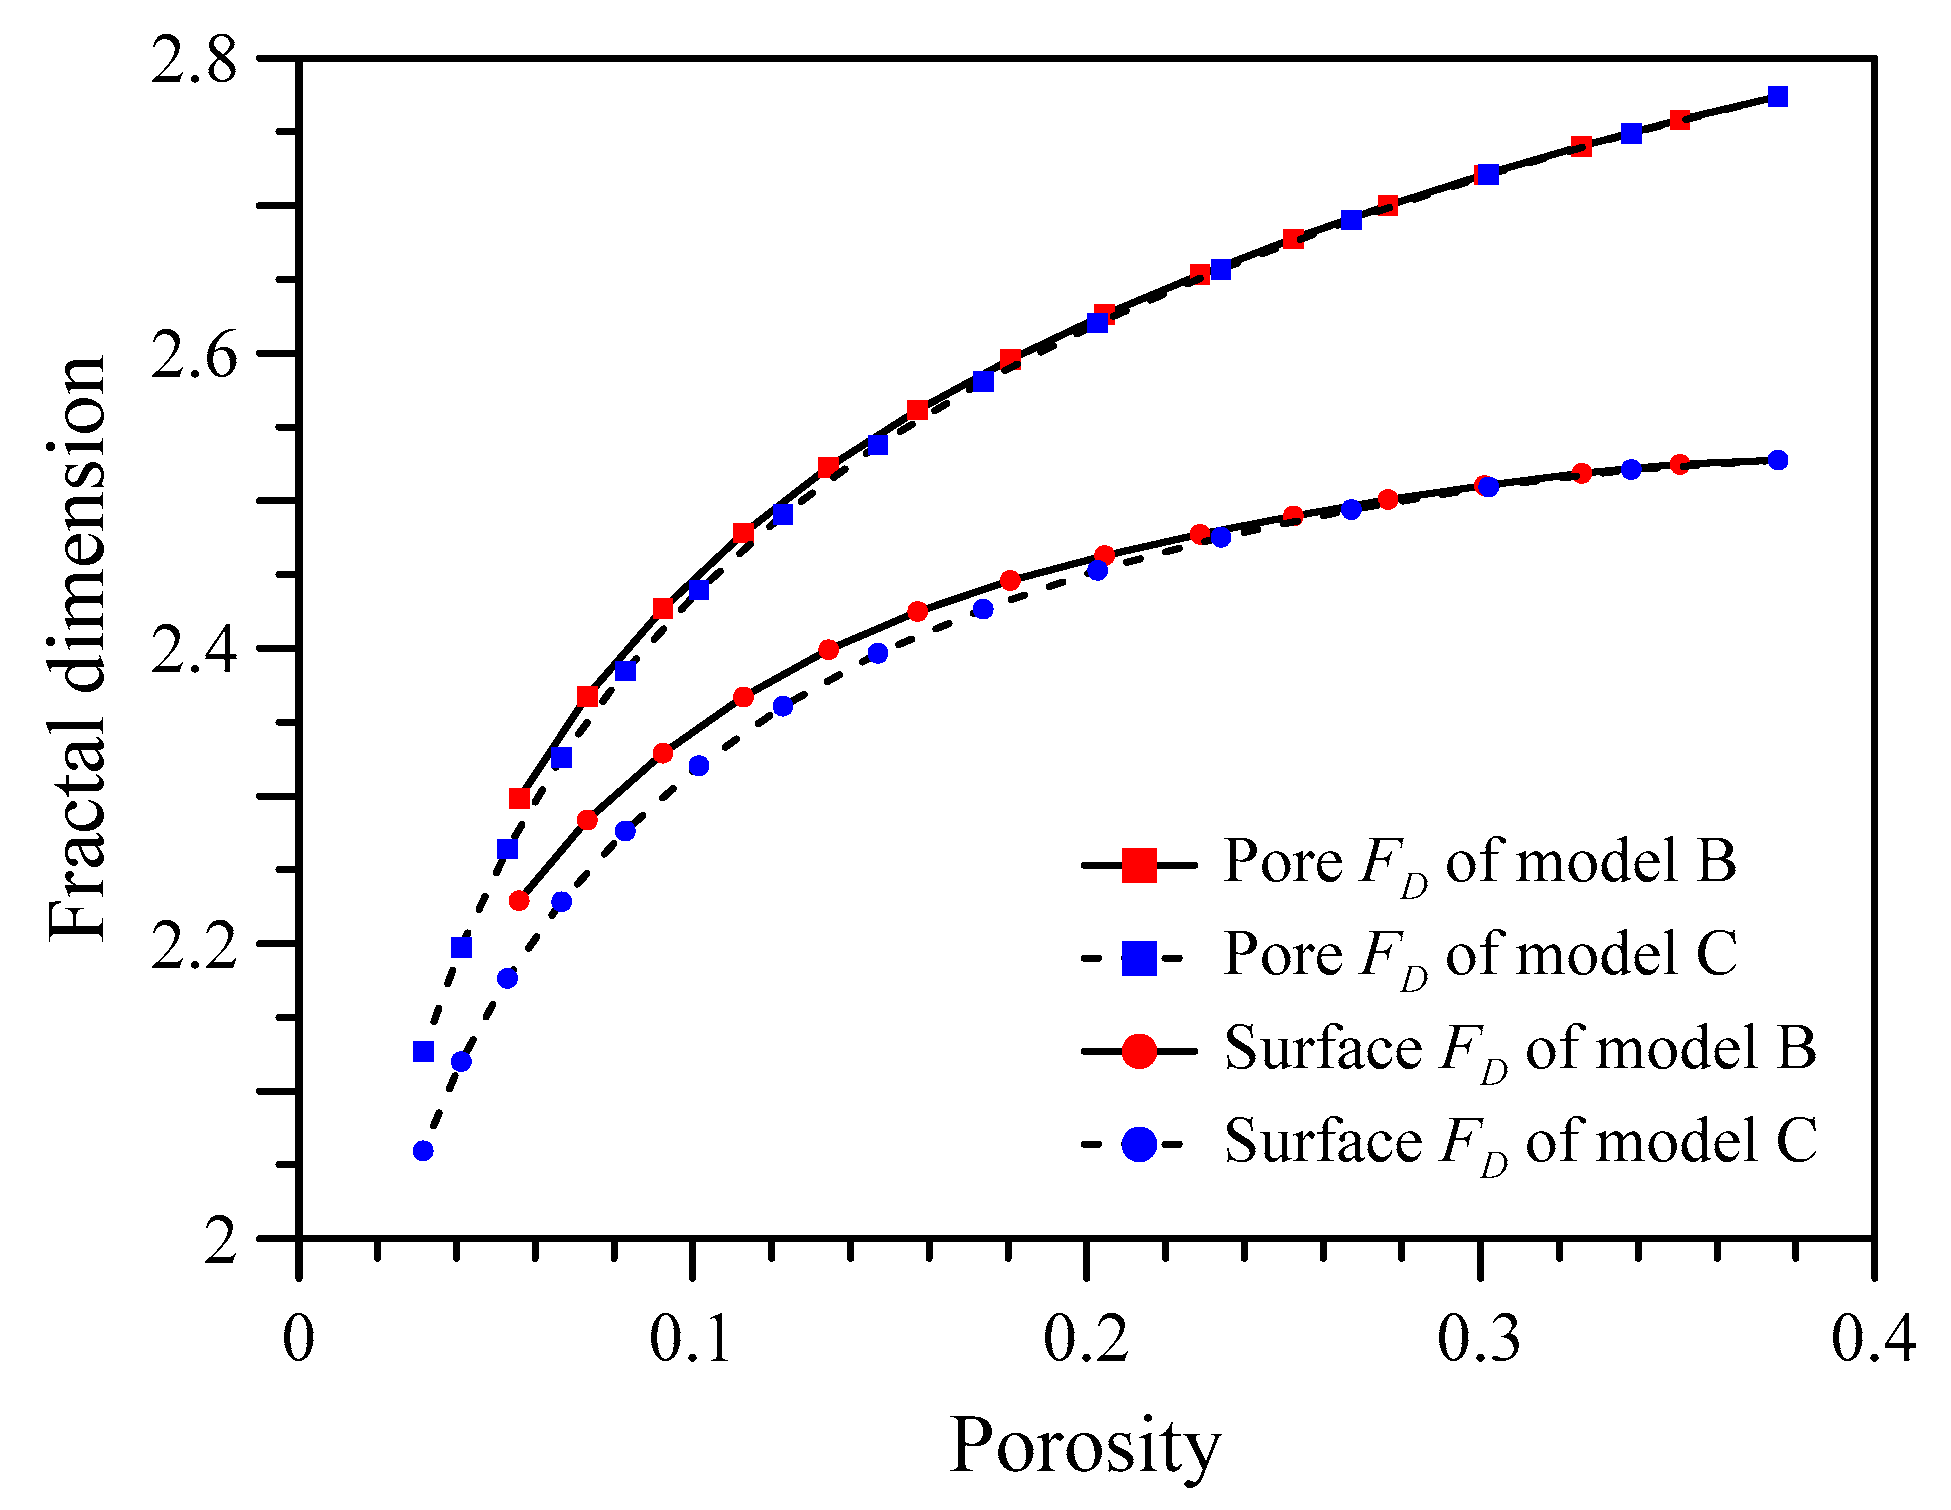
In order to compare the difference in fractal dimensions between the compaction model and cementation model, it is necessary to compare the microscopic pore structures of the two models and their influence on the fractal dimension. Figure 10 shows the comparison of the fractal dimensions of the two models, in which the fractal dimension data of compaction and cementation models are shown with a red solid line and a blue dotted line, respectively.
The modeling process and pore structure characteristics of the compaction and cementation models have been detailed previously. After compaction, the complexity of a single particle remains unchanged, which is because the size of each particle does not change, so there is no change in the surface morphology of the particle. However, with the increase in the cementation factor, the diameter of each grain grows gradually, and the surface curvature has a slight decline gradually, which results in a decrease in single-grain complexity in the cementation model. The blue dotted line is always below the red solid line regardless of pore or surface fractal dimension (Figure 10), indicating that the fractal dimensions of the cementation model are smaller than those of the compaction model when their porosity is the same. These minute differences between the two models are vividly illustrated through the comparison of fractal dimensions. Moreover, the difference in fractal dimensions between the two models has a growing trend with a continuous decrease in porosity. The comparison of these fractal dimensions adequately reflects the difference in microscopic pore structure between the two models, and it is proved again that the fractal dimension is a practical tool for characterizing the pore structure difference of digital porous media.
5. Conclusions
The process-based models with different pore structures were employed as the basis of fractal analysis. The box-counting algorithm was utilized to perform the calculation of the skeleton, pore, and surface fractal dimensions of digital cores. The fractal characteristics were analyzed, and the quantitative relationships between fractal dimensions and pore structures were discussed. The following conclusions can be derived:
- The surface fractal dimension is a useful parameter for characterizing and distinguishing the pore structure differences of the sedimentation model that has a slight change in porosity.
- The pore and surface fractal dimensions have significant responses, which proves that both pore and surface fractal dimensions can be utilized to characterize different pore structures in compaction and cementation models.
- The relations of porosity versus fractal dimension can be well fitted by the combination of linear and logarithmic equations in the compaction model and cementation model. In addition, the pore and surface fractal dimensions decrease more and more rapidly with the decrease in porosity.
- When the porosity is the same, the fractal dimension of the cementation model is smaller than that of the compaction model. The comparison of fractal dimensions reflects the difference in microscopic pore structures, indicating that the box-counting fractal dimension is an effective parameter for characterizing the pore structures of digital rocks.
Author Contributions
Conceptualization, X.L.; Methodology, J.C.; Resources, L.W.; Software, X.L.; Visualization, W.W. and L.W.; Writing–original draft, X.L. and W.W.; Writing–review & editing, J.C. All authors have read and agreed to the published version of the manuscript.
Funding
This research was funded by the National Natural Science Foundation of China (grant Nos. 42004086, 42172159).
Data Availability Statement
The modeling code and data associated with this research are available and can be obtained by contacting the corresponding author.
Conflicts of Interest
The authors declare no conflict of interest.
References
- Miller, K.; Vanorio, T.; Keehm, Y. Evolution of permeability and microstructure of tight carbonates due to numerical simulation of calcite dissolution. J. Geophys. Res. Solid Earth 2017, 122, 4460–4474. [Google Scholar] [CrossRef]
- Zhao, P.Q.; Wang, Z.L.; Sun, Z.C.; Cai, J.C.; Wang, L. Investigation on the pore structure and multifractal characteristics of tight oil reservoirs using NMR measurements: Permian Lucaogou Formation in Jimusaer Sag, Junggar Basin. Mar. Pet. Geol. 2017, 86, 1067–1081. [Google Scholar] [CrossRef]
- Andhumoudine, A.B.; Nie, X.; Zhou, Q.; Yu, J.; Kane, O.I.; Jin, L.; Djaroun, R.R. Investigation of coal elastic properties based on digital core technology and finite element method. Adv. Geo-Energy Res. 2021, 5, 53–63. [Google Scholar] [CrossRef]
- Zhu, L.Q.; Ma, Y.S.; Cai, J.C.; Zhang, C.M.; Wu, S.G.; Zhou, X.Q. Key factors of marine shale conductivity in southern China-Part II: The influence of pore system and the development direction of shale gas saturation models. J. Pet. Sci. Eng. 2022, 209, 109516. [Google Scholar] [CrossRef]
- Blunt, M.J.; Bijeljic, B.; Dong, H.; Gharbi, O.; Iglauer, S.; Mostaghimi, P.; Paluszny, A.; Pentland, C. Pore-scale imaging and modelling. Adv. Water Resour. 2013, 51, 197–216. [Google Scholar] [CrossRef] [Green Version]
- Wood, D.A. Techniques used to calculate shale fractal dimensions involve uncertainties and imprecisions that require more careful consideration. Adv. Geo-Energy Res. 2021, 5, 153–165. [Google Scholar] [CrossRef]
- Cai, J.C.; Lin, D.L.; Singh, H.; Wei, W.; Zhou, S.W. Shale gas transport model in 3D fractal porous media with variable pore sizes. Mar. Pet. Geol. 2018, 98, 437–447. [Google Scholar] [CrossRef]
- Xia, Y.X.; Cai, J.C.; Perfect, E.; Wei, W.; Zhang, Q.; Meng, Q.B. Fractal dimension, lacunarity and succolarity analyses on CT images of reservoir rocks for permeability prediction. J. Hydrol. 2019, 579, 124198. [Google Scholar] [CrossRef]
- Karimpouli, S.; Tahmasebi, P. Conditional reconstruction: An alternative strategy in digital rock physics. Geophysics 2016, 81, D465–D477. [Google Scholar] [CrossRef]
- Liu, C.; Zhang, L.; Li, Y.; Liu, F.; Martyushev, D.A.; Yang, Y. Effects of microfractures on permeability in carbonate rocks based on digital core technology. Adv. Geo-Energy Res. 2022, 6, 86–90. [Google Scholar] [CrossRef]
- Thovert, J.F.; Adler, P.M. Grain reconstruction of porous media: Application to a Bentheim sandstone. Phys. Rev. E 2011, 83, 056116. [Google Scholar] [CrossRef] [PubMed]
- Lin, W.; Li, X.Z.; Yang, Z.M.; Wang, J.; Xiong, S.C.; Luo, Y.T.; Wu, G.M. Construction of dual pore 3-D digital cores with a hybrid method combined with physical experiment method and numerical reconstruction method. Transp. Porous Media 2017, 120, 227–238. [Google Scholar] [CrossRef]
- Arns, C.H.; Knackstedt, M.A.; Pinczewski, W.V.; Garboczi, E.J. Computation of linear elastic properties from microtomographic images: Methodology and agreement between theory and experiment. Geophysics 2002, 67, 1396–1405. [Google Scholar] [CrossRef]
- Fredrich, J.T.; Menendez, B.; Wong, T.F. Imaging the pore structure of geomaterials. Science 1995, 268, 276–279. [Google Scholar] [CrossRef] [PubMed]
- Vogel, H.J.; Roth, K. Quantitative morphology and network representation of soil pore structure. Adv. Water Resour. 2001, 24, 233–242. [Google Scholar] [CrossRef]
- Hazlett, R.D. Statistical characterization and stochastic modeling of pore networks in relation to fluid flow. Math. Geol. 1997, 29, 801–822. [Google Scholar] [CrossRef]
- Keehm, Y.; Mukerji, T.; Nur, A. Permeability prediction from thin sections: 3D reconstruction and Lattice-Boltzmann flow simulation. Geophys. Res. Lett. 2004, 31, L04606. [Google Scholar] [CrossRef]
- Okabe, H.; Blunt, M.J. Prediction of permeability for porous media reconstructed using multiple-point statistics. Phys. Rev. E 2004, 70, 066135. [Google Scholar] [CrossRef] [Green Version]
- Wu, K.J.; Nunan, N.; Crawford, J.W.; Young, I.M.; Ritz, K. An efficient Markov chain model for the simulation of heterogeneous soil structure. Soil Sci. So. Am. J. 2004, 68, 346–351. [Google Scholar] [CrossRef]
- Bakke, S.; Øren, P.E. 3-D pore-scale modelling of sandstones and flow simulations in the pore networks. SPE J. 1997, 2, 136–149. [Google Scholar] [CrossRef]
- Biswal, B.; Manwart, C.; Hilfer, R.; Bakke, S.; Øren, P.E. Quantitative analysis of experimental and synthetic microstructures for sedimentary rock. Phys. A 1999, 273, 452–475. [Google Scholar] [CrossRef] [Green Version]
- Jin, G.; Patzek, T.W.; Silin, D.B. Physics-based reconstruction of sedimentary rocks. In Proceedings of the SPE Western Regional/AAPG Pacific Section Joint Meeting, Long Beach, CA, USA, 19–24 May 2003; Society of Petroleum Engineers: Long Beach, CA, USA, 2003. [Google Scholar]
- Zhu, W.; Yu, W.H.; Chen, Y. Digital core modeling from irregular grains. J. Appl. Geophys. 2012, 85, 37–42. [Google Scholar] [CrossRef]
- Li, X.B.; Luo, M.; Liu, J.P. Fractal characteristics based on different statistical objects of process-based digital rock models. J. Pet. Sci. Eng. 2019, 179, 19–30. [Google Scholar] [CrossRef]
- Liu, X.F.; Sun, J.M.; Wang, H.T. Numerical simulation of rock electrical properties based on digital cores. Appl. Geophys. 2009, 6, 1–7. [Google Scholar] [CrossRef]
- Yao, J.; Wang, C.C.; Yang, Y.F.; Hu, R.R.; Wang, X. The construction of carbonate digital rock with hybrid superposition method. J. Pet. Sci. Eng. 2013, 110, 263–267. [Google Scholar] [CrossRef]
- Bryant, S.; Blunt, M. Prediction of relative permeability in simple porous media. Phys. Rev. A 1992, 46, 2004–2011. [Google Scholar] [CrossRef]
- Øren, P.E.; Bakke, S. Process based reconstruction of sandstones and prediction of transport properties. Transp. Porous Media 2002, 46, 311–343. [Google Scholar] [CrossRef]
- Radlinski, A.P.; Ioannidis, M.A.; Hinde, A.L.; Hainbuchner, M.; Baron, M.; Rauch, H.; Kline, S.R. Angstrom-to-millimeter characterization of sedimentary rock microstructure. J. Colloid Interf. Sci. 2004, 274, 607–612. [Google Scholar] [CrossRef]
- Mandelbrot, B.B. Les Objets Fractals: Forme, Hasard Et Dimension; Flammarion: Paris, France, 1975. [Google Scholar]
- Hansen, J.P.; Skjeltorp, A.T. Fractal pore space and rock permeability implications. Phys. Rev. B 1988, 38, 2635–2638. [Google Scholar] [CrossRef]
- Roy, A.; Perfect, E.; Dunne, W.M.; McKay, L.D. Fractal characterization of fracture networks: An improved box-counting technique. J. Geophys. Res. Solid Earth 2007, 112, B12201. [Google Scholar] [CrossRef]
- Wu, Z.H.; Zuo, Y.J.; Wang, S.Y.; Yi, T.S.; Chen, S.J.; Yu, Q.L.; Li, W.; Sunwen, J.B.; Xu, Y.F.; Wang, R.Y.; et al. Numerical simulation and fractal analysis of mesoscopic scale failure in shale using digital images. J. Pet. Sci. Eng. 2016, 145, 592–599. [Google Scholar] [CrossRef]
- Anovitz, L.M.; Cole, D.R.; Rother, G.; Allard, L.F.; Jackson, A.J.; Littrell, K.C. Diagenetic changes in macro- to nano-scale porosity in the St. Peter Sandstone: An (ultra) small angle neutron scattering and backscattered electron imaging analysis. Geochim. Cosmochim. Acta 2013, 102, 280–305. [Google Scholar] [CrossRef]
- Li, P.; Zheng, M.; Bi, H.; Wu, S.T.; Wang, X.R. Pore throat structure and fractal characteristics of tight oil sandstone: A case study in the Ordos Basin, China. J. Pet. Sci. Eng. 2017, 149, 665–674. [Google Scholar] [CrossRef]
- Krohn, C.E. Fractal measurements of sandstones, shales, and carbonates. J. Geophys. Res.: Solid Earth 1988, 93, 3297–3305. [Google Scholar] [CrossRef]
- Vega, S.; Jouini, M.S. 2D multifractal analysis and porosity scaling estimation in Lower Cretaceous carbonates. Geophysics 2015, 80, D575–D586. [Google Scholar] [CrossRef]
- Liu, K.Q.; Ostadhassan, M. Multi-scale fractal analysis of pores in shale rocks. J. Appl. Geophys. 2017, 140, 1–10. [Google Scholar] [CrossRef]
- Tao, G.L.; Zhang, J.R. Two categories of fractal models of rock and soil expressing volume and size-distribution of pores and grains. Chin. Sci. Bull. 2009, 54, 4458–4467. [Google Scholar] [CrossRef] [Green Version]
- Zhang, J.R.; Tao, G.L.; Huang, L.; Yuan, L. Porosity models for determining the pore-size distribution of rocks and soils and their applications. Chin. Sci. Bull. 2010, 55, 3960–3970. [Google Scholar] [CrossRef]
- Dathe, A.; Thullner, M. The relationship between fractal properties of solid matrix and pore space in porous media. Geoderma 2005, 129, 279–290. [Google Scholar] [CrossRef]
- Yu, B.M.; Cai, J.C.; Zou, M.Q. On the physical properties of apparent two-phase fractal porous media. Vadose Zone J. 2009, 8, 177–186. [Google Scholar] [CrossRef]
- Chen, X.J.; Yao, G.Q.; Cai, J.C.; Huang, Y.T.; Yuan, X.Q. Fractal and multifractal analysis of different hydraulic flow units based on micro-CT images. J. Nat. Gas Sci. Eng. 2017, 48, 145–156. [Google Scholar] [CrossRef]
- Liu, P.; Ju, Y.; Gao, F.; Ranjith, P.G.; Zhang, Q.B. CT identification and fractal characterization of 3-D propagation and distribution of hydrofracturing cracks in low-permeability heterogeneous rocks. J. Geophys. Res.: Solid Earth 2018, 123, 2156–2173. [Google Scholar] [CrossRef]
- Su, P.H.; Xia, Z.H.; Wang, P.; Ding, W.; Hu, Y.P.; Zhang, W.Q.; Peng, Y.J. Fractal and multifractal analysis of pore size distribution in low permeability reservoirs based on mercury intrusion porosimetry. Energies 2019, 12, 1337. [Google Scholar] [CrossRef] [Green Version]
- Cai, J.C.; Xia, Y.X.; Lu, C.; Bian, H.; Zou, S.M. Creeping microstructure and fractal permeability model of natural gas hydrate reservoir. Mar. Pet. Geol. 2020, 115, 104282. [Google Scholar] [CrossRef]
- Dou, W.C.; Liu, L.F.; Jia, L.B.; Xu, Z.J.; Wang, M.Y.; Du, C.J. Pore structure, fractal characteristics and permeability prediction of tight sandstones: A case study from Yanchang Formation, Ordos Basin, China. Mar. Pet. Geol. 2021, 123, 104737. [Google Scholar] [CrossRef]
- Li, X.B.; Wei, W.; Wang, L.; Ding, P.B.; Zhu, L.Q.; Cai, J.C. A new method for evaluating the pore structure complexity of digital rocks based on the relative value of fractal dimension. Mar. Pet. Geol. 2022, 141, 105694. [Google Scholar] [CrossRef]
- Rahner, M.S.; Halisch, M.; Fernandes, C.P.; Weller, A.; dos Santos, V.S.S. Fractal dimensions of pore spaces in unconventional reservoir rocks using X-ray nano- and micro-computed tomography. J. Nat. Gas Sci. Eng. 2018, 55, 298–311. [Google Scholar] [CrossRef]
- Lopes, R.; Betrouni, N. Fractal and multifractal analysis: A review. Med. Image Anal. 2009, 13, 634–649. [Google Scholar] [CrossRef]
- Bird, N.; Diaz, M.C.; Saa, A.; Tarquis, A.M. Fractal and multifractal analysis of pore-scale images of soil. J. Hydrol. 2006, 322, 211–219. [Google Scholar] [CrossRef]
- Tang, H.P.; Wang, J.Z.; Zhu, J.L.; Ao, Q.B.; Wang, J.Y.; Yang, B.J.; Li, Y.N. Fractal dimension of pore-structure of porous metal materials made by stainless steel powder. Powder Technol. 2012, 217, 383–387. [Google Scholar] [CrossRef]
- Lee, B.H.; Lee, S.K. Effects of specific surface area and porosity on cube counting fractal dimension, lacunarity, configurational entropy, and permeability of model porous networks: Random packing simulations and NMR micro-imaging study. J. Hydrol. 2013, 496, 122–141. [Google Scholar] [CrossRef]
- Dathe, A.; Eins, S.; Niemeyer, J.; Gerold, G. The surface fractal dimension of the soil-pore interface as measured by image analysis. Geoderma 2001, 103, 203–229. [Google Scholar] [CrossRef]
- Peng, R.D.; Yang, Y.C.; Ju, Y.; Mao, L.T.; Yang, Y.M. Computation of fractal dimension of rock pores based on gray CT images. Chin. Sci. Bull. 2011, 56, 3346–3357. [Google Scholar] [CrossRef] [Green Version]
- Wang, H.M.; Liu, Y.; Song, Y.C.; Zhao, Y.C.; Zhao, J.F.; Wang, D.Y. Fractal analysis and its impact factors on pore structure of artificial cores based on the images obtained using magnetic resonance imaging. J. Appl. Geophys. 2012, 86, 70–81. [Google Scholar] [CrossRef]
- Perfect, E.; Donnelly, B. Bi-phase box counting an improved method for fractal analysis of binary images. Fractals 2015, 23, 1540010. [Google Scholar] [CrossRef] [Green Version]
- Luo, M.; Glover, P.W.J.; Zhao, P.Q.; Li, D. 3D digital rock modeling of the fractal properties of pore structures. Mar. Pet. Geol. 2020, 122, 104706. [Google Scholar] [CrossRef]
- Roberts, J.N.; Schwartz, L.M. Grain consolidation and electrical conductivity in porous media. Phys. Rev. B 1985, 31, 5990–5997. [Google Scholar] [CrossRef]
- Pentland, A.P. Fractal-based description of natural scenes. IEEE Trans. Pattern Anal. Mach. Intell. 1984, 6, 661–674. [Google Scholar] [CrossRef]
- Peitgen, H.O.; Jürgens, H.; Saupe, D.; Feigenbaum, M.J. Chaos And Fractals: New Frontiers of Science; Springer: New York, NY, USA, 1992. [Google Scholar]
- Li, J.; Du, Q.; Sun, C.X. An improved box-counting method for image fractal dimension estimation. Pattern Recogn. 2009, 42, 2460–2469. [Google Scholar] [CrossRef]
- So, G.B.; So, H.R.; Jin, G.G. Enhancement of the box-counting algorithm for fractal dimension estimation. Pattern Recogn. Lett. 2017, 98, 53–58. [Google Scholar] [CrossRef]
- Foroutan-pour, K.; Dutilleul, P.; Smith, D.L. Advances in the implementation of the box-counting method of fractal dimension estimation. Appl. Math. Comput. 1999, 105, 195–210. [Google Scholar] [CrossRef]
Figure 1.
Three basic procedures for constructing 3D process-based model. (a–d) Sedimentation process; (a) Grain size distribution; (b) A new grain; (c) Find stable position; (d) Sedimentation model; (e) Binarization; (f) Compaction process; (g) Cementation process.
Figure 1.
Three basic procedures for constructing 3D process-based model. (a–d) Sedimentation process; (a) Grain size distribution; (b) A new grain; (c) Find stable position; (d) Sedimentation model; (e) Binarization; (f) Compaction process; (g) Cementation process.
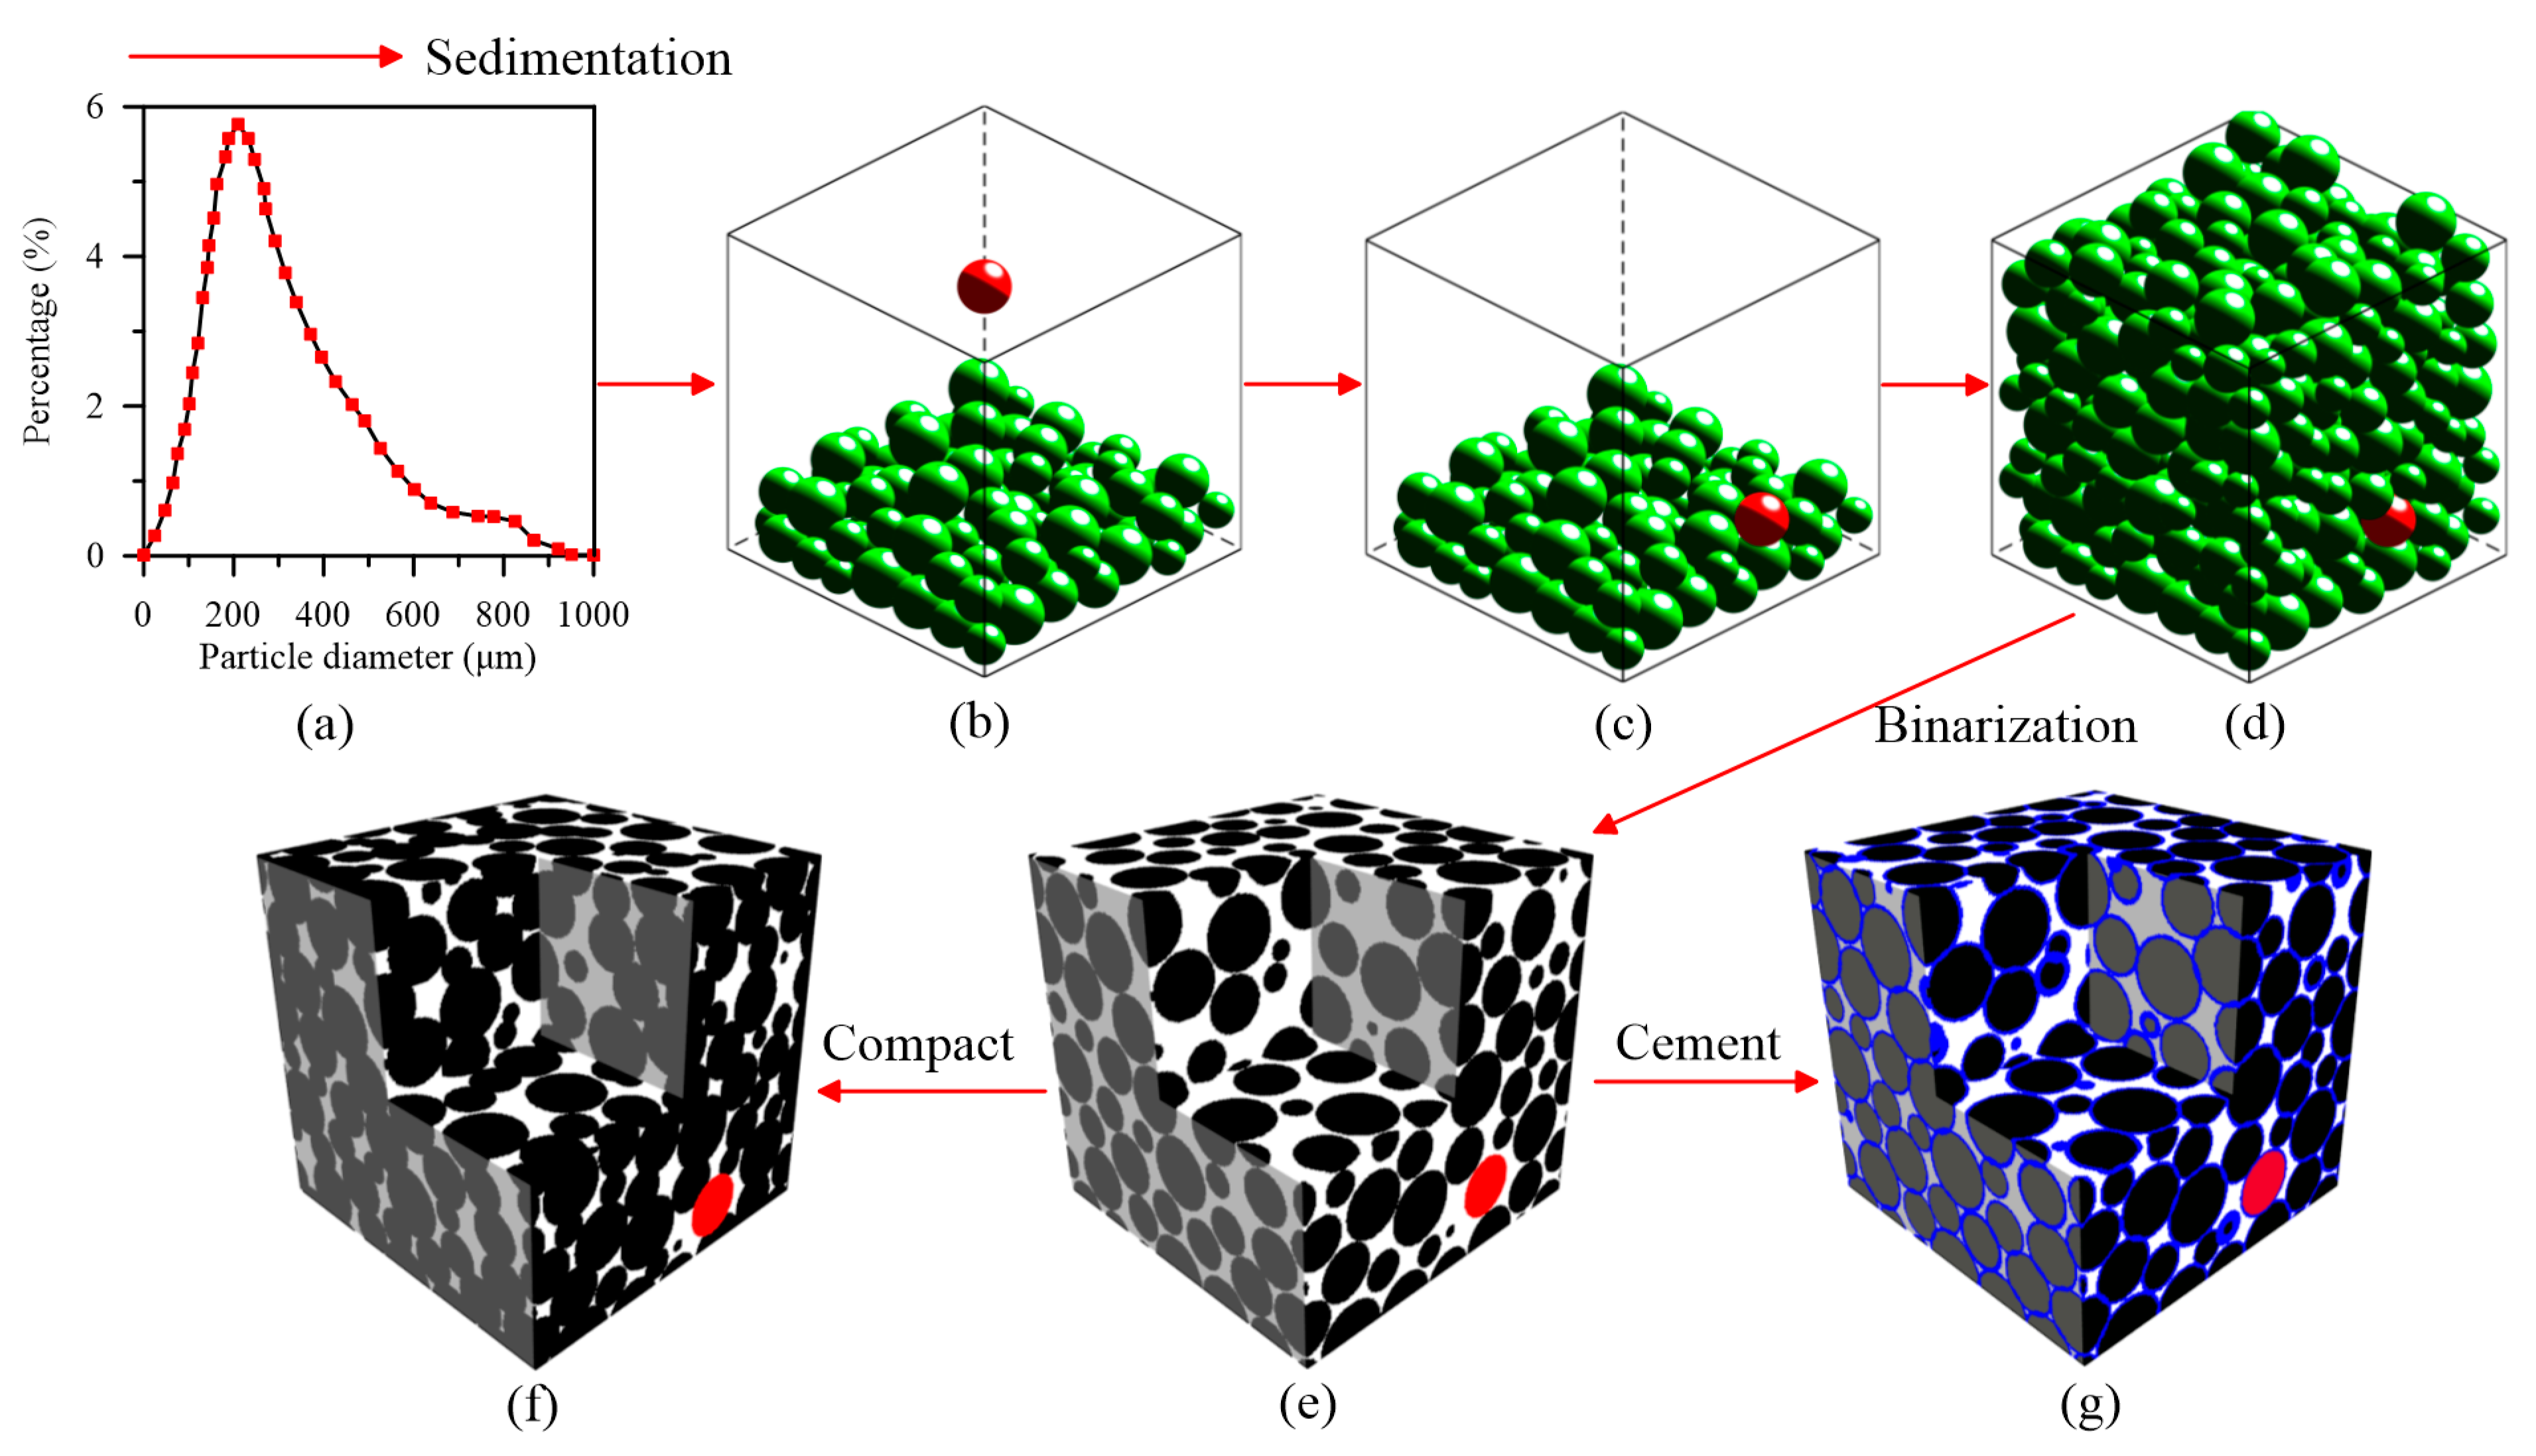
Figure 2.
The calculation process of different fractal phases in digital 3D core. (a) Digital core model; The phases of interest are (b-1) skeleton, (b-2) pore, and (b-3) surface; The calculated results correspond to (c-1) skeleton fractal dimension, (c-2) pore fractal dimension, and (c-3) surface fractal dimension.

Figure 3.
Digital 3D images and porosity evolution of sedimentation model. (a-1,a-2,a-3) are A1, A5, and A8 sub-models, respectively; (b-1,b-2,b-3) are digital representations of corresponding sub-models; (c) Porosity evolution.
Figure 3.
Digital 3D images and porosity evolution of sedimentation model. (a-1,a-2,a-3) are A1, A5, and A8 sub-models, respectively; (b-1,b-2,b-3) are digital representations of corresponding sub-models; (c) Porosity evolution.

Figure 4.
Digital 3D images and porosity evolution of compaction model. (a–c) are B1, B8, and B15 sub-models, respectively; (d) Porosity evolution.
Figure 4.
Digital 3D images and porosity evolution of compaction model. (a–c) are B1, B8, and B15 sub-models, respectively; (d) Porosity evolution.
Figure 5.
Digital 3D images and porosity evolution of cementation model. (a–c) are C1, C8, and C15 sub-models, respectively; (d) Porosity evolution.
Figure 5.
Digital 3D images and porosity evolution of cementation model. (a–c) are C1, C8, and C15 sub-models, respectively; (d) Porosity evolution.

Figure 6.
Fractal dimension evolution of sedimentation model. (a) Three kinds of fractal phases; (b) Surface fractal dimension and its standard deviation.
Figure 6.
Fractal dimension evolution of sedimentation model. (a) Three kinds of fractal phases; (b) Surface fractal dimension and its standard deviation.

Figure 7.
Fractal dimension evolution of compaction model. (a) Three kinds of fractal phases; (b) Magnification of fractal dimension and standard deviation of some sub-models.
Figure 7.
Fractal dimension evolution of compaction model. (a) Three kinds of fractal phases; (b) Magnification of fractal dimension and standard deviation of some sub-models.
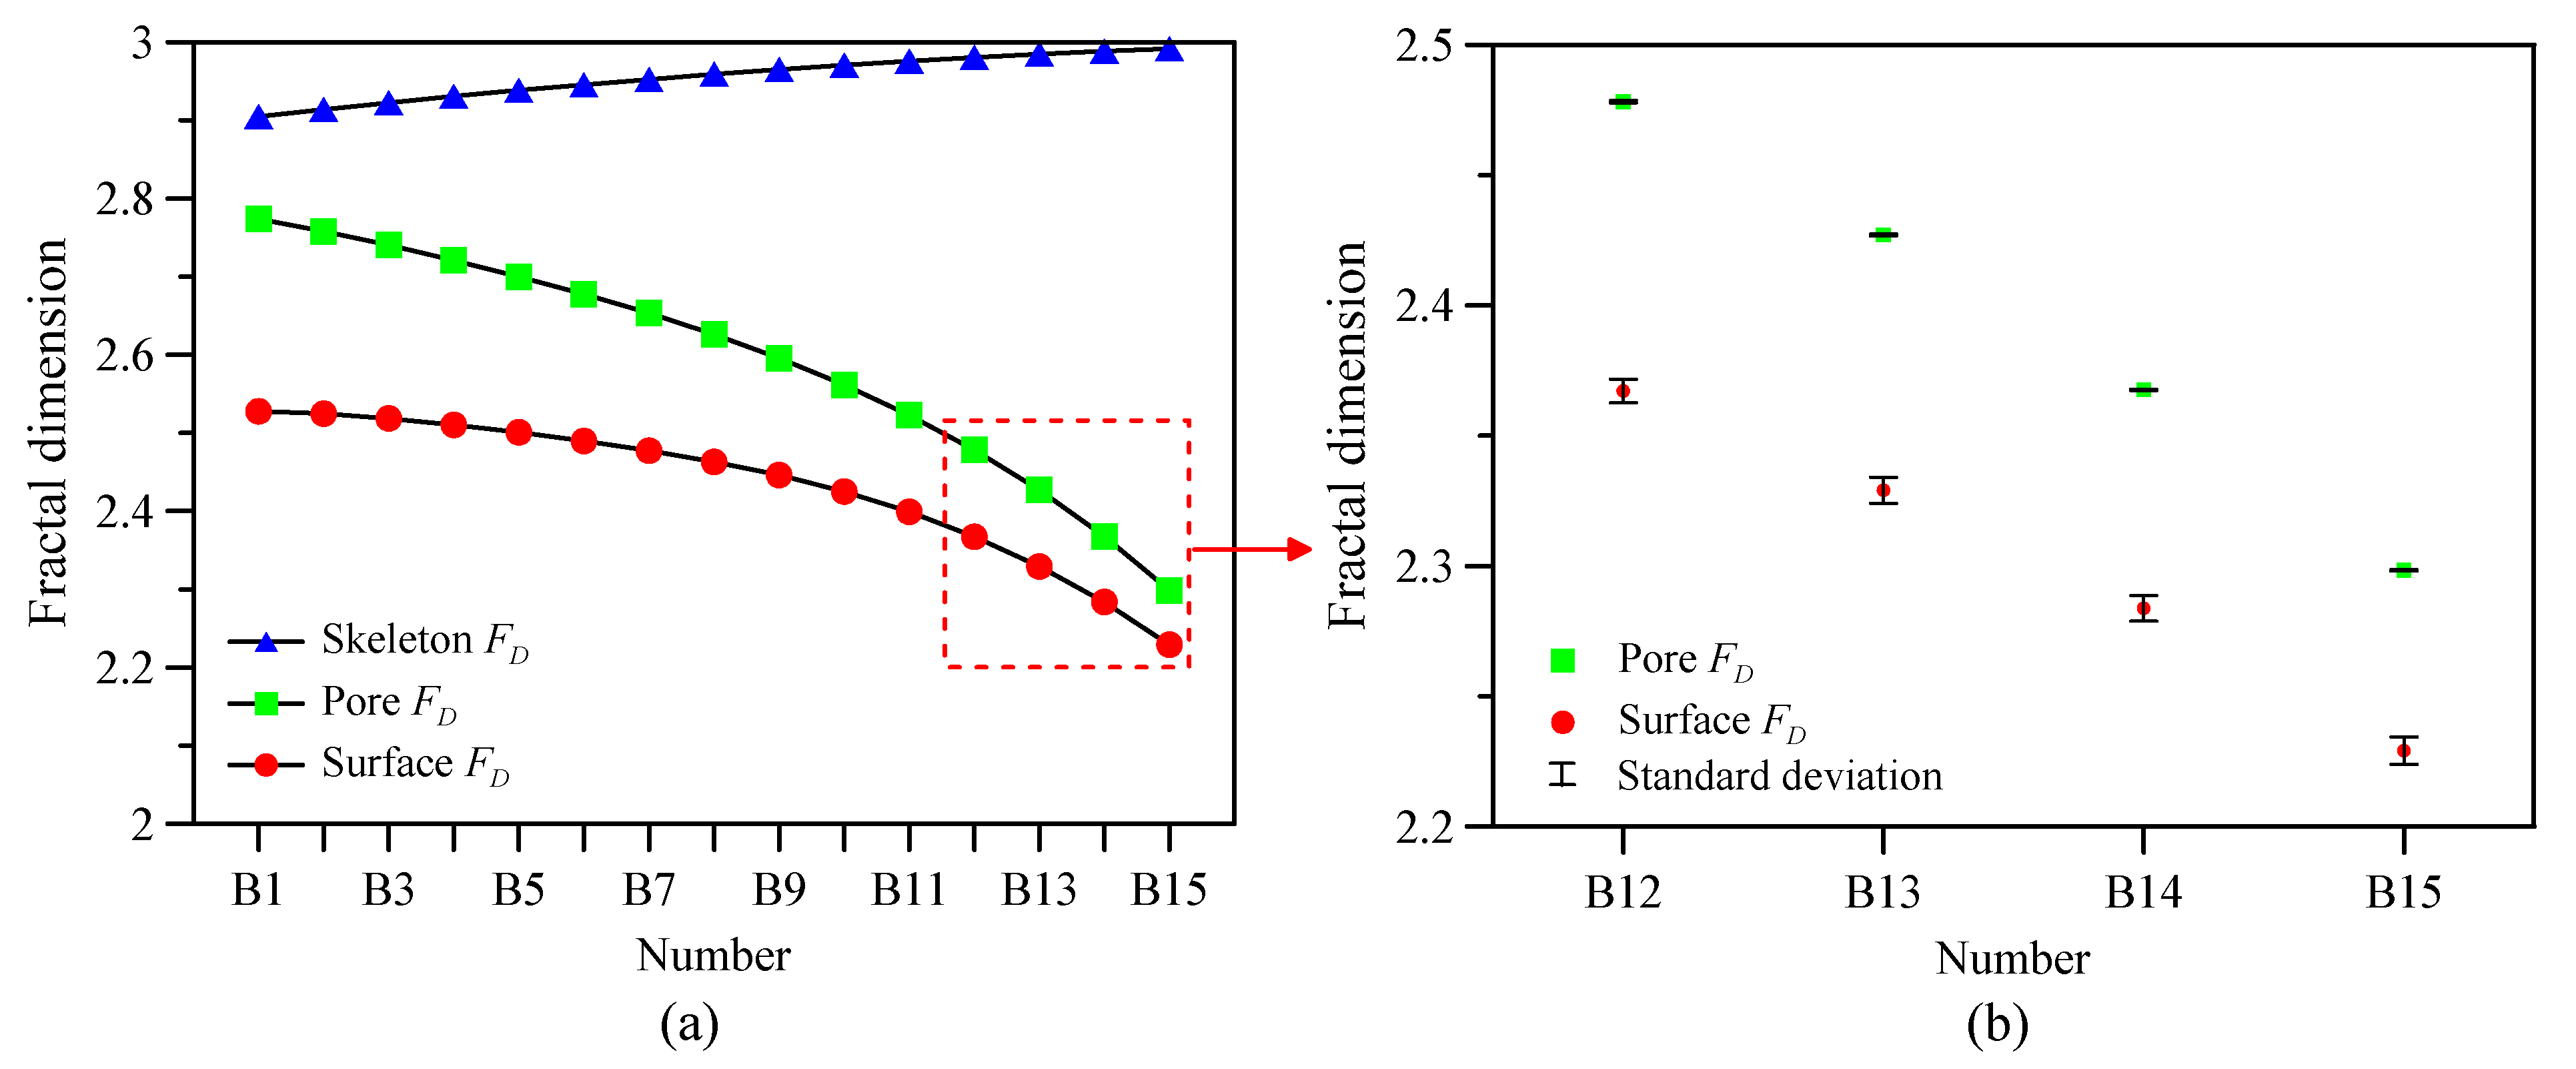
Figure 8.
Fractal dimension evolution of cementation model. (a) Three kinds of fractal phases; (b) Magnification of fractal dimension and standard deviation of some sub-models.
Figure 8.
Fractal dimension evolution of cementation model. (a) Three kinds of fractal phases; (b) Magnification of fractal dimension and standard deviation of some sub-models.
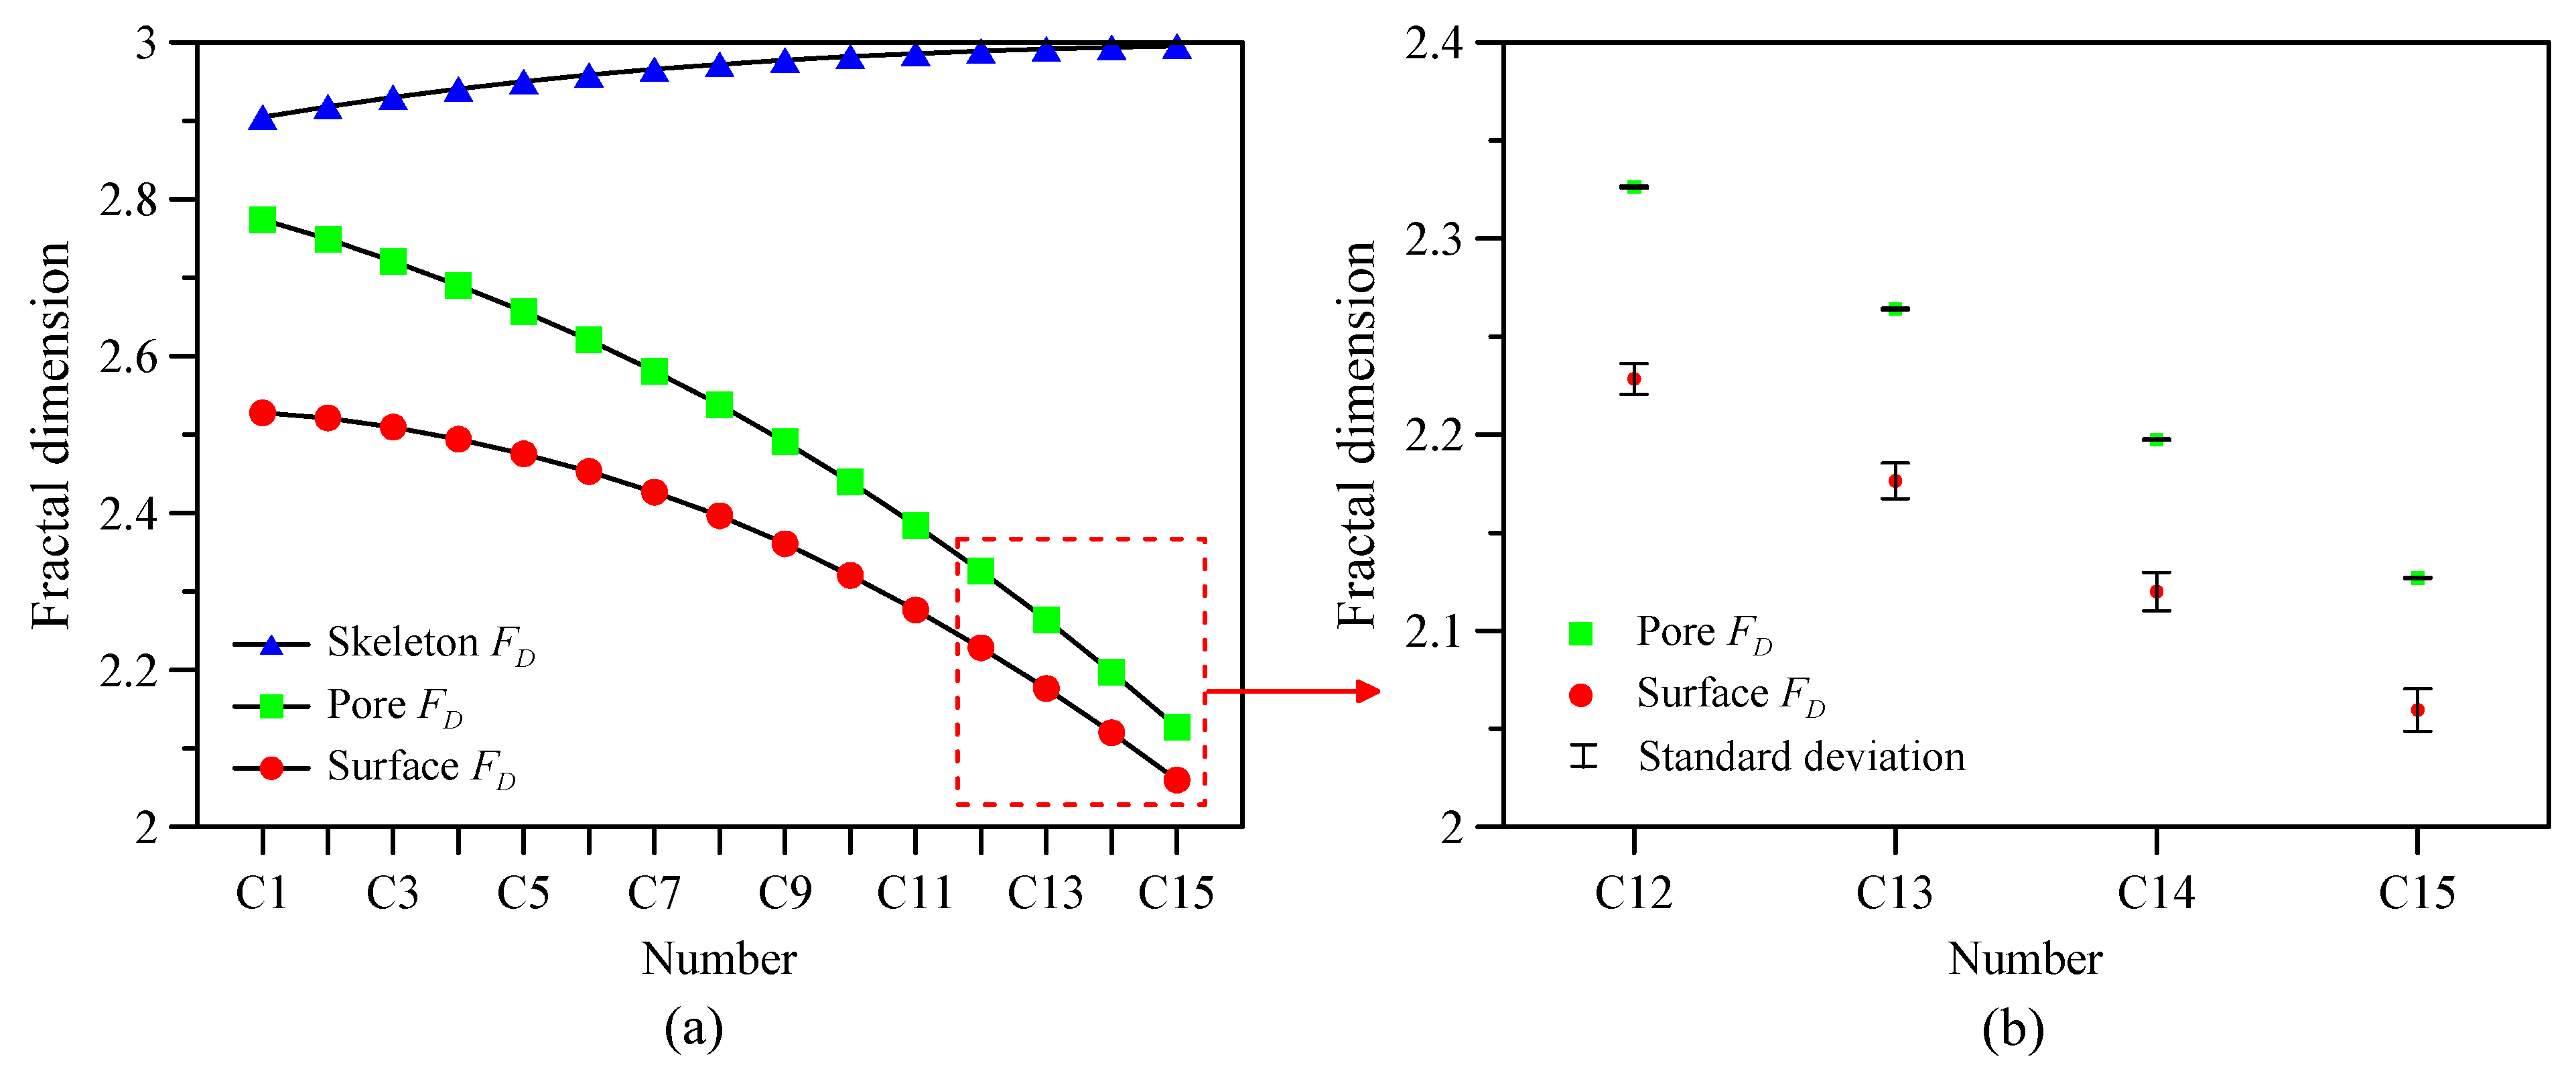
Figure 9.
Fitting curves of FD versus ϕn in (a) compaction model and (b) cementation model.
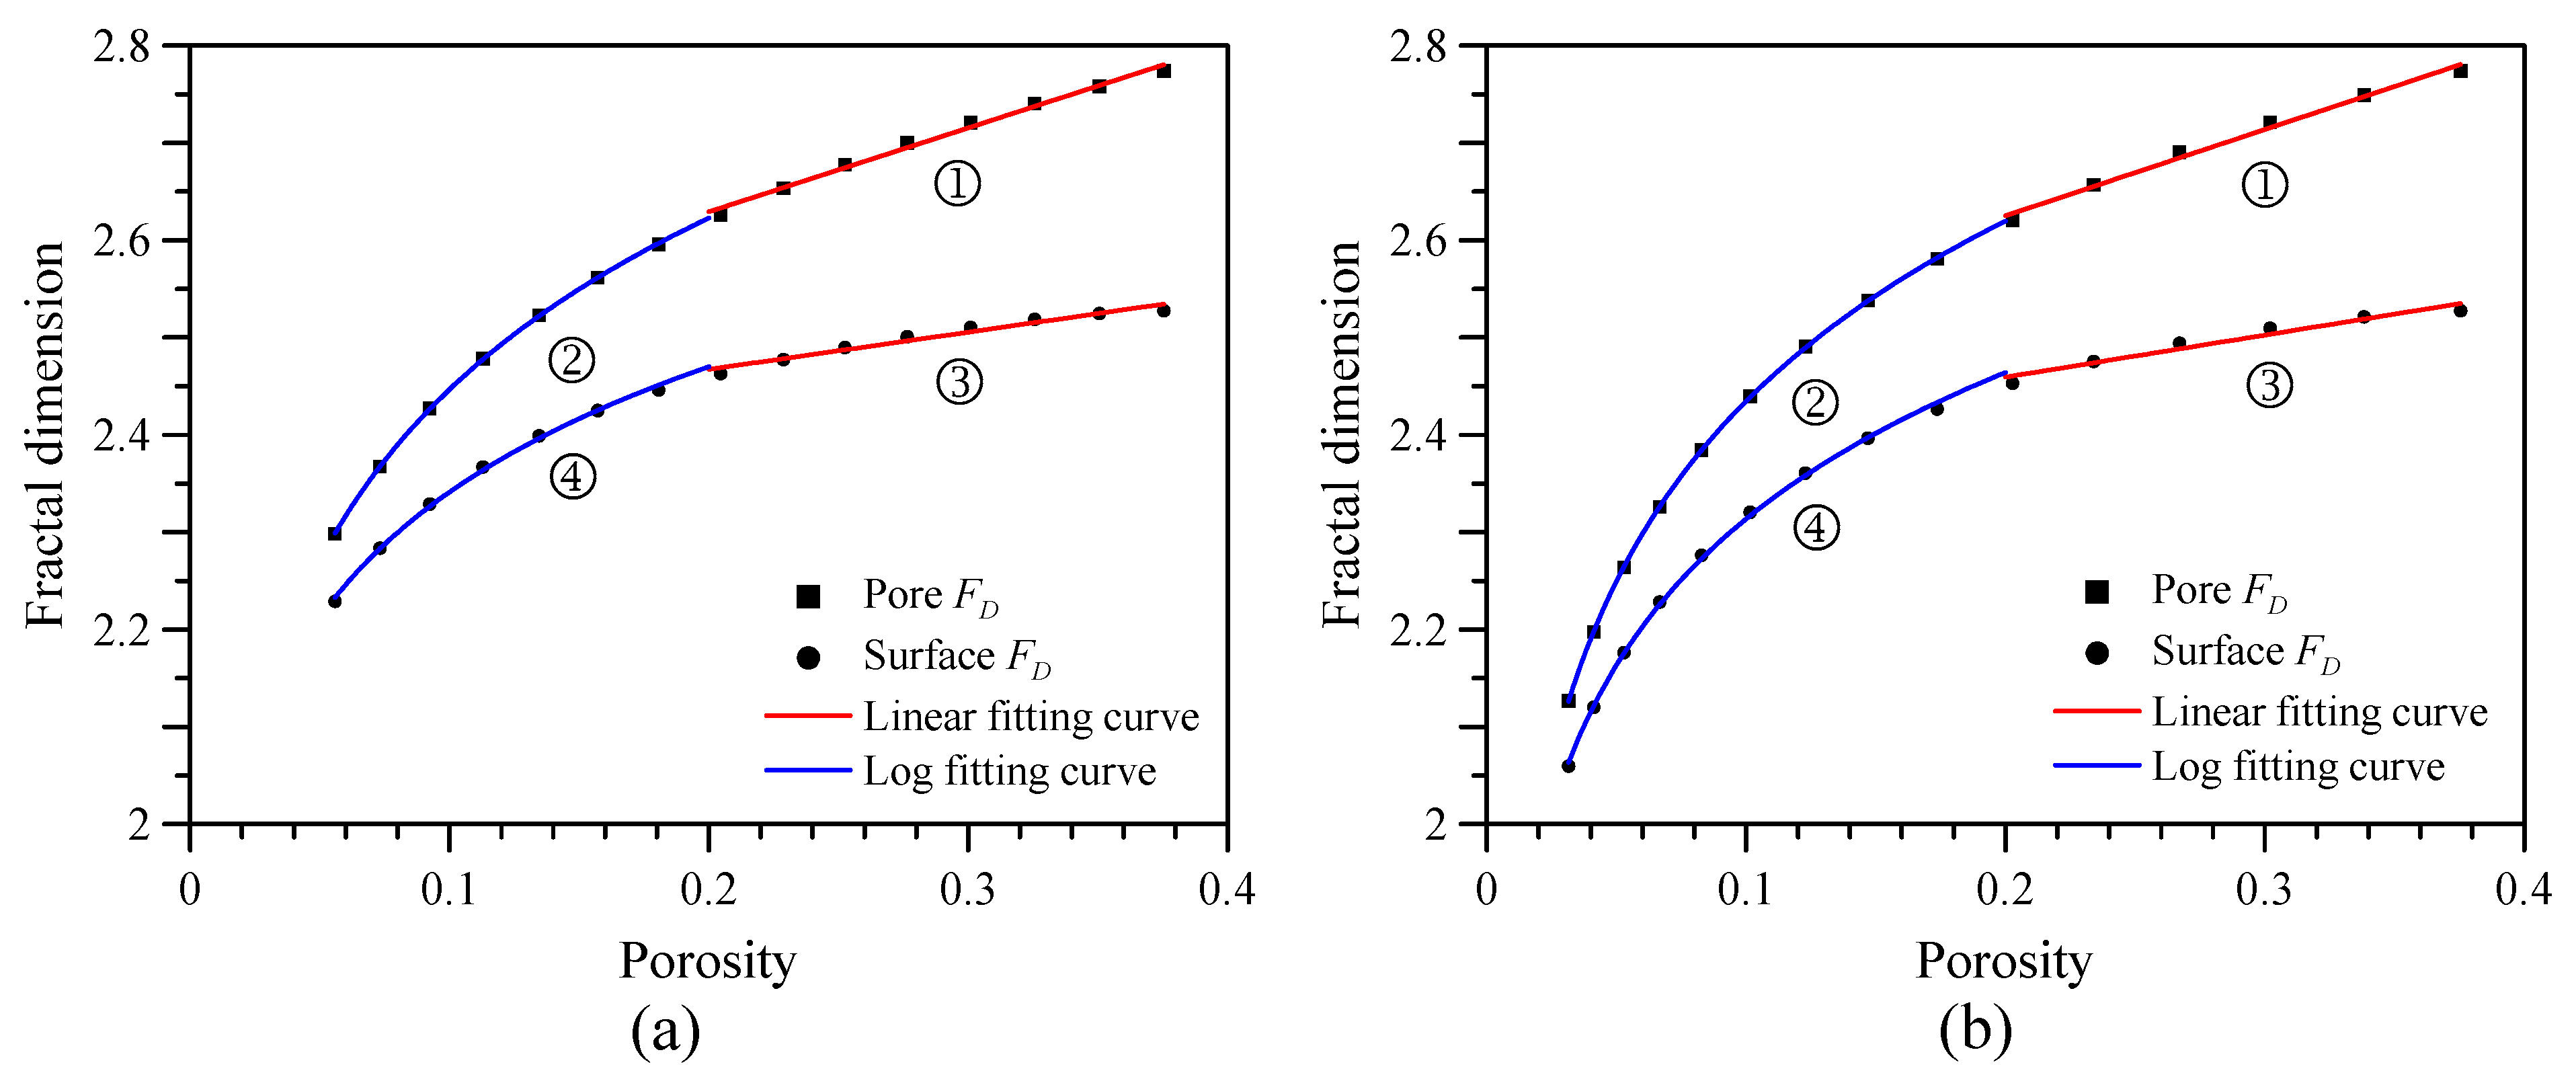
Figure 10.
The comparison of fractal dimensions between compaction model and cementation model.


Table 1.
Research progress on the relationship between box-counting fractal dimension and pore parameters of porous media.
Table 1.
Research progress on the relationship between box-counting fractal dimension and pore parameters of porous media.
| Literature | Time | Material Object | Fractal Dimension | Influence Factor |
|---|---|---|---|---|
| [54] | 2001 | 2D image of soil | Surface | Image size and box size |
| [41] | 2005 | 2D image of porous structure | Matrix and pore | Mass fraction of matrix and pore |
| [42] | 2009 | 2D image of porous structure | Skeleton and pore | Porosity |
| [55] | 2011 | CT image of rock | Pore | Porosity |
| [56] | 2012 | MRI image of artificial core | Pore | Box size, threshold, resolution, and porosity |
| [53] | 2013 | 3D image of sand packing | Pore | Porosity and specific surface area |
| [57] | 2015 | 2D image of soil | Mass and pore | Mass fraction |
| [37] | 2015 | 2D image of carbonatite | Pore and multifractal | Porosity scaling |
| [24] | 2019 | Process-based model | Solid, pore, and interface | Porosity and complexity of pore structure |
| [58] | 2020 | Process-based model | Pore and interface | Porosity and specific surface area |
Table 2.
The modeling input parameters and porosity results of sedimentation, compaction, and cementation models.
Table 2.
The modeling input parameters and porosity results of sedimentation, compaction, and cementation models.
| Model A (Sedimentation) | Model B (Compaction) | Model C (Cementation) | ||||||
|---|---|---|---|---|---|---|---|---|
| No. | Particle Size (μm) | Porosity | No. | λ | Porosity | No. | β | Porosity |
| A1 | 100 | 0.3778 ± 0.0042 | B1 | 0 | 0.3755 ± 0.0029 | C1 | 0 | 0.3755 ± 0.0029 |
| A2 | 100,90 | 0.3840 ± 0.0044 | B2 | 0.02 | 0.3506 ± 0.0024 | C2 | 0.01 | 0.3382 ± 0.0027 |
| A3 | 100,90,80 | 0.3785 ± 0.0028 | B3 | 0.04 | 0.3257 ± 0.0025 | C3 | 0.02 | 0.3020 ± 0.0028 |
| A4 | 100,…,70 | 0.3780 ± 0.0028 | B4 | 0.06 | 0.3009 ± 0.0024 | C4 | 0.03 | 0.2672 ± 0.0028 |
| A5 | 100,…,60 | 0.3755 ± 0.0029 | B5 | 0.08 | 0.2764 ± 0.0025 | C5 | 0.04 | 0.2341 ± 0.0029 |
| A6 | 100,…,50 | 0.3707 ± 0.0019 | B6 | 0.10 | 0.2524 ± 0.0026 | C6 | 0.05 | 0.2028 ± 0.0029 |
| A7 | 100,…,40 | 0.3680 ± 0.0020 | B7 | 0.12 | 0.2287 ± 0.0027 | C7 | 0.06 | 0.1737 ± 0.0029 |
| A8 | 100,…,30 | 0.3643 ± 0.0032 | B8 | 0.14 | 0.2045 ± 0.0026 | C8 | 0.07 | 0.1470 ± 0.0028 |
| B9 | 0.16 | 0.1806 ± 0.0025 | C9 | 0.08 | 0.1229 ± 0.0027 | |||
| B10 | 0.18 | 0.1571 ± 0.0025 | C10 | 0.09 | 0.1016 ± 0.0026 | |||
| B11 | 0.20 | 0.1345 ± 0.0023 | C11 | 0.10 | 0.0829 ± 0.0024 | |||
| B12 | 0.22 | 0.1129 ± 0.0021 | C12 | 0.11 | 0.0667 ± 0.0023 | |||
| B13 | 0.24 | 0.0924 ± 0.0019 | C13 | 0.12 | 0.0529 ± 0.0021 | |||
| B14 | 0.26 | 0.0732 ± 0.0015 | C14 | 0.13 | 0.0412 ± 0.0017 | |||
| B15 | 0.28 | 0.0559 ± 0.0013 | C15 | 0.14 | 0.0315 ± 0.0014 | |||
Table 3.
Fitting equations of fractal dimensions.
| Model | Fractal Phase | Curve No. | Fitting Formula | R2 |
|---|---|---|---|---|
| Compaction | Pore | ➀ | FD = 0.8617 ϕn + 2.4569 | 0.9917 |
| ➁ | FD = 0.2541 ln(ϕn) + 3.0318 | 0.9999 | ||
| Surface | ➂ | FD = 0.3826 ϕn + 2.3908 | 0.9635 | |
| ➃ | FD = 0.1861 ln(ϕn) + 2.7697 | 0.9982 | ||
| Cementation | Pore | ➀ | FD = 0.8851 ϕn + 2.4483 | 0.9902 |
| ➁ | FD = 0.2671 ln(ϕn) + 3.0498 | 0.9999 | ||
| Surface | ➂ | FD = 0.4313 ϕn + 2.3732 | 0.9538 | |
| ➃ | FD = 0.2169 ln(ϕn) + 2.8132 | 0.9992 |
Publisher’s Note: MDPI stays neutral with regard to jurisdictional claims in published maps and institutional affiliations. |
© 2022 by the authors. Licensee MDPI, Basel, Switzerland. This article is an open access article distributed under the terms and conditions of the Creative Commons Attribution (CC BY) license (https://creativecommons.org/licenses/by/4.0/).
Share and Cite
MDPI and ACS Style
Li, X.; Wei, W.; Wang, L.; Cai, J. Fractal Dimension of Digital 3D Rock Models with Different Pore Structures. Energies 2022, 15, 7461. https://doi.org/10.3390/en15207461
AMA Style
Li X, Wei W, Wang L, Cai J. Fractal Dimension of Digital 3D Rock Models with Different Pore Structures. Energies. 2022; 15(20):7461. https://doi.org/10.3390/en15207461
Chicago/Turabian StyleLi, Xiaobin, Wei Wei, Lei Wang, and Jianchao Cai. 2022. "Fractal Dimension of Digital 3D Rock Models with Different Pore Structures" Energies 15, no. 20: 7461. https://doi.org/10.3390/en15207461
Note that from the first issue of 2016, this journal uses article numbers instead of page numbers. See further details here.