
Characterization of Two-Phase Flow from Pore-Scale Imaging Using Fractal Geometry under Water-Wet and Mixed-Wet Conditions


1
Key Laboratory of Tectonics and Petroleum Resources, China University of Geosciences, Ministry of Education, Wuhan 430074, China
2
Key Laboratory of Theory and Technology of Petroleum Exploration and Development in Hubei Province, Wuhan 430074, China
3
China National Offshore Oil Corporation Limited, Zhanjiang Branch, Zhangjiang 524000, China
*
Author to whom correspondence should be addressed.
Energies 2022, 15(6), 2036; https://doi.org/10.3390/en15062036
Submission received: 7 January 2022
/
Revised: 25 February 2022
/
Accepted: 3 March 2022
/
Published: 10 March 2022
(This article belongs to the Collection Flow and Transport in Porous Media)
Abstract
:High resolution micro-computed tomography images for multiphase flow provide us an effective tool to understand the mechanism of fluid flow in porous media, which is not only fundamental to the understanding of macroscopic measurements but also for providing benchmark datasets to validate pore-scale modeling. In this study, we start from two datasets of pore scale imaging of two-phase flow obtained experimentally under in situ imaging conditions at different water fractional flows under water-wet and mixed-wet conditions. Then, fractal dimension, lacunarity and succolarity are used to quantify the complexity, clustering and flow capacity of water and oil phases. The results show that with the wettability of rock surface altered from water-wet to mixed-wet, the fractal dimension for the water phase increases while for the oil phase, it decreases obviously at low water saturation. Lacunarity largely depends on the degree of wettability alteration. The more uniform wetting surfaces are distributed, the more homogeneous the fluid configuration is, which indicates smaller values for lacunarity. Moreover, succolarity is shown to well characterize the wettability effect on flow capacity. The succolarity of the oil phase in the water-wet case is larger than that in the mixed-wet case while for the water phase, the succolarity value in the water-wet is small compared with that in the mixed-wet, which show a similar trend with relative permeability curves for water-wet and mixed-wet. Our study provides a perspective into the influence that phase geometry has on relative permeability under controlled wettability and the resulting phase fractal changes under different saturations that occur during multiphase flow, which allows a means to understand phase geometric changes that occur during fluid flow.
1. Introduction
Multiphase flow in porous media is of great importance for many scientific and industrial fields, including enhanced oil recovery [1,2], geologic carbon sequestration [3] and groundwater flow in soil [4], etc. Wettability plays an important role in multiphase flow in porous media [5,6] and is the main factor in the control of the fluid location and spatial distribution in porous media [7]. Wettability on multiphase flow has been shown to affect fluid properties, such as saturation and relative permeability [7,8,9,10]. Recent advances in high resolution micro-computed tomography imaging technology combined with laboratory flooding experiments allow for pore-space multiphase images collected from displacement processes under in situ flow conditions and provide useful information on wettability on a pore-by-pore basis [11].
This imaging technology not only provides direct visualization for pore-scale displacement flow but also an alternative means to measure flow properties of capillary pressure and relative permeability in complex porous systems [12,13]. More recently, pore scale images have been used to characterize the effects of the configuration of the pore space and the fluids in it on transport. Liu et al. [14] demonstrate that Euler characteristics determined from multiphase high resolution images which are used for determining spatial connectivity are strongly correlated with the relative permeability for the non-wetting phase in porous media. Zou et al. [15] analyzed nonwetting phase connectivity at different water fractional flows from the images obtained from water-wet and mixed-wet Bentheimer sandstone. The results for the Euler characteristic indicate a decrease of non-wetting phase relative permeability with wettability altered from water-wet to mixed-wet on the same rock. Moreover, a pore-by-pore basis on pore and throat fluid occupancy [16,17], fluid/fluid interfacial areas [18], curvatures [19,20], and contact angles [21,22] have been conducted on high-resolution imaging under water-wet and mixed-wet conditions and adopted to explain the pore-scale physics that control the measured macroscopic relative permeability under various wettability conditions [23]. Overall, using a combination of flow experimentation and imaging provide insight into the effects of the configuration of the pore space and the fluids in it on transport.
Fractal geometry is a powerful analytical tool for the characterization of complex materials. Fractal geometric parameters measured directly from pore scale images can also be volume-averaged, which thus reveal the influence of pore structure on macroscale parameters like permeability [24,25,26,27]. Fractal dimension is a scale-invariant parameter that characterizes the extent of complexity of pore space geometry [28]. Katz et al. [29] showed the pore spaces of several sandstones are fractal geometries and adopted the fractal statistics to predict the correct porosity. Apart from the fractal dimension, there are two other counterparts to the fractal dimension: lacunarity and succolarity, which are used for characterizing the translational homogeneity, and percolation degree of a system, respectively [30,31,32]. Compared with fractal dimension widely used for pore structure characterization, lacunarity and succolarity are rarely used for porous media. In previous work, Roy et al. [33] adopted lacunarity to characterize the clustering of fracture networks and other research described the heterogeneity of porous media as lacunarity and investigated the relationship between lacunarity and permeability [34,35]. Xia et al. [25,30] analyzed pore space microstructures of reservoir rocks in terms of fractal parameters by using 3D images and demonstrated that lacunarity can quantitatively characterize the heterogeneity of the overall pore structure in core samples. They also found that succolarity showed an exponential relationship with permeability and provide an understanding of the influence of heterogeneous structure on permeability [36]. Compared with the aforementioned studies characterizing the impact of pore structure on transport properties, there are relatively a few studies quantifying the wettability effect on fluid distributions during multiphase flow in terms of fractal geometry.
Herein, the goal of our study is to consider how the fluid geometric parameters change during multiphase flow under different wettability conditions and how the parameters can correlate with relative permeability. We hypothesize that the phase state of a porous medium during multiphase flow can be described in terms of fractal geometry that characterize the geometric state of immiscible fluids and furthermore, provides a link between the relative permeability measured experimentally and fractal parameters. We extend Xia et al.’s [30] work for a two-phase flow system in porous media. We firstly statistically calculate fractal dimension, lacunarity and succolarity for water and oil phases directly from three-dimensional multiphase images from imaging core floods. Next, we correlate the parameters with the flow behavior that occurs during multiphase flow and thus, relative permeability. Our findings reveal the pore-scale physics that control the flow properties under different wettability conditions. In principle, the studies associated with the geometric characterization of immiscible fluids in porous media could be applied to any porous media with complex fluid distributions.
2. Materials and Method
In this section, we firstly explain image datasets obtained from imaging core floods that are used for fractal geometrical calculations. Next, a belief description of wettability characterization is presented. Finally, the fractal-based algorithms used to calculate fractal dimension, lacunarity and succolarity directly from images are clarified, respectively.
2.1. High Resolution Image Datasets from Core Flooding Experiments
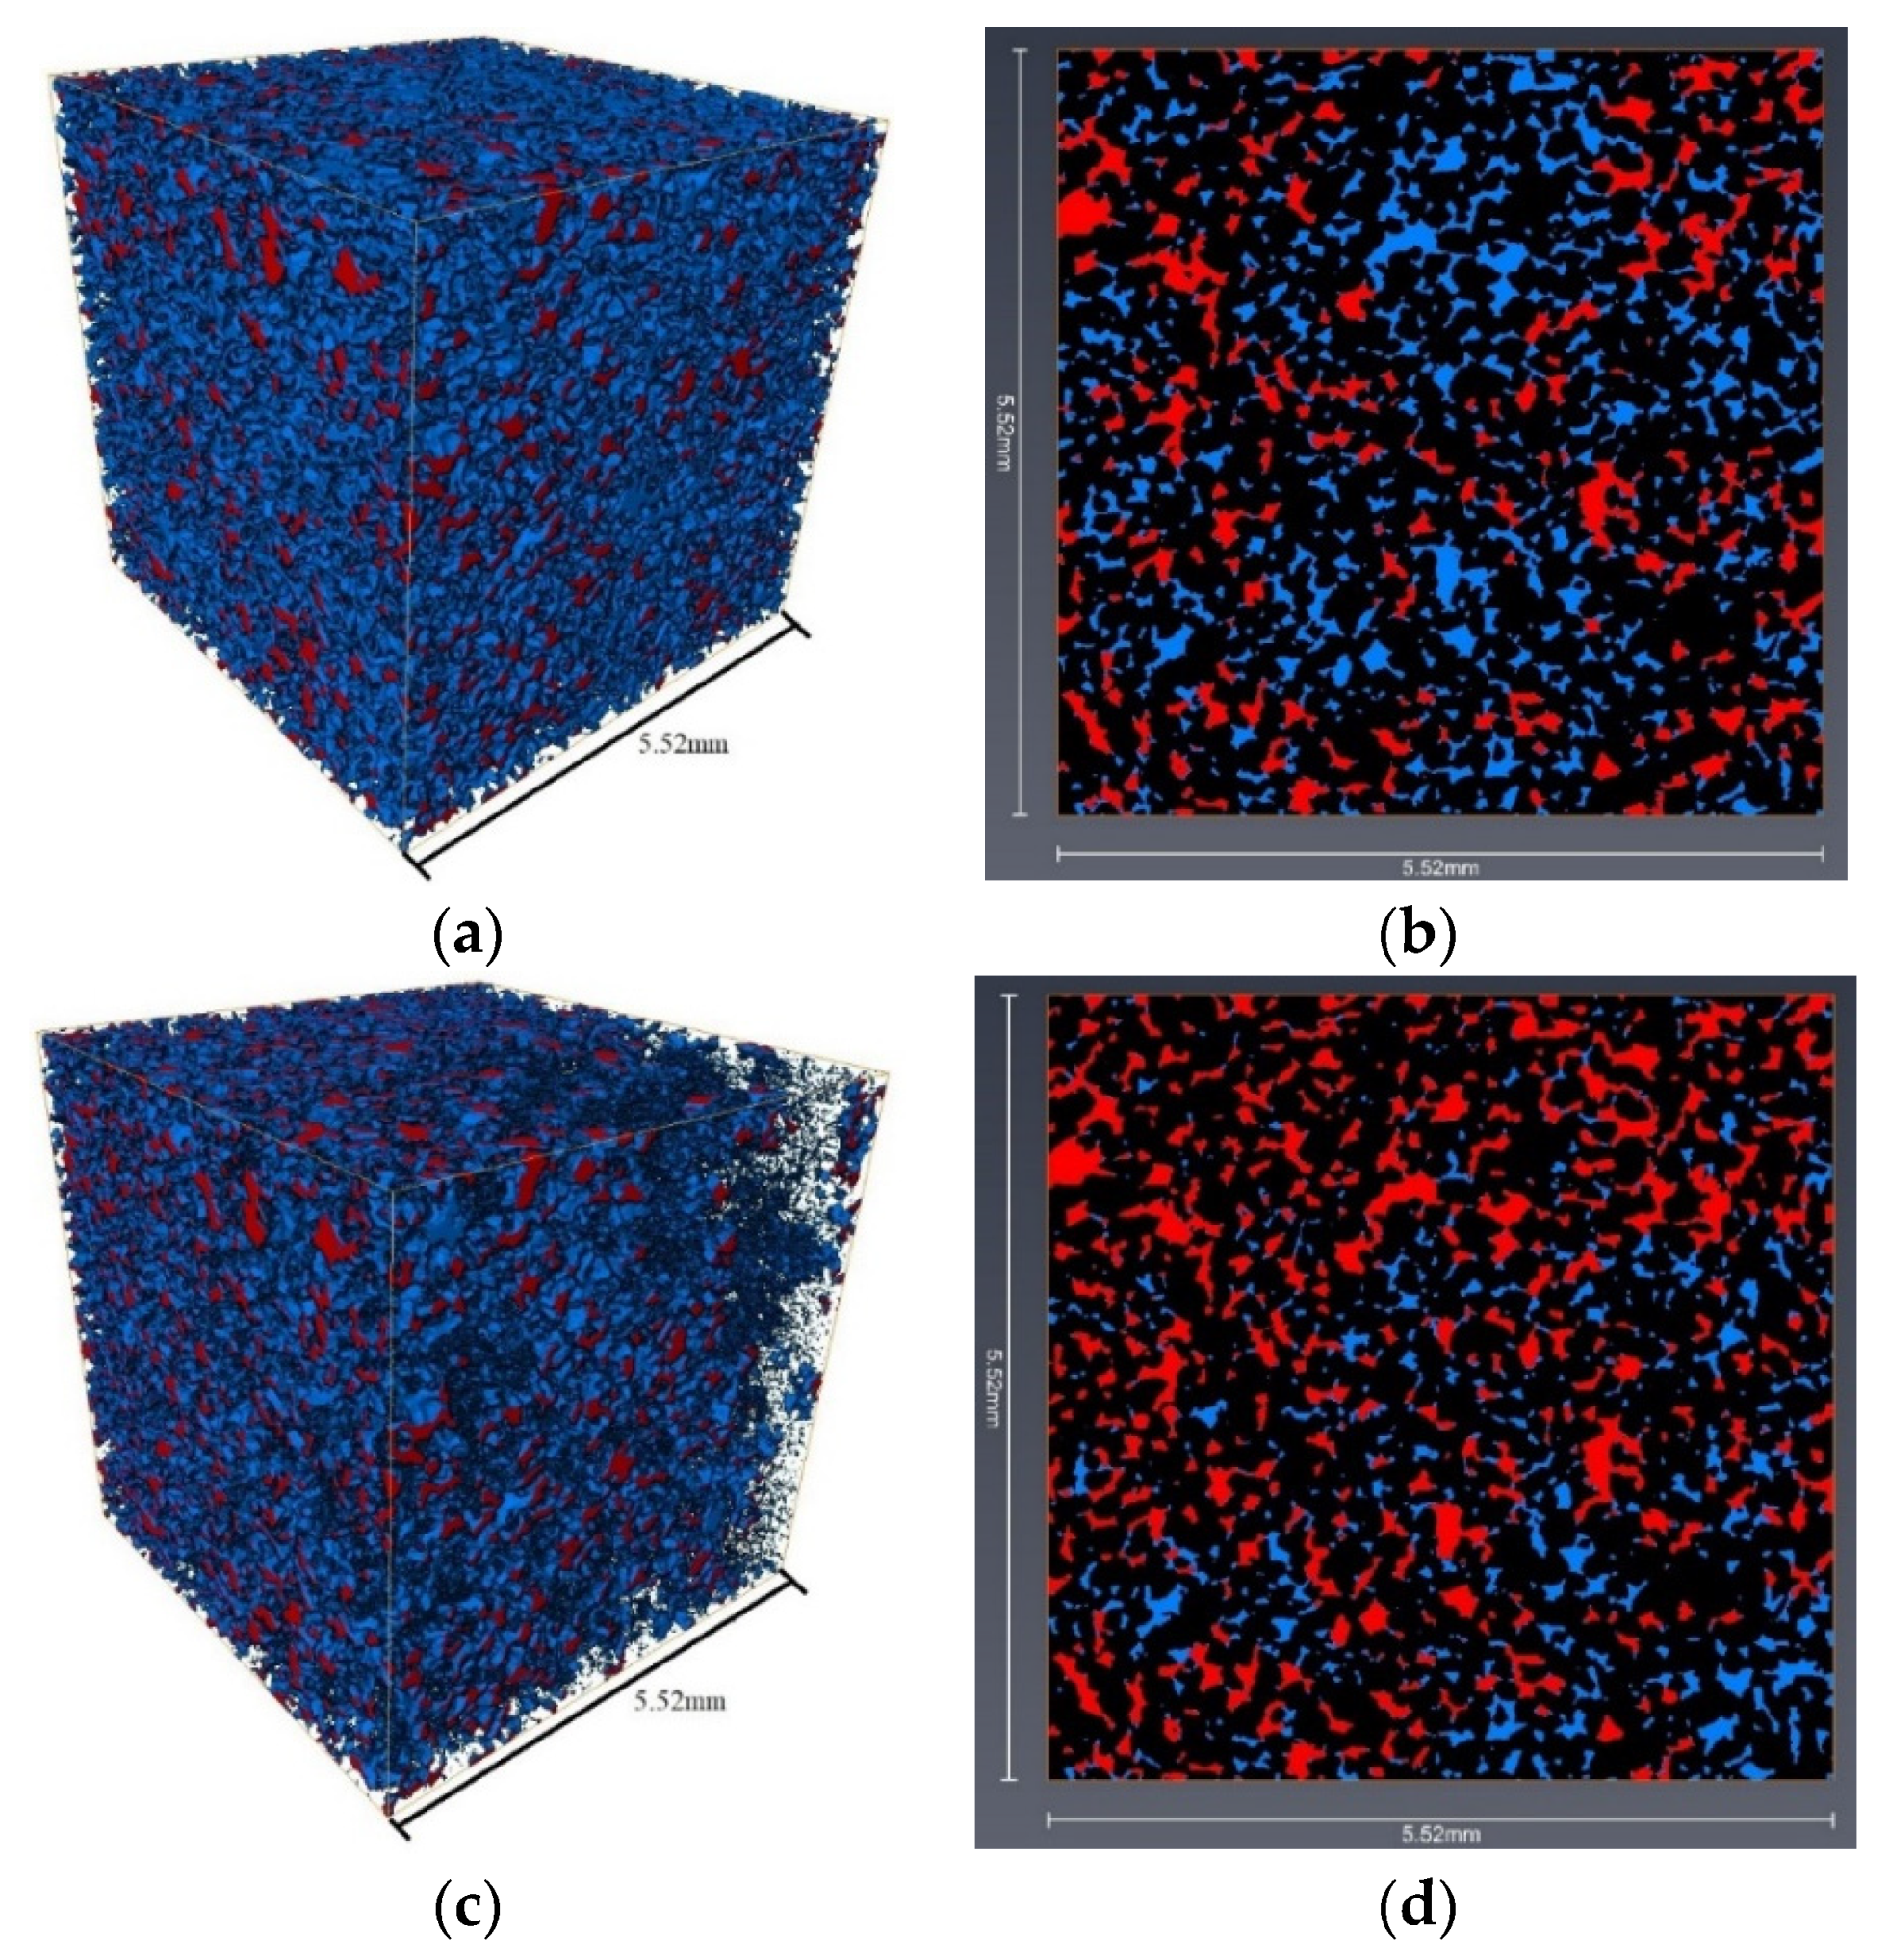
In this study, microcomputed tomography datasets of flow experiments under water-wet and mixed-wet conditions are used for fractal calculations. Fluid arrangements are imaged under water-wet and mixed-wet conditions during a steady state flooding experiment to generate fluid distributions at various water saturations. The rock sample used in our study is Bentheimer sandstone. The core sample is 10 mm in diameter and 21 mm in length. For the fluid systems, Soltrol-130 is used as the oil phase and water doped with 0.4 Mol NaI is used for the wetting phase. The interfacial tension between these two fluids is measured to be 38 mN/m. Then, on the same sandstone rock, wettability is altered to oil-wet by hydrophobic chemical solutions [37]. Afterward, steady state tests are carried out on the altered core. Brine and oil are co-injected into the core with four water fractional flows (Fw = 0.9, 0.5, 0.1 and 0) to cover the entire range of saturations for in situ fluid distributions. After a steady state is reached, the entire core length was scanned for roughly 14 h with fluids being injected using a helical imaging scanner housed in a lead-lined room at the University of New South Wales, Australia. The detail of the setup is referred to in our previous works [15]. All the partially saturated images were firstly registered with a reference to the dry image of the imaged Bentheimer sandstone [38]. Therefore, the partially saturated and dry images were overlaid for the same section of rock to superimpose the dry image segmented data for the solid phase over the partially saturated image [38]. Hence, we could clearly segment images into rock, clay, brine and oil phases. Further details on the imaging processing and segmentation were reported in Sheppard et al. [39,40]. The images used for calculations at four water fractional flows are 10243 subvolumes corresponding approximately to 5.52 mm3 of the core sample. The images for 0.5 water fractional flow are visually shown in Figure 1a–d.
Moreover, we adopt image datasets of water-wet and mixed-wet from Lin et al. [41,42] for results’ comparison and validation. Lin et al. [41] conducted a steady-state fractional flow experiment of the brine and oil phase on water-wet Bentheimer sandstone. For the water-wet case, imaged fluid distributions were obtained under steady state conditions in sequence through injecting at different fractional flows (Fw = 0, 0.05, 0.15, 0.3, 0.5, 0.85, 1) with a total flow rate of 0.02 mL/min and the original image data size is 1000 cube with approximately 3.58 mm3. For fractal parameters calculated by the box-counting method, we resampled the original image data to 512 cube for further analysis for computational efficiency. For mixed-wet conditions in Lin et al. [42], the brine and oil phase were co-injected with different water fractional flows (Fw = 0.02,0.06,0.24,0.5,0.8,0.9,1) while keeping the total volumetric flow rate at a constant of 0.03 mL/min. A central 10243 volume (approximately 3.67mm3) is extracted from each of the original CT images and then resampled to 5123 volume for analysis for computational efficiency. The images for 0.5 water fractional flow are demonstrated in Figure 1e–h. The image data information obtained from steady state tests for these four image datasets is summarized in Table 1.
2.2. Wettability Characterization from Image Datasets
The image data information obtained from steady state tests for these four image datasets is summarized in Table 1. It is noted that for our study, the same Bentheimer rock was used for imaging steady state tests for both water-wet and mixed-wet cases. For Lin’s work, two different Bentheimer rocks were adopted. The porosity and throat radius distributions of the rocks are plotted in Figure 2. The detailed information of pore and throat for water-wet and altered-wet Bentheimer in Lin’s work can be referred to in Lin et al. [42] and Foroughi et al. [43]. The image datasets for four works at water fractional flow Fw = 0.5 used for fractal-based calculation are visually displayed in Figure 1. The three-dimensional datasets used for fractal calculations as well as the two-dimensional cross-sectional views in a selected region of the pore space under water-wet and mixed-wet conditions are shown in Figure 1 as an example. From Figure 1, we visualize oil residing in large pores under water-wet conditions, while it occupies some small pores and corners for the mixed-wet case. Combined with the contact angles measured shown in Table 1, it can be seen that wettability has been altered from water-wet to mixed-wet in both works. Average contact angles were measured experimentally to be 34° and 57° for water-wet and mixed-wet in our previous study [44], respectively, while 47° and 97° were measured from image datasets by an automatic algorithm for water-wet and mixed-wet in Lin et al. [41,42], respectively.
2.3. Fractal-Based Analysis and Phase Properties
In this section, we explain the methods to calculate the fractal dimension, lacunarity and succolarity based on image datasets for the water and oil phase separately. The detailed calculation procedure is illustrated below.
2.3.1. Fractal Dimension Calculation for Two-Phase Flow
In this study, fractal dimension is used to separately quantify the characteristic of oil and water distributions in water-wet and mixed-wet cases. The pore scale fluid distributions are available from image datasets of core flooding described in the previous section. The box-counting method is performed on three-dimensional segmented fluid phases acquired from in situ pore scale imaging during steady state flow experiments. The box-counting method is performed on image datasets from core flooding experiments illustrated in Section 2.1. The water and oil phase are calculated separately for fractal dimensions by using the box-counting method [30,45,46].
2.3.2. Lacunarity Calculation for Two-Phase Flow
In this study, we used the 3D gliding box algorithm to calculate the lacunarity of the CT multiphase images.
The lacunarity Λ(r) at length scale r is obtained by the gliding box-counting method, which is calculated by the statistical moment function ZQ [30,47]
In order to eliminate the effect of porosity on the analysis of lacunarity, the calculated value from the gliding box algorithm is normalized. The maximum lacunarity is Λmax = 1/ϕ while minimum value is Λmin = Λ(l) =1 (ϕ is porosity). The value of Λmax shows that different values of ϕ will change the value of lacunarity. Hence, to eliminate the effect of porosity on the analysis for lacunarity and reflect only the impact of pore clustering, the calculated value from the gliding box algorithm is normalized. Normalizing the lacunarity parameter can be rewritten as below:
The normalized lacunarity is extended to characterize the fraction of fluid phase occupation in the pore space and eliminate the effect of ϕ. Therefore, Equations (1) and (2) are employed for each phase to demonstrate the impact of wettability alteration on fluid distributions.
2.3.3. Succolarity Calculation for Two-Phase Flow
The principle for calculating succolarity was detailed in de Melo and Conci [31], which adopted an ideal box-counting approach for 2D images. Xia et al. [30] extended his work for 3D images. As for the 3D Succolarity calculation method, the pseudo pressure fields are added to the 3D images in six directions. For each direction, the values of pressure applied on the images depend on the number of image voxels and the scale size of the measurement box. Then, the fluid flow will be simulated through all the connected pore voxels in each direction while the fluids are not allowed to flow through solid pixels with non-flow boundaries within the confines of the images.
Afterward, succolarity is predicted by adjusting the size of the measurement box in the images based on the ideal box-counting method. The target fluid flow area is then divided into equal sizes of boxes in the images and is denoted as BS(k), where k represents the number of possible partitions of an image in the boxes. Then the occupation percentage for each box size of image is measured directly on the images and denoted as OP(BS(k)). Next, for each box size k, the pressure value is expressed as follows:
where n is the number of possible divisions and PR(BS(k),pc) represents the pressure over the centroid of the box k on the scale of consideration.
Next, to make the succolarity value dimensionless, the value of succolarity can be characterized as the pressure occupation value (Equation (3)) divided by the maximum possible pressure occupation value:
where dir represents the direction, for instance, left to right.
Finally, 3D succolarity is obtained by calculating the percentage of pressure occupation with Equations (3) and (4).
3. Results
First, we calculate the fractal dimension, lacunarity and succolarity values of the water and oil phases for image datasets obtained from core flooding illustrated in Table 1. We then compare these results with varying degrees of saturations and wettabilities to investigate the influence of phase fractal characteristics on flow. Finally, coupled with macroscopic measurements of relative permeability measured on the corresponding rock samples, we identify succolarity as a significant parameter for oil phase relative permeability under various wettability conditions.
3.1. Phase Configuration Characterized by Fractal Dimension and Lacunarity during Multiphase Flow
3.1.1. Fluid Complexity Characterized by Fractal Dimension
Fractal dimensions characterize the complexity and heterogeneity of spatial fluid distributions in porous media. From Figure 3, the results show that at highwater saturation, there is nearly no difference of oil fractal dimension between water-wet and mixed-wet cases. With the decrease of water fractional flow and more oil flooded into the pore space, the fractal dimension of the oil phase in the water-wet cores is obviously larger than that in the mixed-wet cases. The observations can be explained that at high water saturation, a few amounts of oil droplets tend to locate in big pores in both water-wet and mixed-wet cores. Hence, oil distributions are similar, indicating the same value of fractal dimensions. With the increase of oil saturation, the oil phase in mixed-wet core is well connected which forms continuously to reach a very low water saturation. While for the water-wet case, the oil phase can be trapped or retained in the pore space, indicating complicated oil distributions. On the other hand, the fractal dimension for the water phase in mixed-wet is larger than the corresponding fractal dimension in water-wet. Overall, fractal dimensions for the water phase in Zou’s work [15] in water-wet and mixed-wet cases are consistently larger than those in Lin’s work [41,42]. It is most likely due to uncertainty when segmenting the water phase on imaging datasets below the image resolution. There exists an uncertainty when determining the water phase in both the water-wet and mixed-wet systems for Zou’s study since water can exist as films covering grain surfaces which may not be fully resolved with imaging. The trend shows that with wettability altered from water-wet to mixed-wet, the complexity of water phase distributions is increased since in the mixed-wet case, water phase distribution mainly depends on water-wet pores which are distributed more scattered than original water-wet conditions.
3.1.2. Fluid Heterogeneity Characterized by Normalized Lacunarity
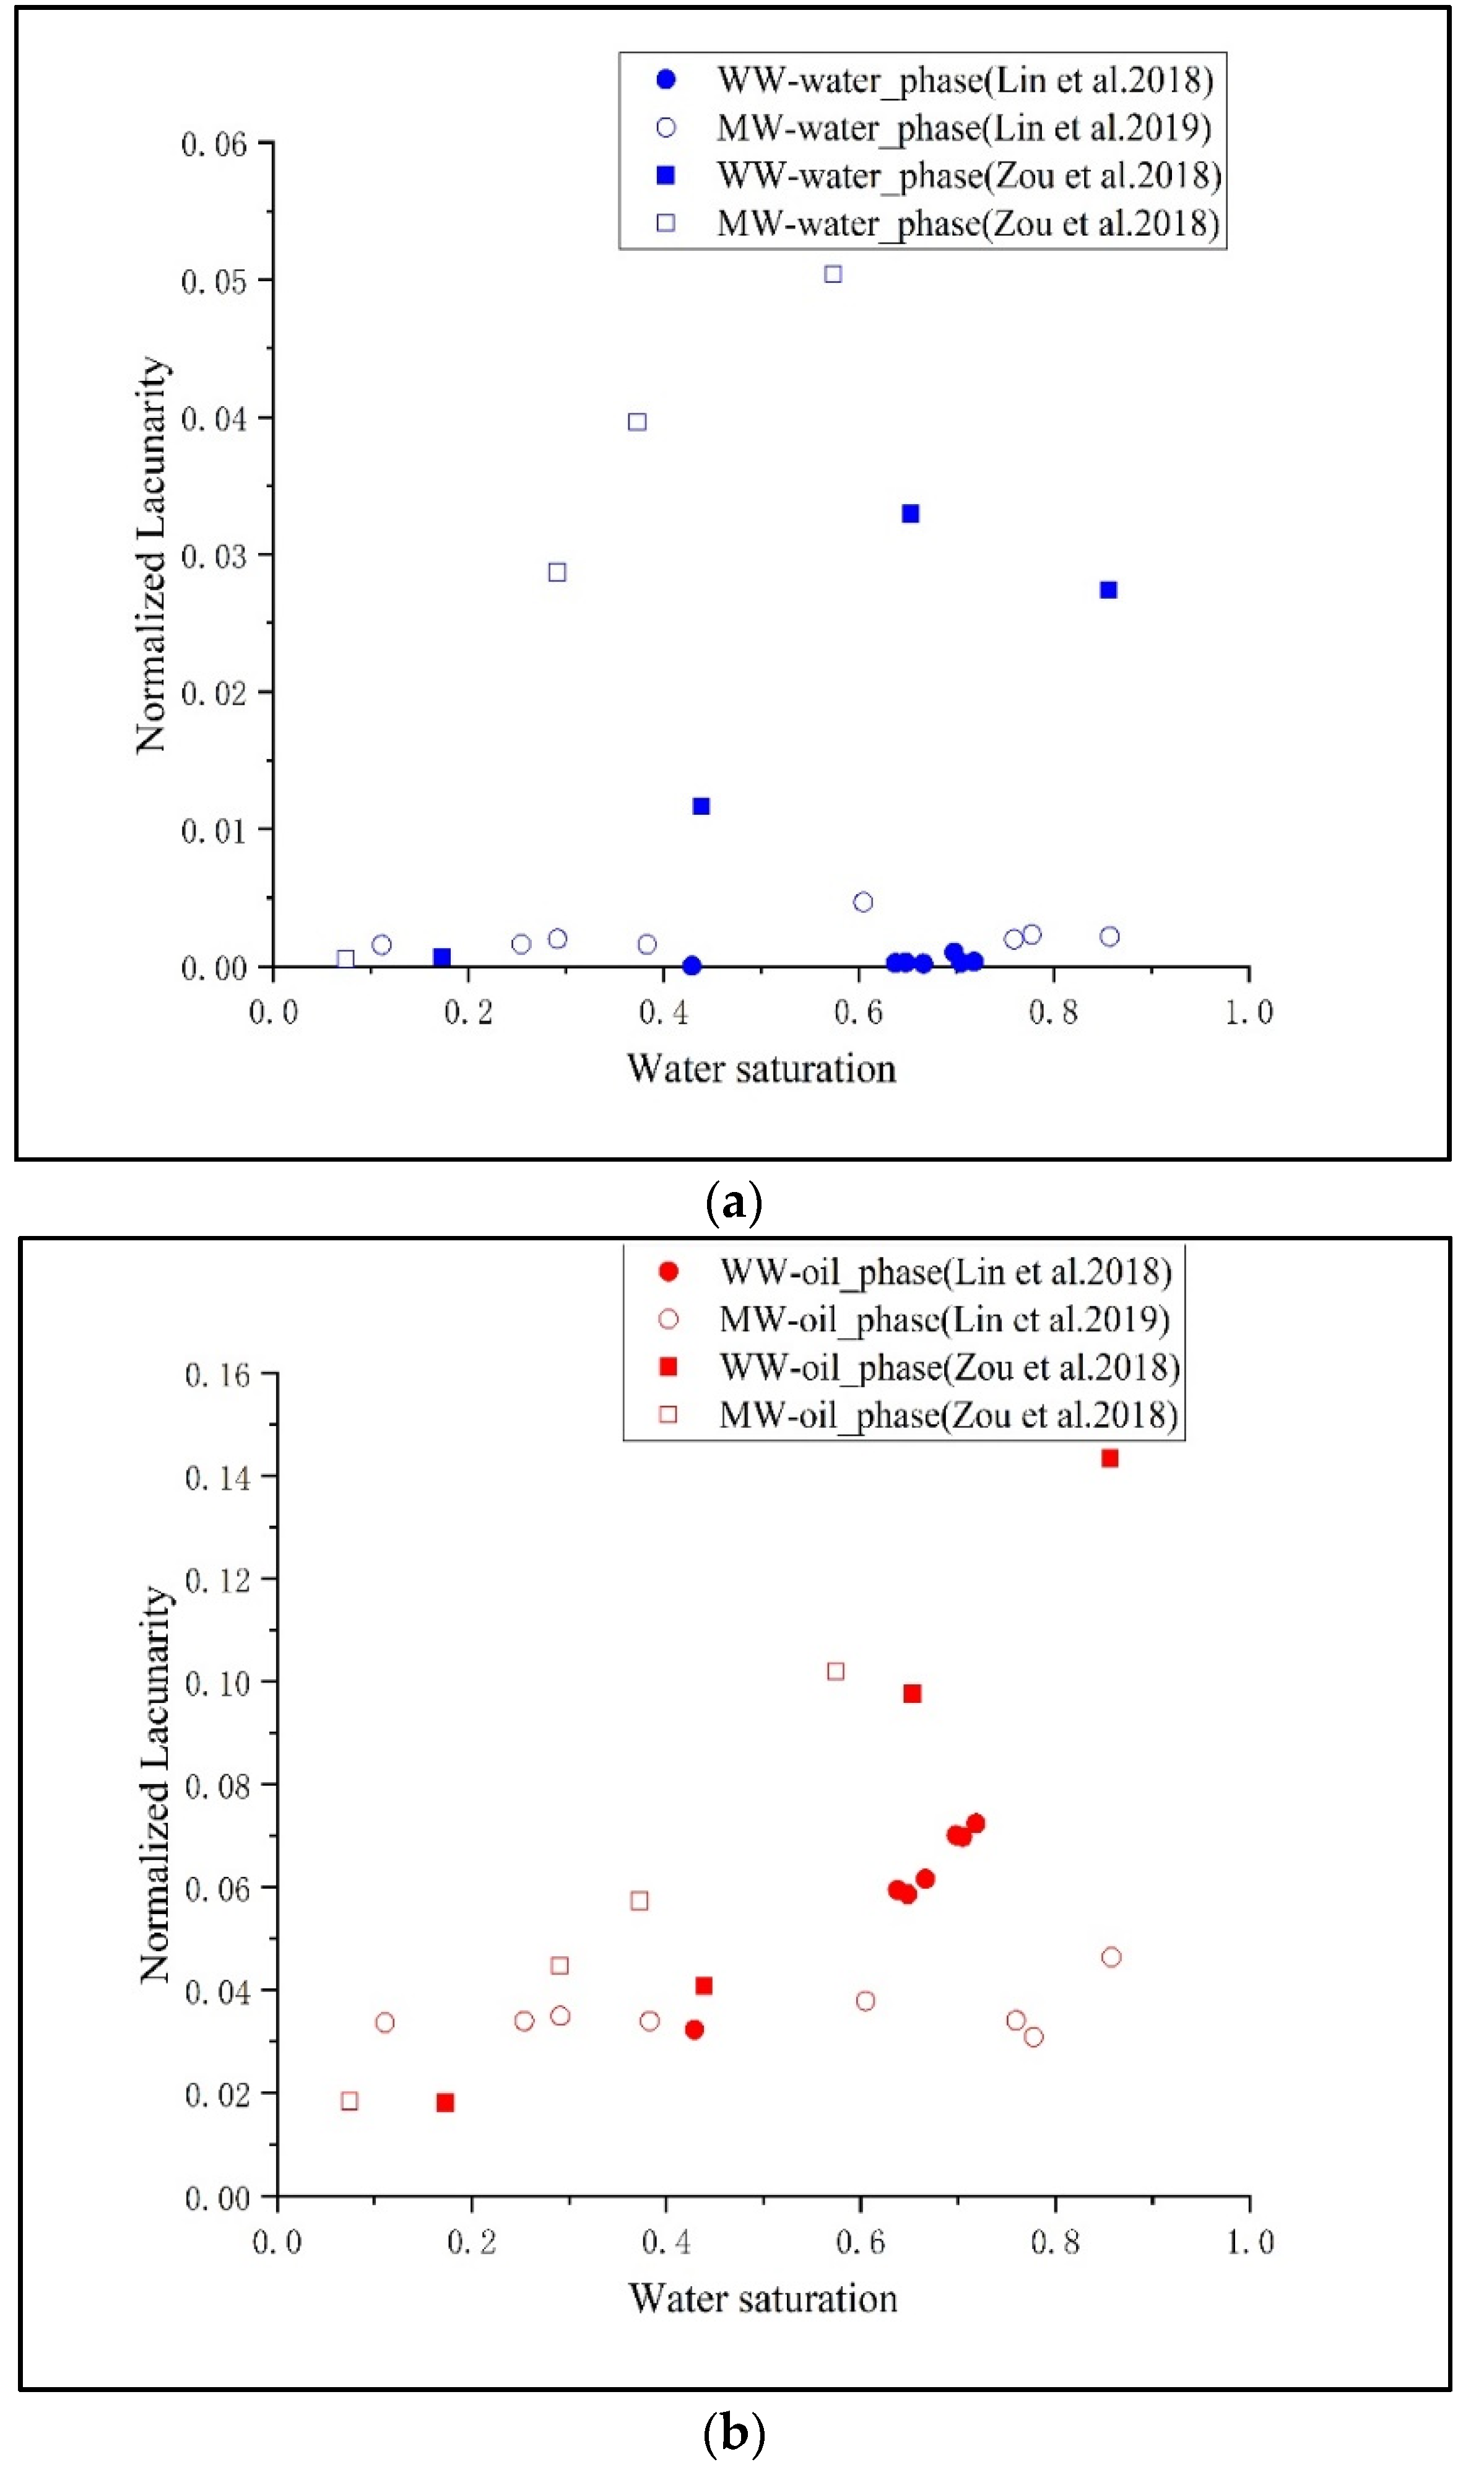
The principles for normalized lacunarity calculation are illustrated in Section 2.3.2. In order to eliminate the effect of box size computed on each dataset, the value r in the gliding box algorithm for calculating 3D lacunarity (see Equations (1)–(3)) is selected as 16 voxels for comparison and then the normalized values of lacunarity are all between 0 and 1. Lacunarity values calculated for the water and oil phase separately located in the same core sample can statistically provide an indication of the impact of wettability alteration on fluid distributions. This can be explained by the fact that in the box-counting method, the more concentrated the distribution of pores (bigger lacunarity and higher heterogeneity), the fewer the number of boxes that cover pores for a certain r. The results of normalized lacunarity for water-wet and mixed-wet cases in two scenarios (shown in Figure 4) demonstrate that with the decrease of water fractional flows, lacunarity values for both the water phase and oil phase decreases, indicating more homogenous spatial fluid distributions at low water saturations.
In detail, the trends of normalized lacunarity values for the water phase and oil phase in Zou’s study are both consistently larger than those in Lin’s work. The results are probably because the extent of wettability alteration in the two cases are different, which can be referred to as contact angle measurements tabulated in Table 1. The extent of mixed-wet in Zou and Armstrong [44] is not as strong as that in Lin’s work [42]. The results in Zou and Armstrong’s work show that the 34 degree contact angle is measured for the water-wet case and the the contact angle of mixed-wet case is approximately 57 degrees (see Table 1). The initial water saturation was 0.42 by air flooding in two directions to get a uniform desired water saturation and wettability was altered by organic saline chemical-Octadecyltrichlorosilane (OTS) to render the exposed pore surface hydrophobic [44]. On the other hand, in Lin’s work [42], a uniform water saturation for the sample was established to be approximately 0.1 by centrifugation followed by crude oil aging to generate mixed-wet conditions across the pore space in the Bentheimeh sample [42]. Two-phase fluid displacement experiments also showed that the contact angle was 47 degrees while the mixed-wet angle was 95 degrees [11]. Thus, it indicates that more oil-wet surfaces were generated in Lin’s study than those in Zou’s work, resulting in more homogeneous distributions for oil-wet surfaces and more unform wetting conditions. Therefore, fluid distributions are less clustered due to uniform oil-wet conditions in Lin’s work with smaller values for lacunarity. Hence, the results show the influence of the degree of wettability alteration on fluid spatial distributions. The clustering degree of the fluid phase distributions affected by the heterogeneous wettability on the rock sample is larger than that by homogeneous wettability rock.
3.2. Flow Capacity Characterized by Succolarity and Relative Permeability Curves
We further examine the impact of wettability alteration on fluid percolation in terms of succolarity. Succolarity values are calculated for the water and oil phases under the water-wet and mixed-wet cases according to Equations (3) and (4) which are detailed in Section 2.3.3. The direction of Succolarity calculations was chosen to be consistent with the direction of fluid flow injection (Z direction). The results of succolarity calculations are plotted in Figure 5. We then compared the relative permeability results measured by the core flooding experiment at steady state for water-wet and the mixed-wettability Bentheimer in [15,41,42] which are detailed in Table 1. The relative permeability curve is shown in Figure 6.
Regarding the succolarity results, we can see that for the oil phase in the water-wet case (Figure 5a), the Succolarity result is higher than that in mixed-wet while water succolarity value in water-wet is lower than that in mixed-wet conditions in both scenarios (shown in Figure 5b). The trends are consistent with our experimental observations and relative permeability results under different wettability conditions [5,9] shown in Figure 6. Thus, in Figure 6, oil relative permeability in water-wet (shown in solid square and circle) is larger than Kro in mixed-wet cases (shown in hollow square and circle) since in the mixed-wet core, the oil is confined to smaller pores and the water will form continuous channels or fingers through the centers of the larger pores [48]. For the water phase, the succolarity values in the mixed-wet cases are slightly larger than those in the water-wet cases since the brine tends to imbibe into the small pores and corners in the water-wet case while in the mixed-wet case with the pores altered to oil-wet, the water phase tends to locate in big pores [49]. Overall, the trends for succolarity values at various saturations shown in Figure 5 are consistent with relative permeability results measured at steady state laboratory experiments in water-wet and mixed-wet for four scenarios which are plotted in Figure 6. The succolarity values can provide an indication of the impact of the wettability on fluid capacity. We then further explore the relationship between succolarity values and relative permeability for the oil and water phase in the following section.
3.3. The Relationship between Succolarity and Relative Permeability
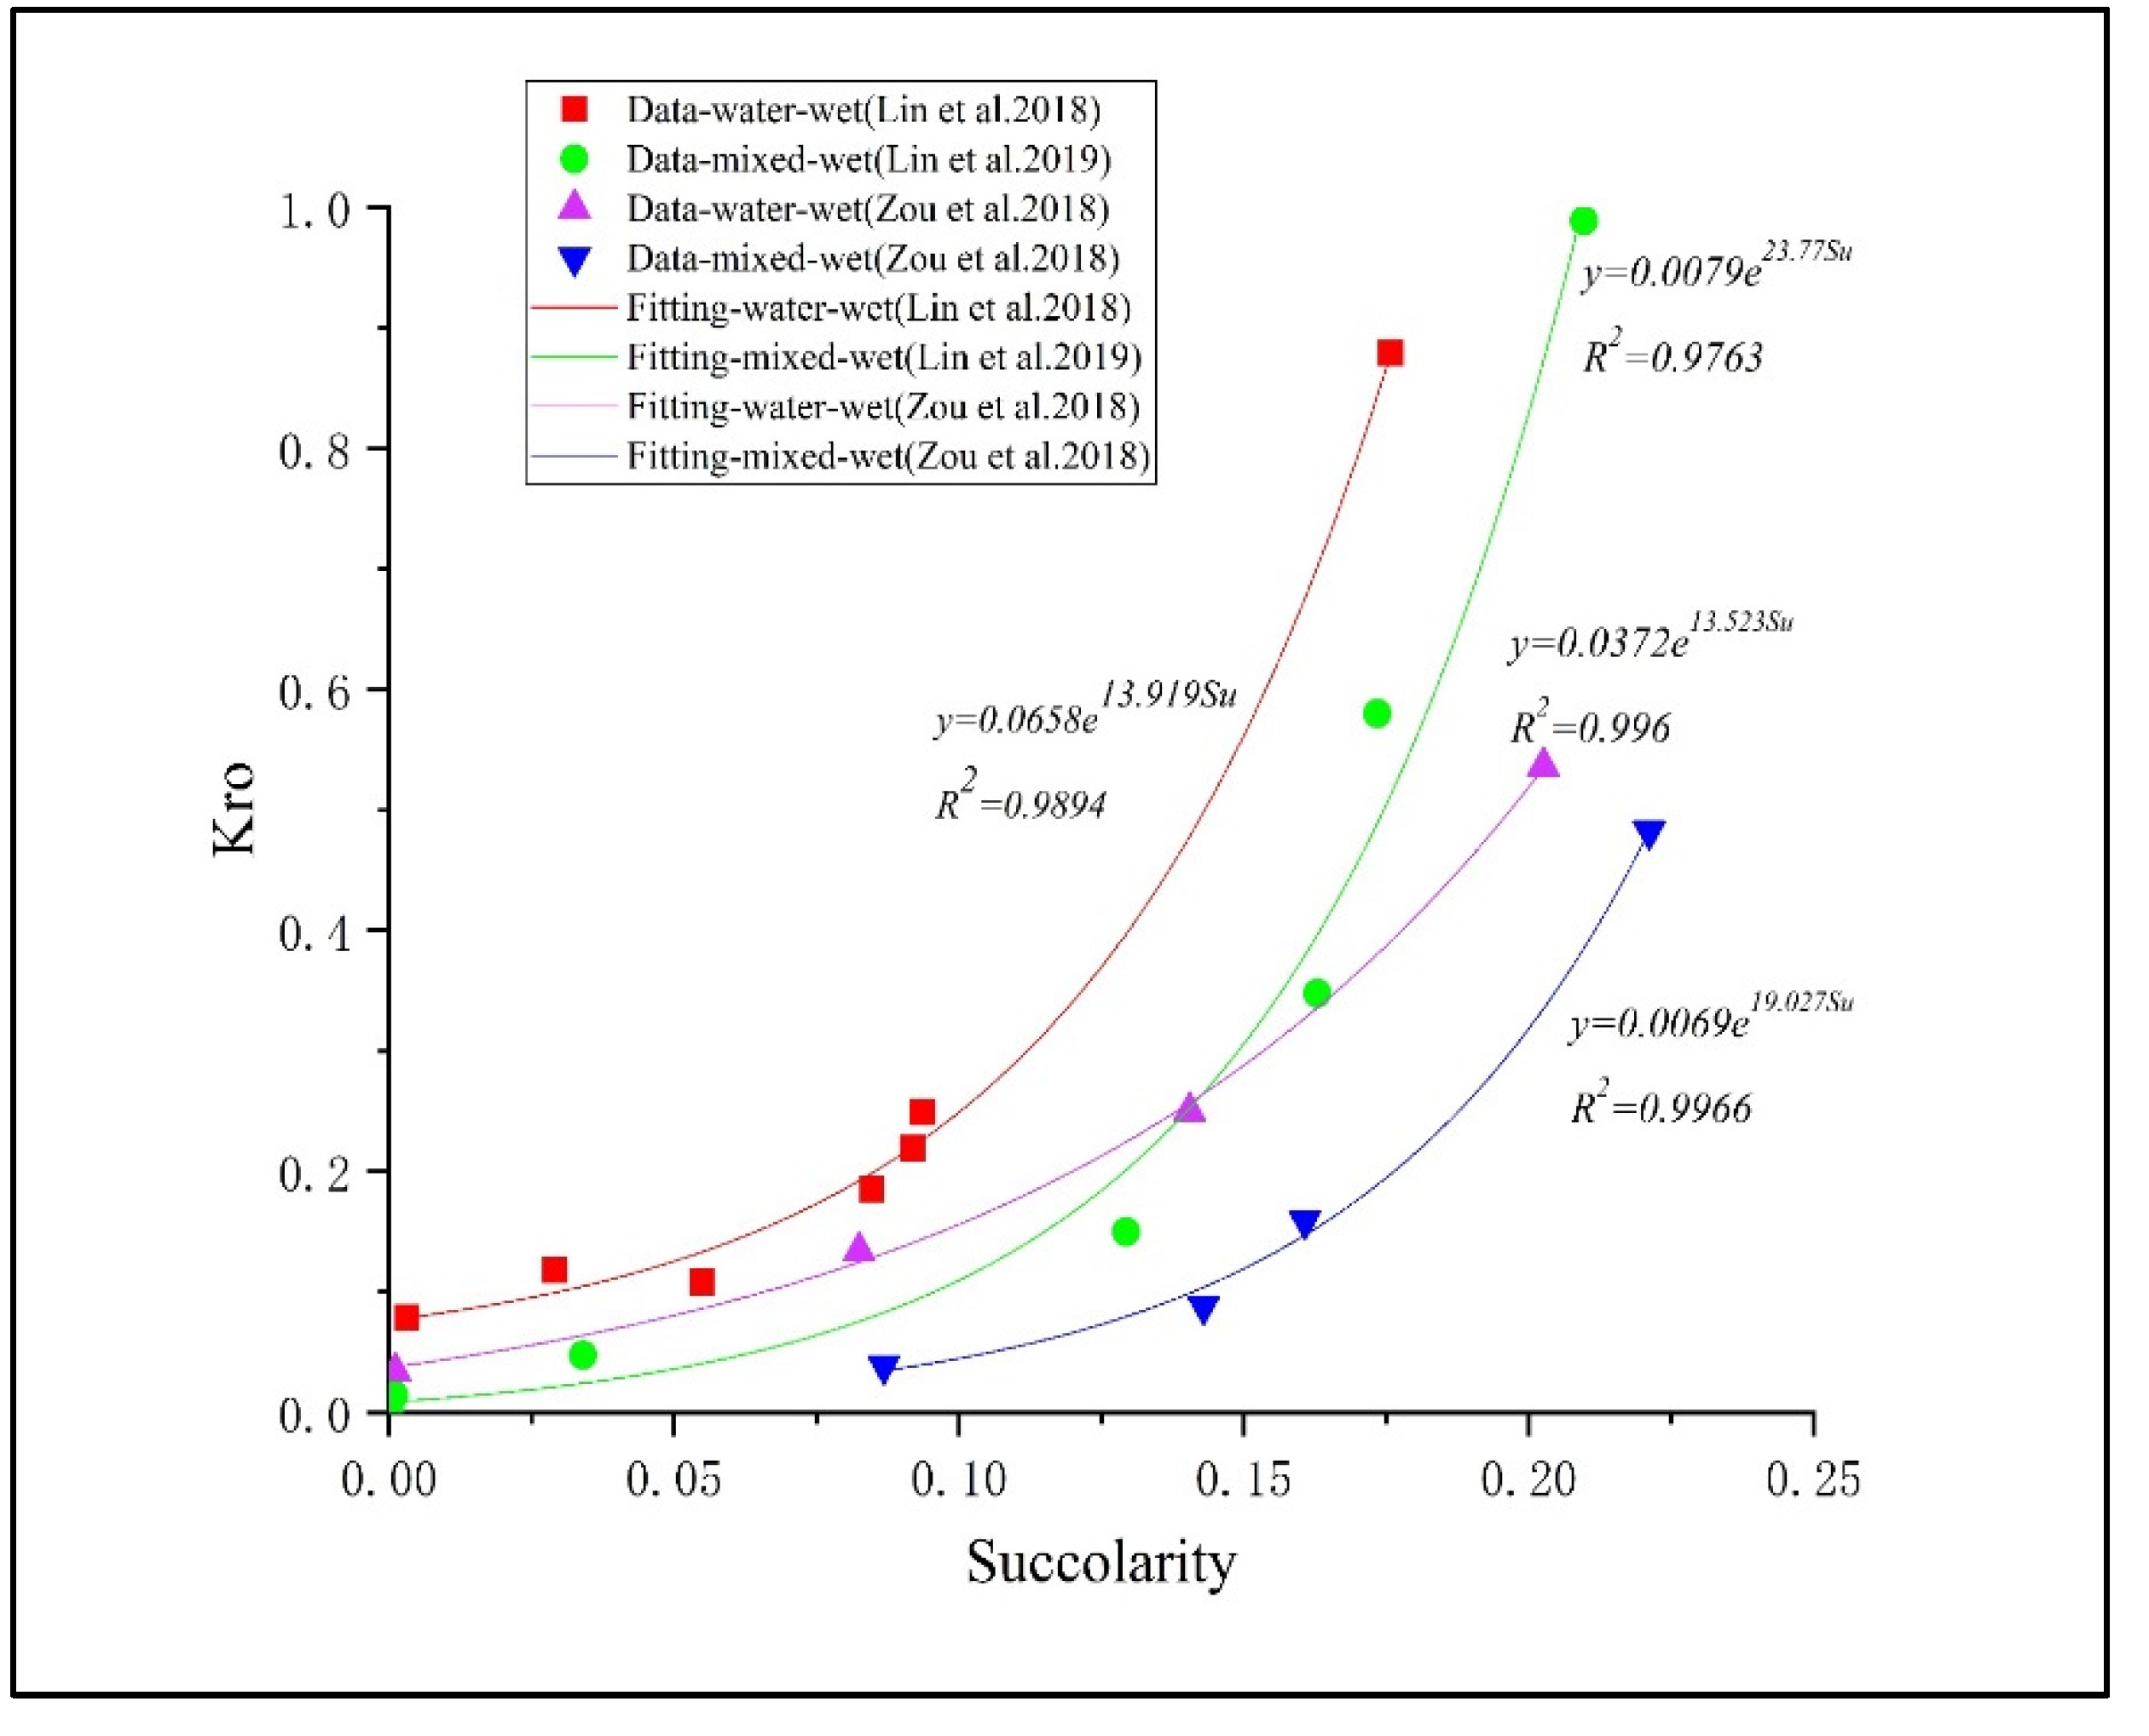
Based on the above results shown in Figure 5 and Figure 6, we find that succolarity results show a similar trend with relative permeability results. We then correlate the relationship between the permeability of the oil phase and succolarity along flow direction for four scenarios and the relationships are shown in Figure 7. All the data points are fitted to an exponential model y = a, where Su is the abbreviation for succolarity. The parameters a and b for the corresponding work are listed in Table 2. All the fittings are good as R2 is larger than 0.976. Based on Figure 7, we can see that parameter a for water-wet cases is consistently one magnitude larger than that in mixed-wet cases while parameter b is smaller in water-wet cases. Overall, the relative permeabilities for the oil phase under water-wet and mixed-wet both have a strong correlation with succolarity. Thus, succolarity values effectively reflect the trend of relative permeability results under different wettability conditions.
4. Conclusions and Discussion
In this study, we adopt fractal parameters to analyze the geometric characteristics of two-phase flow under different water fractional flows. By using fractal dimension, lacunarity and succolarity, we quantify spatial fluid distributions directly from pore scale imaging, fully investigate complexity, clustering and flow capacity of two-phase flow and probe the impact of wettability alteration on fluid flow in terms of fractal geometry. Geometric analysis shows that fractal dimensions well characterize the complexity of the spatial fluid distributions. Lancuccity can indicate the extent of wettability alteration on fluid occupancy at different fluid saturations and demonstrate that the distributions of wetting pore surface play a major role in the heterogeneity of fluid distribution. Moreover, succolarity can provide a useful indication of the wettability effect on the flow capacity for each fluid in the porous media, which is consistent with our experimental results of the impact of wettability alteration on relative permeability.
Overall, we provide a first look at the relationship between the fractal geometrical parameters and flow behavior that occurs during multiphase flow as well as relative permeability. Our work provides a perspective into the influence that phase geometry has on relative permeability under controlled wettability and the resulting phase fractal changes under different saturations that occur during multiphase flow. A complete characterization of pore scale geometry characteristics under controlled wettability for two-phase fluid flow allows a means to understand phase geometric changes that occur during fluid flow and provides a benchmark datasets to validate pore-scale models.
Author Contributions
Conceptualization, S.Z. and P.X.; methodology, S.Z.; software, P.X. and H.T.; validation, S.Z. and X.D.; formal analysis, P.X. and H.T.; investigation, S.Z. and C.X.; data curation, P.X. and H.T.; writing—original draft preparation, S.Z. and P.X.; writing—review and editing, C.X. and X.D.; visualization, X.D. and H.T.; supervision, S.Z.; project administration, S.Z. and C.X.; funding acquisition, S.Z. All authors have read and agreed to the published version of the manuscript.
Funding
This research was funded by Hubei Provincial Natural Science Foundation of China (No. 2020CFB443).
Data Availability Statement
The Image dataset for water-wet is publicly available via the Digital Rock Portal (https://www.digitalrocksportal.org/projects/157 accessed on 7 Janunary 2022). The Image datasefor mixed-wet is publicly available via the Digital Rock Portal (https://www.digitalrocksportal.org/projects/263/origin_data/1056/ accessed on 7 Janunary 2022).
Acknowledgments
The experiments and imaging were performed at the University of New South Wales, Tyree X-ray Imaging Facility. We would like to thank the Tyree X-Ray Laboratory at the School of Minerals and Energy Resources Engineering, UNSW, for their assistance in imaging and image processing.
Conflicts of Interest
The authors declare no conflict of interest.
References
- Blunt, M.J.; Bijeljic, B.; Dong, H.; Gharbi, O.; Iglauer, S.; Mostaghimi, P.; Paluszny, A.; Pentland, C. Pore-Scale Imaging and Modelling. Adv. Water Resour. 2013, 51, 197–216. [Google Scholar] [CrossRef] [Green Version]
- Morrow, N.; Buckley, J. Improved Oil Recovery by Low-Salinity Waterflooding. J. Pet. Technol. 2011, 63, 106–112. [Google Scholar] [CrossRef]
- Iglauer, S.; Paluszny, A.; Pentland, C.H.; Blunt, M. Residual CO2 imaged With X-Ray Micro-Tomography. Geophys. Res. Lett. 2011, 38, L21403. [Google Scholar] [CrossRef] [Green Version]
- Molnar, I.L.; Gerhard, J.I.; Willson, C.S.; O’Carroll, D.M. Wettability Effects on Primary Drainage Mechanisms and NAPL Distribution: A Pore-Scale Study. Water Resour. Res. 2020, 56, 2019–025381. [Google Scholar] [CrossRef] [Green Version]
- Morrow, N.R. Wettability and Its Effect on Oil Recovery. J. Pet. Technol. 1990, 42, 1476–1484. [Google Scholar] [CrossRef]
- Mohammadi, M.-R.; Bahmaninia, H.; Ansari, S.; Hemmati-Sarapardeh, A.; Norouzi-Apourvari, S.; Schaffie, M.; Ranjbar, M. Evaluation of Asphaltene Adsorption on Minerals of Dolomite and Sandstone Formations in Two and Three-Phase Systems. Adv. Geo-Energy Res. 2021, 5, 39–52. [Google Scholar] [CrossRef]
- Anderson, W.G. Wettability Literature Survey Part 5: The Effects of Wettability on Relative Permeability. J. Pet. Technol. 1987, 39, 1453–1468. [Google Scholar] [CrossRef]
- Anderson, W. Wettability Literature Survey-Part 6: The Effects of Wettability on Waterflooding. J. Pet. Technol. 1987, 39, 1605–1622. [Google Scholar] [CrossRef]
- Abdallah, W.; Buckley, J.S.; Carnegie, A.; Edwards, J.; Herold, B.; Fordham, E.; Graue, A.; Habashy, T.; Seleznev, N.; Signer, C.; et al. Fundamentals of Wettability. Oilfield Rev. 1986, 19, 44–61. [Google Scholar]
- Zhao, B.; MacMinn, C.W.; Juanes, R. Wettability Control on Multiphase Flow in Patterned Microfluidics. Proc. Natl. Acad. Sci. USA 2016, 113, 10251–10256. [Google Scholar] [CrossRef] [Green Version]
- Blunt, M.J.; Lin, Q.; Akai, T.; Bijeljic, B. A Thermodynamically Consistent Characterization of Wettability in Porous Media Using High-Resolution Imaging. J. Colloid Interface Sci. 2019, 552, 59–65. [Google Scholar] [CrossRef] [PubMed]
- Berg, S.; Ott, H.; Klapp, S.A.; Schwing, A.; Neiteler, R.; Brussee, N.; Makurat, A.; Leu, L.; Enzmann, F.; Schwarz, J.-O.; et al. Real-Time 3D Imaging of Haines Jumps in Porous Media Flow. Proc. Natl. Acad. Sci. USA 2013, 110, 3755–3759. [Google Scholar] [CrossRef] [PubMed] [Green Version]
- Berg, S.; Rücker, M.; Ott, H.; Georgiadis, A.; van der Linde, H.; Enzmann, F.; Kersten, M.; Armstrong, R.; de With, S.; Becker, J.; et al. Connected Pathway Relative Permeability from Pore-Scale Imaging of Imbibition. Adv. Water Resour. 2016, 90, 24–35. [Google Scholar] [CrossRef] [Green Version]
- Liu, Z.; Herring, A.; Arns, C.; Berg, S.; Armstrong, R.T. Pore-Scale Characterization of Two-Phase Flow Using Integral Geometry. Transp. Porous Media 2017, 118, 99–117. [Google Scholar] [CrossRef]
- Zou, S.; Armstrong, R.T.; Arns, J.; Arns, C.H.; Hussain, F. Experimental and Theoretical Evidence for Increased Ganglion Dynamics During Fractional Flow in Mixed-Wet Porous Media. Water Resour. Res. 2018, 54, 3277–3289. [Google Scholar] [CrossRef]
- McClure, J.E.; Armstrong, R.T.; Berrill, M.A.; Schlüter, S.; Berg, S.; Gray, W.G.; Miller, C.T. Geometric State Function for Two-Fluid Flow in Porous Media. Phys. Rev. Fluids 2018, 3, 084306. [Google Scholar] [CrossRef]
- Gao, Y.; Raeini, A.Q.; Selem, A.M.; Bondino, I.; Blunt, M.J.; Bijeljic, B. Pore-Scale Imaging with Measurement of Relative Permeability and Capillary Pressure on the Same Reservoir Sandstone Sample under Water-Wet and Mixed-Wet Conditions. Adv. Water Resour. 2020, 146, 103786. [Google Scholar] [CrossRef]
- Gao, Y.; Raeini, A.Q.; Blunt, M.J.; Bijeljic, B. Dynamic Fluid Configurations in Steady-State Two-Phase Flow in Bentheimer Sandstone. Phys. Rev. E 2021, 103, 013110. [Google Scholar] [CrossRef]
- Zou, S.; Liu, Y.; Cai, J.; Armstrong, R.T. Influence of Capillarity on Relative Permeability in Fractional Flows. Water Resour. Res. 2020, 56, 2020–027624. [Google Scholar] [CrossRef]
- Armstrong, R.T.; Porter, M.L.; Wildenschild, D. Linking Pore-Scale Interfacial Curvature to Column-Scale Capillary Pressure. Adv. Water Resour. 2012, 46, 55–62. [Google Scholar] [CrossRef]
- Andrew, M.; Bijeljic, B.; Blunt, M.J. Pore-Scale Contact Angle Measurements at Reservoir Conditions Using X-Ray Microtomography. Adv. Water Resour. 2014, 68, 24–31. [Google Scholar] [CrossRef] [Green Version]
- Sun, C.; McClure, J.; Berg, S.; Mostaghimi, P.; Armstrong, R.T. Universal Description of Wetting on Multiscale Surfaces Using Integral Geometry. J. Colloid Interface Sci. 2021, 608, 2330–2338. [Google Scholar] [CrossRef] [PubMed]
- Armstrong, R.T.; McClure, J.E.; Berrill, M.A.; Rücker, M.; Schlüter, S.; Berg, S. Beyond Darcy’s law: The role of phase topology and ganglion dynamics for two-fluid flow. Phys. Rev. E 2016, 94, 043113. [Google Scholar] [CrossRef] [PubMed] [Green Version]
- Wood, D.A. Techniques Used to Calculate Shale Fractal Dimensions Involve Uncertainties and Imprecisions That Require More Careful Consideration. Adv. Geo-Energy Res. 2021, 5, 153–165. [Google Scholar] [CrossRef]
- Xia, Y.; Wei, W.; Liu, Y.; Cai, Z.; Zhang, Q.; Cai, J. A Fractal-Based Approach to Evaluate the Effect of Microstructure on the Permeability of Two-Dimensional Porous Media. Appl. Geochem. 2021, 131, 105013. [Google Scholar] [CrossRef]
- Armstrong, R.T.; McClure, J.; Robins, V.; Liu, Z.; Arns, C.H.; Schlüter, S.; Berg, S. Porous Media Characterization Using Minkowski Functionals: Theories, Applications and Future Directions. Transp. Porous Media 2019, 130, 305–335. [Google Scholar] [CrossRef]
- Yu, B.; Liu, W. Fractal Analysis of Permeabilities for Porous Media. AIChE J. 2004, 50, 46–57. [Google Scholar] [CrossRef]
- Krohn, C.E. Fractal Measurements of Sandstones, Shales, and Carbonates. J. Geophys. Res. Earth Surf. 1988, 93, 3297–3305. [Google Scholar] [CrossRef]
- Katz, A.J.; Thompson, A.H. Fractal Sandstone Pores: Implications for Conductivity and Pore Formation. Phys. Rev. Lett. 1985, 54, 1325–1328. [Google Scholar] [CrossRef]
- Xia, Y.; Cai, J.; Perfect, E.; Wei, W.; Zhang, Q.; Meng, Q. Fractal Dimension, Lacunarity and Succolarity Analyses on CT Images of Reservoir Rocks for Permeability Prediction. J. Hydrol. 2019, 579, 124198. [Google Scholar] [CrossRef]
- De Melo, R.H.C.; Conci, A. How Succolarity Could Be Used as Another Fractal Measure in Image Analysis. Telecommun. Syst. 2013, 52, 1643–1655. [Google Scholar] [CrossRef]
- Mandelbrot, B.B. The Fractal Geometry of Nature; WH Freeman: New York, NY, USA, 1982; Volume 1. [Google Scholar]
- Roy, A.; Perfect, E.; Dunne, W.M.; Odling, N.; Kim, J.-W. Lacunarity Analysis of Fracture Networks: Evidence for Scale-Dependent Clustering. J. Struct. Geol. 2010, 32, 1444–1449. [Google Scholar] [CrossRef]
- Kim, J.-W.; Sukop, M.; Perfect, E.; Pachepsky, Y.; Choi, H. Geometric and Hydrodynamic Characteristics of Three-Dimensional Saturated Prefractal Porous Media Determined with Lattice Boltzmann Modeling. Transp. Porous Media 2011, 90, 831–846. [Google Scholar] [CrossRef]
- Cousins, T.A.; Ghanbarian, B.; Daigle, H. Three-Dimensional Lattice Boltzmann Simulations of Single-Phase Permeability in Random Fractal Porous Media with Rough Pore–Solid Interface. Transp. Porous Media 2018, 122, 527–546. [Google Scholar] [CrossRef]
- Ahrenholz, B.; Tölke, J.; Lehmann, P.; Peters, A.; Kaestner, A.; Krafczyk, M.; Durner, W. Prediction of Capillary Hysteresis in a Porous Material Using Lattice-Boltzmann Methods and Comparison to Experimental Data and a Morphological Pore Network Model. Adv. Water Resour. 2008, 31, 1151–1173. [Google Scholar] [CrossRef]
- Kumar, M.; Fogden, A. Patterned Wettability of Oil and Water in Porous Media. Langmuir 2010, 26, 4036–4047. [Google Scholar] [CrossRef] [PubMed]
- Latham, S.; Varslot, T.; Sheppard, A. Image Registration: Enhancing and Calibrating X-Ray Micro-CT Imaging. In Proceedings of the International Symposium of the Society of Core Analysts, Abu Dhabi, United Arab Emirates, 29 October–2 November 2008; pp. 1–12. [Google Scholar]
- Sheppard, A.; Latham, S.; Middleton, J.; Kingston, A.; Myers, G.; Varslot, T.; Fogden, A.; Sawkins, T.; Cruikshank, R.; Saadatfar, M.; et al. Techniques in Helical Scanning, Dynamic Imaging and Image Segmentation for Improved Quantitative Analysis with X-Ray Micro-CT. Nucl. Instruments Methods Phys. Res. Sect. B Beam Interactions Mater. Atoms 2014, 324, 49–56. [Google Scholar] [CrossRef] [Green Version]
- Sheppard, A.; Sok, R.M.; Averdunk, H. Techniques for Image Enhancement and Segmentation of Tomographic Images of Porous Materials. Phys. A Stat. Mech. Appl. 2004, 339, 145–151. [Google Scholar] [CrossRef]
- Lin, Q.; Bijeljic, B.; Pini, R.; Blunt, M.J.; Krevor, S. Imaging and Measurement of Pore-Scale Interfacial Curvature to Determine Capillary Pressure Simultaneously with Relative Permeability. Water Resour. Res. 2018, 54, 7046–7060. [Google Scholar] [CrossRef]
- Lin, Q.; Bijeljic, B.; Berg, S.; Pini, R.; Blunt, M.J.; Krevor, S. Minimal Surfaces in Porous Media: Pore-Scale Imaging of Multiphase Flow in an Altered-Wettability Bentheimer Sandstone. Phys. Rev. E 2019, 99, 063105. [Google Scholar] [CrossRef] [Green Version]
- Foroughi, S.; Bijeljic, B.; Lin, Q.; Raeini, A.Q.; Blunt, M.J. Pore-by-Pore Modeling, Analysis, and Prediction of Two-Phase Flow in Mixed-Wet Rocks. Phys. Rev. E 2020, 102, 023302. [Google Scholar] [CrossRef] [PubMed]
- Zou, S.; Armstrong, R.T. Multiphase Flow Under Heterogeneous Wettability Conditions Studied by Special Core Analysis and Pore-Scale Imaging. SPE J. 2019, 24, 1234–1247. [Google Scholar] [CrossRef]
- Crawford, J.; Matsui, N. Heterogeneity of the Pore and Solid Volume of Soil: Distinguishing a Fractal Space from Its Non-Fractal Complement. Geoderma 1996, 73, 183–195. [Google Scholar] [CrossRef]
- Perfect, E.; Donnelly, B. Bi-Phase Box Counting: An Improved Method for Fractal Analysis of Binary Images. Fractals 2015, 23, 1540010. [Google Scholar] [CrossRef] [Green Version]
- Allain, C.; Cloitre, M. Characterizing the Lacunarity of Random and Deterministic Fractal Sets. Phys. Rev. A 1991, 44, 3552–3558. [Google Scholar] [CrossRef]
- Kovscek, A.R.; Wong, H.; Radke, C.J. A Pore-Level Scenario for the Development of Mixed Wettability in Oil Reservoirs. AIChE J. 1993, 39, 1072–1085. [Google Scholar] [CrossRef] [Green Version]
- Diao, Z.; Li, S.; Liu, W.; Liu, H.; Xia, Q. Numerical Study of the Effect of Tortuosity and Mixed Wettability on Spontaneous Imbibition in Heterogeneous Porous Media. Capillarity 2021, 4, 50–62. [Google Scholar] [CrossRef]
Figure 1.
Image datasets of water-wet (a,b) and mixed-wet (c,d) used for fractal-based calculations (approximately 5.52 mm3) are displayed in three-dimensional datasets and the two-dimensional cross-sectional views In Zou et al. [15]’s work. Image datasets of water-wet (e,f) and mixed-wet (g,h) used for fractal-based calculations (approximately 3.58 mm3) are displayed in three-dimensional datasets and the two-dimensional cross-sectional views in Lin et al. [42]. The original image datasets are documented in Section 2.1 and then reproduced for visualizations here. All images shown here are steady-state tests at fw = 0.5.
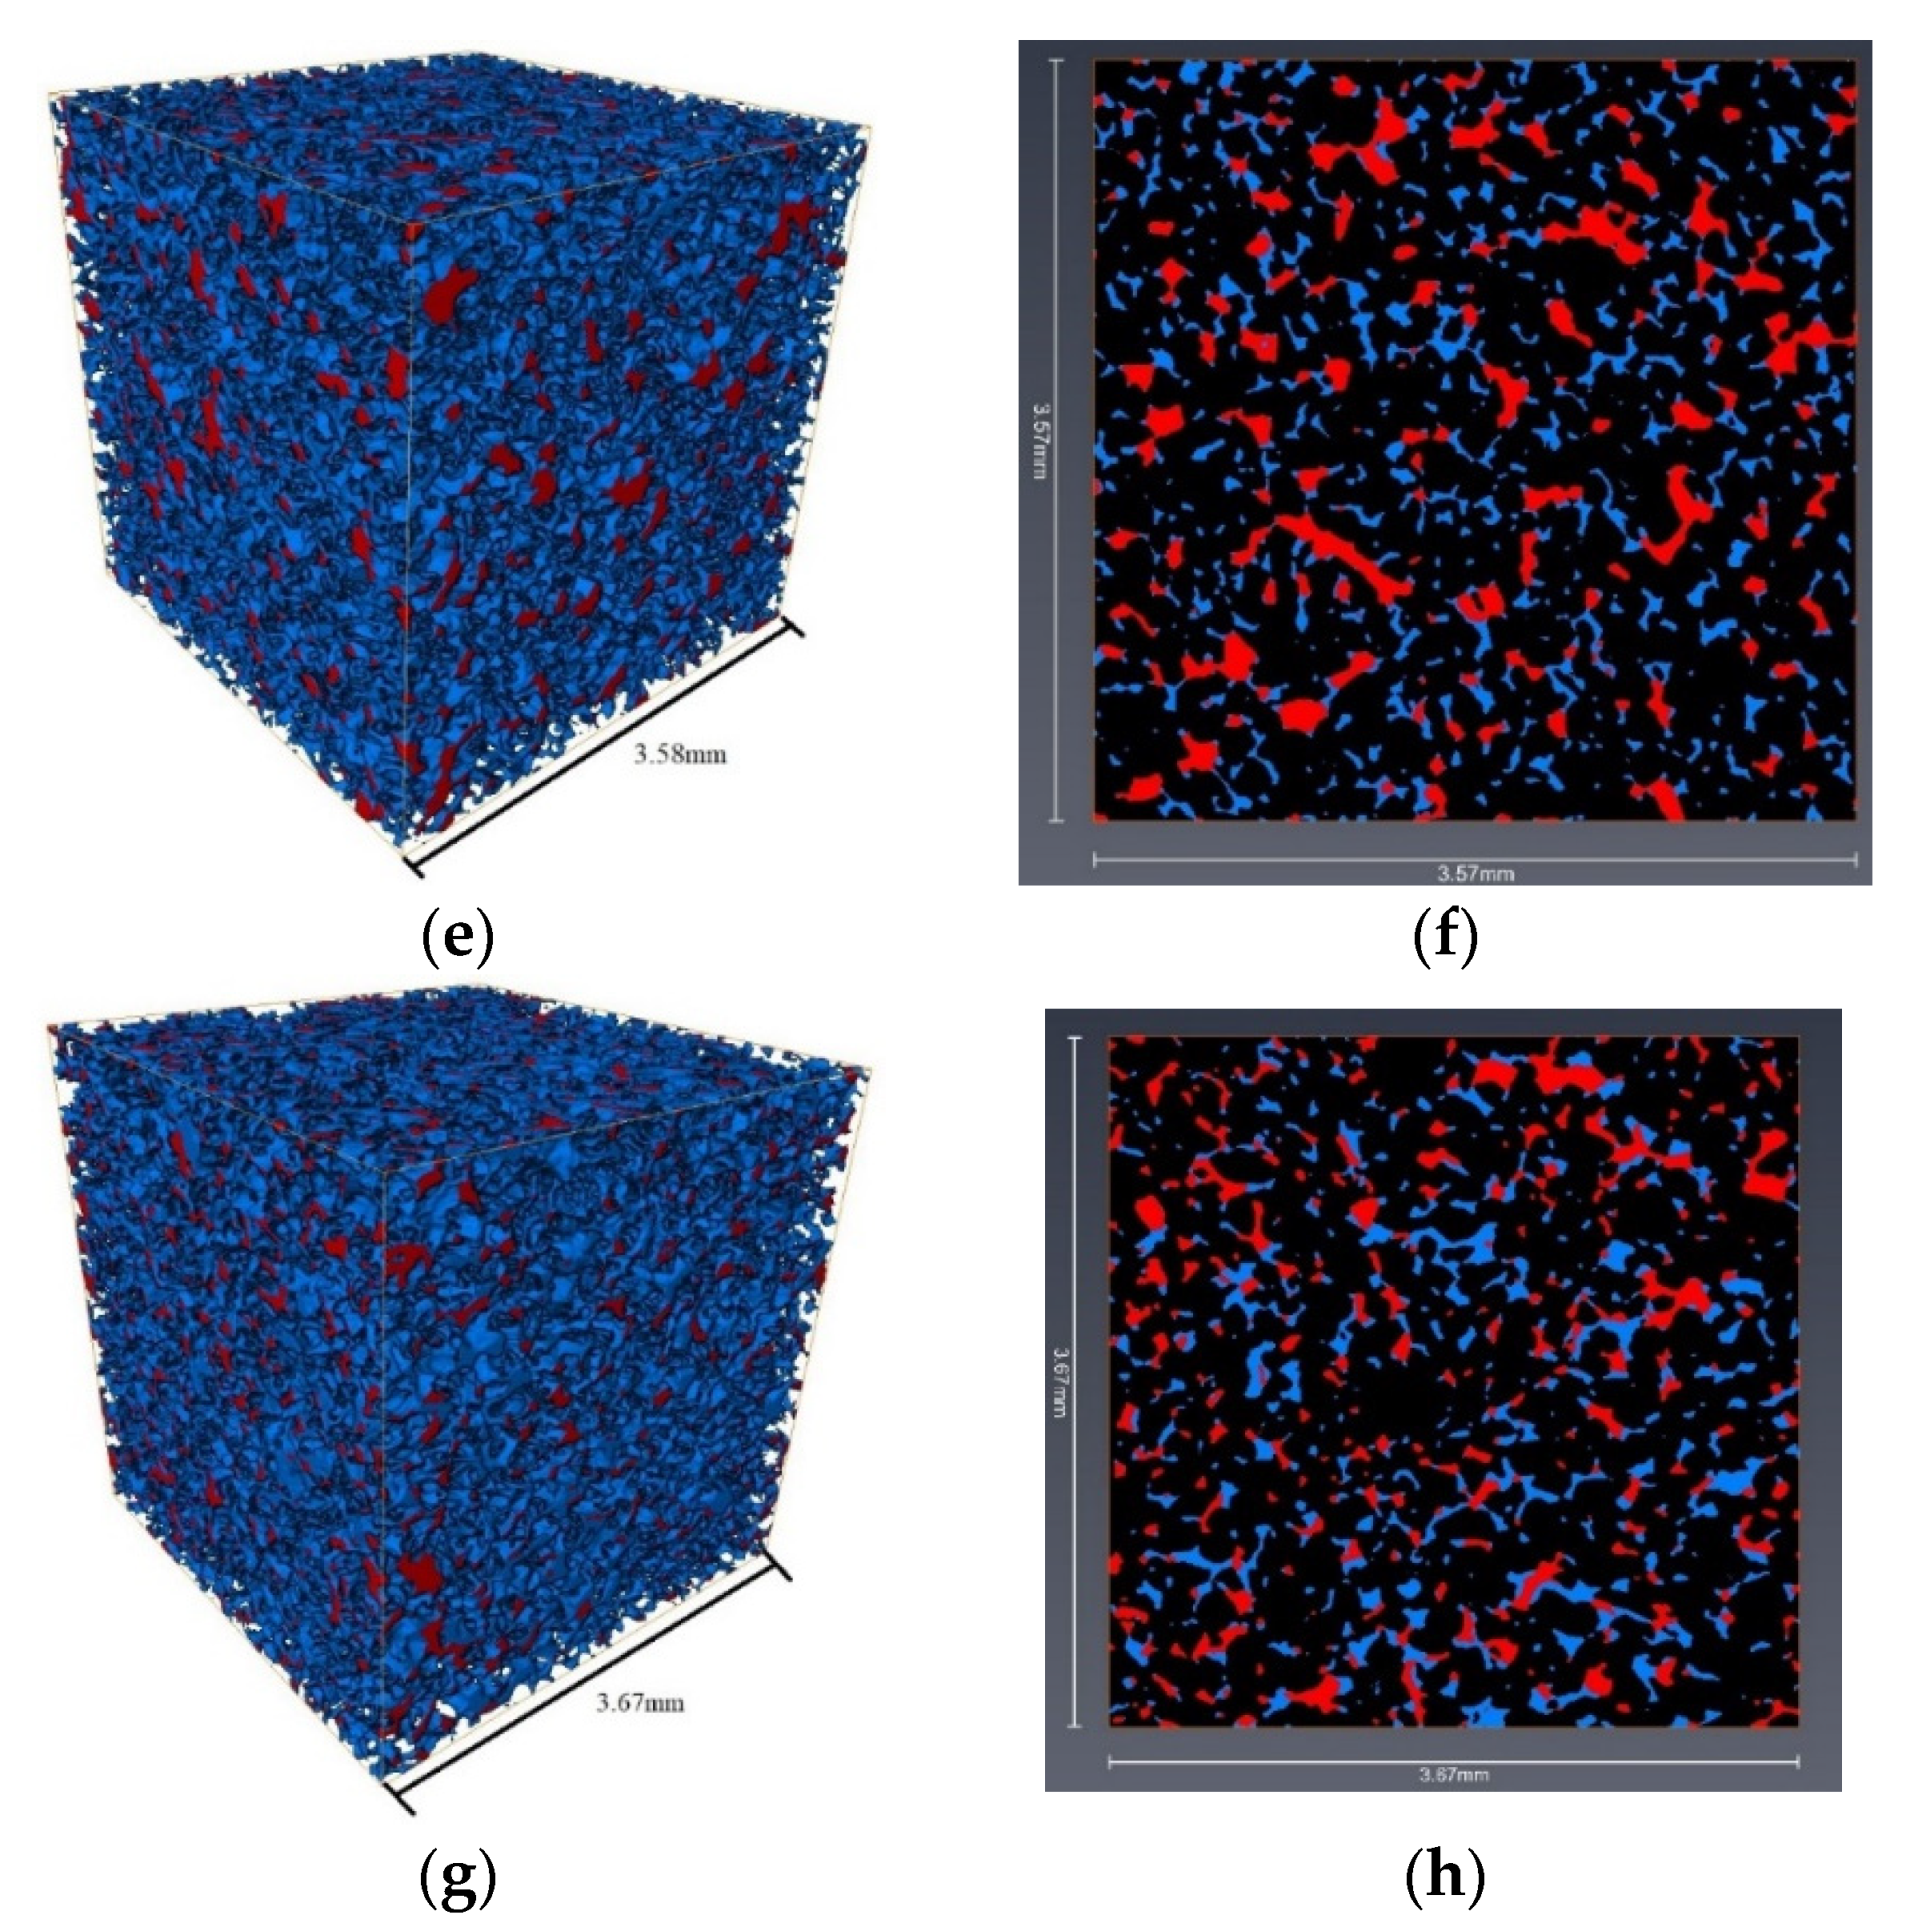
Figure 2.
Histogram plot showing the distribution of pores radius (a) and throats radius (b) for Bentheimer rock used in [15,41,42].
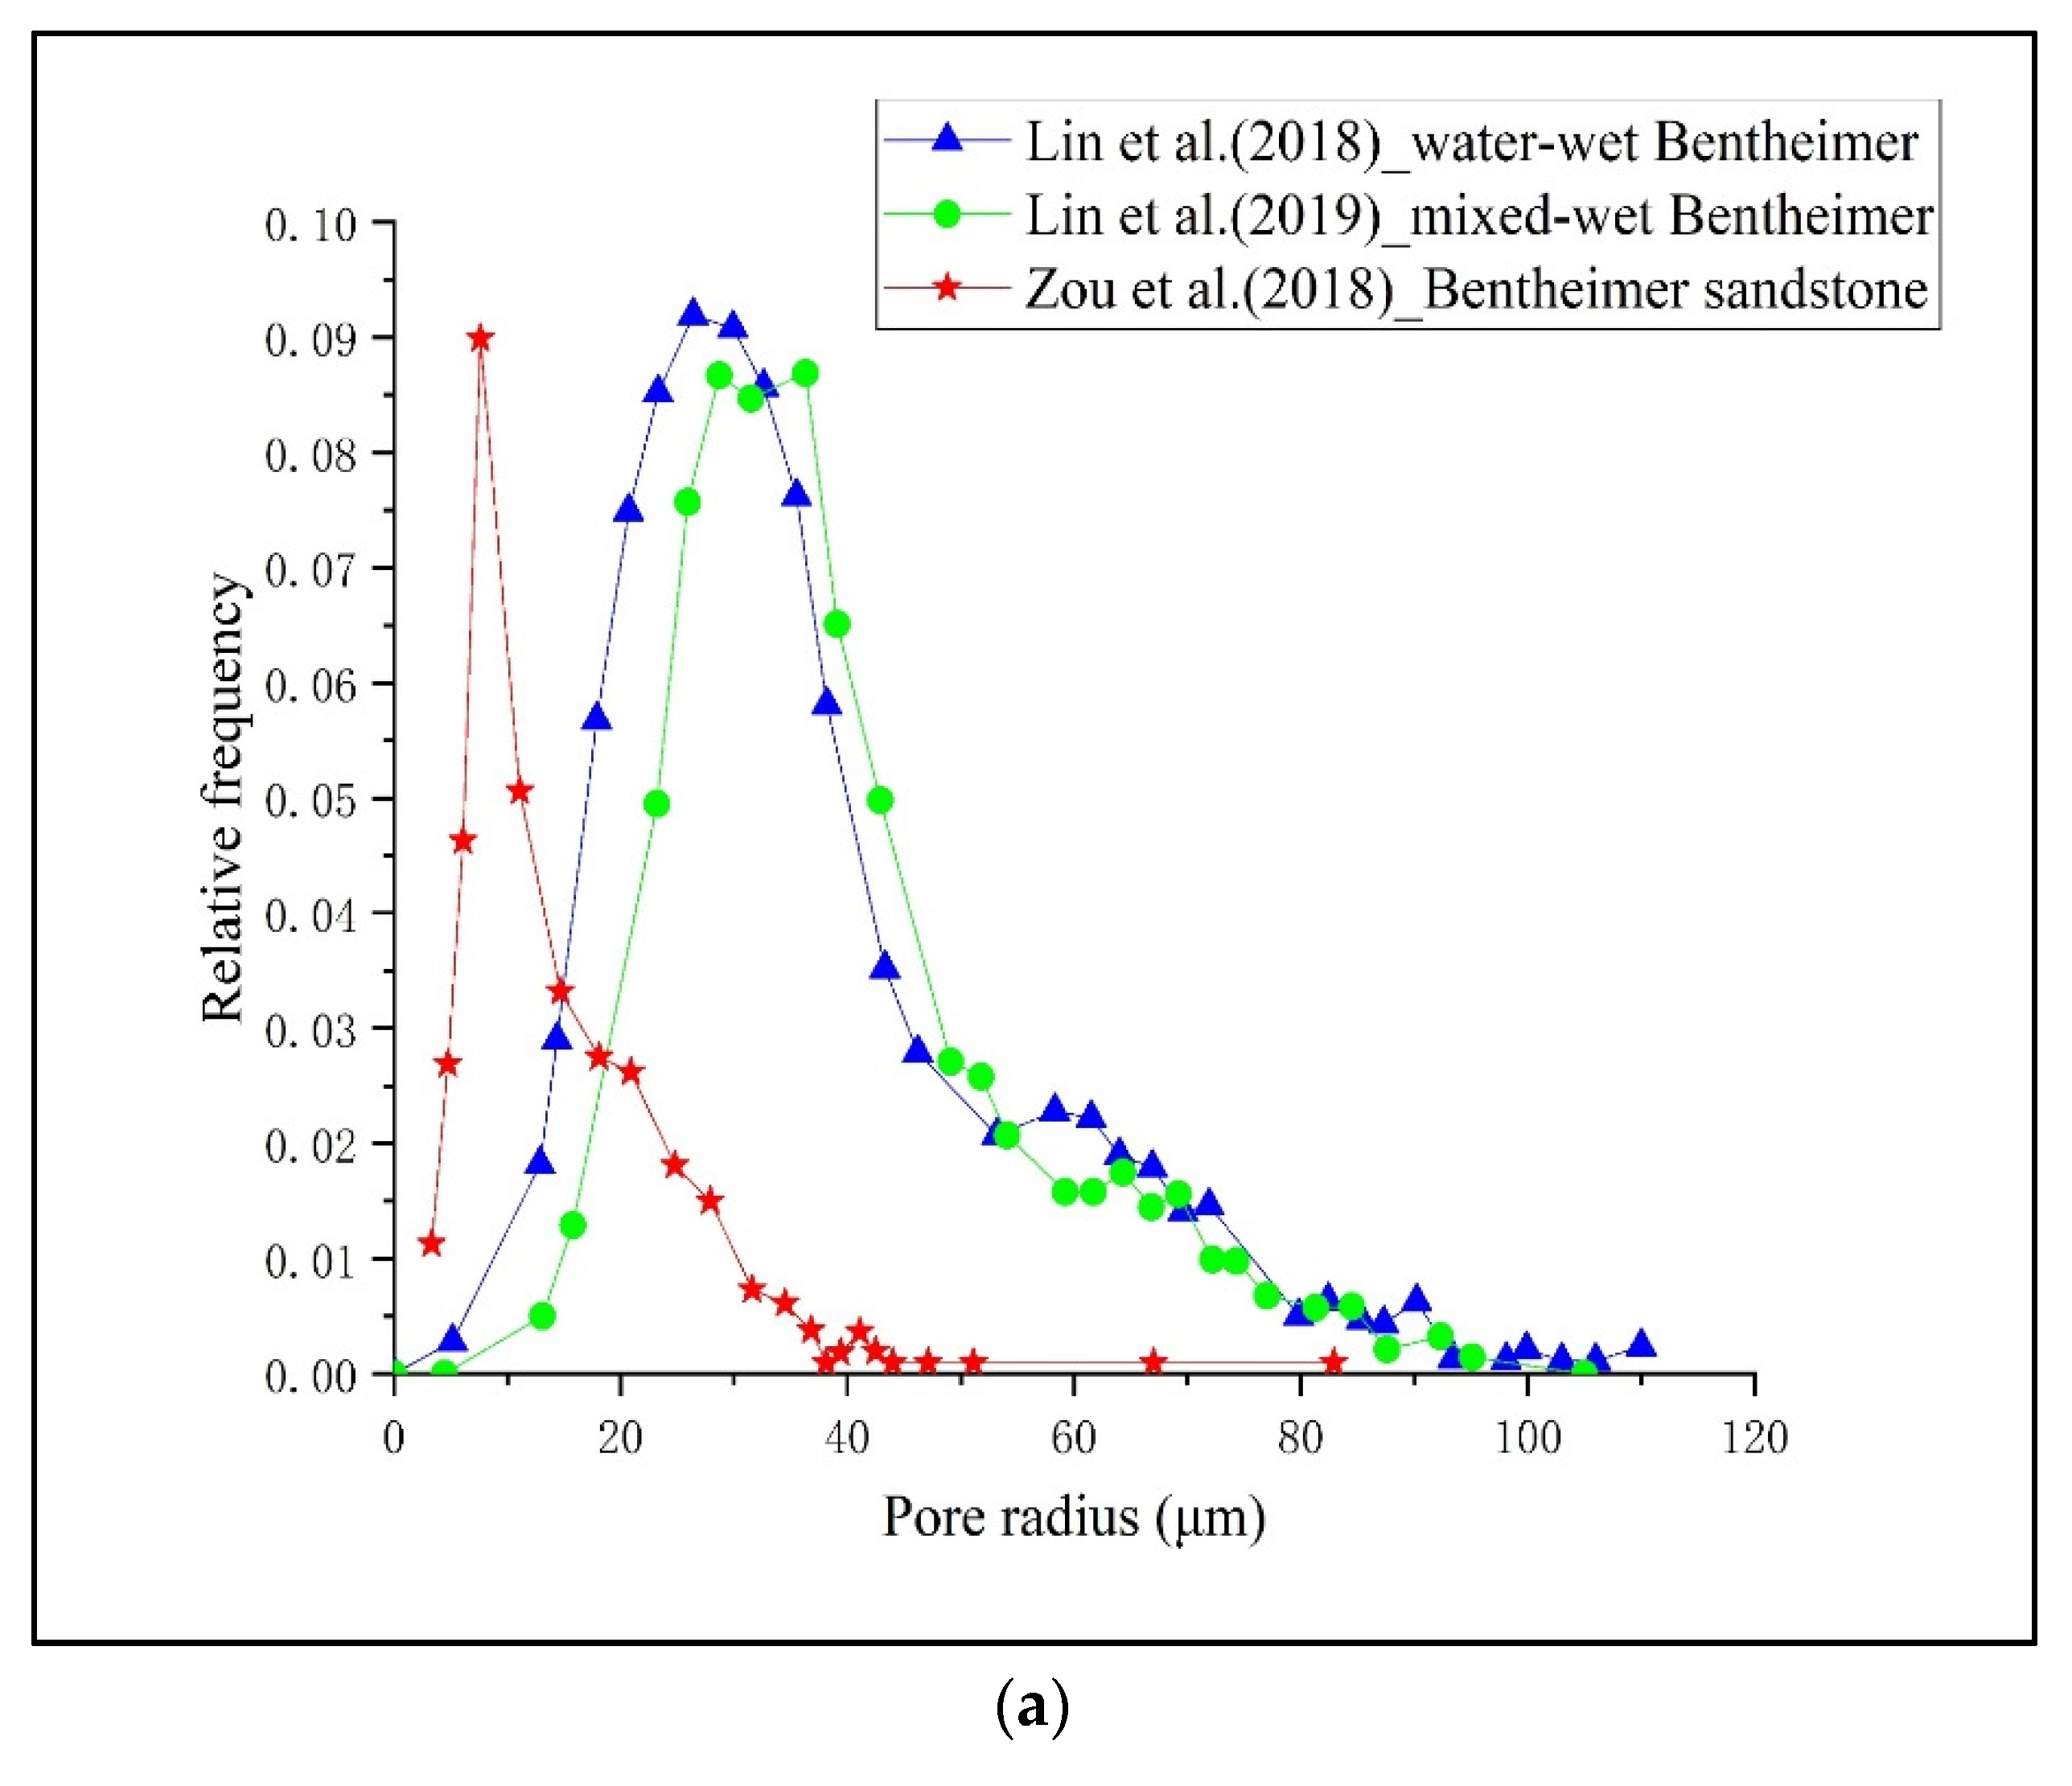
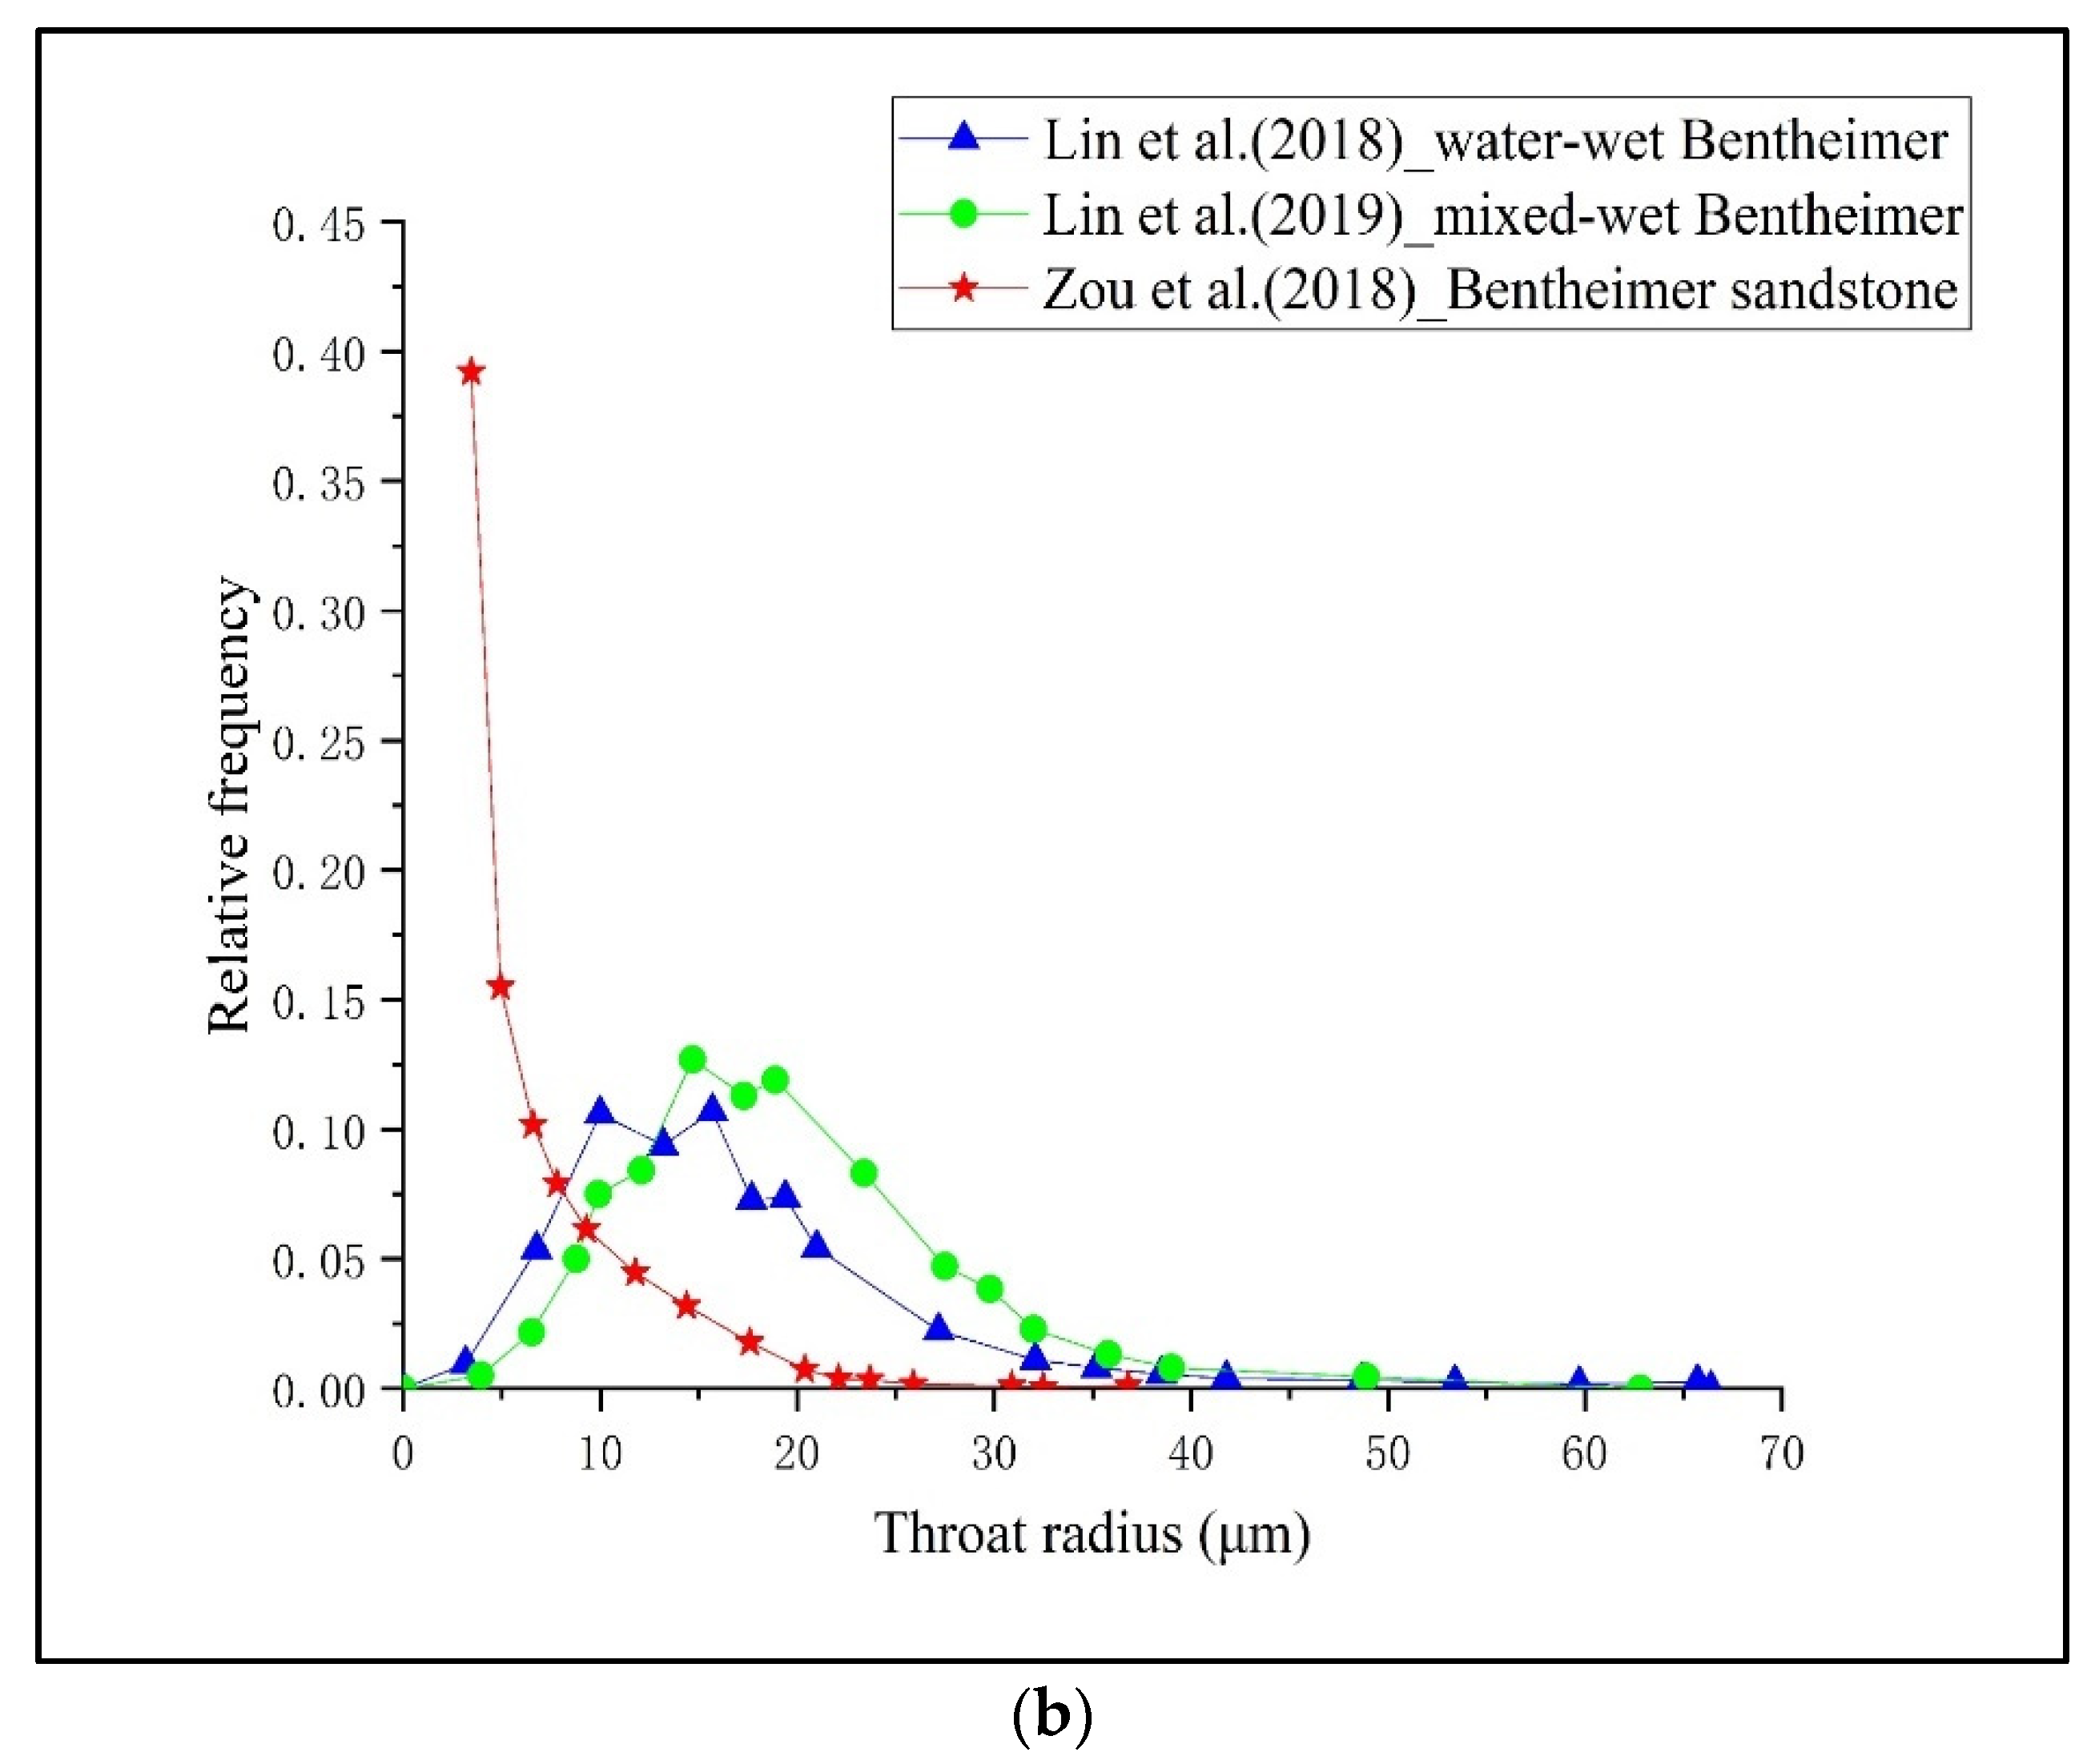
Figure 3.
Comparison of fractal dimensions for water phase (a) and oil phase (b) in water-wet and mixed-wet cases.
Figure 3.
Comparison of fractal dimensions for water phase (a) and oil phase (b) in water-wet and mixed-wet cases.
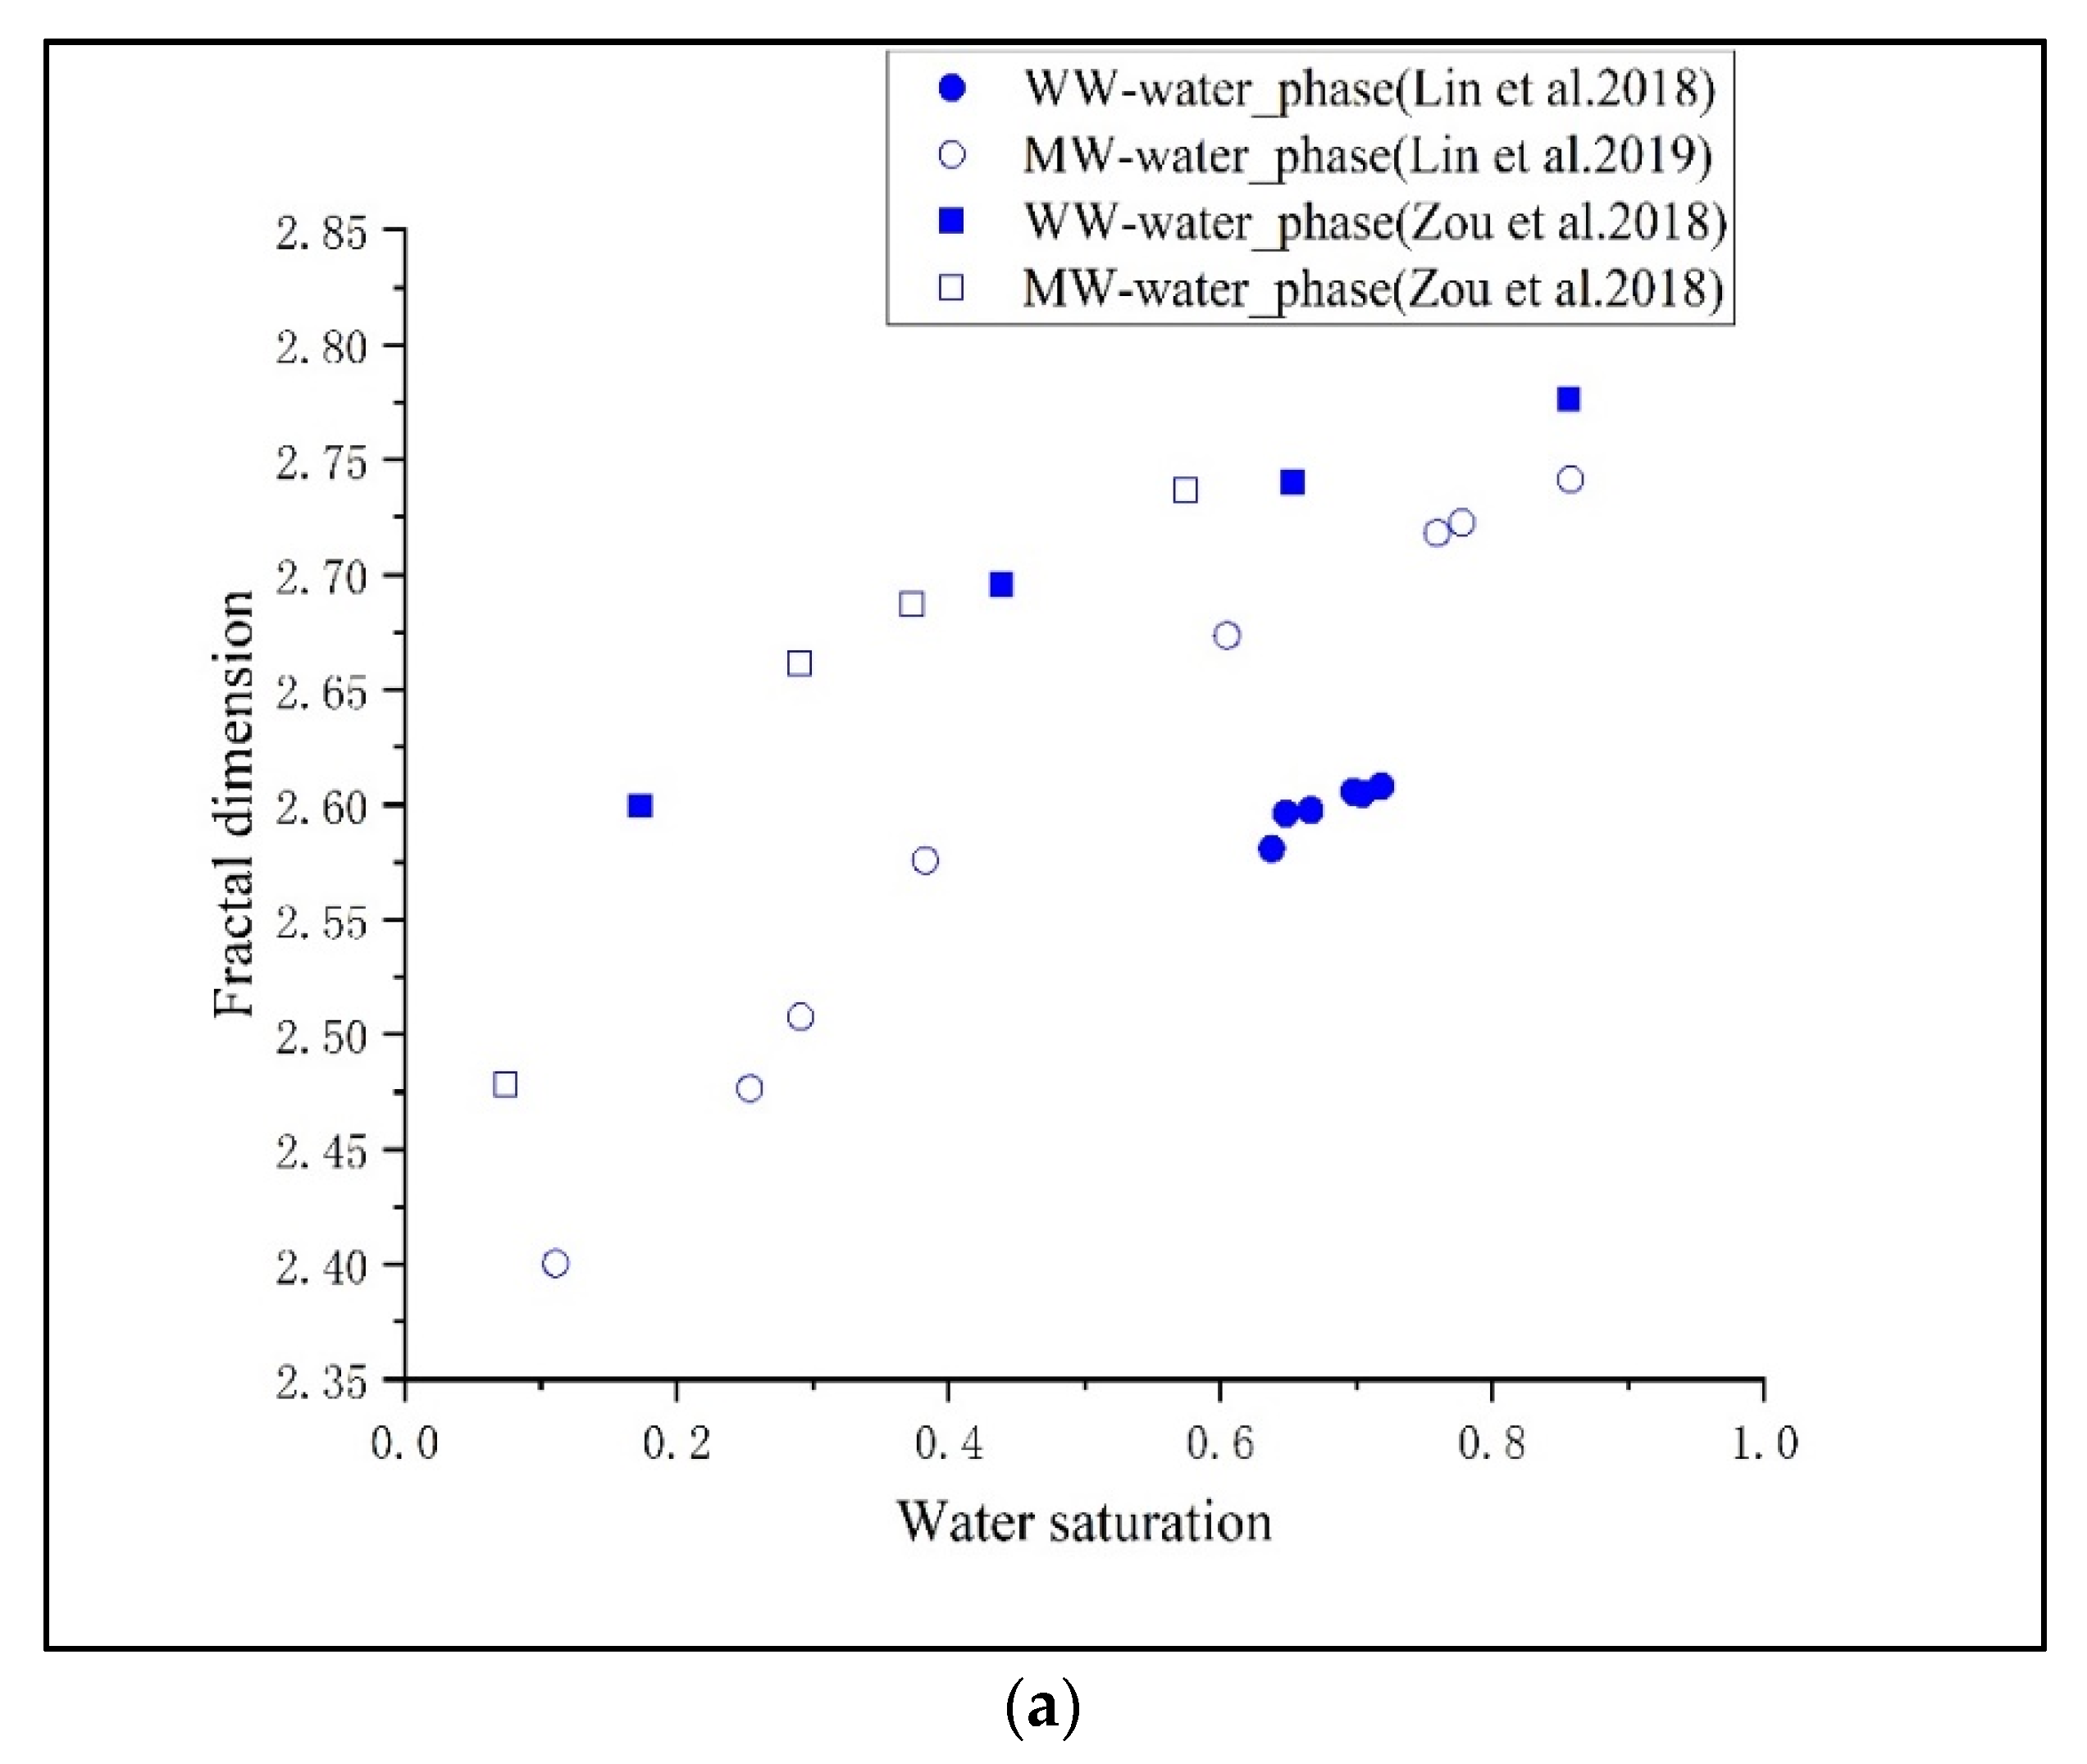
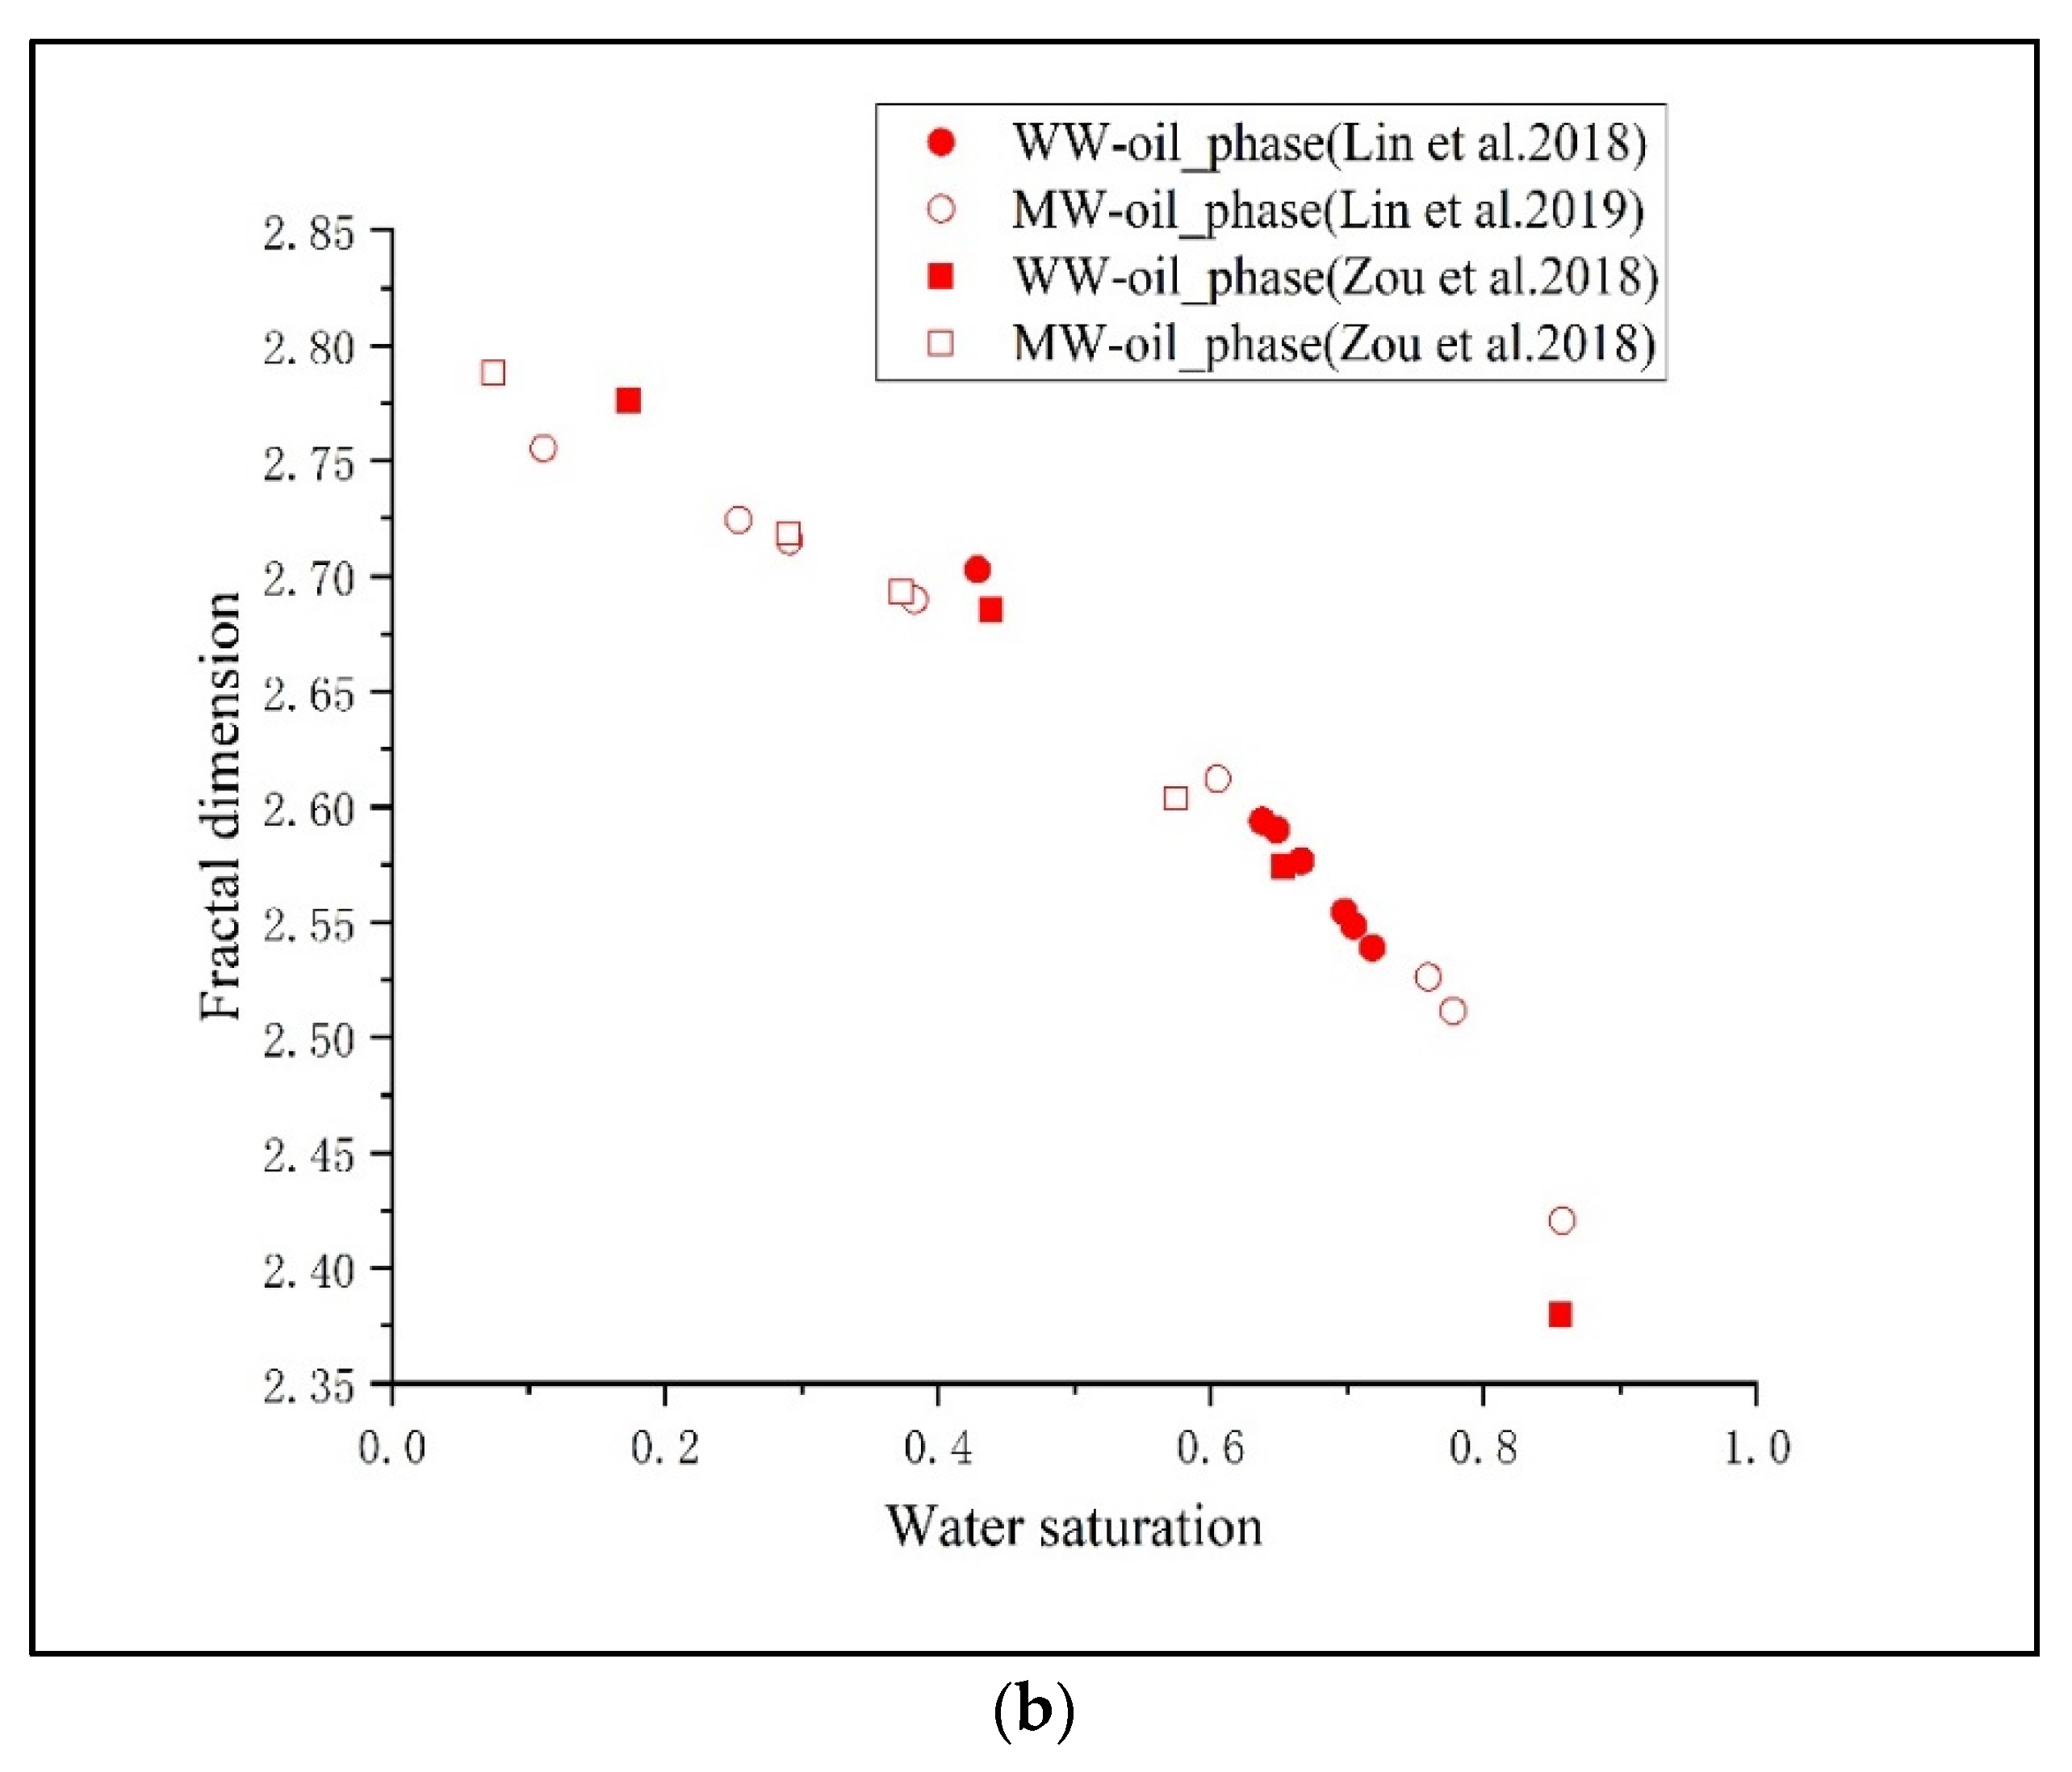
Figure 4.
Comparison of the normalized lacunarity results for water phase (a) and oil phase (b) in water-wet and mixed-wet cases.
Figure 4.
Comparison of the normalized lacunarity results for water phase (a) and oil phase (b) in water-wet and mixed-wet cases.
Figure 5.
Comparison of succolarity results along flow direction for water phase (a) and oil phase (b) in water-wet and mixed-wet cases.
Figure 5.
Comparison of succolarity results along flow direction for water phase (a) and oil phase (b) in water-wet and mixed-wet cases.
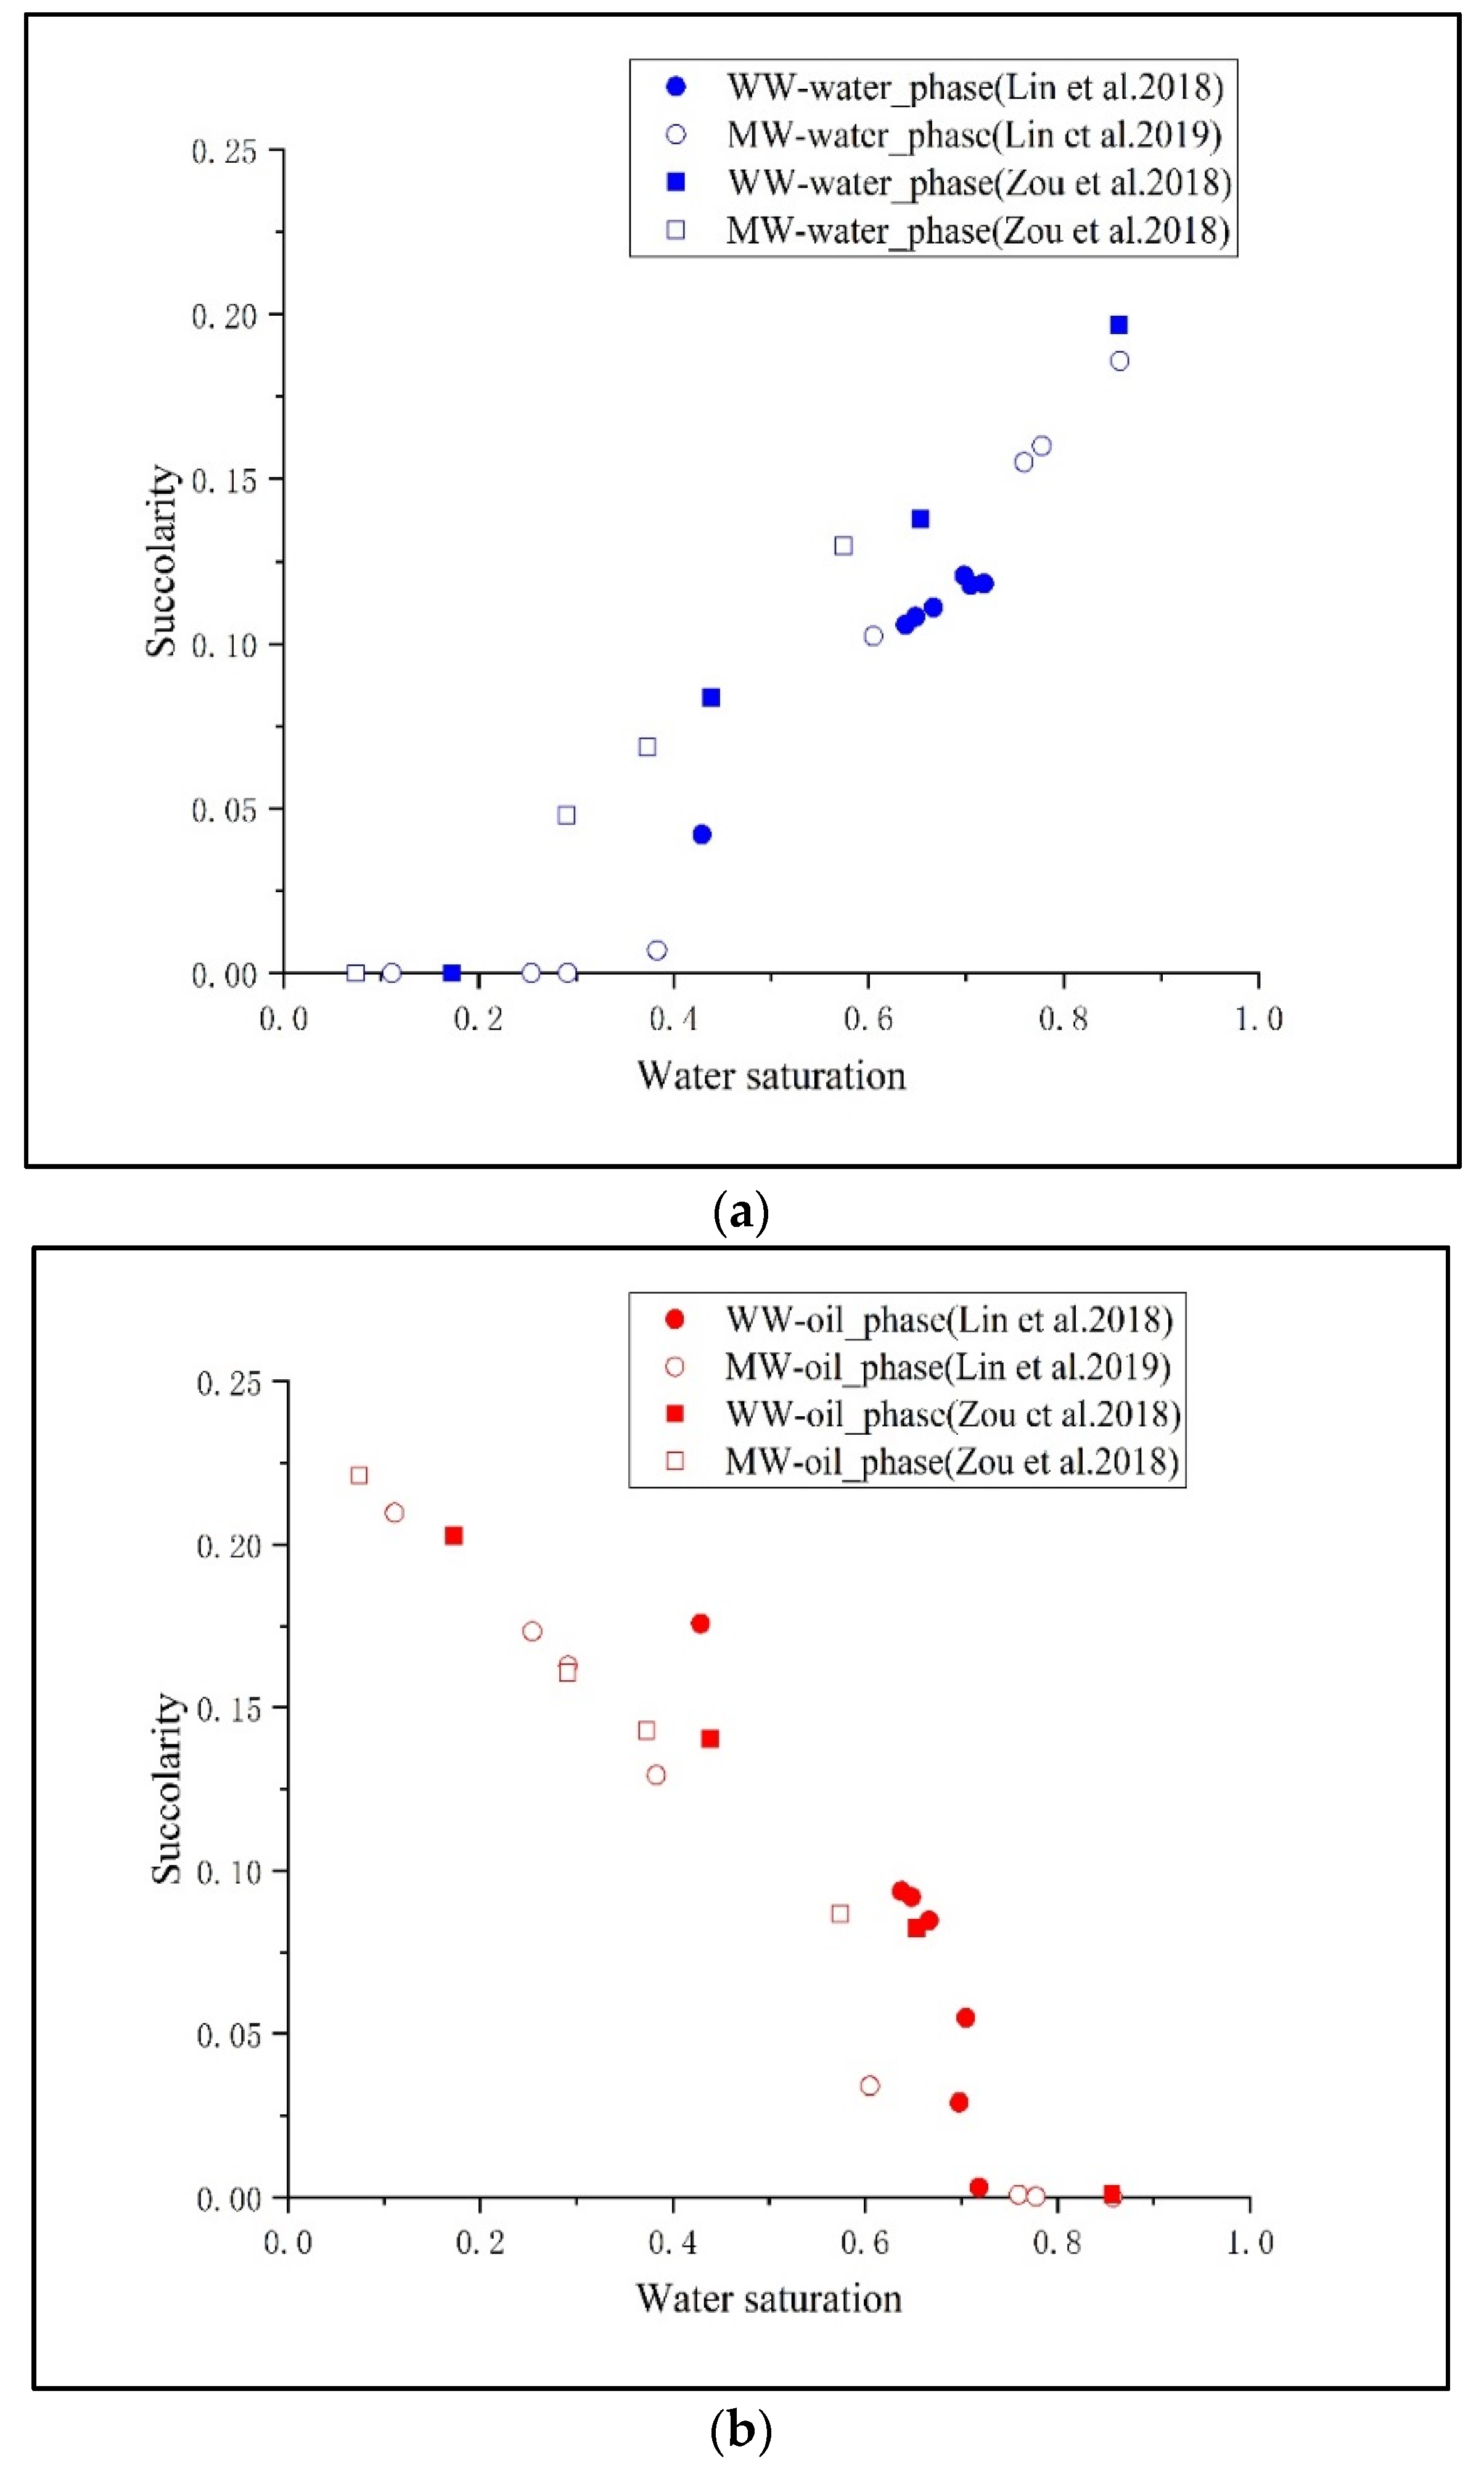
Figure 6.
Comparison of relative permeability results measured by the laboratory for water phase (a) and oil phase (b) in water-wet and mixed-wet cases for Zou’s [15] and Lin’s work [41,42].
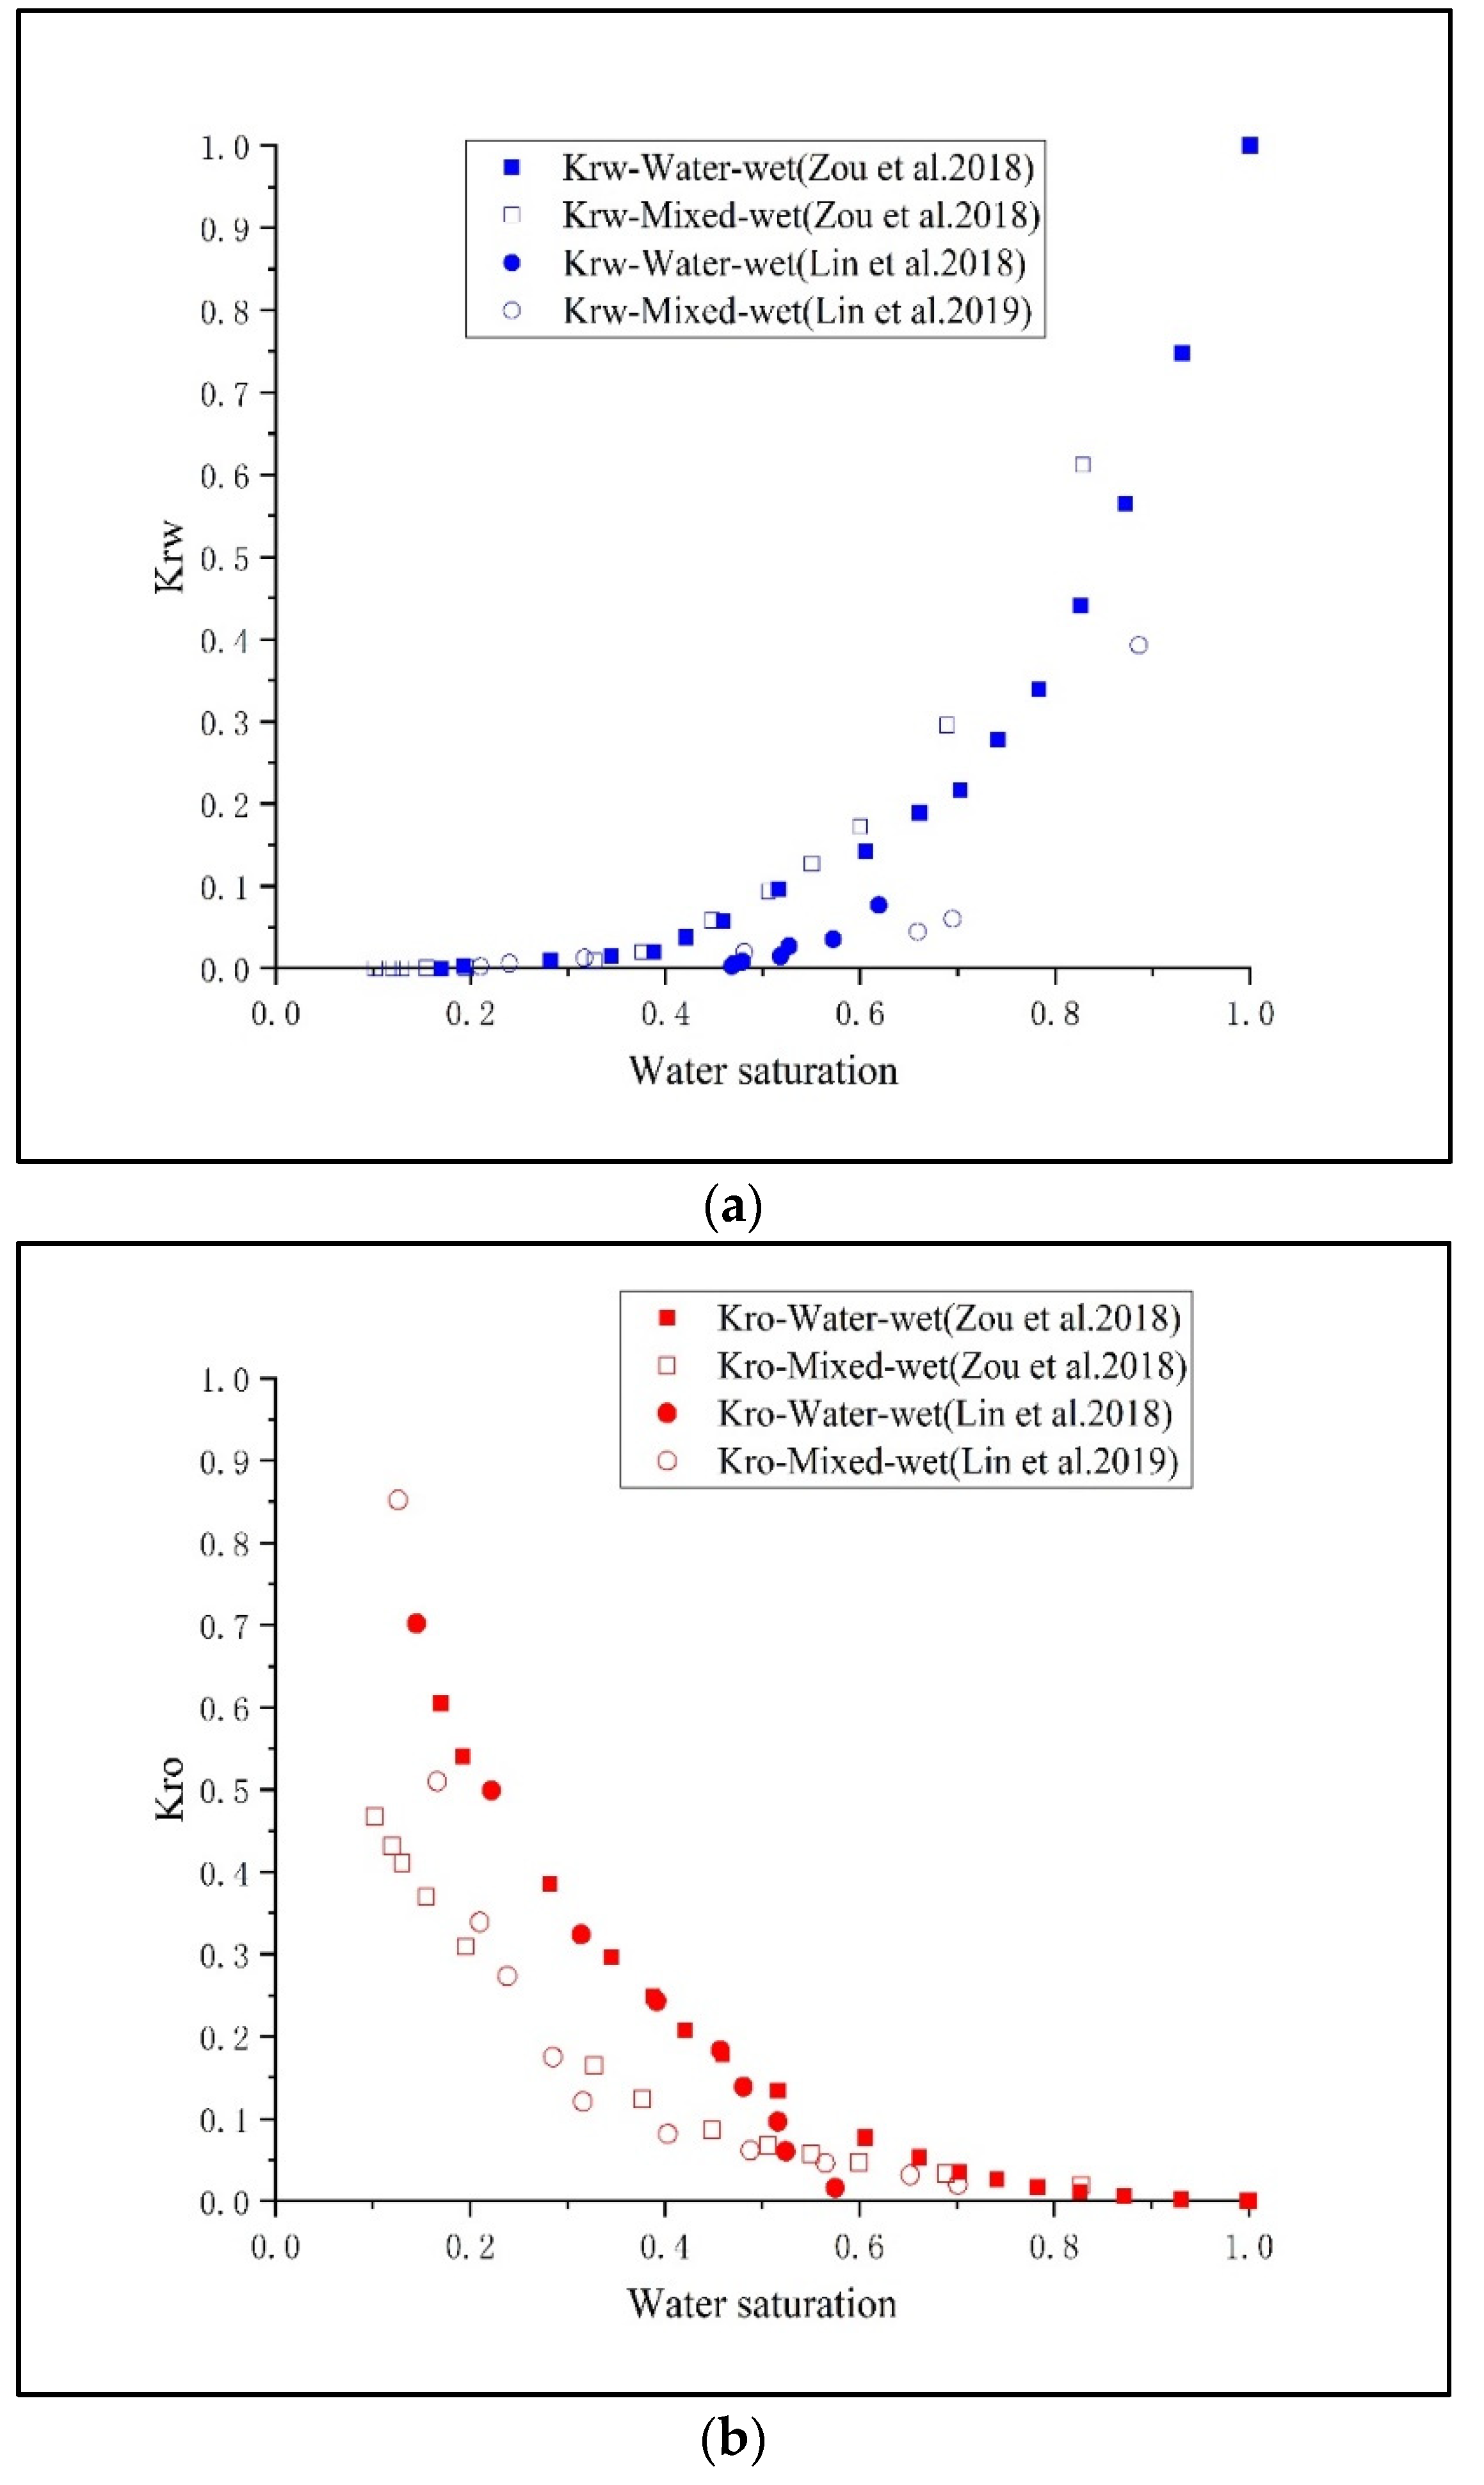
Figure 7.
Kro versus succolarity of the works and the fitting exponential model.

Table 1.
Summary of two-phase imaging experiments conducted under in situ imaging condition flow between this work and previous works for water-wet and altered-wet conditions.
Table 1.
Summary of two-phase imaging experiments conducted under in situ imaging condition flow between this work and previous works for water-wet and altered-wet conditions.
| Work | Porosity Based on CT Image | Total Flow Rate (mL/min) | Imaging Resolution (μm) |
|---|---|---|---|
| Zou et al. [15]—Water-wet | 0.245 | 1 | 5.56 |
| Zou et al. [15]—Mixed-wet | 0.245 | 1 | 5.56 |
| Lin et al. [41]—Water-wet | 0.348 | 0.02 | 3.58 |
| Lin et al. [42]—Mixed-wet | 0.231 | 0.03 | 3.58 |
Table 2.
Parameters for the exponential model fit y = a listed in Table 1.
Publisher’s Note: MDPI stays neutral with regard to jurisdictional claims in published maps and institutional affiliations. |
© 2022 by the authors. Licensee MDPI, Basel, Switzerland. This article is an open access article distributed under the terms and conditions of the Creative Commons Attribution (CC BY) license (https://creativecommons.org/licenses/by/4.0/).
Share and Cite
MDPI and ACS Style
Zou, S.; Xu, P.; Xie, C.; Deng, X.; Tang, H. Characterization of Two-Phase Flow from Pore-Scale Imaging Using Fractal Geometry under Water-Wet and Mixed-Wet Conditions. Energies 2022, 15, 2036. https://doi.org/10.3390/en15062036
AMA Style
Zou S, Xu P, Xie C, Deng X, Tang H. Characterization of Two-Phase Flow from Pore-Scale Imaging Using Fractal Geometry under Water-Wet and Mixed-Wet Conditions. Energies. 2022; 15(6):2036. https://doi.org/10.3390/en15062036
Chicago/Turabian StyleZou, Shuangmei, Peixing Xu, Congjiao Xie, Xuan Deng, and Haodong Tang. 2022. "Characterization of Two-Phase Flow from Pore-Scale Imaging Using Fractal Geometry under Water-Wet and Mixed-Wet Conditions" Energies 15, no. 6: 2036. https://doi.org/10.3390/en15062036
Note that from the first issue of 2016, this journal uses article numbers instead of page numbers. See further details here.