
A Multi-Scale Fractal Approach for Coal Permeability Estimation via MIP and NMR Methods
by
 , , ,
, , ,
Weiguang Ren
1 ,
,
Hongwei Zhou
2,3,*,
Jiangcheng Zhong
4,
Dongjie Xue
1,
Chaosheng Wang
5 and
Zelin Liu
1 1
School of Mechanics and Civil Engineering, China University of Mining and Technology, Beijing 100083, China
2
School of Energy and Mining Engineering, China University of Mining and Technology, Beijing 100083, China
3
State Key Laboratory of Coal Resources and Safe Mining, China University of Mining and Technology, Beijing 100083, China
4
School of Civil Engineering and Architecture, Linyi University, Linyi 276000, China
5
School of Civil Engineering, Henan University of Science and Technology, Luoyang 471000, China
*
Author to whom correspondence should be addressed.
Energies 2022, 15(8), 2807; https://doi.org/10.3390/en15082807
Submission received: 5 March 2022
/
Revised: 3 April 2022
/
Accepted: 10 April 2022
/
Published: 12 April 2022
(This article belongs to the Collection Flow and Transport in Porous Media)
Abstract
:Permeability in porous media has an important role in many engineering applications, which depends mainly on the pore size, distribution, and connectivity of porous media. As the pore structure distribution of coal has a multi-scale fractal dimension characteristic, this study aimed to propose a multi-scale fractal dimension characteristics units model (MFU) to describe the pore structure distribution by analyzing the multi-scale fractal dimension characteristics of coal pore media. Then, a multi-scale fractal permeability model was established based on MFU. The pore structure distribution was obtained by mercury injection porosimetry (MIP) and nuclear magnetic resonance (NMR) experiments. Based on MIP and NMR experimental data, the permeability contribution of different pore diameters were calculated. The results show that the permeability contribution of the micropore was minimal and can be ignored. The permeability contribution of mesopores was about 1–5%, and the permeability contribution of macropores was about 95–99%, which plays a decisive role in the seepage process. The calculated results, based on multi-scale fractal permeability model and the experimental permeability data, are in the same order of magnitude. The permeability prediction based on proposed model is better than classical single fractal permeability model.
1. Introduction
Permeability in porous media has an important role in many engineering applications, including the exploitation of deep resources, the underground storage of combat readiness energy, the geological disposal of CO2 and nuclear wastes, the exploitation of coal-bed methane, the water disaster of mine, etc. Permeability is a physical property of porous media, which depends mainly on the pore size, distribution, and connectivity of porous media. The porous media theory has commonly been applied to describe the permeability of porous media [1,2,3]. However, the pore structure is highly complex and disordered, which makes it difficult to describe the pore structure of porous media.
As it is hard to describe the pore structure of porous media with conventional geometric methods, the fractal geometry theory and methods were used to describe the pore structure by some researchers. Mandelbrot created the fractal geometry theory, using the fractal dimensions to describe the irregular and disordered phenomena and behaviors in nature [4]. The complex and disordered pore and fracture structure of rocks can be studied by fractal geometry theory, which can describe the physical and mechanical properties of rocks [5]. Friesen proposed a calculation method for the fractal dimension of the pore structure obtained by the mercury injection porosimetry (MIP) experimental data, and considered that the fractal dimension was not accurate in the case of high mercury intrusion pressure [6,7]. Xia analyzed the relationship between pore structure distribution and fractal dimension, and proposed a fractal dimension calculation method [8]. Zhang derived the fractal dimension formula by using the nuclear magnetic resonance (NMR) experimental data, which can better characterize the pore structure [9]. Wood analyzed the differences in the fractal dimension values calculated by different fractal calculation techniques, which were mainly due to line and curve fitting uncertainties [10]. Pia proposed the intermingled fractal units model based on Sierpinski carpet to describe pore structure, but the fractal dimension was not derived from experimental data and was presumed [11]. Zhou used the NMR and low temperature N2 adsorption (LTNA) experimental data to calculate the fractal dimension, which indicated that the pore structure had multi-scale fractal characteristics [12]. Zhao calculated the fractal dimension by using the NMR and micro X-ray computed tomography (micro-CT) experimental data, and the calculation results also showed that the pore structure had multi-scale fractal characteristics. Meanwhile, Zhao indicated that micro-CT could not effectively calculate the fractal dimension of pores with wide size distribution due to the limitation of resolution [13]. However, few studies have developed a fractal units model to describe the whole pore structure.
Previous studies show that fractal geometry theory had great potential in describing the pore structure. Therefore, many researchers have established fractal permeability models based on the fractal characteristics of porous media. A fractal permeability model was developed based on the fractal characteristics of pore structure, which was used in liquid composite molding [14,15]. Xu proposed a fractal permeability model used in bi-dispersed porous media, which did not contain any empirical constants [16]. Then, Chen derived an improved fractal permeability model used in the low permeability porous media, which considered the irreducible water saturation [17]. Chen proposed a new fractal expression of permeability based on intermingled fractal units model, which considered the geometry model for tortuosity of streamlines in three-dimensional porous media [18]. Luo derived an analytical expression of the fractal permeability model for dual-porosity media, which considered the tortuosity characteristics of dual-porosity media [19]. Ye derived a permeability equation based on fracture fractal dimension [20]. It is difficult to accurately predict the permeability of coal using a permeability prediction model based on a single fractal dimension; a better model is needed to accurately describe the relationship between pore structure and permeability.
In this study, the research purpose is to propose a permeability expression based on the multi-scale fractal characteristics, which can be applied for predicting permeability of porous media. The pore size distribution can be obtained by the MIP and NMR technique. The fractal characteristic of pore size distribution was analyzed, which presented a multi-scale fractal characteristic. The number of the fractal dimension can be confirmed by the pore size characteristic of the coal sample. The fractal dimension of different pore size ranges can be calculated by the Sierpinski fractal model. Then, the multi-scale fractal dimension characteristics units model (MFU) was established to describe the distribution characteristic of the pore-fracture structure, and a permeability expression was derived by MFU, Hagen-Poiseulle equation, and Darcy’s law.
2. Experimental Implementations
2.1. Coal Samples
Coal samples were taken from the working face, No. 31010 of the Ji-15 coal seam in Pingdingshan Coal Mine No. 12, Henan Province, China, at depths between 1006 m and 1137 m, with an average thickness of 3.3 m, and dip angle between 3° and 7°. The samples were processed into a standard size with Φ25 × H50 mm. The allowable deviation of the diameter was less than 0.2 mm, the allowable deviation of the unevenness of the two end faces were less than 0.05 mm, and the vertical deviation of the end face and the axis did not exceed ±0.25°.
2.2. Experimental Facilities and Procedures
All samples were dried to a constant weight at 105 °C for 24 h, and then cooled to room temperature. The helium porosity and air permeability were analyzed using an AP608 automated permeameter-porosimeter. Then, three samples were used for MIP experiments, and the other three samples were used for NMR experiments. These experiments can characterize the pore structure of coal samples.
The MIP experiments were conducted by using a mercury intrusion porosimeter (AutoPore IV 9505, Micromeritics, Houston, TX, USA and corelab CMS300, Core Laboratories, Houston, TX, USA), in accordance with the standard SY/T5346-2005 and SY/T5336-2006. Mercury injection test included the process of mercury injection and mercury ejection. The maximum experimental pressure was 200 MPa.
The NMR experiments were conducted by using the NMR analyzer (MacroMR12150H-I, Suzhou Niumag Analytical Instrument Corporation, Suzhou, China). The coal samples were vacuumed and then immersed in water with 15 MPa for another 24 h at room temperature. Finally, the samples were coated by polytetrafluoroethylene and put into the NMR analyzer to measure the T2 distribution. Polytetrafluoroethylene can prevent the water in the air from entering coal samples and avoid water evaporation in coal [21]. The magnetic strength was constant at 0.3 T, and the resonance frequency was 12.8 MHz. The Carr-Purcell-Meiboom-Gill (CPMG) sequences tests are used to monitor the T2 distribution. The main experiment parameters of the CPMG sequence were set up with a waiting time of 5000 ms, echo time of 0.1 ms, scan number of 64, and echo number of 6000. Paramagnetic minerals directly affected the internal gradient field of the core. However, the magnetic strength of the permanent magnet used in the experiment was not high (i.e., 0.3 T), and the echo time used in the NMR test was very small (0.1 ms). Hence, the influence of the internal gradient was controlled to the minimum range.
2.3. MIP and NMR Theory
The mercury-injection method was based on the capillary bundle model. It was assumed that the porous medium was composed of different capillary bundles. The pore radius, , can be obtained by Washburn equation [22]:
where is the interfacial tension (0.480 N/m), is the three-phase contact angle (140°, cosθ = 0.765), and is mercury intrusion pressure.
NMR technology reflects the pore structure by measuring the NMR relaxation signals distribution of hydrogen atoms in pores.
NMR technology measures the NMR relaxation signals distribution of hydrogen atoms in pores. The NMR relaxation signals can be obtained by radiofrequency scanning of hydrogen atoms. Carr-Purcell-Meiboom-Gill (CPMG) sequence was used to measure transverse relaxation time (T2) and amplitude [23,24]. The transverse relaxation time (T2) can be expressed by [25]:
where is the surface relaxivity ( takes 5 μm/s in this study), T2 is transverse relaxation time, is surface area, V is volume, and F is the shape factor of pore. F is 2 for columnar pores and 3 for spherical pores, respectively.
2.4. Experimental Data Analysis
2.4.1. Experimental Data of MIP
The experimental data of coal samples with MIP is shown in Figure 1. There was an obvious hysteresis loop between injection curve and ejection curve, which were caused by the ink bottle holes in the coal sample. The sorting coefficient of three coal sample (M1, M2, and M3) were 2.799, 3.035, and 3.751, respectively, which indicate the coal samples have fine sorting. The displacement pressures of three coal samples were 0.261 MPa, 0.261 MPa, and 0.138 MPa, respectively, and the corresponding maximum pore radii were 2.814 μm, 2.813 μm, and 5.332 μm. The maximum mercury saturations of three coal samples were 69.492%, 82.271%, and 90.877%, respectively, and residual mercury saturations were 20.065%, 28.761%, and 30.690%. Therefore, the efficiency of mercury ejection can be calculated, which is 71.126%, 65.041%, and 66.230%, respectively. The pore structure of coal samples had good connectivity. According to IUPAC [26] and Hodot [27], the pore networks can be classified into five types: micropore (<0.01 μm), transition pore (0.01–0.1 μm), mesopore (0.1–1 μm), macropore (1–10 μm), and microfracture (>10 μm), respectively. Through data analysis of the samples in this study, the pore can be divided into three types according to size: micropore (<0.01 μm), mesopore (0.01–1 μm), and macropore (>1μm). The distribution of porosity is showed in Table 1.
2.4.2. Experimental Data of NMR
The experimental data of coal samples with NMR are shown in Figure 2. Each curve clearly had three waves (A1, A2, and A3). The boundaries between the three waves were 1 ms and 100 ms, respectively. The three waves (A1, A2, and A3) correspond to micropore (<0.01 μm), mesopore (0.01–1 μm), macropore (>1 μm), respectively. The peak of A1 was obviously higher than other two waves, which indicates that the micropore was more developed. The mesopore and macropore had no obvious distributing characteristics. The pore radius distribution was interrupted at the boundary of micropore and mesopore. The mesopore of sample N1 was approximately equal to macropore. The mesopore of sample N2 was smaller than macropore. The mesopore of sample N3 was larger than macropore. The results are listed in Table 2.
3. Permeability Formulas Derivation Based on MFU
3.1. Fractal Characteristics of Porous Media
French scientist Mandelbrot created the fractal geometry theory, which was used to describe irregular and disordered phenomena and behaviors in nature [4]. Many previous studies have proven that the pore structure of coal have fractal characteristics [5,28].
Coal samples are porous media with various pore sizes, which can be considered as tortuous capillary tubes with variable cross-sectional areas. Therefore, the pore sizes can be considered as the diameters of capillaries. The cumulative number, , of capillary tubes for unit cross-sectional areas whose radii are greater than or equal to the pore radius is given by the following [4]:
where is pore radius, is the factor of fractal coefficient, and is the fractal dimension.
Therefore, we can get the total number of capillaries or pores with sizes between and though differential equation.
We set the volume of the unit as . c is the shape factor of pore. We can get the volume of the pores whose radii are smaller than or equal to the pore radius, .
where is minimum pore radius.
Therefore, the total volume of the pores can be calculated.
The cumulative pore volume fraction whose radii are less than or equal to the pore radius can be obtained.
where is the cumulative pore volume fraction when the pore radius is less than or equal to the pore radius, .
Due to << , Equation (8) can be simplified.
By substituting Equation (1) into Equation (9), the relationship between the cumulative pore volume fraction and mercury intrusion pressure can be obtained.
Applying logarithms to Equation (10), it can then be expressed as:
There is a linear relationship between and . The fractal dimension, based on MIP, can be calculated by Equation (11).
By substituting Equation (2) into Equation (9), the relationship between the cumulative pore volume fraction and transverse relaxation time () can be obtained.
Applying logarithms to Equation (12), it can then be expressed as:
There is a linear relationship between and . The fractal dimension, based on NMR, can be calculated by Equation (13).
3.2. Multi-Scale Fractal Dimension Characteristics Units Model
Many previous studies indicate that the pore structure has multi-scale fractal dimension characteristics [13,30,31]. Therefore, only a basic description is included here. The fractal dimension of the pore structure is not a constant across the whole range of pore radius. The pore structure of coal samples has different fractal dimensions with different radii range. The whole range of pore radius can be divided into some interval. The pore structure in the interval can have a better fractal characteristic. Therefore, a multi-scale fractal dimension characteristics units model can be developed to describe the whole pore structure. The schematic diagram of MFU is shown in Figure 3.
3.3. Multi-Scale Fractal Permeability Expression
The flow rate though a single tortuous capillary was given by the Hagen–Poiseulle equation [32].
where is the fluid viscosity, is the pressure gradient along the tortuous capillary, is average tortuosity of the capillaries, and is the straight length of the capillary.
The flow rate for the capillaries with the radii between and can be given by the integral of the flow rates from the to capillaries.
Inserting (5) and (14) into (15) yields:
where is average tortuosity of the capillaries with radii between and .
The total flow rate for the whole cross-sectional area can be obtained by the cumulation of .
The average tortuosity, , can be calculated by the following expression [33].
where the is the porosity of the capillaries with radii between and .
The can be expressed by the following relationship.
where is the volume of the coal sample.
Simultaneously, through Equation (16) and Darcy’s law, multi-scale fractal permeability expression can be expressed as the following:
4. Results and Discussion
4.1. Fractal Characteristics of Pore Size Distribution
4.1.1. Fractal Characteristics of Pore Size Distribution Base on MIP
The fractal dimension can be calculated from the slope of the curves of lgS versus lgP. Figure 4 shows the relationship between lgS and lgP in the entire pore size range for three coal samples (M1, M2, and M3). The correlation coefficients of fitting vary from 0.54 to 0.66, which suggests that the pore structure in the whole scale obtained by MIP has no obvious fractal characteristics. The fractal dimension of the pore structure is not a constant in the entire range of pore radius.
Figure 5 shows the relationship between lgS and lgP in the range of micropore, mesopore, and macropore for three coal samples. For the coal samples (M1, M2 and M3) in this study, the fractal dimensions of micropore (D1) ranges from 1.160 to 1.212, the fractal dimensions of mesopore (D2) ranges from 2.831 to 2.888, and the fractal dimensions of macropore (D3) ranges from 2.947 to 2.978. The correlation coefficients are all larger than 0.85, which suggests that the pore structure has obvious fractal characteristics in macropore, mesopore, and micropore, respectively. The fractal dimension is positively correlated with radii. The values of D1 are obviously less than D2 and D3, which indicate that the mesopore and macropore are more complex than micropore.
4.1.2. Fractal Characteristics of Pore Size Distribution Base on NMR
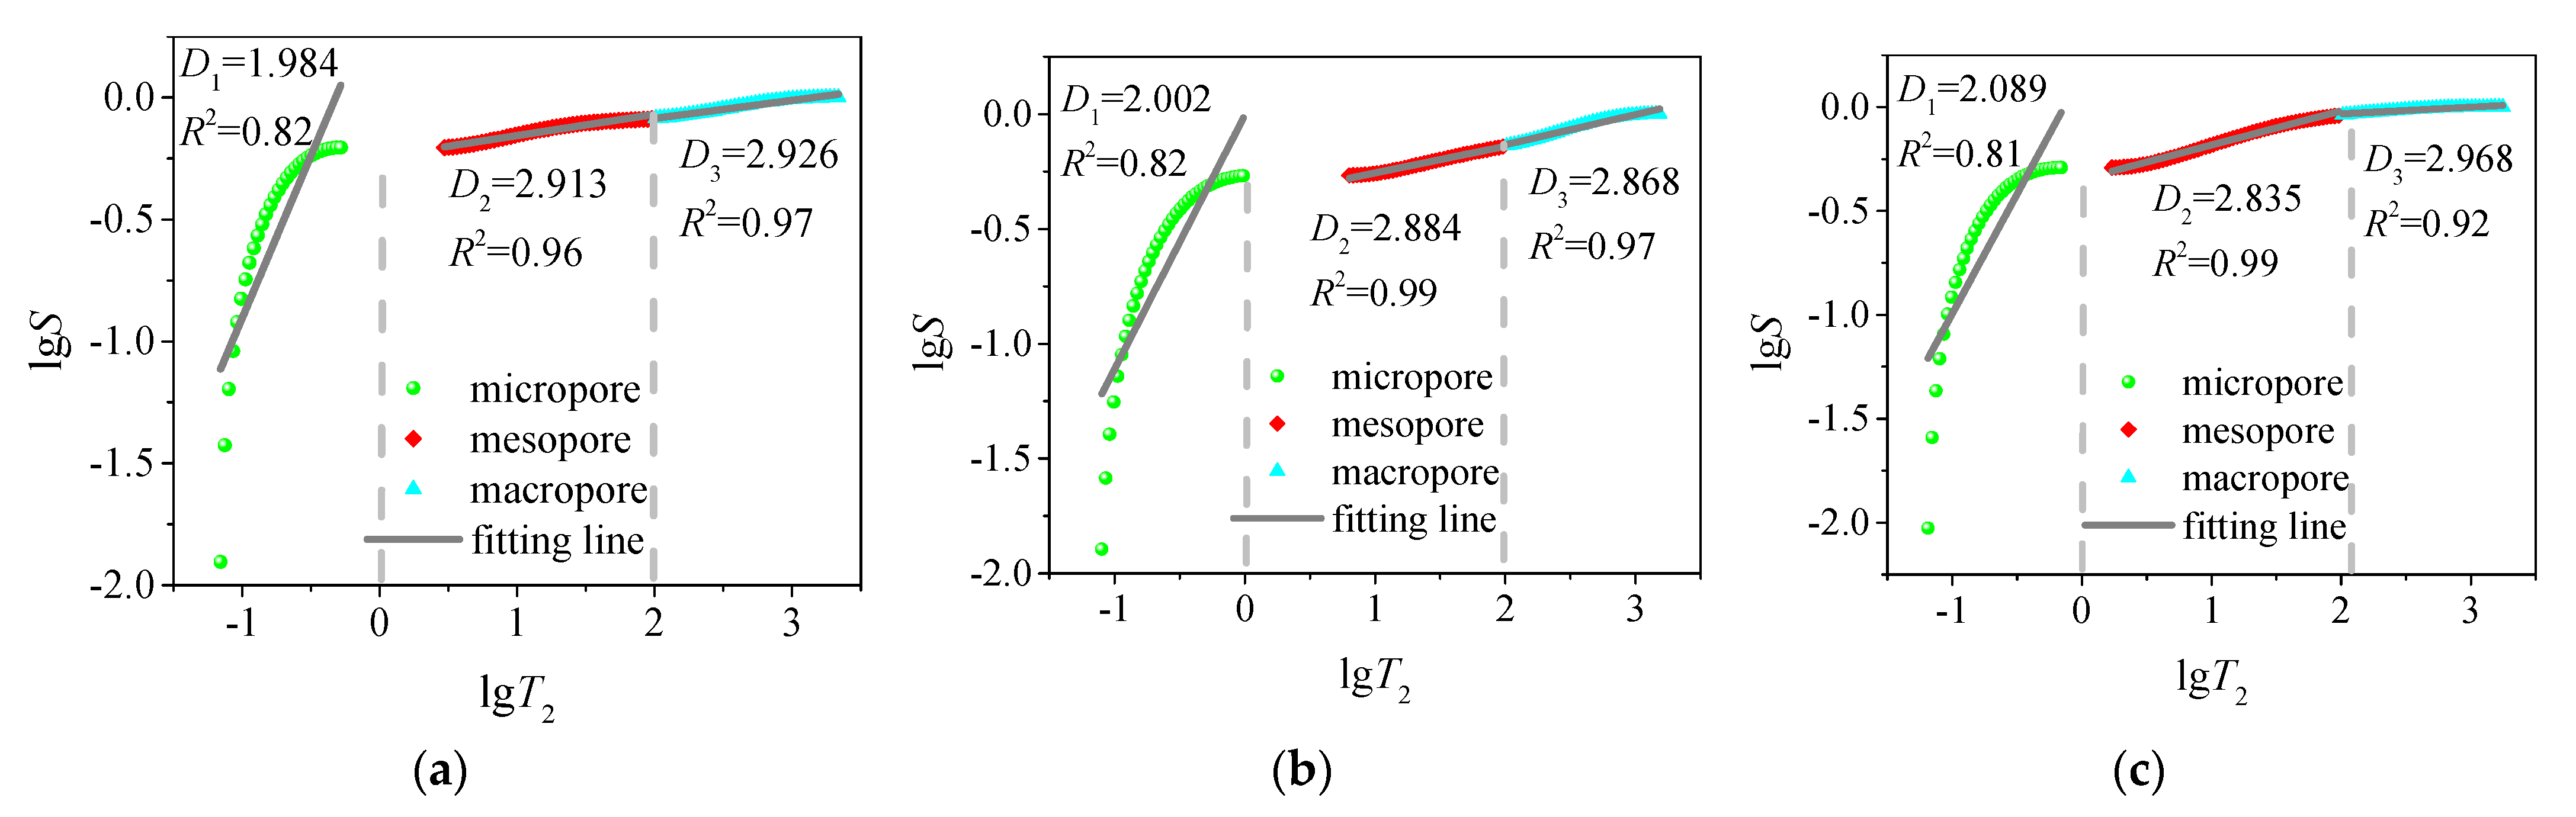
Through data analysis of three coal samples tested by NMR, the relationship between lgS and lgT2 can be obtained (Figure 6 and Figure 7). The fractal dimensions can be calculated from the slope of the curves lgS versus lgT2. Figure 6 shows the relationship between lgS and lgP in the total pore size range for three coal samples (N1, N2, and N3), and the correlation coefficients of fitting were less than or equal to 0.6, which also suggests that the pore structure in the whole scale obtained by NMR had no obvious fractal characteristics.
Figure 7 shows the relationship between lgS and lgP in the range of micropore, mesopore, and macropore for three coal samples. The pore radius distribution was interrupted at the boundary of the micropore and mesopore. For the coal samples (N1, N2, and N3), the fractal dimensions of micropore (D1) ranged from 1.984 to 2.089, the fractal dimensions of mesopore (D2) ranged from 2.835 to 2.913, and the fractal dimensions of macropore (D3) ranged from 2.868 to 2.968. The correlation coefficients of D2 and D3 were both larger than 0.9. The D1 had a lower correlation coefficient, but it was also higher than 0.8. The values of D2 and D3 were approximately equal. The fractal dimensions of N1 and N3 were positively correlated with radii. However, the D2 of N2 was larger than the D3 of N2.
4.2. The Permeability Contribution of the Different Fractal Dimension
The permeability contribution of capillaries or pores with the pore radius, , was characterized by the following expression [34].
where is the permeability contribution of capillaries of radius, ; is the pore aperture distribution frequency of capillaries of radius, , which is the ratio of the volume of capillary with radius, , to the total pore volume of the pores.
By substituting Equation (2) into Equation (21), the relationship between permeability contribution and transverse relaxation time (T2) can be obtained.
where is the T2 distribution frequency of capillaries of transverse relaxation time, T2j, which is the ratio of the volume of capillary with transverse relaxation time, T2, to the total pore volume of the pores.
The cumulative permeability contribution of the capillaries with the radii between and can be calculated by
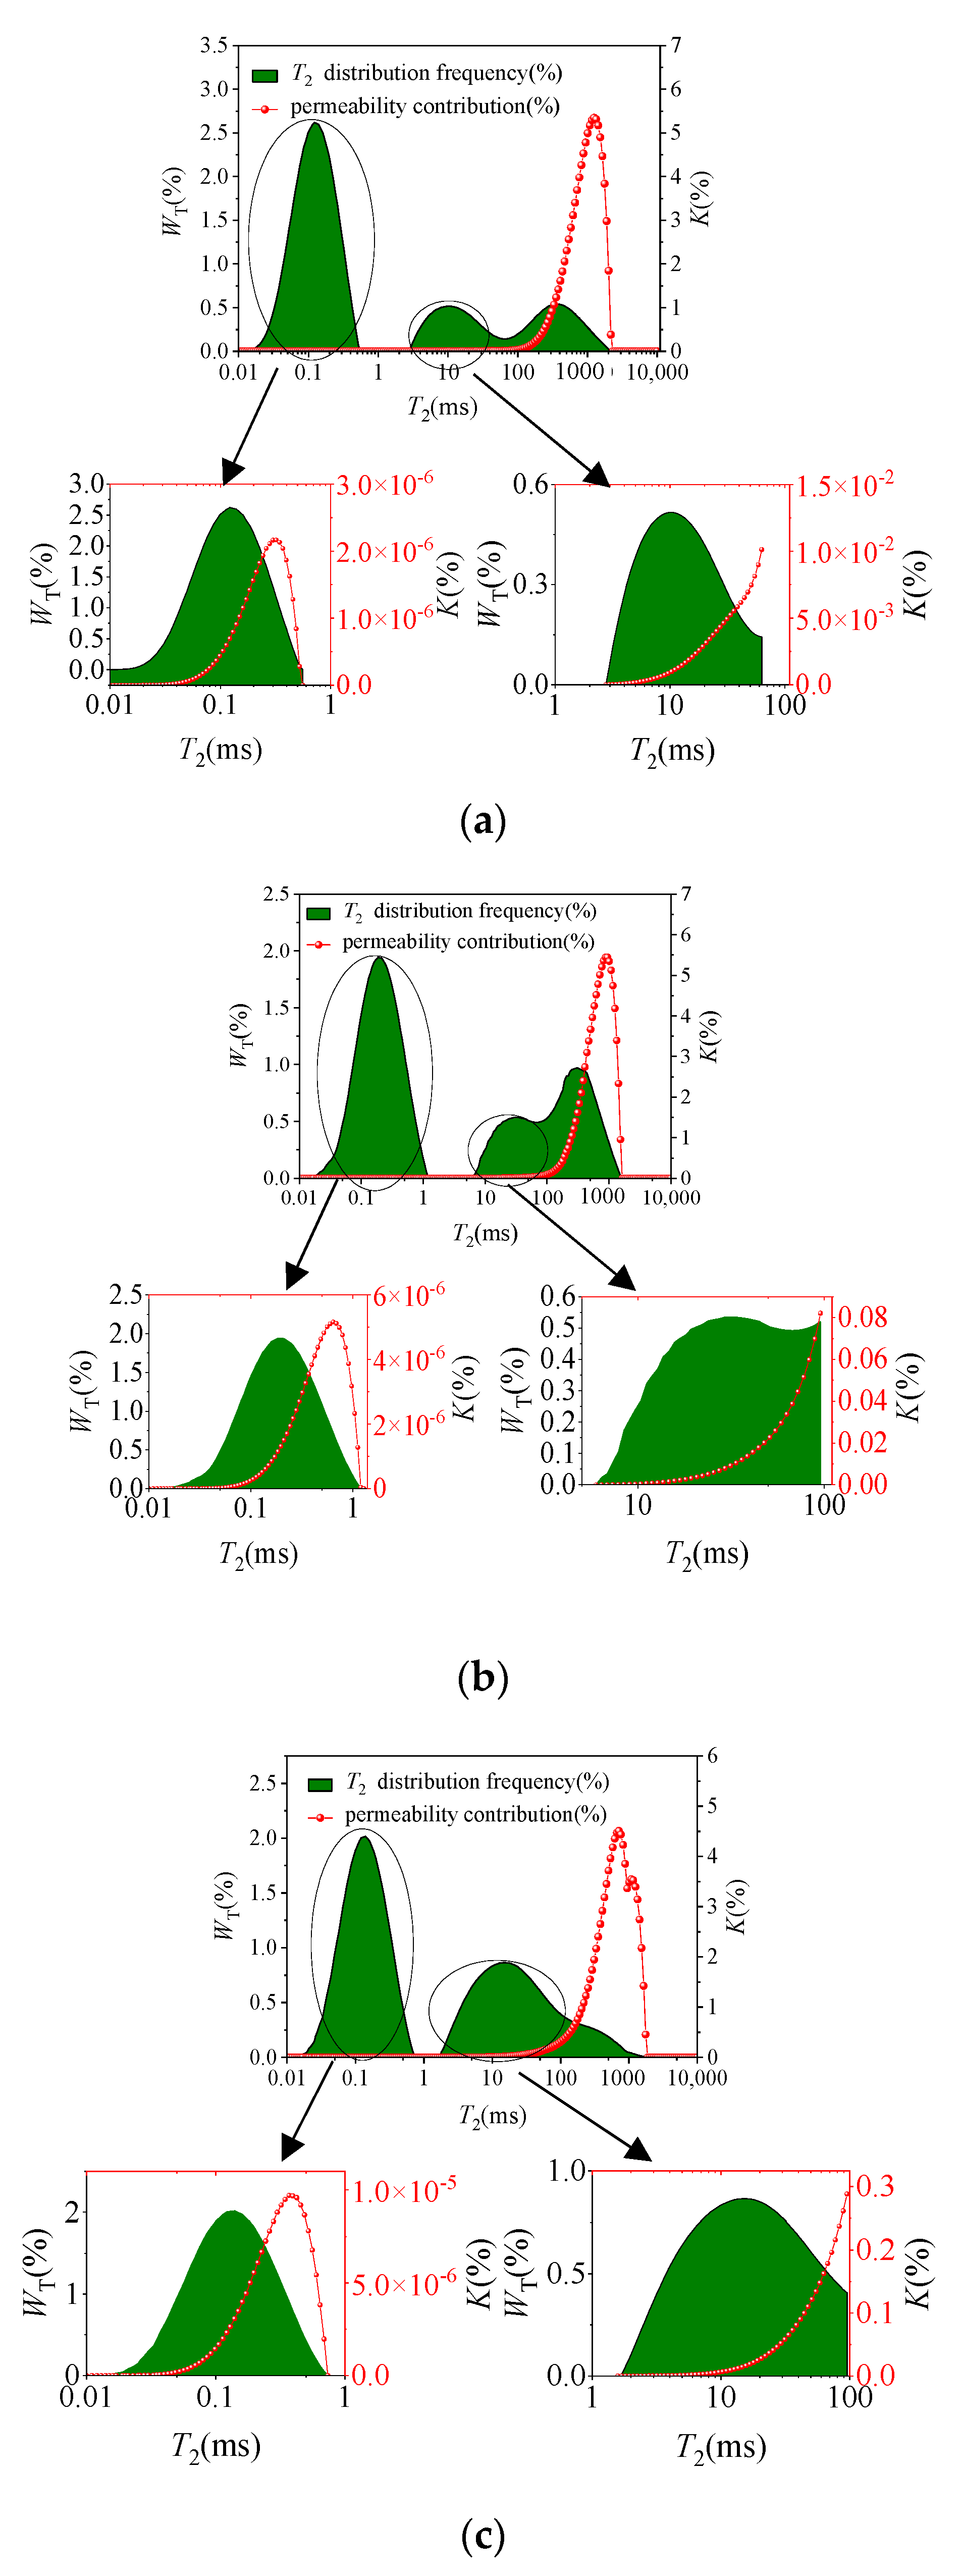
The permeability contribution of the samples based on NMR experiments is shown in Figure 8. The permeability contribution of micropore and macropore shows a trend of rising first and then falling. There is obviously hysteresis between the permeability contribution and T2 distribution frequency curves of micropore and macropore. The permeability contribution of micropore was very small, which could be ignored. The permeability contribution of mesopore was approximately 1%. The permeability contribution of macropores was approximately 99%. The micropore hardly participated in the seepage process. The macropore plays a decisive role in the seepage process.
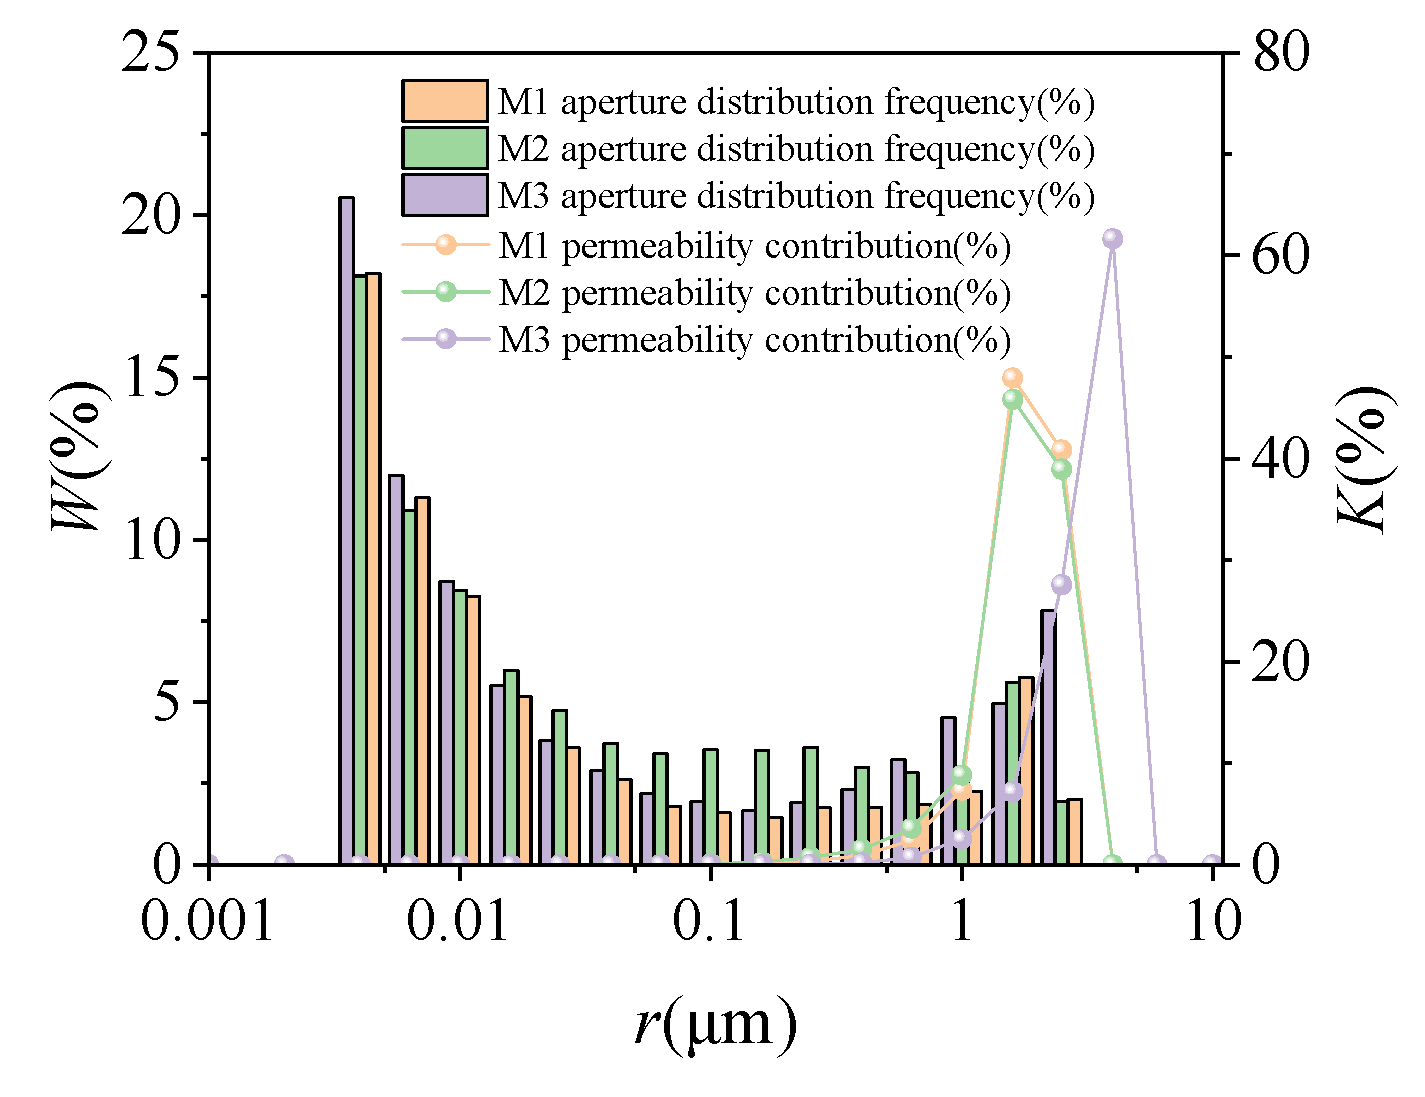
The permeability contribution of coal samples based on MIP experiments is shown in Figure 9. The permeability contribution increases with increased radii in MIP experiments. The permeability contribution of micropore was very small, which could be ignored. The permeability contribution of mesopore was approximately 5%. The permeability contribution of macropore was approximately 95%.
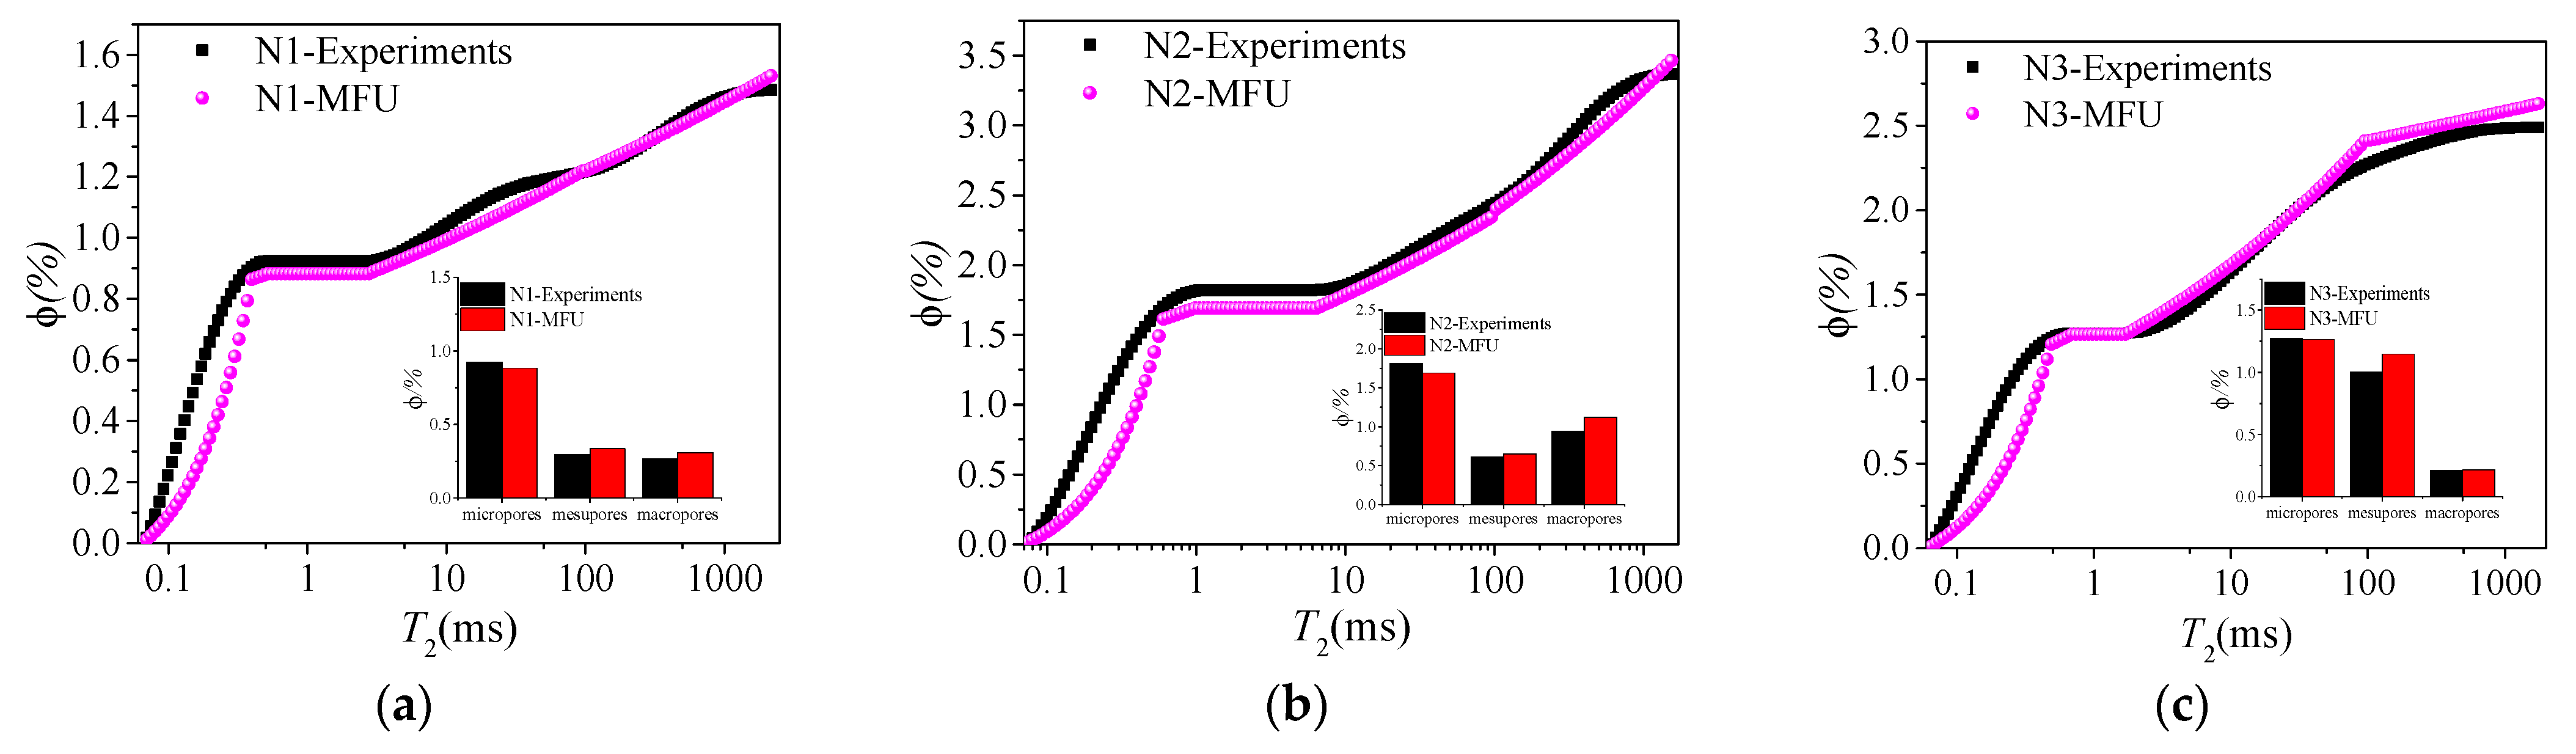
4.3. Comparison of the Pore Structure from MFU and Experiments
The comparison of the pore structure distribution obtained by MFU and experimental data is shown in Figure 10 and Figure 11. The distribution of micropore, mesopore, macropore all have the same trend. The curves and column charts show that the pore radius distribution of MFU can better fit the experimental data, which provides a basis for predicting permeability. The comparison result of the pore structure can ensure the correction of the predicting permeability and save time for next work.
4.4. The Permeability Predicted Results Base on the MFU
In order to verify the validity of the multifractal dimension permeability prediction model adopted in Equation (20), the classical single fractal permeability model proposed by Xu et al. [14] was introduced for comparison.
where D is the fractal dimension, dE is the Euclidean space dimension, and dE = 2 in two dimensions.
The permeability calculated by Equations (20) and (24), and obtained from the experiments, are shown in Table 3. The permeability calculated by MFU had the same order of magnitude with the experimental data. The permeability results predicted by multi-scale fractal permeability model had good agreement with the experimental data. In the contract, the permeability results predicted by Xu’s model were much higher than the experimental data. The reason is that Equation (24) relied too much on the value of rmax and did not fully consider the complex pore structure of coal.
Therefore, the multi-scale fractal permeability model can better describe the seepage characteristics of coal. The multi-scale fractal permeability model has simple forms and clear physical meanings, which makes it easy to predict permeability in porous media.
5. Conclusions
In this paper, the coal samples for the MIP and NMR experiments were taken from Ping-dingshan Coal Mine No. 12, China. This paper introduced the concept of fractal characteristics and proposed the multifractal dimension characteristics unit model for describing the pore structure. The MFU was applied for predicting permeability. An expression for predicting permeability based on the MFU was derived. The conclusions are as follows:
(1) The pore structure of coal samples had prominent fractal characteristics in different local scale ranges. Based on the multi-scale fractal characteristics of pore structure, this paper proposed multi-scale fractal dimension characteristics units model, which can simulate pore structure distribution in any scale range. The pore measurement scale ranges of the MIP and NMR tests were 0.008–10.6 μm and 0.0006–100 μm, respectively. The MIP and NMR experimental results showed that the pore structure exhibits obvious fractal characteristics in the three continuous local pore intervals. The pore structure distribution simulated by MFU, based on multifractal, agrees well with the MIP and NMR experimental data, indicating that the model in this paper can describe the pore structure distribution of coal samples.
(2) Based on the MIP and NMR experimental data, the permeability contribution of different pore diameters was calculated. The results show that the permeability contribution of micropore was minimal and could be ignored. The permeability contribution of mesopore was about 1–5%, and the permeability contribution of macropore was about 95–99%, which plays a decisive role in the seepage process. In the NMR experiments, the permeability contribution curves of small holes and large holes showed a trend of rising first and then decreasing. Besides, there is an obvious lag between the permeability contribution curves of small holes and large holes and the T2 distribution frequency curve, indicating that the sensitivity of permeability to pore size was higher than that of pore volume.
(3) A multi-scale fractal permeability model was established, based on MFU. The calculated results, based on the multi-scale fractal permeability model, and the measured permeability, based on experiments, are in the same order of magnitude. The permeability result predicted by the multi-scale fractal permeability model was better than the classical single fractal permeability model, which shows that the multi-scale fractal permeability model could describe the seepage characteristics with complex pore structure. The multi-scale fractal permeability model had a simple form and clear physical significance. It was easy to apply to predict the permeability of porous media, especially for low-permeability porous media.
Author Contributions
Conceptualization, W.R. and H.Z.; methodology, W.R. and H.Z.; validation, J.Z. and D.X.; formal analysis, W.R. and H.Z.; investigation, C.W. and Z.L.; writing—original draft preparation, W.R.; writing—review and editing, W.R. and H.Z. All authors have read and agreed to the published version of the manuscript.
Funding
This research was funded by the National Natural Science Foundation of China (51827901, 52121003, 52142302, 51904309, and 52104082), the 111 Project (B14006), and the Yueqi Outstanding Scholar Program of CUMTB (2017A03).
Institutional Review Board Statement
Not applicable.
Informed Consent Statement
Not applicable.
Data Availability Statement
Not applicable.
Conflicts of Interest
The authors declare no conflict of interest.
Abbreviations
The following abbreviations are used in this manuscript:
| Acronyms and Symbols | Explanation |
| MFU | Multi-scale fractal dimension characteristics units model |
| MIP | Mercury injection porosimetry |
| NMR | Nuclear magnetic resonance |
| LTNA | Low temperature N2 adsorption |
| Micro-CT | Micro X-ray computed tomography |
| CPMG | Carr-Purcell-Meiboom-Gill |
| T2 | Transverse relaxation time |
| r | Pore radius |
| rmax | Maximum pore radius |
| rmin | Minimum pore radius |
| γ | Interfacial tension |
| θ | Three-phase contact angle |
| P | Mercury intrusion pressure |
| ρ | Surface relaxivity |
| SA | Surface area |
| V | Pore volume |
| Vsample | Volume of the sample |
| Vu | Volume of unit |
| F | Shape factor of pore |
| c | Shape factor of pore |
| Pd | Displacement pressures |
| ϕ | Porosity of coal sample |
| α | Factor of fractal coefficient |
| Df | Fractal dimension |
| S | Cumulative pore volume fraction when the pore radius is less than or equal to the pore radius r |
| μ | Fluid viscosity |
| ΔPf | Pressure gradient along the tortuous capillary |
| τ | Average tortuosity of the capillaries |
| τi | Average tortuosity of the capillaries with radii between ri−1 and ri |
| L | Straight length of the capillary |
| Qi | Flow rate for the capillaries with radii between ri−1 and ri |
| Q | Total flow rate for the whole cross-sectional area |
| ϕi | Porosity of the capillaries with radii between ri−1 and ri |
| k | Permeability |
| DMIP | Fractal dimension of total pore structure measured by mercury injection porosimetry |
| DNMR | Fractal dimension of total pore structure measured by nuclear magnetic resonance |
| D1 | Fractal dimension of micropore |
| D2 | Fractal dimension of mesopore |
| D3 | Fractal dimension of macropore |
| D | Theory fractal dimension |
| dE | Euclidean space dimension |
| Kj | Permeability contribution of capillaries of radius rj |
| Ki | Cumulative permeability contribution of the capillaries with radii between ri−1 and ri |
| Wj | Pore aperture distribution frequency of capillaries of radius rj |
| WTj | T2 distribution frequency of capillaries of transverse relaxation time T2j |
References
- Bear, J. Dynamics of Fluids in Porous Media; Elsevier Science: New York, NY, USA, 1972. [Google Scholar]
- Nguyen, V.H.; Rohan, E.; Naili, S. Multiscale simulation of acoustic waves in homogenized heterogeneous porous media with low and high permeability contrasts. Int. J. Eng. Sci. 2016, 101, 92–109. [Google Scholar] [CrossRef]
- Hosa, A.; Curtis, A.; Wood, R. Calibrating Lattice Boltzmann flow simulations and estimating uncertainty in the permeability of complex porous media—ScienceDirect. Adv. Water Resour. 2016, 94, 60–74. [Google Scholar] [CrossRef] [Green Version]
- Mandelbrot Benoit, B.; Wheeler John, A. The fractal geometry of nature. Fractal GeomNat 1983, 51, 286–287. [Google Scholar] [CrossRef]
- Xie, H. Fractals in Rock Mechanics; A.A.Balkema Publishers: Rotterdam, The Netherlands, 1993. [Google Scholar]
- Friesen, W.I.; Mikula, R.J. Mercury porosimetry of coals Pore volume distribution and compressibility. Fuel 1988, 67, 1516–1520. [Google Scholar] [CrossRef]
- Friesen, W.I.; Laidlaw, W.G. Porosimetry of Fractal Surfaces. J. Colloid Interface Sci. 1993, 160, 226–235. [Google Scholar] [CrossRef]
- Xia, Y.; Cai, J.; Wei, W.; Hu, X.; Wang, X.I.N.; Ge, X. A new method for calculating fractal dimensions of porous media based on pore size distribution. Fractals 2018, 26, 1850006. [Google Scholar] [CrossRef]
- Zhang, C.; Chen, Z.; Zhang, Z.; Li, J. Fractal characteristics of reservoir rock pore structure based on NMR T2 distribution. J. Oil Gas Technol. 2007, 29, 80–86. [Google Scholar] [CrossRef]
- Wood, D.A. Techniques used to calculate shale fractal dimensions involve uncertainties and imprecisions that require more careful consideration. Adv. Geo-Energy Res. 2021, 5, 153–165. [Google Scholar] [CrossRef]
- Pia, G.; Sanna, U. Intermingled fractal units model and electrical equivalence fractal approach for prediction of thermal conductivity of porous materials. Appl. Therm. Eng. 2013, 61, 186–192. [Google Scholar] [CrossRef]
- Zhou, S.; Liu, D.; Cai, Y.; Yao, Y. Fractal characterization of pore–fracture in low-rank coals using a low-field NMR relaxation method. Fuel 2016, 181, 218–226. [Google Scholar] [CrossRef]
- Zhao, Y.; Zhu, G.; Dong, Y.; Danesh, N.N.; Chen, Z.; Zhang, T. Comparison of low-field NMR and microfocus X-ray computed tomography in fractal characterization of pores in artificial cores. Fuel 2017, 210, 217–226. [Google Scholar] [CrossRef]
- Ramakrishnan, B.; Pitchumani, R. Fractal permeation characteristics of preforms used in liquid composite molding. Polym. Compos. 2000, 21, 281–296. [Google Scholar] [CrossRef]
- Pitchumani, R.; Ramakrishnan, B. A fractal geometry model for evaluating permeabilities of porous preforms used in liquid composite molding. Int. J. Heat Mass Transf. 1999, 42, 2219–2232. [Google Scholar] [CrossRef]
- Peng, X.; Yu, B. Developing a new form of permeability and Kozeny–Carman constant for homogeneous porous media by means of fractal geometry—ScienceDirect. Adv. Water Resour. 2008, 31, 74–81. [Google Scholar] [CrossRef]
- Chen, X.; Yao, G. An improved model for permeability estimation in low permeable porous media based on fractal geometry and modified Hagen-Poiseuille flow. Fuel 2017, 210, 748–757. [Google Scholar] [CrossRef]
- Chen, Z.-L.; Wang, N.-T.; Sun, L.; Tan, X.-H.; Deng, S. Prediction method for permeability of porous media with tortuosity effect based on an intermingled fractal units model. Int. J. Eng. Sci. 2017, 121, 83–90. [Google Scholar] [CrossRef]
- Luo, Y.; Xia, B.; Li, H.; Hu, H.; Wu, M.; Ji, K. Fractal permeability model for dual-porosity media embedded with natural tortuous fractures. Fuel 2021, 295, 120610. [Google Scholar] [CrossRef]
- Ye, D.; Liu, G.; Gao, F.; Xu, R.; Yue, F. A multi-field coupling model of gas flow in fractured coal seam. Adv. Geo-Energy Res. 2021, 5, 104–118. [Google Scholar] [CrossRef]
- Zhou, H.; Sun, X.; Xie, H.; Xue, D.J.; Ren, W.G.; Liu, Z.L.; Li, X.N.; Hou, W. The determination of surface relaxivity and application to coal spontaneous imbibition. Fuel 2022, 309, 122165. [Google Scholar] [CrossRef]
- Washburn, E.W. The Dynamics of Capillary Flow. Phys. Rev. J. Arch. 1921, 17, 273–283. [Google Scholar] [CrossRef]
- Mitchell, J.; Staniland, J.; Chassagne, R.; Mogensen, K.; Frank, S.; Fordham, E. Mapping oil saturation in a limestone plug with low-field magnetic resonance. J. Pet. Sci. Eng. 2013, 108, 14. [Google Scholar] [CrossRef]
- Kenyon, W.E. Nuclear magnetic resonance as a petrophysical measurement. Nucl. Geophys. 1992, 6, 153–171. [Google Scholar] [CrossRef]
- Brownstein, K.R.; Tarr, C.E. Importance of Classical Diffusion in NMR Studies of Water in Biological Cells. Phys. Rev. A 1979, 19, 2446–2453. [Google Scholar] [CrossRef]
- IUPAC. Reporting physisorption data for gas/solid systems with special reference to the determination of surface area and porosity. Pure Appl. Chem. 1982, 54, 2201–2218. [Google Scholar] [CrossRef]
- Hodot, B.B. Outburst of Coal and Coalbed Gas (Chinese Translation); China Industry Press: Beijing, China, 1966. [Google Scholar]
- Babadagli, T.; Develi, K. Fractal characteristics of rocks fractured under tension. Theor. Appl. Fract. Mech. 2003, 39, 73–88. [Google Scholar] [CrossRef]
- Yu, B.; Cheng, P. A fractal permeability model for bi-dispersed porous media. Int. J. Heat Mass Transf. 2002, 45, 2983–2993. [Google Scholar] [CrossRef]
- Liu, K.; Ostadhassan, M.; Zou, J.; Gentzis, T.; Rezaee, R.; Bubach, B.; Carvajal-Ortiz, H. Multifractal analysis of gas adsorption isotherms for pore structure characterization of the Bakken Shale. Fuel 2018, 219, 296–311. [Google Scholar] [CrossRef] [Green Version]
- Paz-Ferreiro, J.; da Luz, L.; Lado, M.; Vázquez, E.V. Specific Surface Area and Multifractal Parameters of Associated Nitrogen Adsorption and Desorption Isotherms in Soils from Santa Catarina, Brazil. Vadose Zone J. 2013, 12, 185–192. [Google Scholar] [CrossRef]
- Denn, M.M. Process Fluid Mechanics; Prentice-Hall: Englewood Cliffs, NJ, USA, 1980. [Google Scholar]
- Yu, B.; Li, J. A Geometry Model for Tortuosity of Flow Path in Porous Media. Chin. Phys. Lett. 2004, 21, 1569–1571. [Google Scholar] [CrossRef]
- Zhou, H.; Zhong, J.; Ren, W.G.; Wang, X.; Yi, H. Characterization of pore-fracture networks and their evolution at various measurement scales in coal samples using X-ray μCT and a fractal method. Int. J. Coal Geol. 2018, 189, 35–49. [Google Scholar] [CrossRef]
Figure 1.
Capillary pressure curves.

Figure 2.
T2 distribution of water-saturated coal samples.

Figure 3.
Schematic diagram of a MFU example.
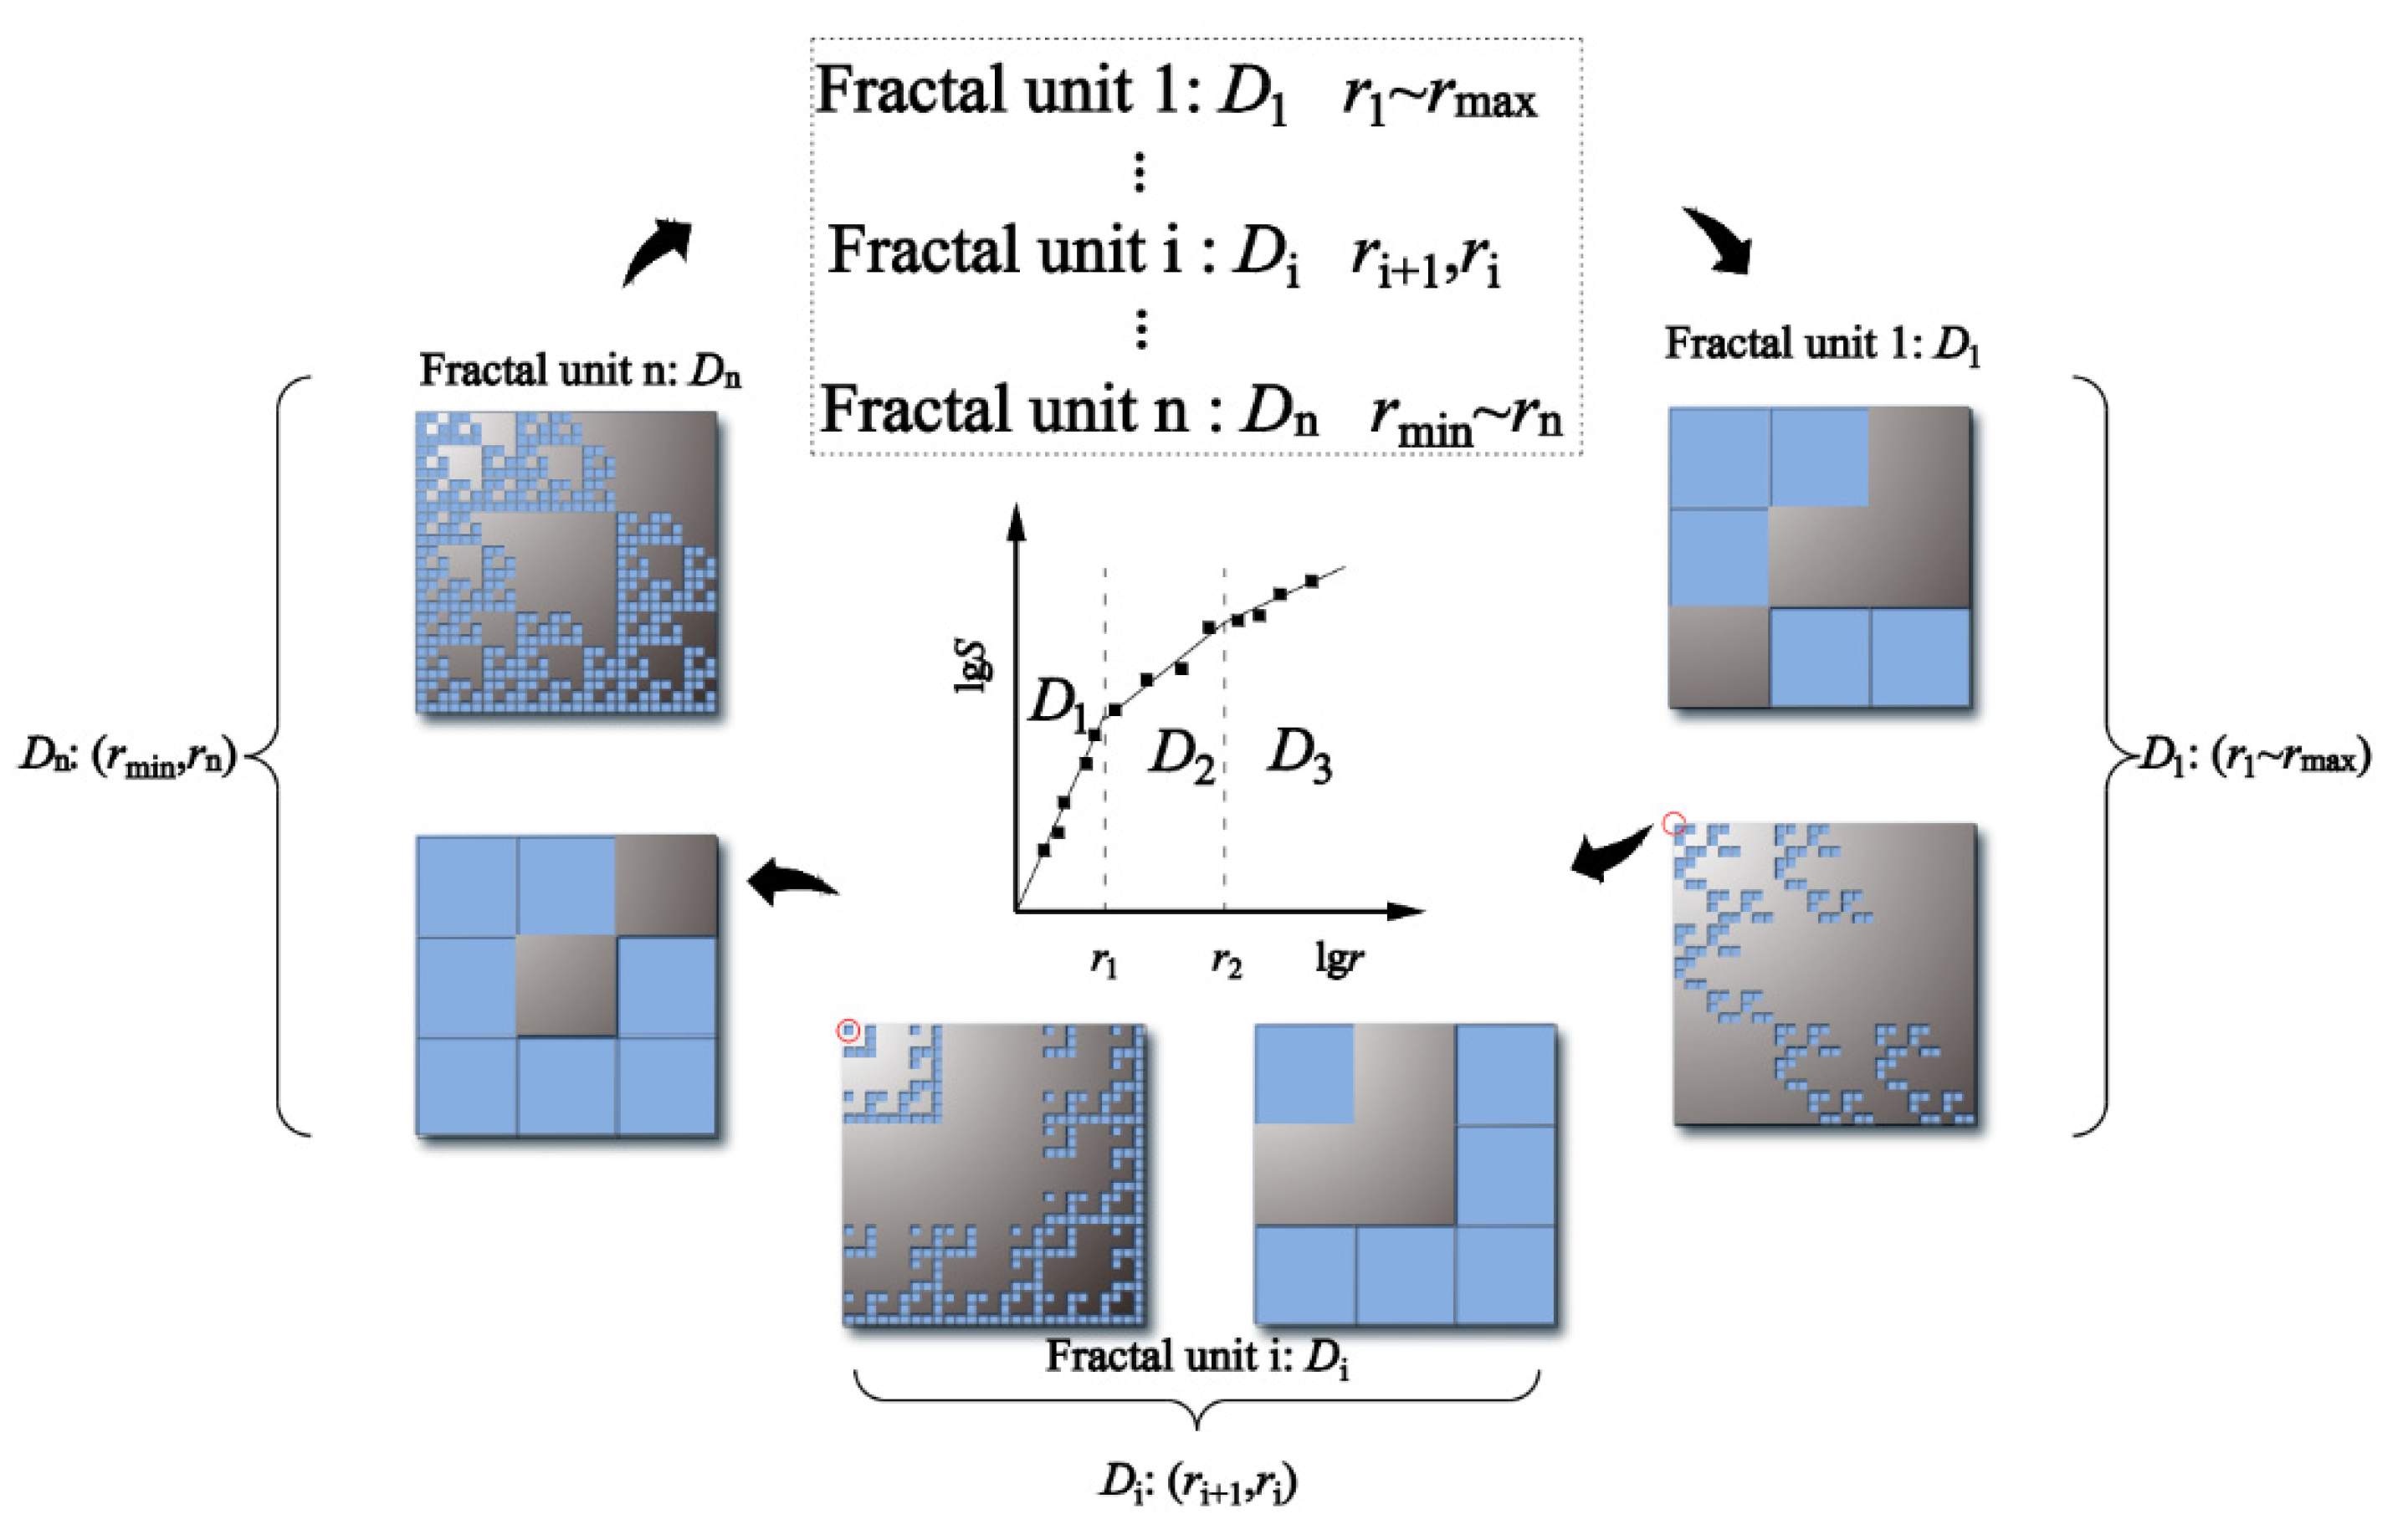
Figure 4.
Log–log fitting results for the entire pore size range, based on MIP. (a) M1, (b) M2, and (c) M3.
Figure 4.
Log–log fitting results for the entire pore size range, based on MIP. (a) M1, (b) M2, and (c) M3.
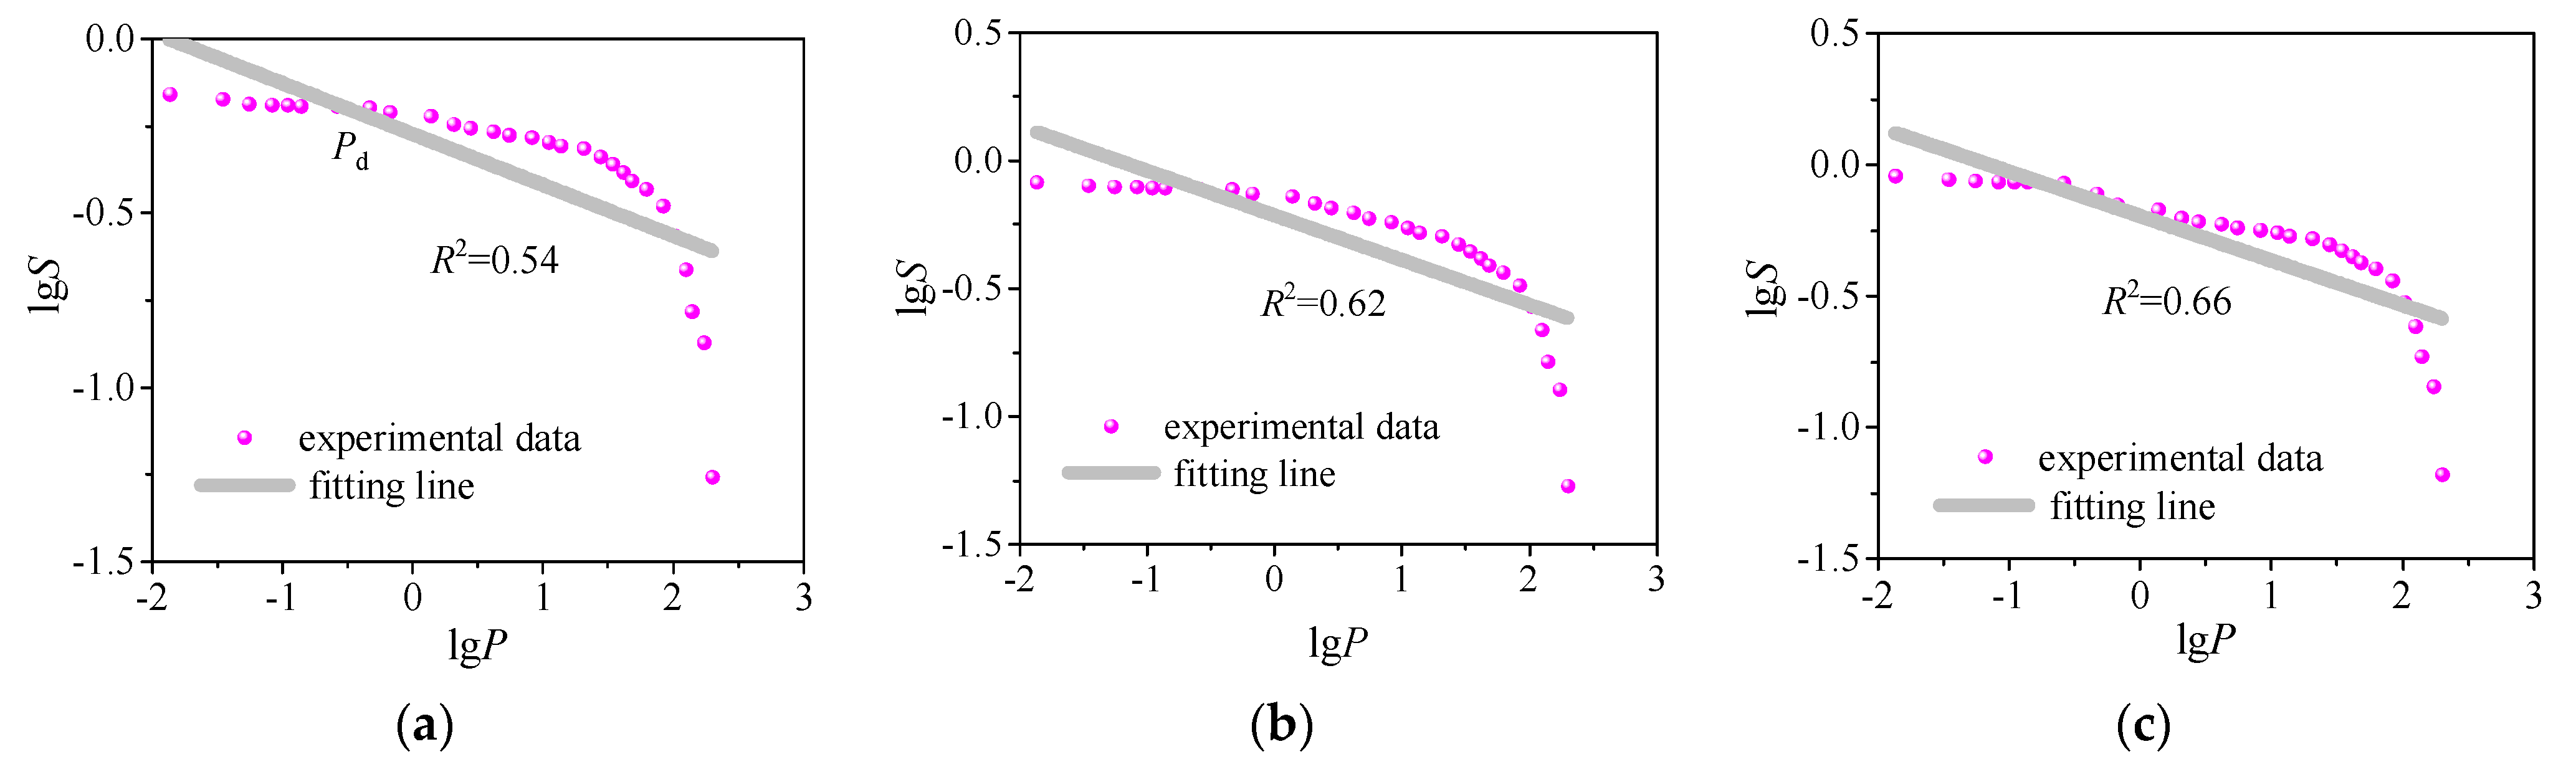
Figure 5.
The calculation of multi-scale fractal dimensions, based on MIP. (a) M1, (b) M2, and (c) M3.
Figure 5.
The calculation of multi-scale fractal dimensions, based on MIP. (a) M1, (b) M2, and (c) M3.
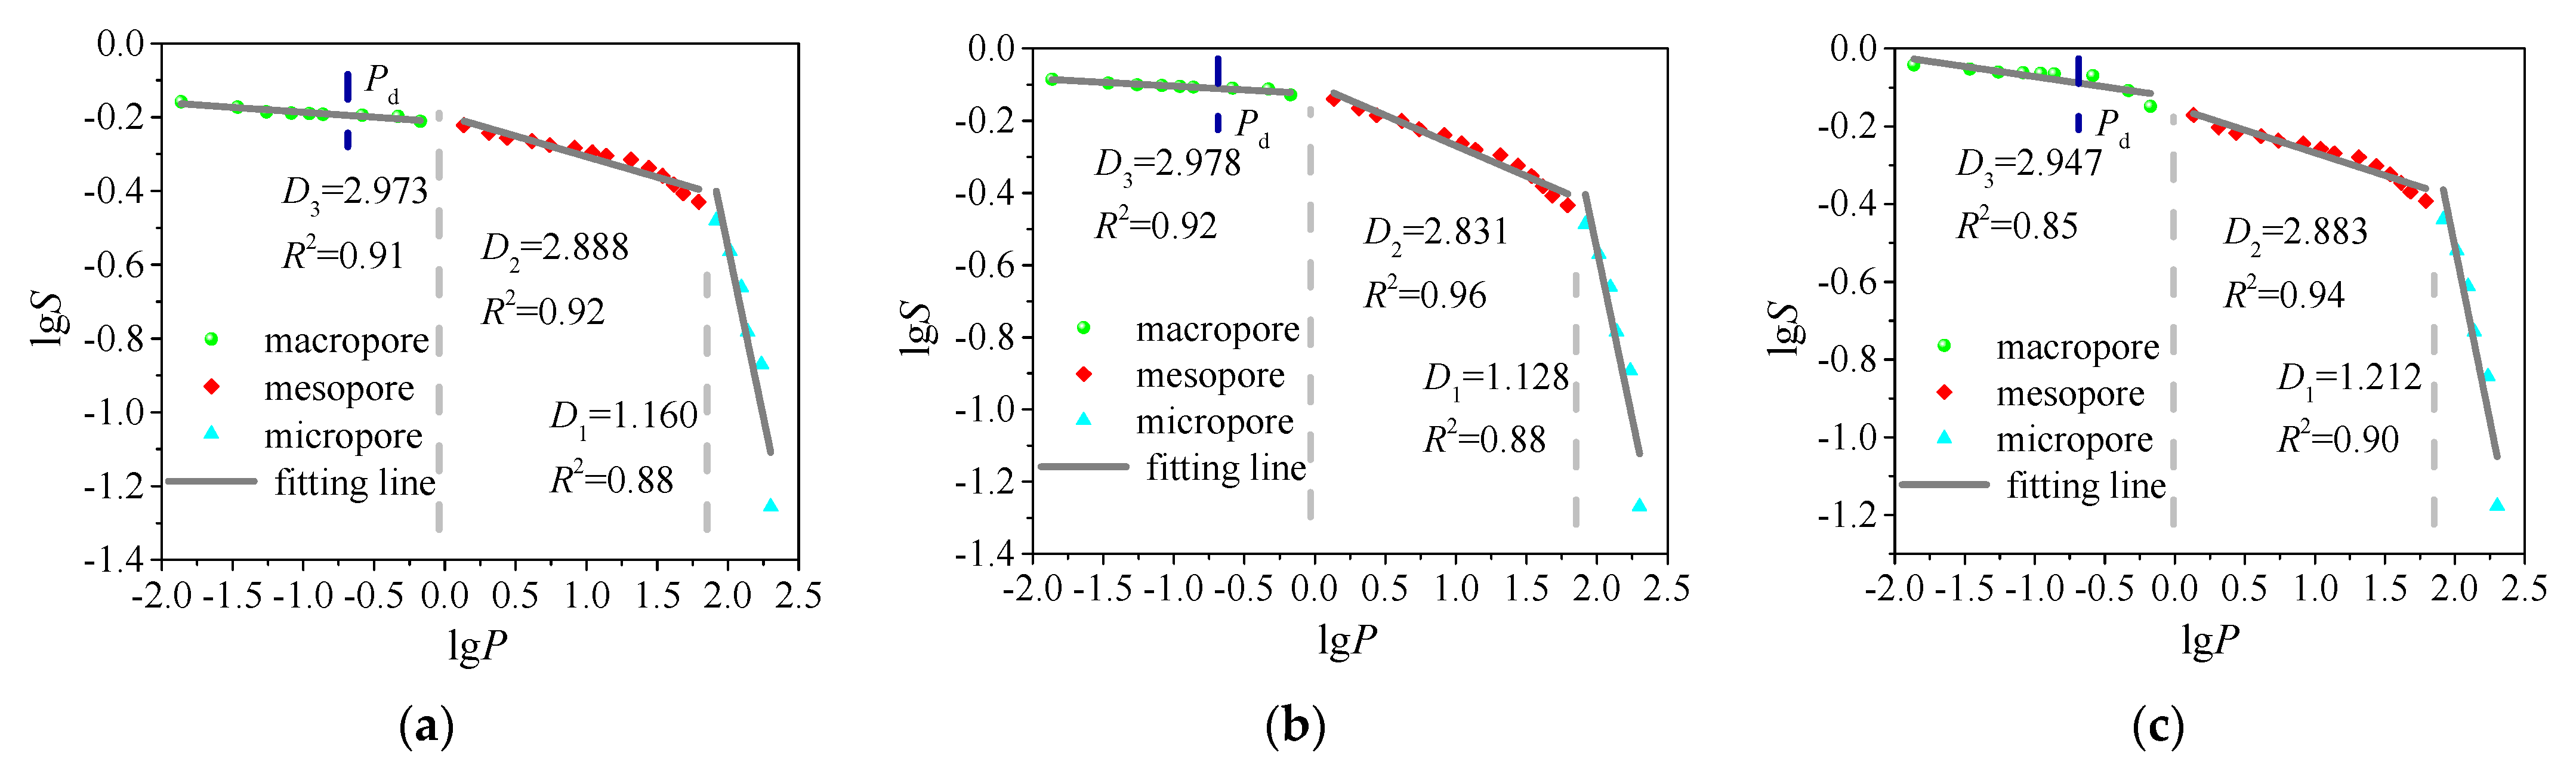
Figure 6.
Log–log fitting results for the entire pore size range, based on NMR. (a) N1, (b) N2, and (c) N3.
Figure 6.
Log–log fitting results for the entire pore size range, based on NMR. (a) N1, (b) N2, and (c) N3.
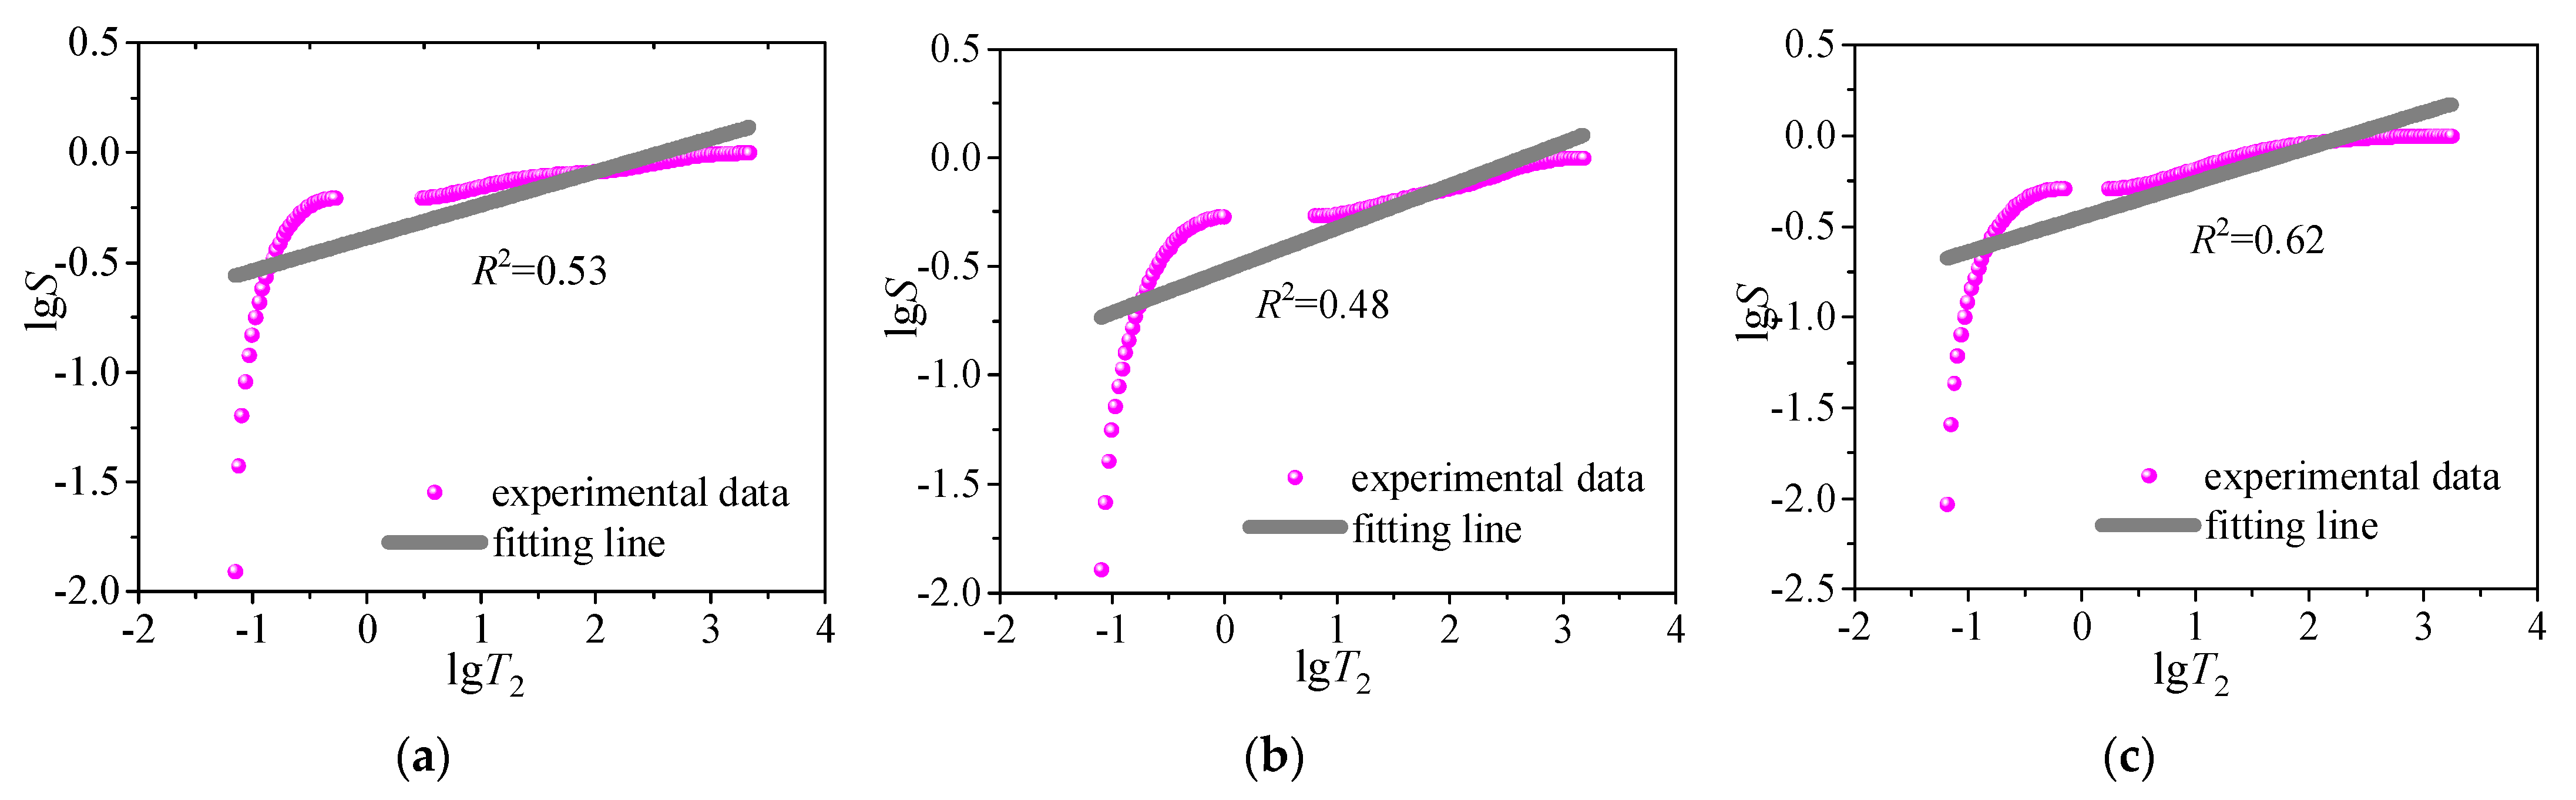
Figure 7.
The calculation of multi-scale fractal dimensions, based on NMR. (a) N1, (b) N2, and (c) N3.
Figure 7.
The calculation of multi-scale fractal dimensions, based on NMR. (a) N1, (b) N2, and (c) N3.

Figure 8.
Permeability contribution curves of coal samples based on NMR. (a) N1, (b) N2, and (c) N3.
Figure 8.
Permeability contribution curves of coal samples based on NMR. (a) N1, (b) N2, and (c) N3.

Figure 9.
Permeability contribution curves of coal samples based on MIP. M1, M2, and M3.

Figure 10.
Comparison of simulated data and MIP experimental data. (a) M1, (b) M2, and (c) M3.
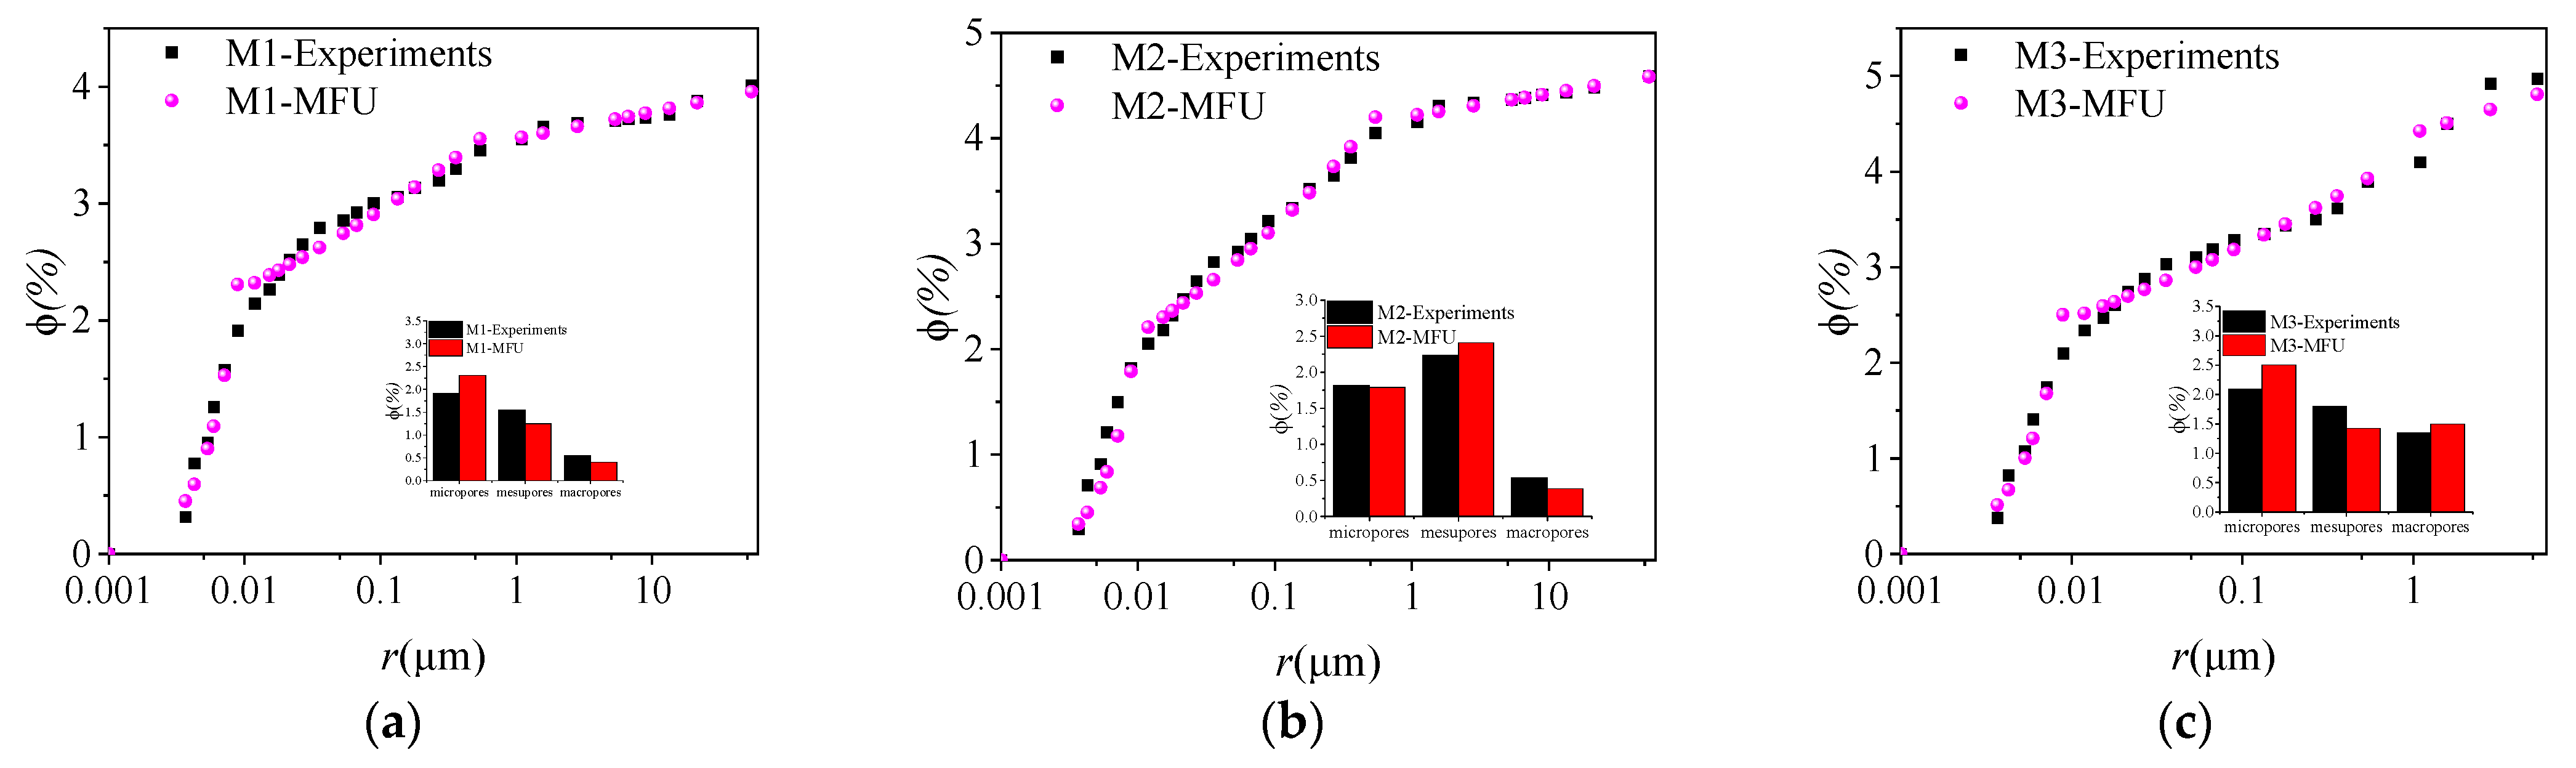
Figure 11.
Comparison of simulated data and NMR experimental data. (a) N1, (b) N2, and (c) N3.

Table 1.
Results of MIP experiment.
| Sample | Pd (MPa) | rmax (μm) | Maximum Mercury Saturation (%) | Residual Mercury Saturation (%) | Mercury Withdrawal Efficiency (%) | Φ (%) | ||
|---|---|---|---|---|---|---|---|---|
| Micro-Pore | Meso-Pore | Macro-Pore | ||||||
| M1 | 0.261 | 2.814 | 69.492 | 20.065 | 71.126 | 1.912 | 1.546 | 0.552 |
| M2 | 0.261 | 2.813 | 82.271 | 28.761 | 65.041 | 1.819 | 2.233 | 0.538 |
| M3 | 0.138 | 5.332 | 90.877 | 30.690 | 66.230 | 2.096 | 1.799 | 1.348 |
Note: Pd is displacement pressures, rmax is maximum pore radii, and Φ is porosity.
Table 2.
Results of NMR experiment.
| Sample | Φ (%) | ||
|---|---|---|---|
| Micropore | Mesopore | Macropore | |
| N1 | 0.925 | 0.295 | 0.265 |
| N2 | 1.814 | 0.614 | 0.940 |
| N3 | 1.273 | 1.005 | 0.212 |
Table 3.
Comparison between the MFU results and experimental data.
| MIP | NMR | ||||||
|---|---|---|---|---|---|---|---|
| M1 | M2 | M3 | N1 | N2 | N3 | ||
| Di | D1 | 1.160 | 1.128 | 1.212 | 1.984 | 2.002 | 2.089 |
| D2 | 2.888 | 2.831 | 2.883 | 2.913 | 2.884 | 2.835 | |
| D3 | 2.973 | 2.978 | 2.947 | 2.926 | 2.868 | 2.968 | |
| k (mD) | Xu | 2.015 | 2.240 | 8.277 | 37.3351 | 37.409 | 46.958 |
| multi-scale fractal permeability model | 0.018 | 0.024 | 0.275 | 0.0360 | 0.0302 | 0.0157 | |
| Experiment | 0.026 | 0.073 | 0.336 | - | 0.0347 | 0.0099 | |
Note: 1 mD = 10−3 μm2.
Publisher’s Note: MDPI stays neutral with regard to jurisdictional claims in published maps and institutional affiliations. |
© 2022 by the authors. Licensee MDPI, Basel, Switzerland. This article is an open access article distributed under the terms and conditions of the Creative Commons Attribution (CC BY) license (https://creativecommons.org/licenses/by/4.0/).
Share and Cite
MDPI and ACS Style
Ren, W.; Zhou, H.; Zhong, J.; Xue, D.; Wang, C.; Liu, Z. A Multi-Scale Fractal Approach for Coal Permeability Estimation via MIP and NMR Methods. Energies 2022, 15, 2807. https://doi.org/10.3390/en15082807
AMA Style
Ren W, Zhou H, Zhong J, Xue D, Wang C, Liu Z. A Multi-Scale Fractal Approach for Coal Permeability Estimation via MIP and NMR Methods. Energies. 2022; 15(8):2807. https://doi.org/10.3390/en15082807
Chicago/Turabian StyleRen, Weiguang, Hongwei Zhou, Jiangcheng Zhong, Dongjie Xue, Chaosheng Wang, and Zelin Liu. 2022. "A Multi-Scale Fractal Approach for Coal Permeability Estimation via MIP and NMR Methods" Energies 15, no. 8: 2807. https://doi.org/10.3390/en15082807
Note that from the first issue of 2016, this journal uses article numbers instead of page numbers. See further details here.