
Hydrogen Production from Catalytic Pyrolysis of Phenol as Tar Model Compound in Magnetic Field
by
 , , ,
, , ,
Yalong Li
1,2,
Baofeng Zhao
1,2,*,
Haibin Guan
1,2,
Suxiang Liu
1,2,
Di Zhu
1,2,*,
Angang Song
1,2,
Huan Li
1,2 and
Laizhi Sun
1,2 1
Key Laboratory for Biomass Gasification Technology of Shandong Province, Energy Research Institute, Qilu University of Technology (Shandong Academy of Sciences), Jinan 250014, China
2
Institute for Energy Research, Qilu University of Technology (Shandong Academy of Sciences), Jinan 250014, China
*
Authors to whom correspondence should be addressed.
Energies 2023, 16(10), 4140; https://doi.org/10.3390/en16104140
Submission received: 30 March 2023
/
Revised: 2 May 2023
/
Accepted: 11 May 2023
/
Published: 17 May 2023
(This article belongs to the Special Issue Pyrolysis and Gasification of Biomass and Waste II)
Abstract
:Tar conversion during biomass pyrolysis is essential for hydrogen production. In this study, phenol and 10 wt.% Ni/CaO-Ca12Al14O33 were used as the tar model compound and catalyst, respectively. The purpose of the present investigation was to analyze the influence of varying magnetic field strength (ranging from 0 to 80 mT), reaction temperature (ranging from 550 to 700 °C), and carrier gas velocity (ranging from 20 to 30 mL/min) on the catalytic pyrolysis outcomes obtained from phenol. The findings indicated that the conversion rate of phenol and H2 output exhibited an increase with an escalation in magnetic field strength and reaction temperature but demonstrated a decrease with an upsurge in the carrier gas velocity. The ideal conditions for achieving the maximum phenol conversion (91%) and H2 yield (458.5 mL/g) were realized by adjusting the temperature to 650 °C, retaining the carrier gas velocity at 20 mL/min, and elevating the magnetic field intensity to 80 mT. These conditions resulted in a considerable increase in phenol conversion and H2 yield by 22.2% and 28.2%, respectively, compared with those achieved without magnetism. According to the kinetic calculations, it was indicated that the inclusion of a magnetic force had a beneficial effect on the catalytic efficacy of 10 wt.% CaO-Ca12Al14O33. Additionally, this magnetic field was observed to lower the activation energy required for the production of H2 when compared with the activation energy required during phenol catalytic pyrolysis. This consequently resulted in an enhancement of the overall efficiency of H2 production.
1. Introduction
Biomass pyrolysis hydrogen production is a promising hydrogen production technology [1,2,3]. However, the tar generated during biomass pyrolysis not only slows down the hydrogen production rate, but also damages the equipment [4,5,6]. Hydroxy derivatives of benzene are important components of tar, accounting for 37% of the tar mass [7]; hence, it is important to study the mechanism governing the efficient cracking of phenol-like aromatic compounds for hydrogen production in order to remove tar from biomass.
Catalysts, such as metals, metallic oxides, and molecular sieves, effectively promote tar cracking as they can enhance the yield and selectivity of syngas, resulting in an improved pyrolysis efficiency [8,9]. CaO is often used as a tar-cracking catalyst owing to its effective catalytic activity, inexpensiveness, and abundant reserves. Incorporating it in biomass pyrolysis can significantly improve tar-cracking efficiency and lead to the adsorption of CO2 generated by pyrolysis, thereby resulting in an enhanced calorific value of the gas products [10]. Xue et al. [11] conducted a comprehensive analysis of the impact of CaO catalyst on the chemical reaction properties of corn stover pyrolysis. The results of the study indicated that the improvement in the addition of CaO led to a consequential reduction in tar output, coupled with a commensurate rise in solid and gas outputs. Furthermore, it was observed that CO2 content in the pyrolysis gas exhibited a gradual decline, while the H2 content exhibited a gradual increase. Ni-based catalysts are also highly efficient tar-cracking catalysts as they are also inexpensive; hence, they are extensively used for biomass pyrolysis. A composite catalyst composed of Ni and CaO can significantly improve the tar removal rate [12]. For instance, Xu et al. [13] added 10 wt.% Ni/CaO during the pyrolysis of herbal residues, which significantly reduced the yield of condensable liquids and led to a high CO2 removal rate (>60%) at 700 °C. Therefore, it demonstrated superior catalytic efficiency when compared to that of a CaO catalyst in its pure form. Zhao et al. [14] executed an analysis concerning the catalytic pyrolysis of herbal waste to generate a hydrogen-enriched gas. The outcomes revealed that the utilization of a 10 wt.% Ni/CaO catalyst substantially lessened the apparent activation energy required to produce hydrogen-enriched gas through the pyrolysis of herbal waste as opposed to pyrolysis lacking a catalyst and with the addition of CaO. Yue et al. [15] produced a series of bifunctional Ni/CaO catalysts and conducted an examination of the function of different Ni/Ca ratios on the H2 production resulting from corn cobs pyrolysis. The study showed that a ratio of 1:7 of Ni/Ca catalyst increased the hydrogen content from 11.82 to 68.62 vol.% when compared to the sample without any catalyst. Nevertheless, these catalysts are subjected to severe deactivation due to sintering, metal oxidation, and coking. It has been shown that a suitable carrier can result in better dispersion of the loaded catalyst, higher resistance to deactivation, and better stability owing to the metal–carrier interactions. Dang et al. [16] utilized a hollow porous Ni-Ca-Al-O bifunctional catalyst in the process of catalyzing the generation of hydrogen from glycerol reforming. The results of their study indicate that the 10Ni-Ca-Al2.8 catalyst exhibited superior cycling stability and maintained a consistent hydrogen production purity of 99% as compared to the control group that did not incorporate a carrier. Liu et al. [17] prepared Ni-CaO-Al2O3 for ethanol adsorption-strengthened steam reforming hydrogen production experiments using the sol-gel method; one of the Ni/Al/Ca-85.5 samples demonstrated the best CO2 adsorption function and a high hydrogen output over 20 cycles. Meanwhile, Wang et al. [18] prepared a Ca12Al14O33 carrier-loaded Ni-CaO catalyst for autothermal reforming of acetic acid using a co-precipitation method; the results showed that strong interactions were formed between Ni, CaO, and Ca12Al14O33, which effectively improved the activity of the catalyst. Due to the introduction of said carrier, the catalyst displayed a notable degree of thermal stability and experienced no significant deactivation over the course of the experiment, which lasted for 9 h.
The catalytic pyrolysis of tar is a complex thermochemical transformation process that is significantly influenced by a catalyst. However, improving catalyst performance is time-consuming and labor-intensive. It is a well-known fact that magnetic fields possess the ability to enhance the performance of catalysts and promote an increased degree of product selectivity [19], owing to their high efficiency, fast speeds, and non-contact nature. For instance, when Kiatphuengporn et al. [20] added a magnetic field to the CO2 catalytic hydrogenation reaction, and the magnetic field changed the reaction path of the catalytic thermal transform and promoted the water gas change reaction by a factor of 1.2–1.6. Donphai et al. [19] conducted a comprehensive analysis of the efficiency of Cu-ZnO/ZrO2 in the process of CO2 hydrogenation under various intensities of magnetic fields (0, 20.80, and 27.70 mT) and two opposing magnetic field orientations, namely (N-S) and (S-N) directions. The results show that the efficiency of CO2 conversion by Cu-ZnO/ZrO2 catalysts is higher with the magnetism at different temperatures than when the field is absent. The optimal CO2 conversion rate was attained at 20.80 mT and with an S-N orientation. The implementation of a magnetic field resulted in a notable augmentation of 1.8–3.0 times when compared to the conversion rate attained in its absence. The exceptional performance can be attributed to the magnetized catalyst’s surface being facilitated in its adsorption of reactant gas molecules of CO2 via the influence of external magnetism. Consequently, there was a significant improvement in the effectiveness of the catalyst in the course of CO2 hydrogenation. In a previous study [21], the inquiry examined the influence of magnetic fields on the catalytic pyrolysis of wood chips, and it was observed that the yield of liquid products comprising tar and water was reduced with the augmentation of the magnetic field’s intensity. The fraction of liquid mass was decreased by 16% in comparison to the observations made without magnetism. Based on these above-mentioned studies, magnetic field-assisted catalysts enhance the degradation rate of organic macromolecules. Nevertheless, previous research has failed to elucidate the underlying mechanism responsible for the conversion of tar facilitated by magnetic fields.
In this work, phenol was chosen as the tar model compound, and a magnetic 10 wt.% Ni/CaO-Ca12Al14O33 was applied. As a result, an investigation into the impact of magnetic fields on the process of converting phenol to hydrogen was discussed using a fixed bed reactor. The outcomes of this examination are projected to offer both theoretical and practical direction for the innovation of advanced biomass hydrogen production technologies.
2. Materials and Methods
2.1. Catalyst Preparation
According to a previous study [17], a composite containing 10 wt.% Ni/CaO-Ca12Al14O33 was synthesized utilizing a co-precipitation technique, wherein the Ni mass ratio was 10%, while CaO constituted 60% of the composition. Next, 14.86 g nickel nitrate hexahydrate(Ni(NO3)2·6H2O), 56.58 g aluminum nitrate nonahydrate(Al(NO3)3·9H2O), and 65.25 g acetic acid calcium salt monohydrate((CH3COO)2Ca·H2O) were dissolved in a sufficient amount of deionized water. Following the initial stirring, samples were put inside an ultrasonic cleaner and shook for 30 min to assure thorough dissolution and homogenous mixing. Then, a NaOH solution was mixed dropwise with the above-mentioned solution in a 30 °C water bath, while stirring until the suspension pH became 11. The suspension was aged for 12 h in a water bath temperature of 60 °C and then washed 5 times via centrifugation with deionized water. The precipitate obtained was subjected to drying for 24 h at 105 °C in an oven, whereupon it was subsequently calcined at 900 °C for 4 h. The calcined samples were crushed by pressing, sieved into 0.45–0.6 mm particles, and lastly reduced for 30 min in a hydrogen atmosphere furnace at 750 °C to obtain the 10 wt.% Ni/CaO-Ca12Al14O33 catalyst.
2.2. Catalyst Analysis
The vibrating sample magnetometer (LakeShore7404, Woburn, MA, USA) was used to analyze the magnetic properties of the catalysts at 20 °C with an applied magnetic force of ±0.2 T. The crystal structure of the catalyst was determined by X-ray powder diffraction (Nippon Rigaku Ultima IV, Tokyo, Japan) by CuKα radiation (λ = 1.54184 Å). The scan step and scan range of 2θ were 0.02° and 10–80°, respectively. The pore size and specific surface area analyzer (Kubo X1000, Guangzhou, China) were used to measure the surface and total pore volume. The isotherm for the adsorption and desorption of N2 at −196 °C was recorded subsequent to degassing 0.5 g of the sample at 100 °C for 60 min.
2.3. Experimental Apparatus and Procedures
The experiment involving the catalytic pyrolysis of phenol was conducted within a fixed bed reactor that was self-constructed and operated at ambient pressure. The calibration of the gas flow rate was conducted using the soap film flowmeter in conjunction with high purity N2 gas as the carrier. Experimental equipment is shown in Figure 1. The magnetic field was produced by two permanent magnets situated in a parallel configuration. The magnetic field strength was detected using the WT103 digital Gaussmeter. The specific detection process is as follows: The probe of the Gaussmeter was placed between two magnets during the detection, and the distance between the two magnets was adjusted by observing the Gaussmeter display to obtain the required magnetic field strength. The reactor used was a quartz pipe 830 mm long, 25.5 mm inside diameter, and 30.5 mm outside diameter. The experimental temperature was set to 650 °C, and the magnetic field size was set to 80 mT based on previous studies [14,21]. Then, 2 g phenol and 2 g catalyst were loaded into the material cup and the quartz pipe, respectively. After the reactor has been heated to a certain temperature, the material cup will be transferred to the high-temperature region. The volatiles produced were transported by N2 into the catalyst bed for the purpose of carrying out catalytic cracking. Subsequently, the products of pyrolysis were made to traverse through a condensation system, with the gases that were incapable of condensation accumulated in a gas bag over a period of 30 min. Finally, the samples were analyzed using gas chromatography (GC, INFICON Micro GC Fusion, East Syracuse, NY, USA).
2.4. Dynamical Methods
The model fitting method has been widely used to study the pyrolysis kinetics of substances as it only requires simple calculations and produces highly accurate results [22]. In the pyrolysis experiment, the change in gas composition was detected online using gas chromatography, which was conducted every 3 min to measure the intensity of the H2 release. The gas conversion rate was calculated using Equation (1), while the apparent activation energy was estimated using mathematical derivation.
where x is the pyrolysis gas conversion rate (%), t is the reaction time (s), t0 is the initial reaction time (s), te is the reaction end time (s), is the volume fraction of gas i in the produced gas (%), and is the flow rate of the reactor gas product (L/min).
where T is the reaction temperature and k(T) is the reaction rate constant defined by the Arrhenius equation, which shows that the expression can be written without using f(x); f(x) is the differential form of the reaction mechanism, A is the exponential prefactor (s−1), Ea is the activation energy (kJ/mol), and R is the gas constant (8.314 J/(mol·K)). In the reaction model, the activation energy and exponential prefactor were calculated using the Arrhenius formula based on the model fitting method by using Equations (4) and (5):
where G(x) is the reaction model; a straight line was fitted for G(x) versus t at different temperatures with a slope of k(T), and a curve of “ln(k(T))” versus 1/T was constructed using Equation (5). Using a linear fit, the intercept and slope parameters of the correlation plot were derived, from which the corresponding finger front factor (A) and activation energy (Ea) were calculated. Through calculations and the literature review, G(x) = was selected as the mechanistic model among 19 commonly used gas–solid reaction models [23,24,25]. The model function with the greatest correlation coefficient was selected according to Equation (4), and the corresponding kinetic parameters were calculated.
3. Result and Discussion
3.1. Catalyst Characterization
3.1.1. XRD Analysis
Figure 2a shows the XRD pattern of the unreduced catalyst, from which it can be seen that the element Ni in the unreduced catalyst exists in the form of NiO, and the diffraction peaks of NiO appear at 2θ of 43.3° and 62.9°. Figure 2b depicts the X-ray patterns of the catalysts. The diffraction peaks are marked with ◆, ▲, and ● to represent CaO (jcpdson. 99-0070), Ni (jcpdson. 04-0850), and Ca12Al14O33 phases, respectively. The diffraction peaks of calcium oxide were observed at 2θ values of 33.2°, 37.3°, and 53.6°, whereas those of nickel were observed at 2θ values of 44.5° and 51.8°. Furthermore, diffraction peaks of Ca12Al14O33 appeared at 2θ = 17.8°, 23.2°, 29.4°, 41.1°, 46.5°, and 57.5°. Ca12Al14O33 was formed after the reaction of Al3+ and CaO and was usually discovered in Al2O3-loaded CaO-based materials [26,27]. The XRD results of the post-experimental catalyst are shown in Figure 2c. By comparing the XRD patterns of the fresh catalyst and the post-experimental catalyst, it was found that the physical phase structure of the post-experimental catalyst changed, CaO was transformed into CaCO3 due to the absorption of CO2, and the element Ni remained in the form of monomers.
3.1.2. Catalyst Magnetic Properties
The magnetic characteristics of the catalysts are displayed in Figure 2d and Table 1, which reveal that the catalyst samples before reduction had no hysteresis lines. Furthermore, the remanent magnetization (Mr) and coercivity field (Hc) are zero, indicating that the unreduced catalyst is not a magnetic material. In the presence of Ni monomers, the reduced catalyst had a significant shrinkage in the middle section of the hysteresis line [19] and saturation magnetization (Ms) increased from 0.00 emu/g to 4.62 emu/g. Thus, it may be inferred that the reduced catalyst is a magnetic material and exhibits a good magnetic effect under magnetic fields.
3.1.3. N2 Adsorption/Desorption Analysis
Figure 3a,b and Table 2 show the specific surface area and porosity of the catalyst, respectively. As per the classification established by IUPAC, it was observed that the catalysts exhibited type IV isotherms, thereby signifying their possession of a mesoporous structure [28]. Adsorption increased almost vertically when P/P0 < 0.1, indicating the presence of a large number of micropores in the material. When P/P0 ≤ 0.8, the curve did not exhibit a plateau, which implies the presence of a mesoporous structure. Meanwhile, a more apparent hysteresis back loop was observed when the relative pressure was higher, indicating that the catalyst exhibits a wider pore size distribution. Therefore, the prepared catalyst has a multilevel pore structure composed of mesopores and micropores that help improve the adsorption rate of the catalyst.
In Figure 3b, the BJH method was employed to depict the pore size distribution curves of the samples of the catalyst. When the pore size distribution range of the samples is less than 2 nm, they exhibit a micro-pore distribution. Meanwhile, the pore size distribution of mesopores was 2–20 nm, while there were few pore distributions larger than 20 nm.
3.1.4. XRF Characterization
The elemental content of the catalyst was analyzed using X-ray fluorescence spectroscopy, and the results are shown in Table 3.
From the data in the table, it can be seen that the elemental content of Ni is 10.2 wt.%, Ca is 59.5 wt.%, and Al is 29.47 wt.%; in addition, there is a small amount of unwashed Na, of which the content is about 0.83 wt.%.
3.1.5. SEM-EDS Characterization and Analysis
To evaluate the homogeneity of the catalyst composition, an examination was performed on the specimens employing SEM and EDS, as shown in Figure 4. Among them, Figure 4a,b are SEM images captured under 30,000× and 50,000× magnification, respectively, which reveal that Ni monomers are loaded on the carrier surface and show smaller morphologies with a lighter color. Elemental mapping (Figure 4c,d) shows the uniform dispersion of O, Al, Ca, and Ni without obvious agglomeration, indicating that the Ni, CaO, and Ca12Al14O33 particles are in contact with each other, which can effectively maintain the pore structure, delay or impede the sintering process of the catalyst, and enhance its catalytic activity.
3.2. Catalytic Pyrolysis Experimentation
3.2.1. Effect of Temperature
The experiments were carried out utilizing the catalyst comprising of 10 wt.% Ni/CaO-Ca12Al14O33, subjected to a magnetic force intensity of 80 mT, and under a temperature range of 550 to 700 °C. The primary products resulting from the pyrolysis of phenol consist of the gas that is gathered within the gas bag, the solid matter that collects in the condensing bottle, and the carbon that builds up on the catalyst surface. Among them, the solid product is mainly composed of unreacted phenol. The production rates of these three types of products at a temperature of 650 °C are presented in Table 4. As shown, the product collected by the experiment is within the allowable deviation range compared with the raw material and achieves the material balance. The impact of temperature on H2 content and phenol conversion is demonstrated in Figure 5a,b. As temperature increases, the H2 content exhibits a rise and subsequently decreases, ultimately peaking at 72.9% when the temperature reaches 650 °C. Although the change in H2 content was small, the trend was consistent with the previous literature reports [14,21]. This may be attributed to the fact that the 10 wt.% Ni/CaO-Ca12Al14O33 catalyst can effectively adsorb CO2 at 650 °C and promote the positive water–gas shift (WGS) reaction, thereby improving the amount of H2 produced [29]. The phenol conversion increased rapidly in the temperature range of 550–650 °C (from 67.5% to 91%) and increased gradually above 650 °C, peaking at 91.4% at 700 °C. Figure 5c displays the entire output of the non-condensable gas alongside the changes observed in the yields of CO2 CH4, H2, and CO. The maximum yield of the total gas, measuring 676 mL/g, was observed when the temperature reached 700 °C, and its production was found to increase with an increase in temperature. There was a corresponding improvement in the production of CO and H2 as the temperature rose. In contrast, the production of CH4 and CO2 underwent little change, only exhibiting slight modifications. Due to the marginal improvement in the yield of H2 and conversion of phenol at 700 °C in comparison with that at 650 °C, alongside observing the highest content of H2 volume at 650 °C, it was concluded that the most appropriate temperature for catalytic pyrolysis of phenol to hydrogen is 650 °C. This finding is consistent with preceding research [29,30].
3.2.2. Effect of Carrier Gas Velocity
The alteration of the carrier gas velocity during pyrolysis principally influences the duration for which the gas is retained. With an increase of carrier gas velocity, the duration of gas retention is diminished, thereby causing insufficient secondary reaction of the volatile fraction. At a lower carrier gas velocity, a less amount of reaction gas enters the catalyst bed per unit time, which may not be conducive to increasing the reaction rate. Therefore, to balance the reaction rate and conversion rate, a sufficient carrier gas flow rate is required. The main purpose of the study is to investigate the impact of carrier gas flow rate on the catalytic pyrolysis of phenol using the 10 wt.% Ni/CaO-Ca12Al14O33 catalyst and 80 mT magnetism strength. Three distinct flow rates of carrier gas, namely 20 mL/min, 25 mL/min, and 30 mL/min, were selected for the experiment [21].
As depicted in Figure 6, a discernible decline in phenol conversion was observed from 91% to 58% when the carrier gas velocity was gradually augmented from 20 to 30 mL/min. Furthermore, there was a gradual decline observed in the yield of every constituent of the pyrolysis gas. This may be due to the fact that, when the carrier gas velocity is 20 mL/min, the residence time of phenol in the quartz reaction tube is longer, and the phenol is in full contact with the catalyst, resulting in complete catalytic cracking. Hence, high phenol conversion and H2 yield were achieved.
3.2.3. Effect of Magnetic Field
The catalytic pyrolysis process of phenol was realized by employing the catalyst 10 wt.% Ni/CaO-Ca12Al14O33, at 650 °C, with a carrier gas velocity of 20 mL/min and a magnetic field strength ranging from 0 to 80 mT. Figure 7 and Table 5 display the phenol conversion rate and resulting gas yield, which show that the phenol conversion rate increased with rising magnetic field strength, reaching 91% at 80 mT, which is a 22.2% increase compared to that without a magnetic field. The total gas production, encompassing both the production of H2 and CO, exhibited a steady increase in parallel with the elevating magnetic field strength. At an applied magnetic field intensity of 80 mT, hydrogen production reaches a level of 458.5 mL/g, representing an increase of 28.2% compared with the output of 357.55 mL/g without magnetism. This increase in the phenol conversion and H2 yield with increasing magnetic field may be attributed to three mechanisms. Firstly, the magnetic field caused a modification in the spin characteristics of the unpaired electrons present in the outer 3D orbitals of the nickel catalyst, resulting in an enhanced catalytic efficacy of the said catalyst [31,32]. Secondly, the magnetic field could have also interacted with the paramagnetic centers of phenol, resulting in its transformation to an excited state and leading to higher electron/spin states; this accelerated the phenol cleavage rate as well as its conversion to hydrogen [33]. Lastly, the phenoxy and H radicals, which contain unpaired electrons, were produced during phenol cleavage and affected by the presence of magnetism. This led to a modification in the rate and degree of spin evolution, ultimately resulting in an augmentation of the H2 yield [34,35].
3.3. Kinetic Characterization
3.3.1. Pyrolysis Gas Production Characteristics
For the kinetic analysis of phenol-catalyzed pyrolysis of hydrogen, the H2 output characteristics were analyzed under the following conditions: a temperature range spanning from 550 to 750 °C, no magnetic field, and a magnetic field strength of 80 mT. Figure 8 exhibits the trend in the conversion of H2 over time of reaction. The catalytic pyrolysis of pyrolysis achieved the highest H2 production within 20 min, and a higher instantaneous reaction temperature led to increased H2 conversion. With a further increase in pyrolysis time, the conversion rate of H2 decreased, indicating a weakening in the intensity of H2 release. As the temperature was increased, there was a reduction in the time necessary to achieve maximum conversion rate, along with a concomitant improvement in the hydrogen production rate. Incorporating a magnetic force reduced the time required for achieving maximum conversion of H2 by 6–8 min at 650 °C. The reaction rate of hydrogen production through catalytic cracking of phenol was escalated by the magnetic field, thereby hastening the release of H2.
3.3.2. Kinetic Parameter Solving
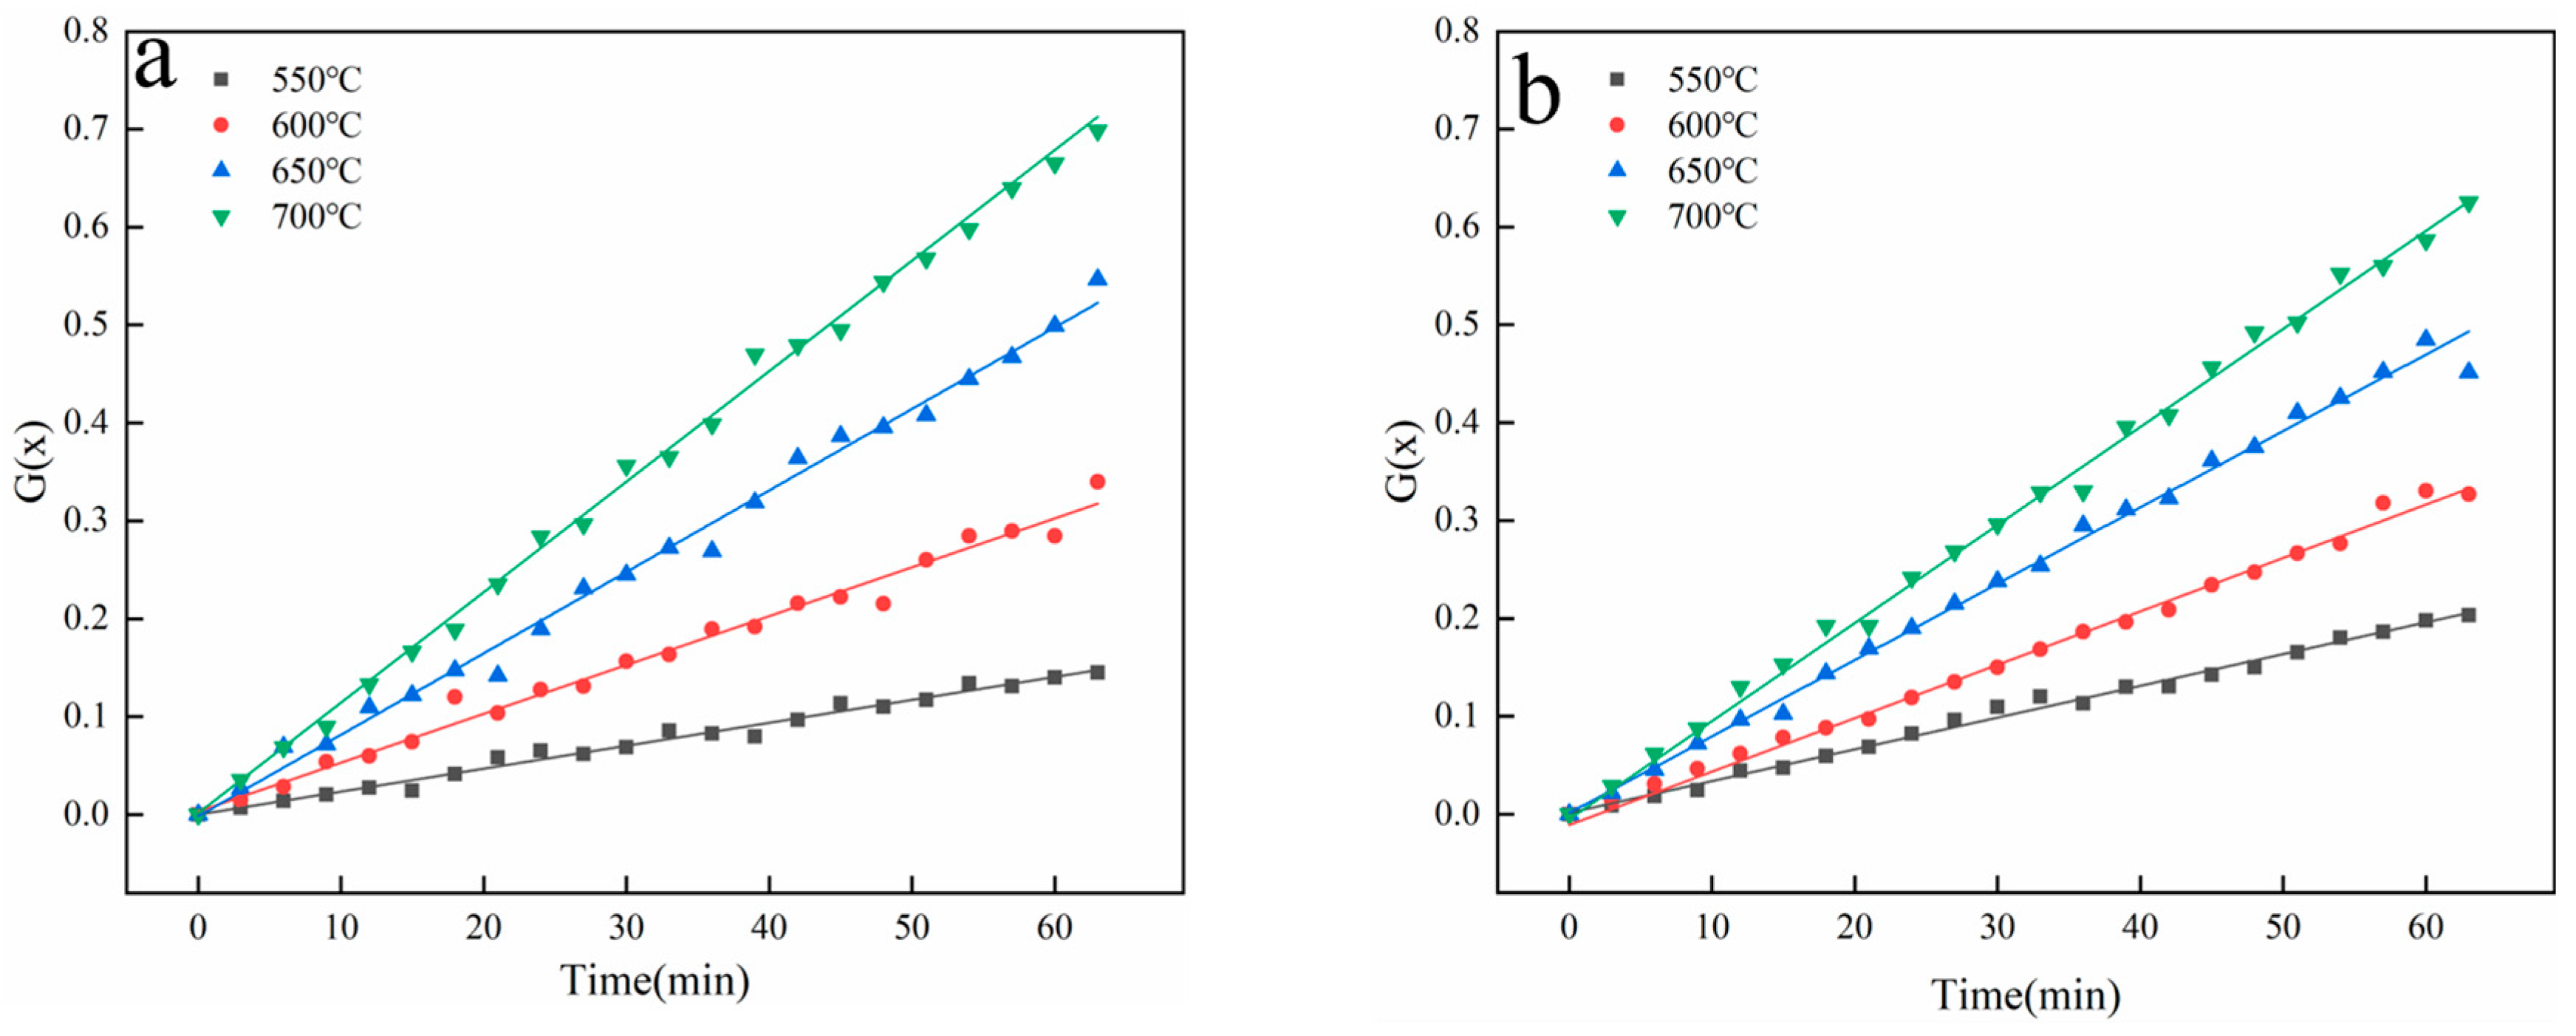
The reaction rate (dx/dt) was calculated from the H2 conversion data in Figure 8, and the model fitting method was used according to Equations (4) and (5). The outcomes of the fittings are depicted in Figure 9, while the activation energy and exponential prefactor are presented in Table 6. Each linear correlation parameter R2 was greater than 0.97, suggesting that the chosen model mechanism function can describe the experimental process of phenol thermal cracking in a magnetic field. Based on the derived kinetic parameters, it was determined that the activation energy needed to produce hydrogen via the pyrolysis of phenol decreased from 45.54 kJ/mol to 23.78 kJ/mol when an 80 mT magnetic field was introduced. This outcome resulted in a facilitation of the production of hydrogen through the process of phenol cracking. This is consistent with the previous findings, which state that magnetic fields enhance the performance and H2 production of the 10 wt.% Ni/CaO-Ca12Al14O33 catalyst.
4. Conclusions
The purpose of this investigation was to examine the catalytic pyrolysis characteristics of phenol in the magnetic field’s presence with the aim of hydrogen production. According to the findings, the incorporation of the magnetic field exerted a positive impact on both the pyrolysis transformation and the production of hydrogen. Kinetic calculations associated with the catalytic pyrolysis of phenol to hydrogen revealed that adding a magnetic field improved the catalyst performance and reduced the activation energy of the reaction, thereby rendering H2 production easier.
Author Contributions
Writing—original draft, Y.L.; methodology, B.Z. and D.Z.; investigation, H.G. and S.L.; formal analysis, A.S. and H.L.; resources, L.S. All authors have read and agreed to the published version of the manuscript.
Funding
This work was supported by the National Key R&D Program of China (2018YFE0106400), Natural Science Foundation of Shandong Province of China (ZR2019MEE069), “20 measures for colleges and universities” of Jinan science and technology bureau (202228123 and 2019GXRC046), Qilu University of Technology (Shandong Academy of Sciences) Science, Education and Industry integration innovation pilot Project (2022GH010).
Data Availability Statement
Data sharing is not applicable.
Conflicts of Interest
The authors declare no conflict of interest.
References
- Zhao, M.; Memon, M.Z.; Ji, G.; Yang, X.; Vuppaladadiyam, A.K.; Song, Y.; Raheem, A.; Li, J.; Wang, W.; Zhou, H. Alkali metal bifunctional catalyst-sorbents enabled biomass pyrolysis for enhanced hydrogen production. Renew. Energy 2020, 148, 168–175. [Google Scholar] [CrossRef]
- Kostyniuk, A.; Bajec, D.; Prašnikar, A.; Likozar, B. Catalytic hydrocracking, hydrogenation, and isomerization reactions of model biomass tar over (W/Ni)-zeolites. J. Ind. Eng. Chem. 2021, 101, 293–306. [Google Scholar] [CrossRef]
- Wang, W.; Fan, L.W.; Zhou, P. Evolution of global fossil fuel trade dependencies. Energy 2022, 238, 121924. [Google Scholar] [CrossRef]
- Guo, F.; Dong, Y.; Fan, P.; Lv, Z.; Yang, S.; Dong, L. Catalytic decomposition of biomass tar compound by calcined coal gangue: A kinetic study. Int. J. Hydrogen Energy 2016, 41, 13380–13389. [Google Scholar] [CrossRef]
- Mei, D.; Wang, Y.; Liu, S.; Alliati, M.; Yang, H.; Tu, X. Plasma reforming of biomass gasification tars using mixed naphthalene and toluene as model compounds. Energy Convers. Manag. 2019, 195, 409–419. [Google Scholar] [CrossRef]
- Liu, L.; Liu, Y.; Song, J.; Ahmad, S.; Liang, J.; Sun, Y. Plasma-enhanced steam reforming of different model tar compounds over Ni-based fusion catalysts. J. Hazard Mater. 2019, 377, 24–33. [Google Scholar] [CrossRef]
- Sulan, W.; Quanguo, Z.; Jihong, L. Chemical composition of biomass tar and its distillations. Acta Energ. Sol. Sin. 2006, 27, 651. [Google Scholar]
- Ellison, C.R.; Boldor, D. Mild upgrading of biomass pyrolysis vapors via ex-situ catalytic pyrolysis over an iron-montmorillonite catalyst. Fuel 2021, 291, 120226. [Google Scholar] [CrossRef]
- Gao, N.; Han, Y.; Quan, C.; Wu, C. Promoting hydrogen-rich syngas production from catalytic reforming of biomass pyrolysis oil on nanosized nickel-ceramic catalysts. Appl. Therm. Eng. 2017, 125, 297–305. [Google Scholar] [CrossRef]
- Li, B.; Yang, H.; Wei, L.; Shao, J.; Wang, X.; Chen, H. Hydrogen production from agricultural biomass wastes gasification in a fluidized bed with calcium oxide enhancing. Int. J. Hydrogen Energy 2017, 42, 4832–4839. [Google Scholar] [CrossRef]
- Xue, A.J.; Pan, J.H.; Tian, M.C. Experimental Study on Catalytic Pyrolysis of Biomass Pellet. In Applied Mechanics and Materials; Trans Tech Publications: Zurich, Switzerland, 2013; pp. 320–323. [Google Scholar]
- Li, B.; Magoua Mbeugang, C.F.; Huang, Y.; Liu, D.; Wang, Q.; Zhang, S. A review of CaO based catalysts for tar removal during biomass gasification. Energy 2022, 244, 123172. [Google Scholar] [CrossRef]
- Xu, A.; Zhou, W.; Zhang, X.; Zhao, B.; Chen, L.; Sun, L.; Ding, W.; Yang, S.; Guan, H.; Bai, B. Gas production by catalytic pyrolysis of herb residues using Ni/CaO catalysts. J. Anal. Appl. Pyrolysis 2018, 130, 216–223. [Google Scholar] [CrossRef]
- Zhao, B.; Song, G.; Zhou, W.; Chen, L.; Sun, L.; Yang, S.; Guan, H.; Zhu, D.; Chen, G.; Ding, W.; et al. Catalytic Pyrolysis of Herb Residues for the Preparation of Hydrogen-Rich Gas. Energy Fuels 2019, 34, 1131–1136. [Google Scholar] [CrossRef]
- Yue, W.; Ma, X.; Yu, Z.; Liu, H.; Li, M.; Lu, X. Ni-CaO bifunctional catalyst for biomass catalytic pyrolysis to produce hydrogen-rich gas. J. Anal. Appl. Pyrolysis 2023, 169, 105872. [Google Scholar] [CrossRef]
- Dang, C.; Li, Z.; Long, J.; Yang, W.; Cai, W. Sorption-enhanced glycerol steam reforming over hierarchical hollow Ni-CaO-Ca12Al14O33 bi-functional catalyst derived from hydrotalcite-like compounds. Fuel 2022, 324, 124468. [Google Scholar] [CrossRef]
- Liu, L.; Hong, D.; Wang, N.; Guo, X. High purity H2 production from sorption enhanced bio-ethanol reforming via sol-gel-derived Ni–CaO–Al2O3 bi-functional materials. Int. J. Hydrogen Energy 2020, 45, 34449–34460. [Google Scholar] [CrossRef]
- Wang, Q.; Xie, W.; Jia, X.; Chen, B.; An, S.; Xie, X.; Huang, L. Ca–Al layered double hydroxides-derived Ni-based catalysts for hydrogen production via auto-thermal reforming of acetic acid. Int. J. Hydrogen Energy 2019, 44, 20007–20016. [Google Scholar] [CrossRef]
- Donphai, W.; Piriyawate, N.; Witoon, T.; Jantaratana, P.; Varabuntoonvit, V.; Chareonpanich, M. Effect of magnetic field on CO2 conversion over Cu-ZnO/ZrO2 catalyst in hydrogenation reaction. J. CO2 Util. 2016, 16, 204–211. [Google Scholar] [CrossRef]
- Kiatphuengporn, S.; Jantaratana, P.; Limtrakul, J.; Chareonpanich, M. Magnetic field-enhanced catalytic CO2 hydrogenation and selective conversion to light hydrocarbons over Fe/MCM-41 catalysts. Chem. Eng. J. 2016, 306, 866–875. [Google Scholar] [CrossRef]
- Zhao, B.; Yang, H.; Zhang, H.; Zhong, C.; Wang, J.; Zhu, D.; Guan, H.; Sun, L.; Yang, S.; Chen, L.; et al. Study on hydrogen-rich gas production by biomass catalytic pyrolysis assisted with magnetic field. J. Anal. Appl. Pyrolysis 2021, 157, 105227. [Google Scholar] [CrossRef]
- Guo, F.; Dong, Y.; Fan, P.; Lv, Z.; Yang, S.; Dong, L. Detailed kinetic study of phenol decomposition under isothermal conditions to understand tar catalytic cracking process. J. Anal. Appl. Pyrolysis 2016, 118, 155–163. [Google Scholar] [CrossRef]
- Gai, C.; Dong, Y.; Lv, Z.; Zhang, Z.; Liang, J.; Liu, Y. Pyrolysis behavior and kinetic study of phenol as tar model compound in micro fluidized bed reactor. Int. J. Hydrogen Energy 2015, 40, 7956–7964. [Google Scholar] [CrossRef]
- Gai, C.; Zhang, Y.; Chen, W.-T.; Zhang, P.; Dong, Y. Thermogravimetric and kinetic analysis of thermal decomposition characteristics of low-lipid microalgae. Bioresour. Technol. 2013, 150, 139–148. [Google Scholar] [CrossRef] [PubMed]
- White, J.E.; Catallo, W.J.; Legendre, B.L. Biomass pyrolysis kinetics: A comparative critical review with relevant agricultural residue case studies. J. Anal. Appl. Pyrolysis 2011, 91, 1–33. [Google Scholar] [CrossRef]
- Shokrollahi Yancheshmeh, M.; Radfarnia, H.R.; Iliuta, M.C. High temperature CO2 sorbents and their application for hydrogen production by sorption enhanced steam reforming process. Chem. Eng. J. 2016, 283, 420–444. [Google Scholar] [CrossRef]
- Xu, P.; Zhou, Z.; Zhao, C.; Cheng, Z. Ni/CaO-Al2O3 bifunctional catalysts for sorption-enhanced steam methane reforming. AIChE J. 2014, 60, 3547–3556. [Google Scholar] [CrossRef]
- Yang, S.; Chen, L.; Sun, L.; Xie, X.; Zhao, B.; Si, H.; Zhang, X.; Hua, D. Novel Ni–Al nanosheet catalyst with homogeneously embedded nickel nanoparticles for hydrogen-rich syngas production from biomass pyrolysis. Int. J. Hydrogen Energy 2021, 46, 1762–1776. [Google Scholar] [CrossRef]
- Zhao, B.; Zhang, X.; Xu, A.; Ding, W.; Sun, L.; Chen, L.; Guan, H.; Yang, S.; Zhou, W. A study of the in-situ CO2 removal pyrolysis of Chinese herb residue for syngas production. Sci Total Environ. 2018, 626, 703–709. [Google Scholar] [CrossRef]
- Zhao, B.; Wang, J.; Zhu, D.; Song, G.; Yang, H.; Chen, L.; Sun, L.; Yang, S.; Guan, H.; Xie, X. Adsorption Characteristics of Gas Molecules (H2O, CO2, CO, CH4, and H2) on CaO-Based Catalysts during Biomass Thermal Conversion with In Situ CO2 Capture. Catalysts 2019, 9, 757. [Google Scholar] [CrossRef]
- Lin, P.; Peng, J.; Hou, B.; Fu, Y. Effects of magnetic field on catalytic activity of CO monoxide oxidation and O2 adsorption over Ln0.7Sr0.3MnO3. J. Phys. Chem. B 1993, 97, 1471–1473. [Google Scholar] [CrossRef]
- Pan, L.; Ai, M.; Huang, C.; Yin, L.; Liu, X.; Zhang, R.; Wang, S.; Jiang, Z.; Zhang, X.; Zou, J.J.; et al. Manipulating spin polarization of titanium dioxide for efficient photocatalysis. Nat. Commun. 2020, 11, 418. [Google Scholar] [CrossRef]
- Mammadova, T.; Abbasov, M.; Movsumov, N.; Latifova, T.; Hasanova, A.; Kocharli, Z.; Khalafova, İ.; Abbasov, V. Production of diesel fractions by catalytic cracking of vacuum gas oil and its mixture with cottonseed oil under the influence of a magnetic field. Egypt. J. Pet. 2018, 27, 1029–1033. [Google Scholar] [CrossRef]
- Matas Güell, B.; Babich, I.V.; Lefferts, L.; Seshan, K. Steam reforming of phenol over Ni-based catalysts—A comparative study. Appl. Catal. B Environ. 2011, 106, 280–286. [Google Scholar] [CrossRef]
- Rodgers, C.T. Magnetic field effects in chemical systems. Pure Appl. Chem. 2009, 81, 19–43. [Google Scholar] [CrossRef]
Figure 1.
Fixed bed pyrolysis system.
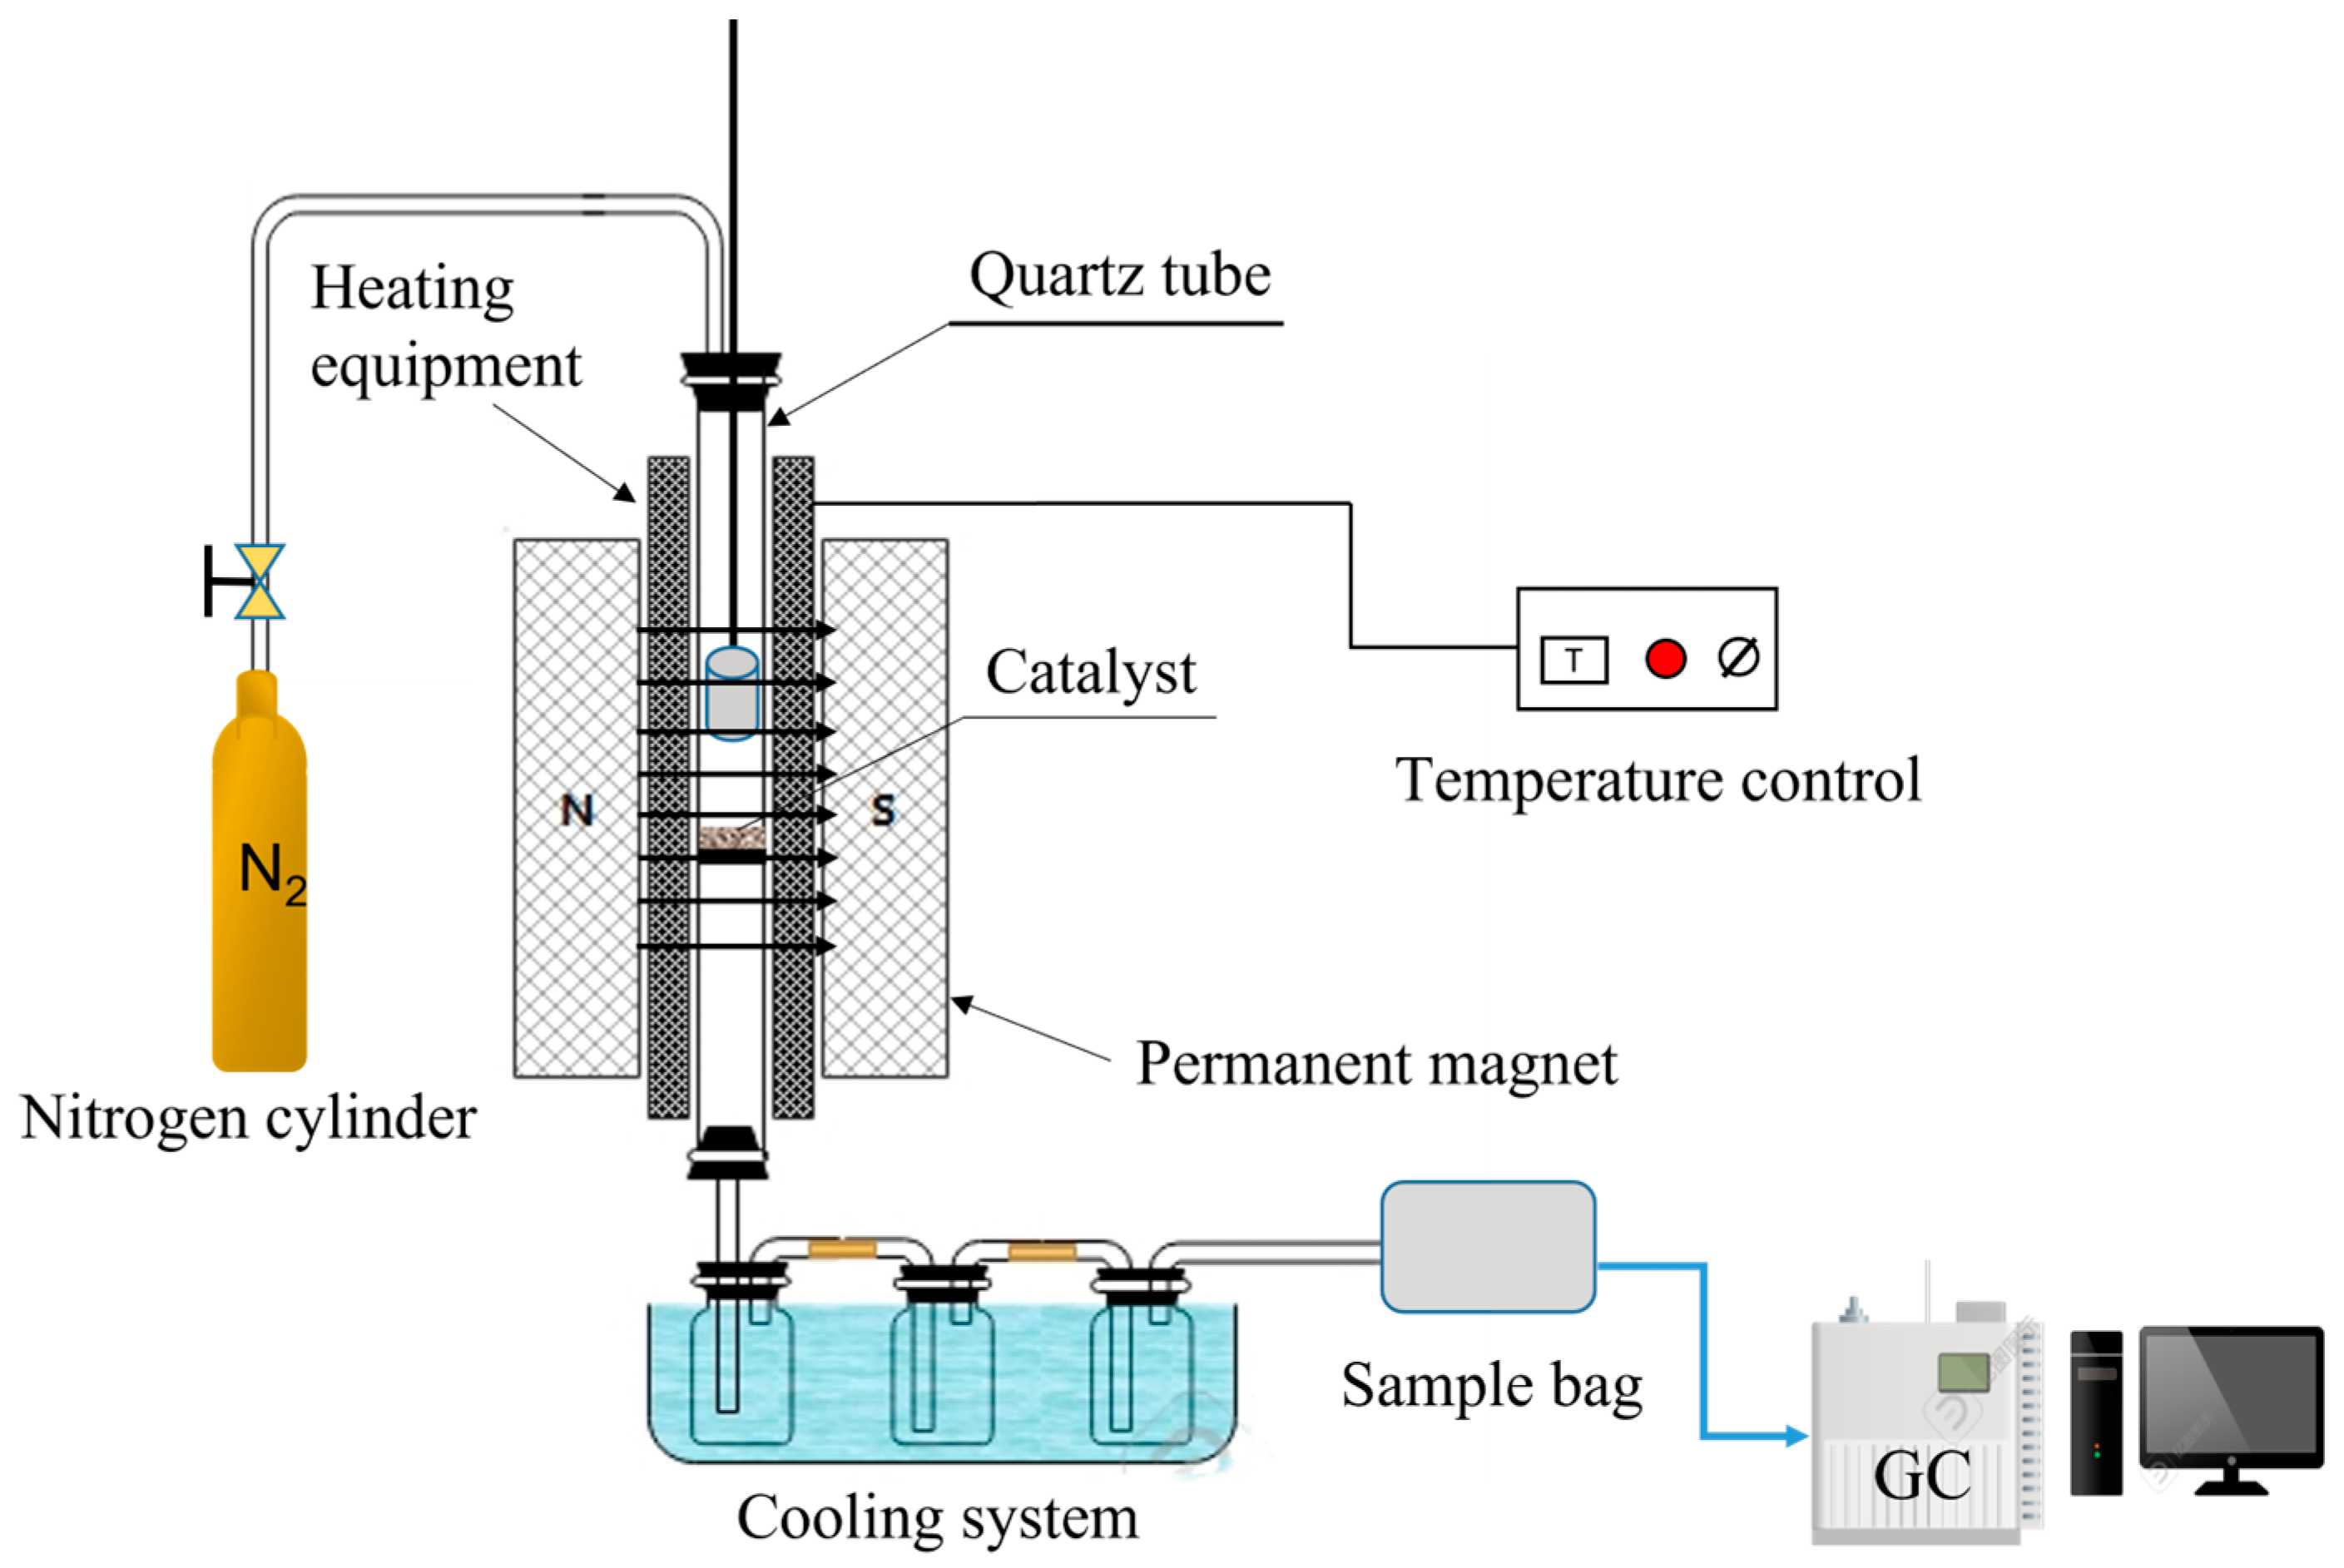
Figure 2.
Characterization of the catalyst: (a) pre-reduction catalyst XRD, (b) catalyst XRD after reduction, (c) catalyst XRD after experiment, and (d) the magnetic hysteresis loops of the catalyst prior to and subsequent to the reduction process.
Figure 2.
Characterization of the catalyst: (a) pre-reduction catalyst XRD, (b) catalyst XRD after reduction, (c) catalyst XRD after experiment, and (d) the magnetic hysteresis loops of the catalyst prior to and subsequent to the reduction process.
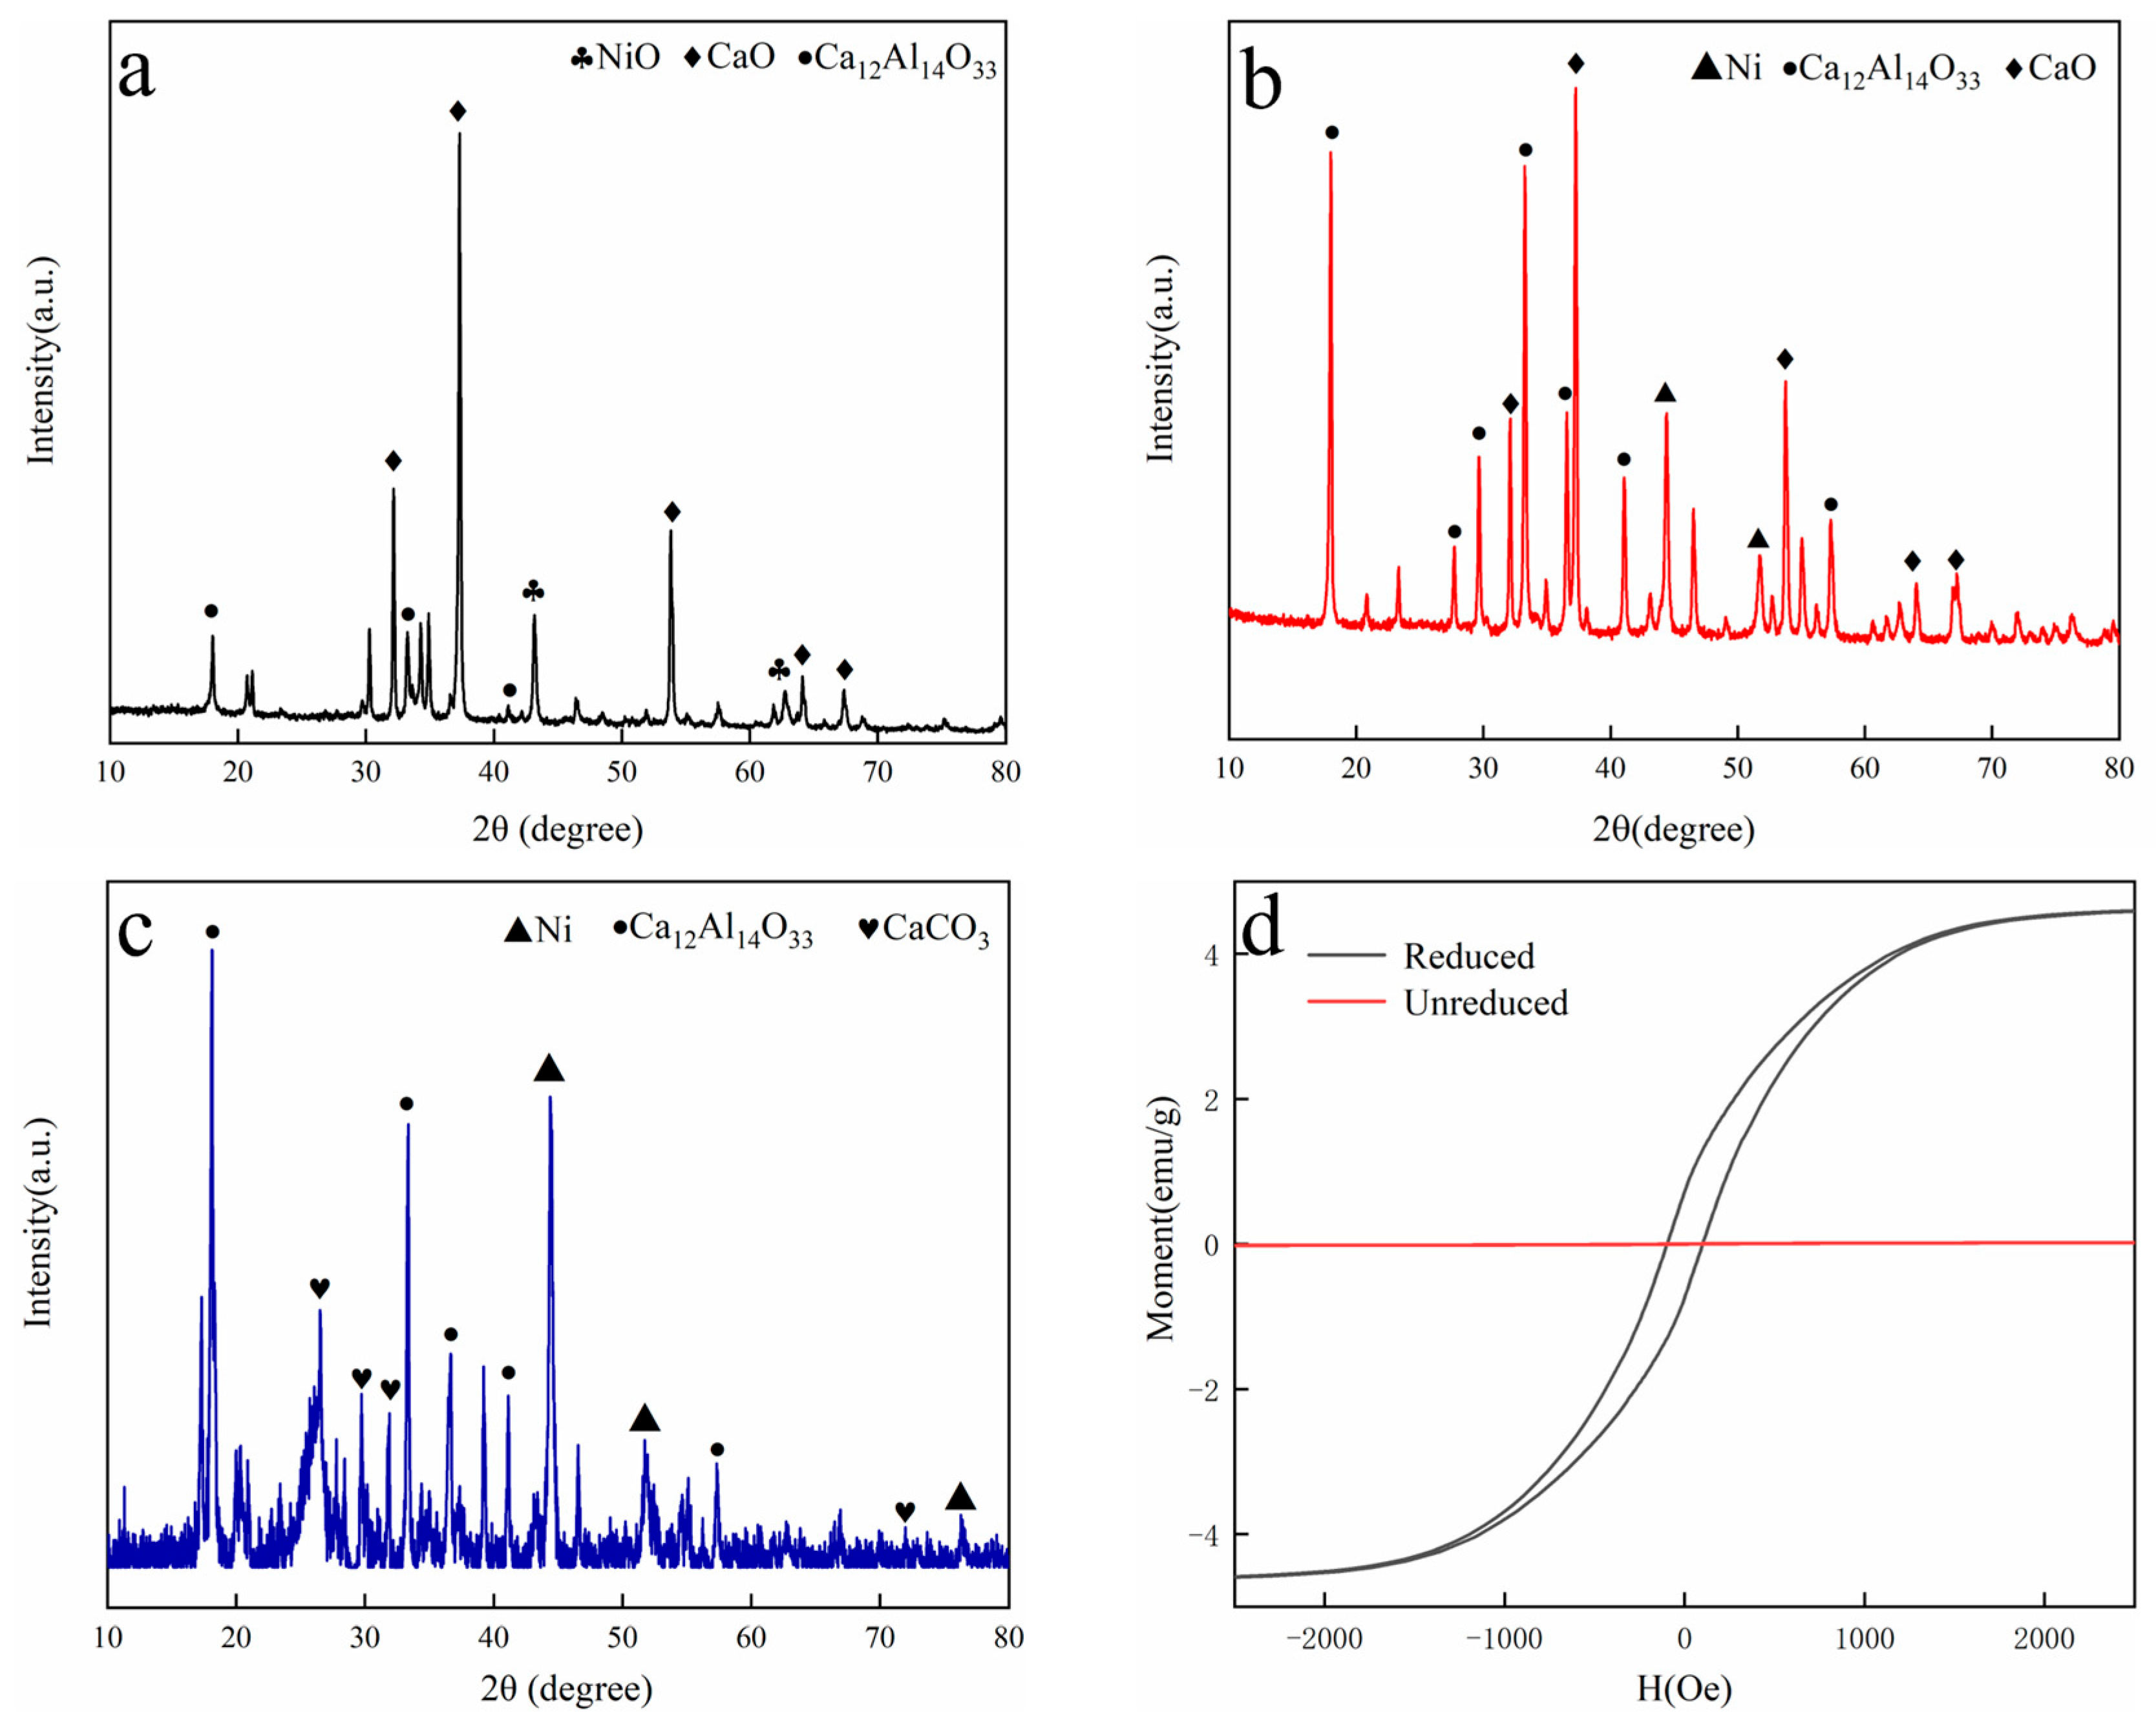
Figure 3.
(a,b) N2 adsorption and desorption isotherm of the reduced catalyst.
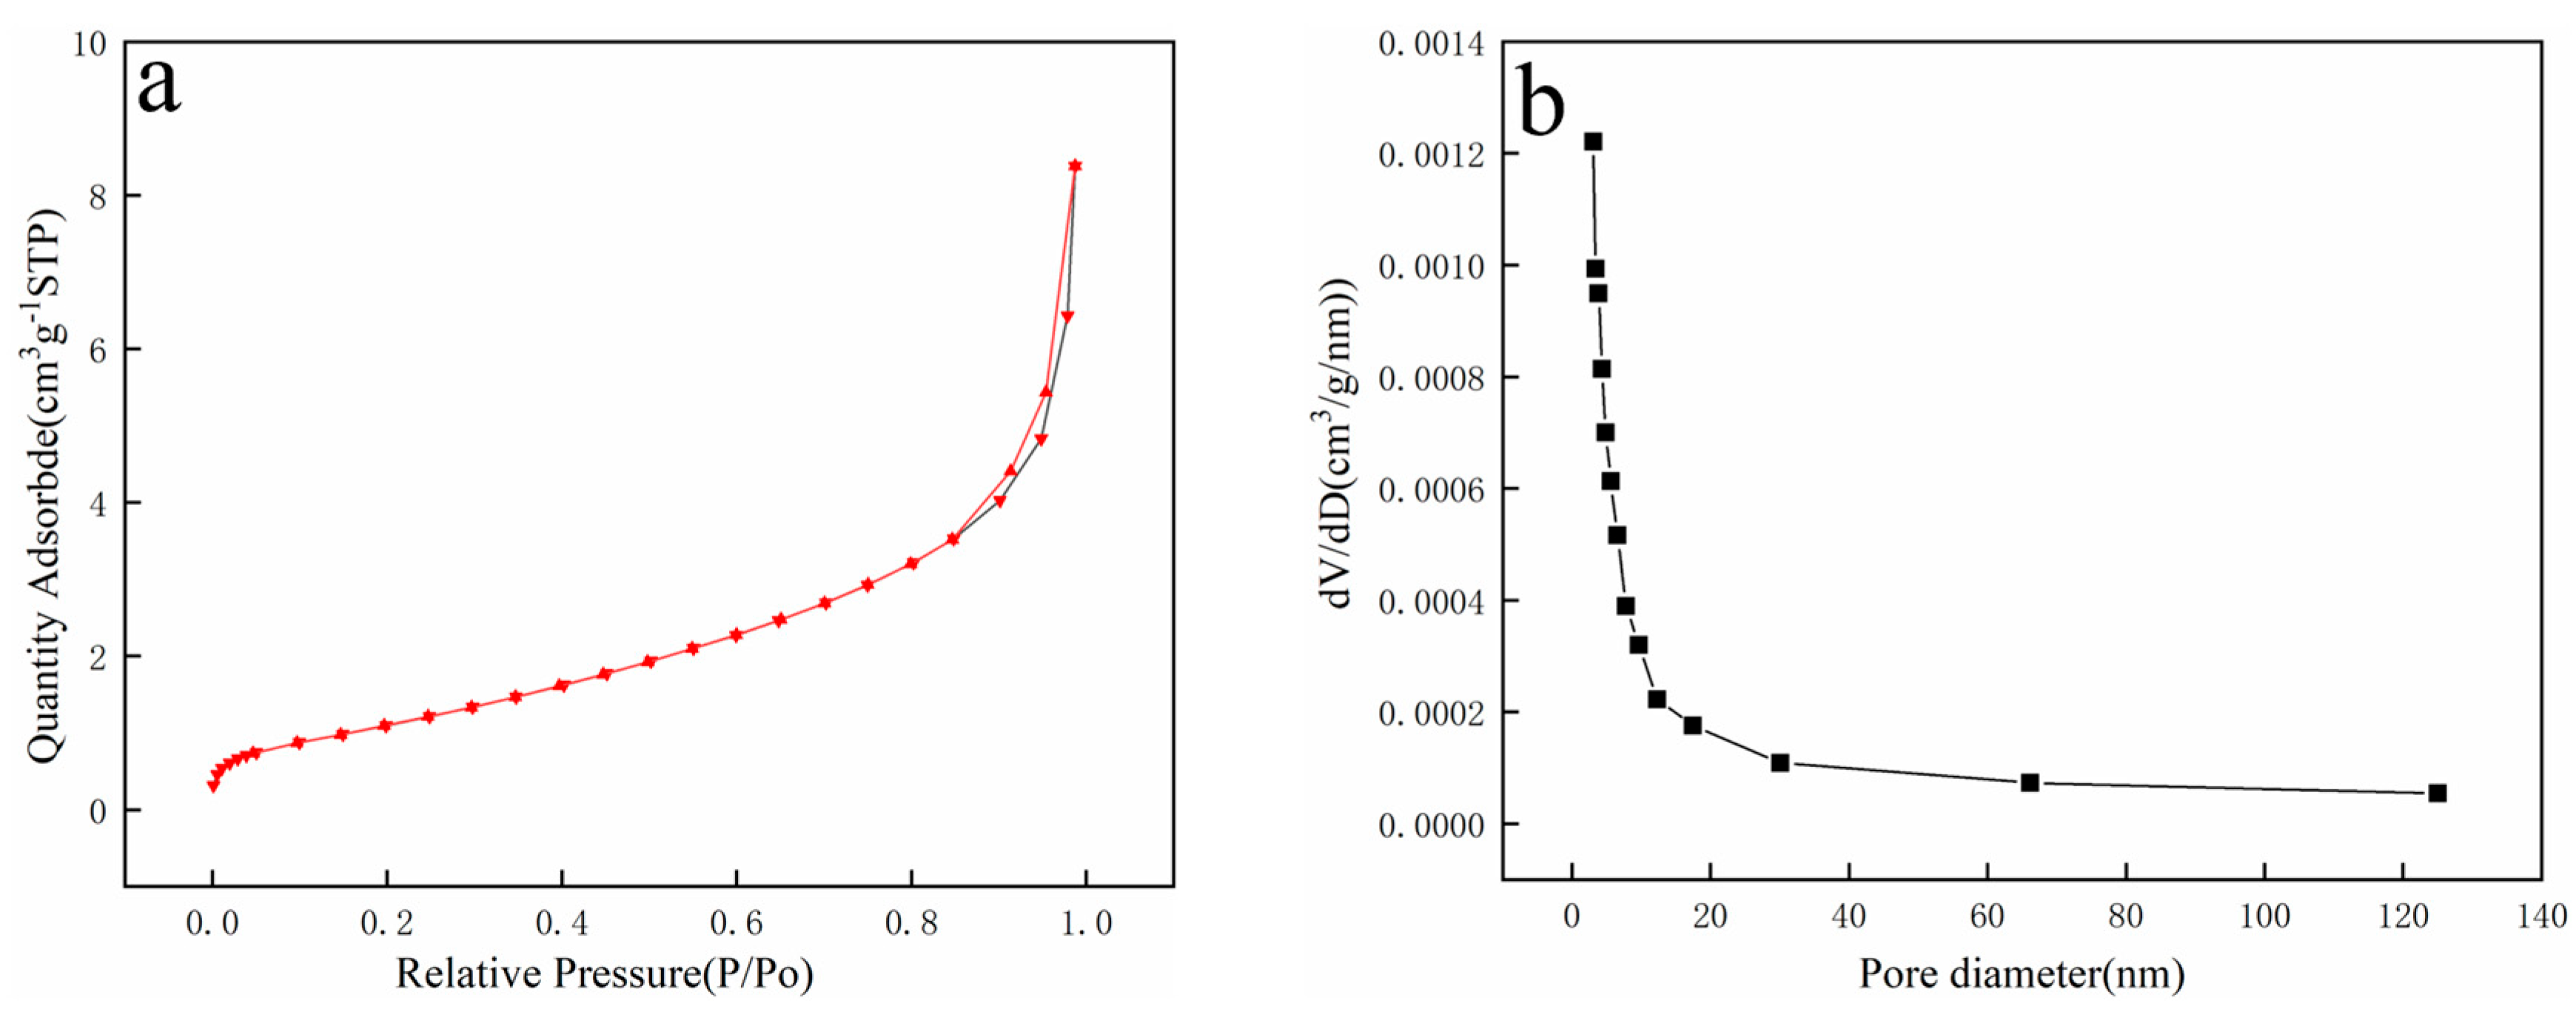
Figure 4.
SEM-EDS images of catalyst ((a) magnification 30,000×, (b) magnification 50,000×, (c,d) are catalyst element mappings).
Figure 4.
SEM-EDS images of catalyst ((a) magnification 30,000×, (b) magnification 50,000×, (c,d) are catalyst element mappings).
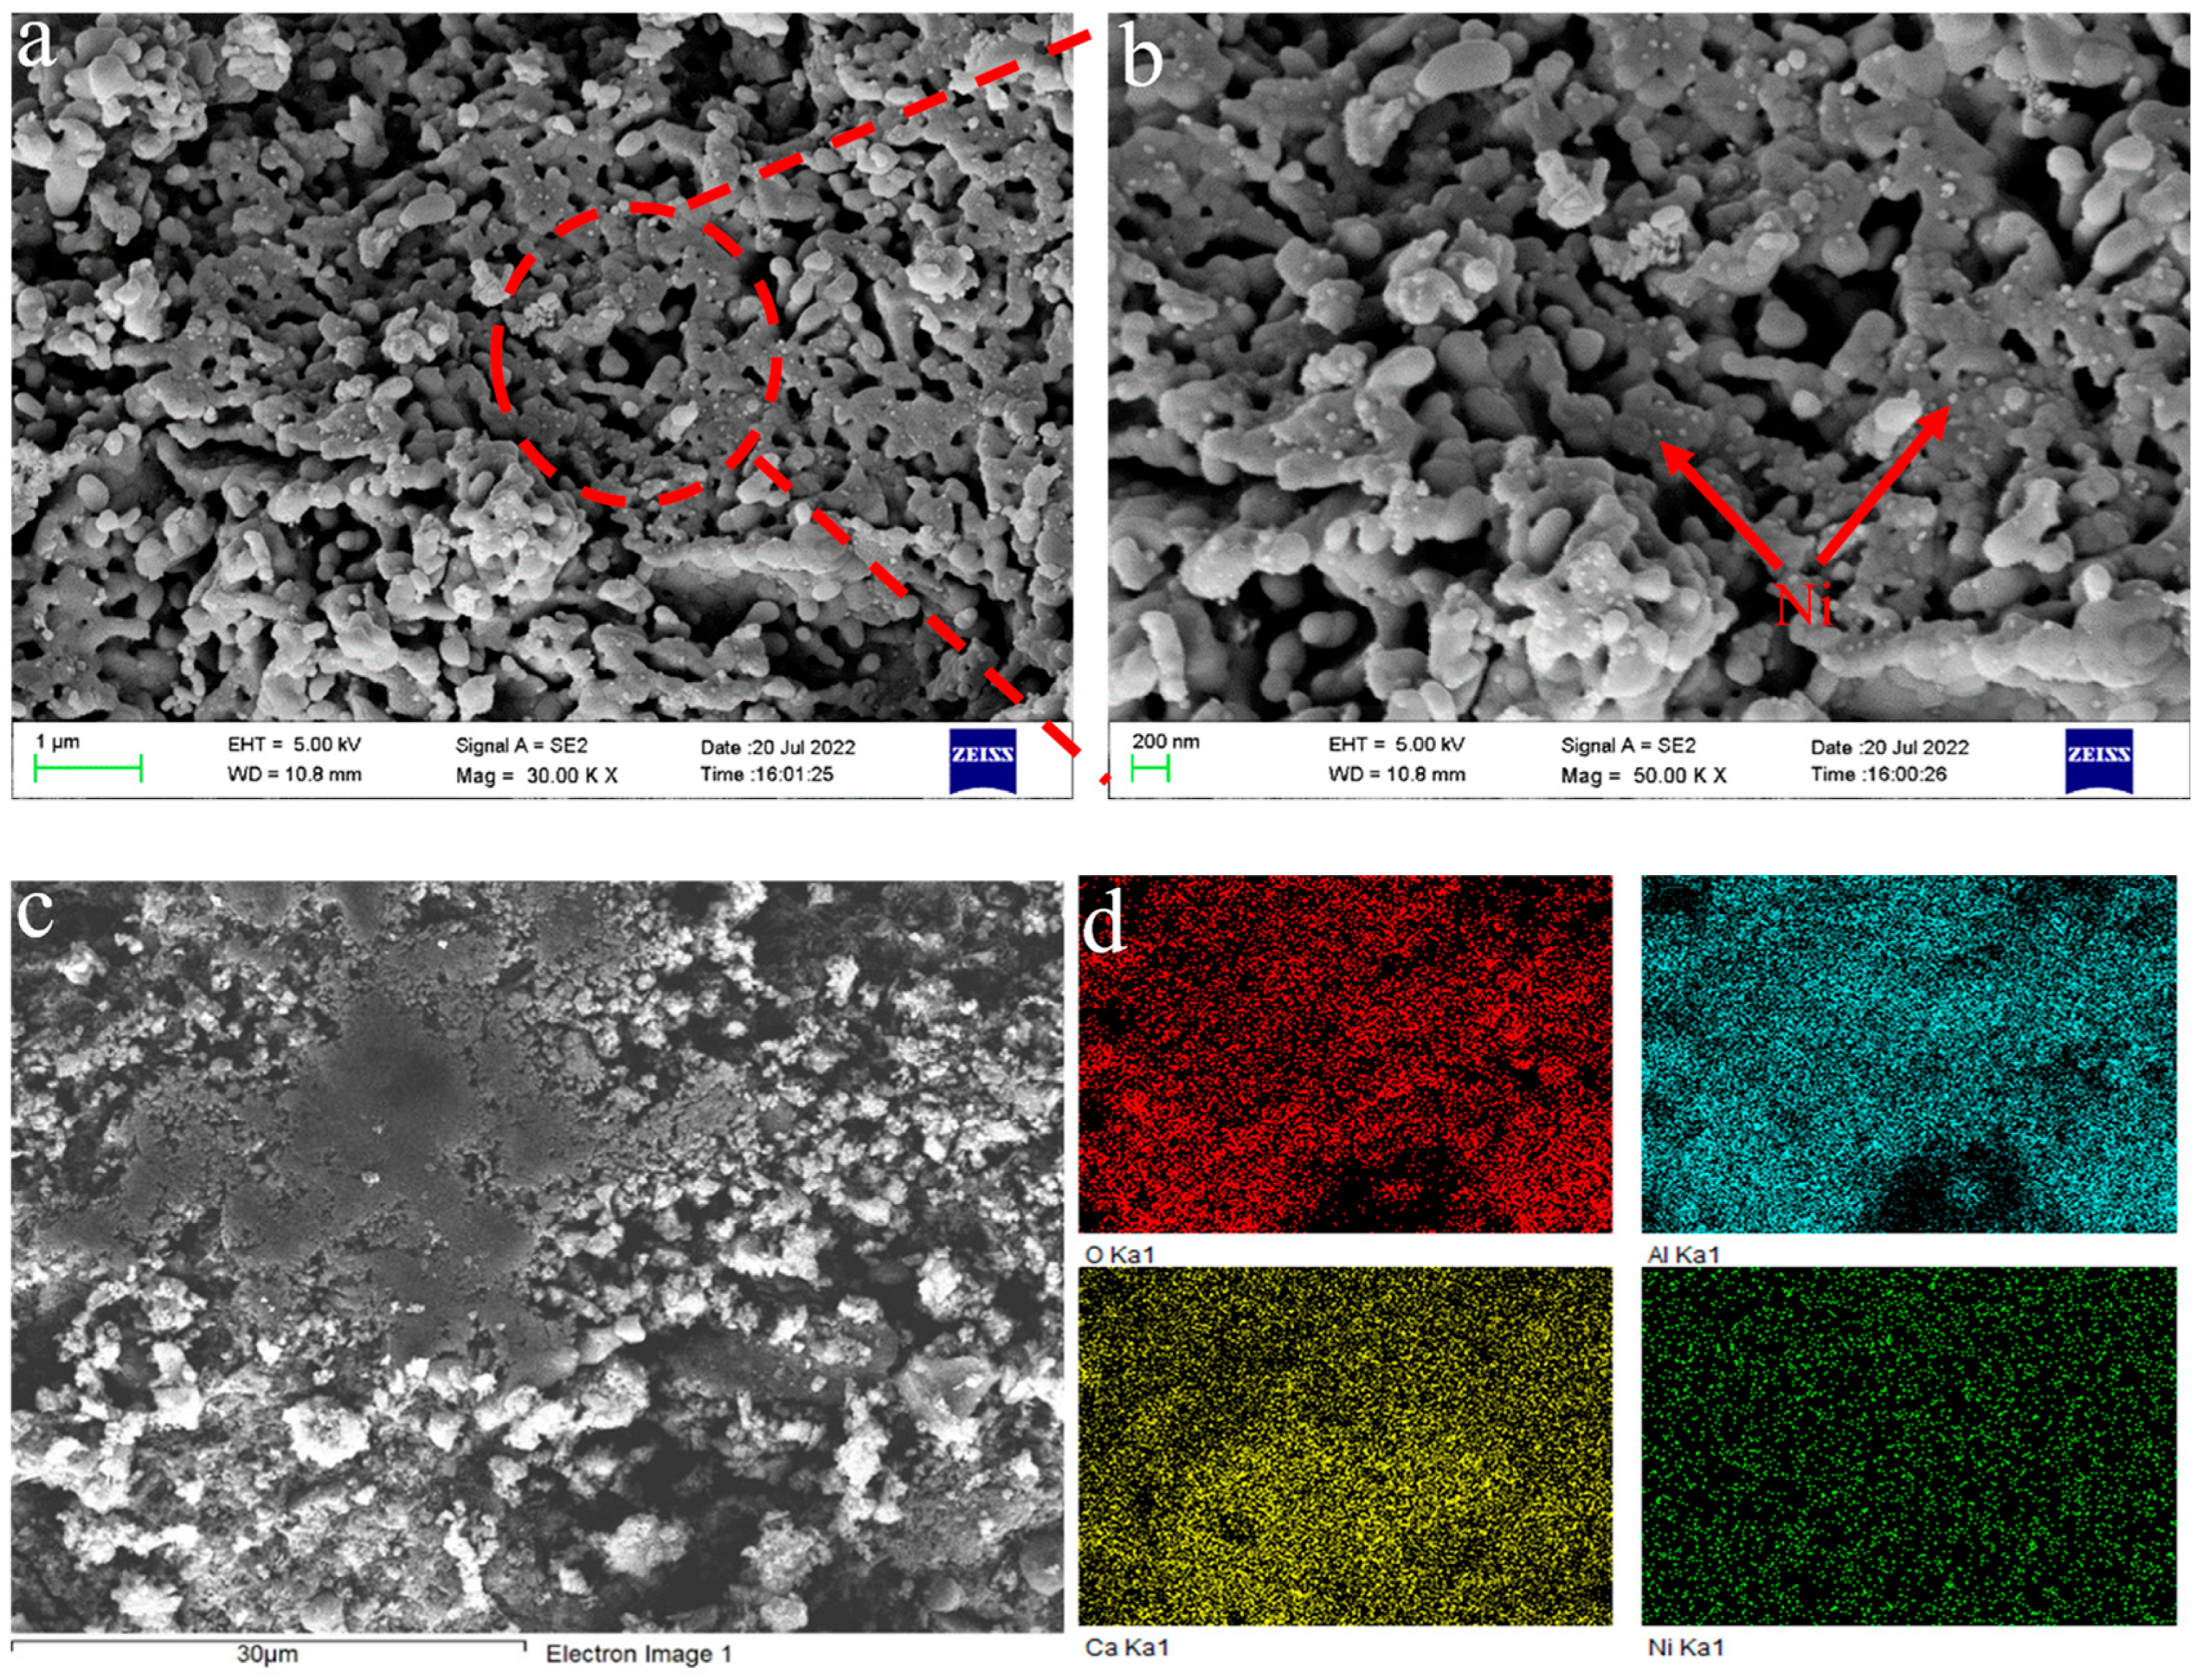
Figure 5.
Effect of temperature: (a) H2 content, (b) phenol conversion, and (c) changing trend of gas product distribution under different temperature.
Figure 5.
Effect of temperature: (a) H2 content, (b) phenol conversion, and (c) changing trend of gas product distribution under different temperature.

Figure 6.
The influence of carrier gas velocity on the experiment.

Figure 7.
The influence of magnetic force intensity on the experiment.
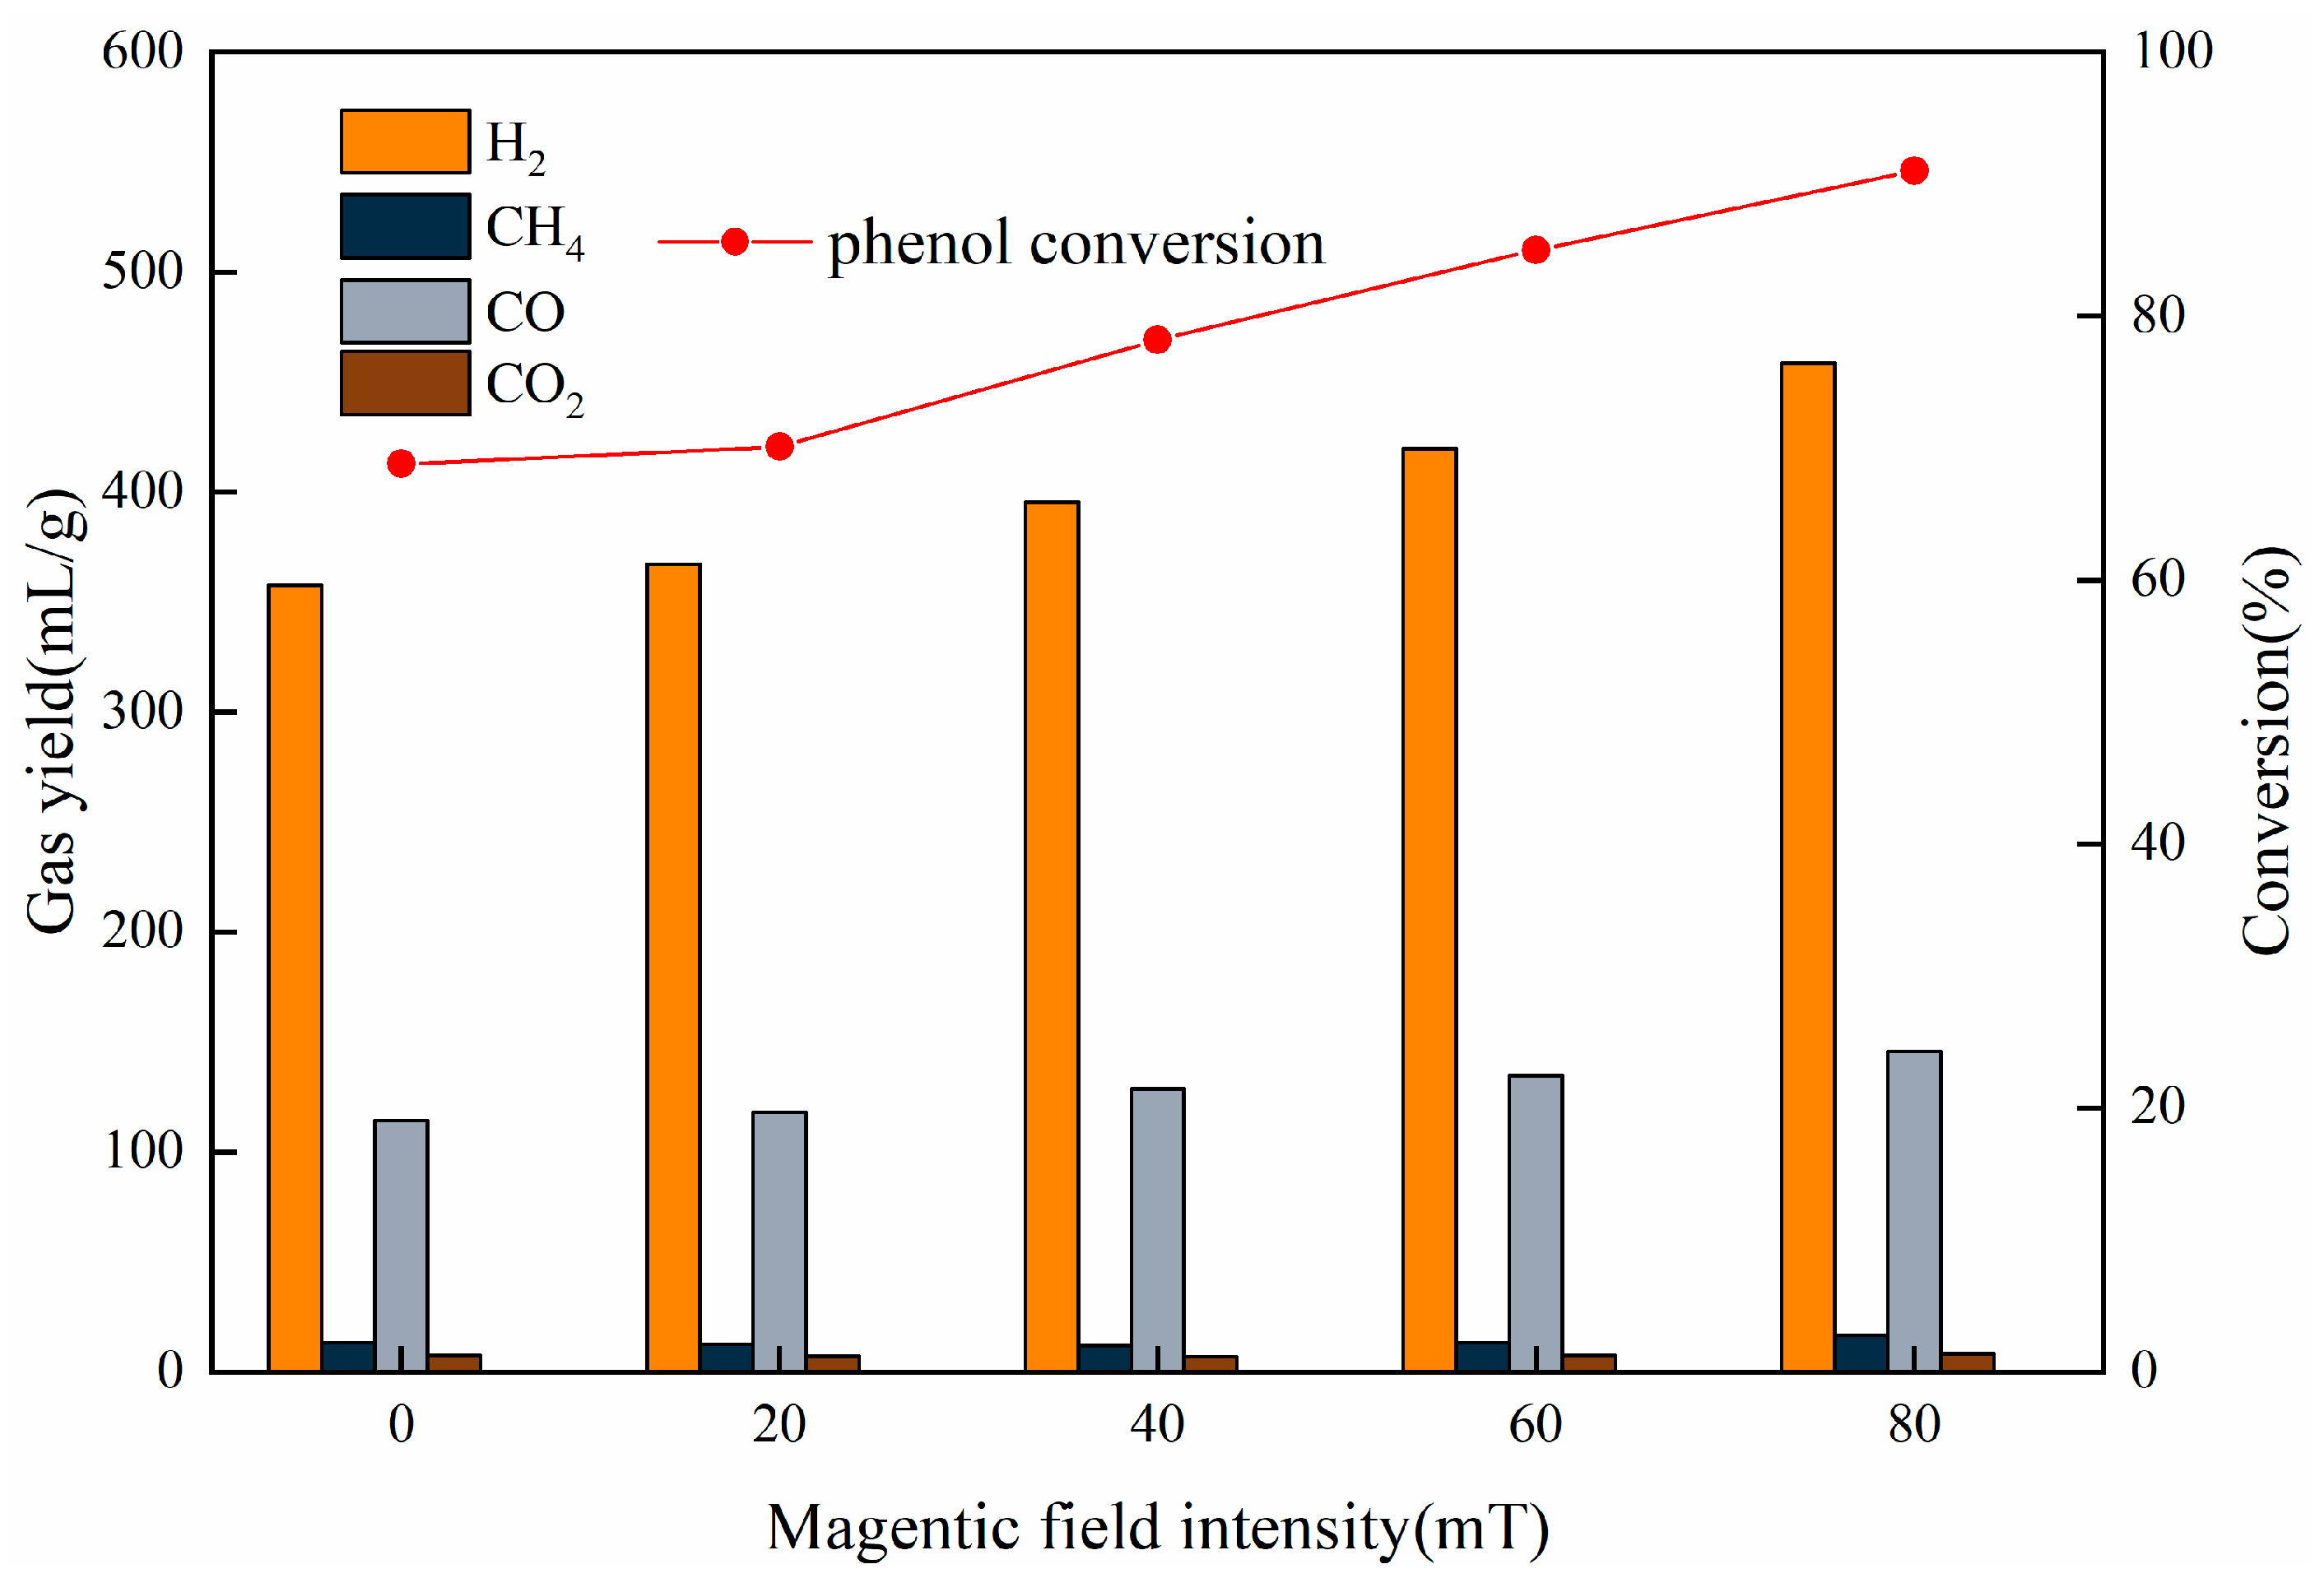
Figure 8.
The impact of the strength of magnetism on the characteristics of hydrogen production via pyrolysis (a) 0 mT (b) 80 mT.
Figure 8.
The impact of the strength of magnetism on the characteristics of hydrogen production via pyrolysis (a) 0 mT (b) 80 mT.
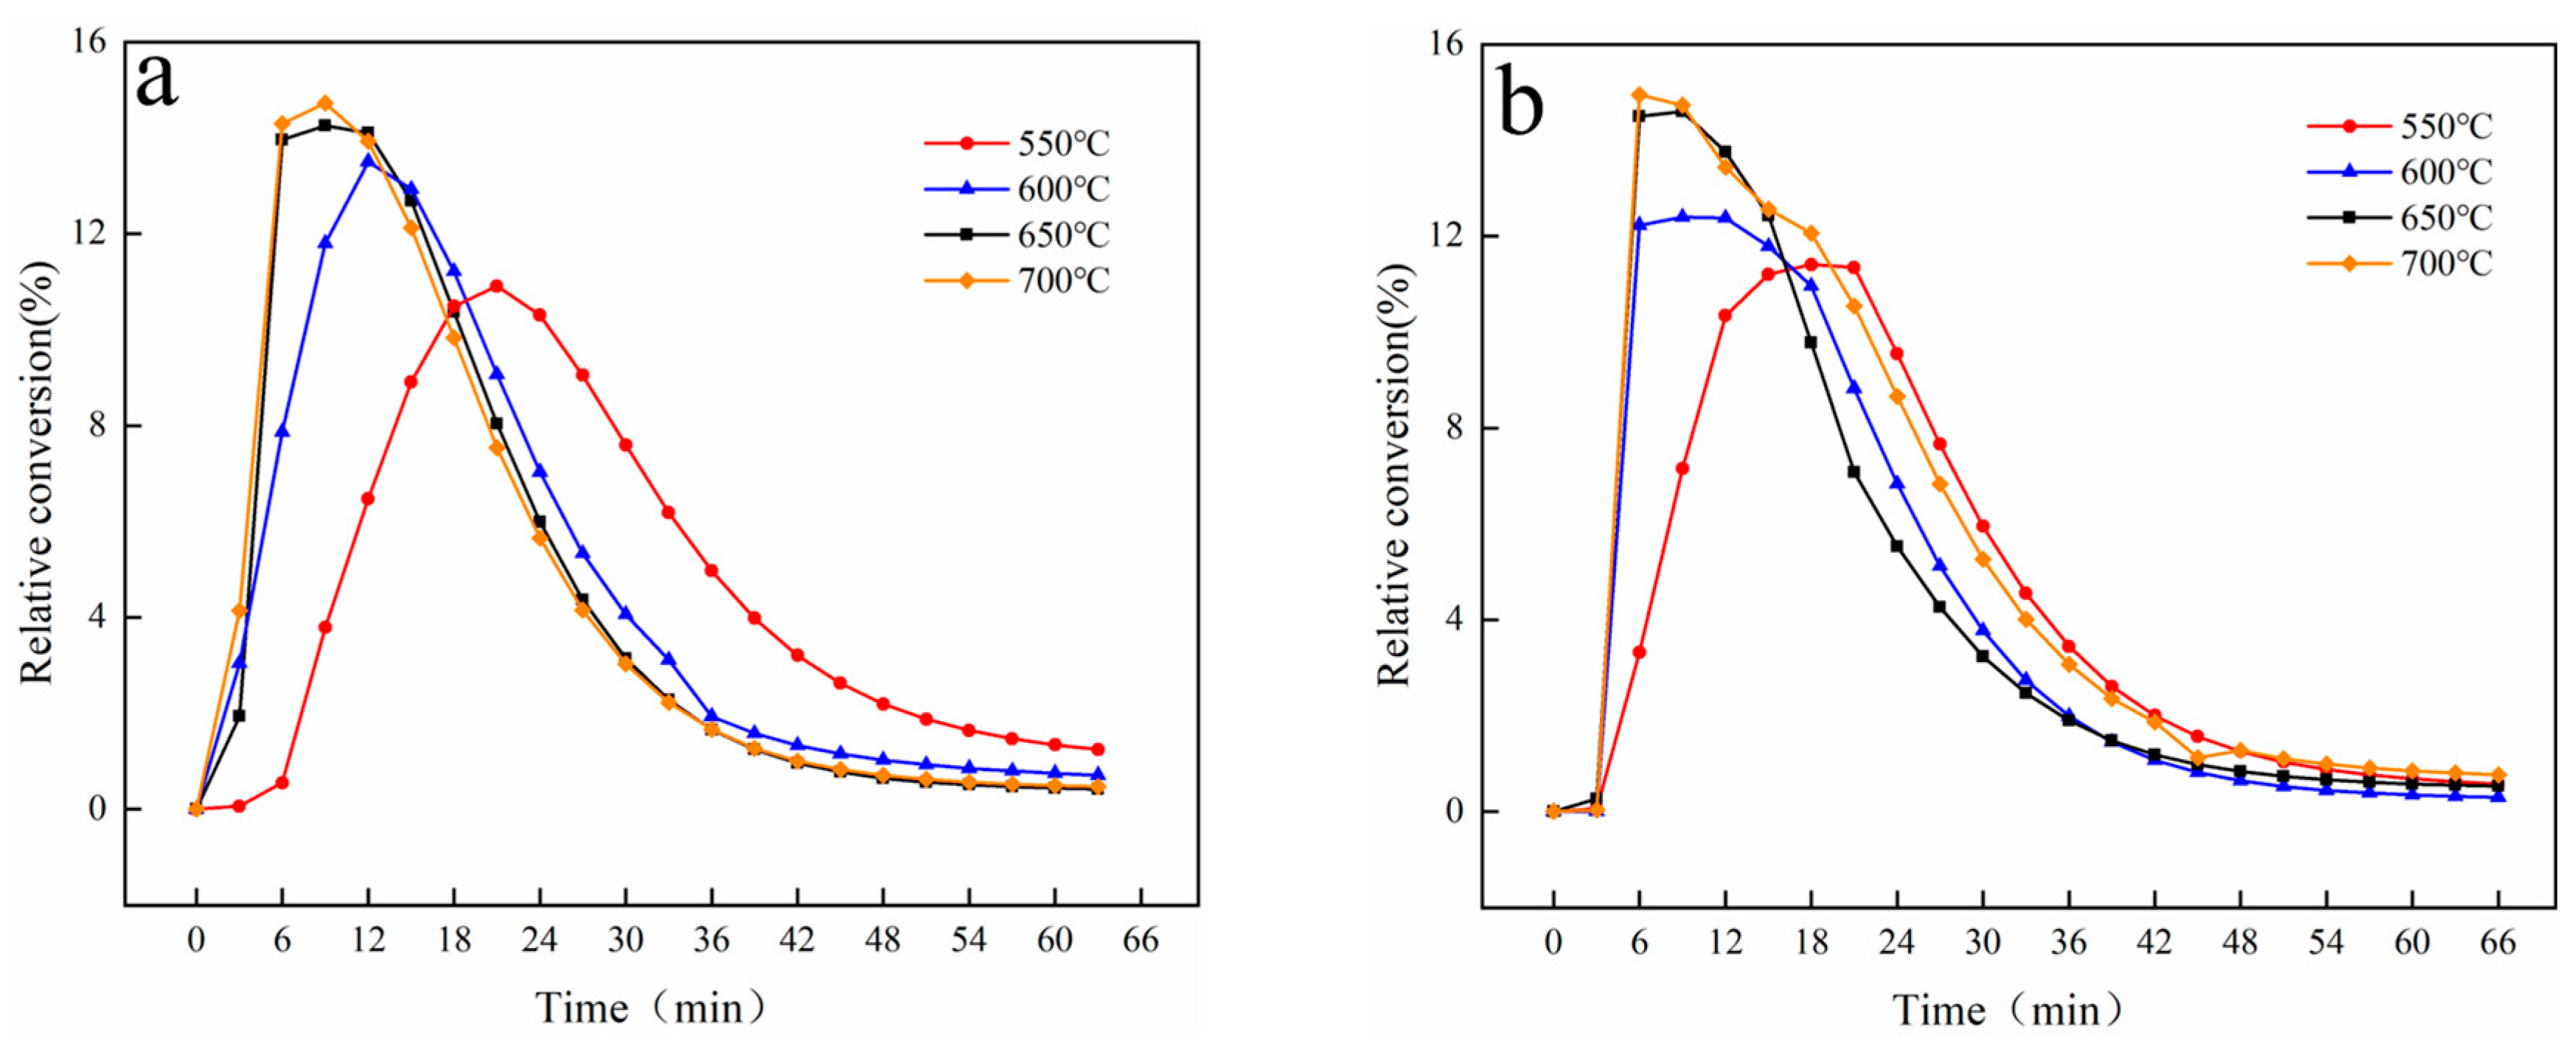
Figure 9.
Linear fitting of hydrogen production from phenol pyrolysis under different magnetic field strengths (a) 0 mT (b) 80 mT.
Figure 9.
Linear fitting of hydrogen production from phenol pyrolysis under different magnetic field strengths (a) 0 mT (b) 80 mT.

Table 1.
The magnetic characteristics of the catalyst both prior to and subsequent to its reduction.
Table 1.
The magnetic characteristics of the catalyst both prior to and subsequent to its reduction.
| Catalyst | Ms (emu/g) | Mr (emu/g) | Hc (Oe) |
|---|---|---|---|
| Unreduced | 0 | 0 | 0 |
| Reduced | 4.62 | 0.71 | 10117.28 |
Table 2.
Analysis of specific surface area and pore size distribution of catalysts.
| Catalyst | SBET (m2/g) | Pore Volume (cm3/g) | Pore Size (nm) |
|---|---|---|---|
| 10%Ni/CaO-Ca12Al14O33 | 4.18 | 0.049 | 23.4 |
Table 3.
Elemental content in the catalyst.
| Ni | Ca | Al | Na | |
|---|---|---|---|---|
| Content (wt.%) | 10.2 | 59.5 | 29.47 | 0.83 |
Table 4.
The yield of each product resulting from pyrolysis at a temperature of 650 °C.
| Phenol (g) | Gas (g) | Solid (g) | Carbon (g) | |
|---|---|---|---|---|
| 1 | 2 | 0.71 | 0.14 | 1.06 |
| 2 | 2 | 0.68 | 0.17 | 1.08 |
| 3 | 2 | 0.66 | 0.15 | 1.11 |
Table 5.
Yield of each gas component under different magnetic field intensity.
| Magnetic Field Strength (mT) | H2 (mL/g) | CH4 (mL/g) | CO (mL/g) | CO2 (mL/g) |
|---|---|---|---|---|
| 0 | 357.55 | 13.30 | 114.30 | 7.55 |
| 20 | 367.35 | 12.70 | 117.90 | 7.30 |
| 40 | 395.40 | 12 | 128.55 | 6.80 |
| 60 | 419.95 | 13.35 | 134.77 | 7.60 |
| 80 | 458.88 | 16.7 | 145.60 | 8.15 |
Table 6.
Kinetic parameters.
| Magnetic Field Intensity (mT) | Temperature (°C) | Ea (kJ/mol) | A (s−1) | R2 |
|---|---|---|---|---|
| 0 | 550 | 45.54 | 3.23 | 0.9828 |
| 600 | ||||
| 650 | ||||
| 700 | ||||
| 80 | 550 | 23.78 | 7.36 | 0.9737 |
| 600 | ||||
| 650 | ||||
| 700 |
Disclaimer/Publisher’s Note: The statements, opinions and data contained in all publications are solely those of the individual author(s) and contributor(s) and not of MDPI and/or the editor(s). MDPI and/or the editor(s) disclaim responsibility for any injury to people or property resulting from any ideas, methods, instructions or products referred to in the content. |
© 2023 by the authors. Licensee MDPI, Basel, Switzerland. This article is an open access article distributed under the terms and conditions of the Creative Commons Attribution (CC BY) license (https://creativecommons.org/licenses/by/4.0/).
Share and Cite
MDPI and ACS Style
Li, Y.; Zhao, B.; Guan, H.; Liu, S.; Zhu, D.; Song, A.; Li, H.; Sun, L. Hydrogen Production from Catalytic Pyrolysis of Phenol as Tar Model Compound in Magnetic Field. Energies 2023, 16, 4140. https://doi.org/10.3390/en16104140
AMA Style
Li Y, Zhao B, Guan H, Liu S, Zhu D, Song A, Li H, Sun L. Hydrogen Production from Catalytic Pyrolysis of Phenol as Tar Model Compound in Magnetic Field. Energies. 2023; 16(10):4140. https://doi.org/10.3390/en16104140
Chicago/Turabian StyleLi, Yalong, Baofeng Zhao, Haibin Guan, Suxiang Liu, Di Zhu, Angang Song, Huan Li, and Laizhi Sun. 2023. "Hydrogen Production from Catalytic Pyrolysis of Phenol as Tar Model Compound in Magnetic Field" Energies 16, no. 10: 4140. https://doi.org/10.3390/en16104140
Note that from the first issue of 2016, this journal uses article numbers instead of page numbers. See further details here.