
Experimental Study of a Passive Thermal Management System Using Expanded Graphite/Polyethylene Glycol Composite for Lithium-Ion Batteries


1
School of Mechanical Engineering, Tongji University, Shanghai 201804, China
2
School of Civil and Transportation Engineering, Ningbo University of Technology, Ningbo 315016, China
3
School of Safety Science and Engineering, Nanjing Tech University, Nanjing 210009, China
*
Author to whom correspondence should be addressed.
Energies 2023, 16(23), 7786; https://doi.org/10.3390/en16237786
Submission received: 18 September 2023
/
Revised: 14 November 2023
/
Accepted: 23 November 2023
/
Published: 27 November 2023
(This article belongs to the Special Issue Intelligent Phase Change Control and Thermal Management for Energy Applications)
Abstract
:Modern energy batteries are mainly used in pure electric vehicles. The stability of battery operation relies heavily on thermal management systems for which phase-change batteries have become an effective solution. In this study, we designed a battery thermal management system divided into two parts: a shaped phase-change material (PCM) module and a battery module. In the qualitative PCM module, polyethylene glycol was used to absorb heat, expanded graphite (EG) was used as the thermally conductive agent, and copper foam formed the support skeleton. The battery module comprised an 18650 lithium-ion battery with an enthalpy of 155 J/g. In our experiments, we applied PCMs to the battery modules and demonstrated the effectiveness of composite PCM (CPCM) in effectively lowering the temperature of both battery packs and minimizing the temperature discrepancies among individual batteries. At a gradually increasing discharge rate (1C/2C/3C), the battery’s Tmax could be lowered and the temperature could be de creased at various positions. It was evident that the battery temperature could be effectively preserved using CPCM. The findings of this study lay a foundation for future research on battery thermal management. Finally, the copper foam and EG contributed significantly to the prevention of leakage.
1. Introduction
Recently, the development of new energy vehicles has been unconstrained [1]. However, the electric vehicle industry has always faced battery-heating problems [2]. As a power component of electric vehicles, the life and safety of batteries is an unavoidable topic. As the first choice for power batteries, lithium-ion batteries are secondary batteries that use lithium-containing compounds as positive electrodes [3]. Chemical reactions occur when batteries are discharged and charged. During this process, Li ions lose and gain electrons, thereby generating currents. A lithium-ion battery comprises a positive electrode, a negative electrode, an electrolyte, and a separator as its primary components. Compared with the more widely used lead-acid batteries, lithium batteries have a larger specific energy density; therefore, they can obtain more energy in a smaller volume [4]. Lithium batteries exhibit a high operating voltage, prolonged cycle life, and minimal self-discharge. However, they are limited by temperature. The normal operating temperature range is between 15 °C and 35 °C, and a substantial amount of heat is emitted during operation [5]. Hence, the identification of a rapid and efficient cooling technique is crucial for battery packs in electric vehicles, which frequently connect numerous lithium-ion batteries to provide energy [6].
Thermal management systems have attracted increasing attention from the academic community [7,8]. Thus far, battery thermal management systems (BTMSs) have been divided into four types according to the different heat dissipation methods: air cooling, liquid cooling, passive cooling, and phase-change materials (PCMs). The third and fourth methods are similar in principle, relying on heat pipes for cooling [9,10].
Air cooling relies on air as the heat transfer medium [11]. The air is swept through the battery directly through an air duct, removing heat, and a fan is used to accelerate the air, thereby improving the air-cooling efficiency. Qin [12] designed a novel thermal management system that incorporated an innovative inner fin configuration. The battery’s temperature discharged at the 4C rate was reduced to below 48.5 °C by forced-air cooling, and the temperature variation was maintained at around 4.8 °C. Zhang [13] designed a secondary air outlet and added a baffle to the traditional air-cooling structure. The improved system effectively reduced the Tmax of the battery by 4.2%, and the reduction in temperature difference was highly significant, amounting to a 75% decrease. However, in pursuit of the cooling effect, it is necessary to increase the fan as much as possible to increase the wind speed or heat transfer area. Air cooling needs to leave sufficient space for the flow channel, which is difficult to achieve in the compact space inside a car, especially in the case of high-power discharge, and its performance is far less than that of other heat dissipation methods [14].
The liquid cooling heat dissipation capacity is significantly higher than that of the air-cooling heat dissipation capacity. It employs a stable operational fluid to convey the thermal energy produced by the battery, thereby facilitating heat exchange with the external environment. The entire battery module can be immersed in the working liquid, or a heat exchange tube can be established between the battery and the liquid [15]. Yang [16] designed eight different conical flow-channel radiators based on a multiple-channel system. The results showed that the three-channel conical flow had the best effect and could reduce the power consumption by 86.3% while ensuring a cooling effect. He [17] developed a novel liquid cooling system with a dual-layer i-type design. In contrast to the serpentine pipe, the temperature was significantly reduced. Liquid-cooled heat transfer media can be organic or inorganic solutions such as water and ethylene glycol. The efficiency of heat transfer between the battery module and heat transfer medium is mainly affected by factors such as the thermal conductivity, viscosity, flow rate, and density of the solution [18]. Under the guarantee of absolute insulation measures, efficient heat transfer from liquid cooling is the primary method that can become a mainstream heat dissipation measure [19].
The methods used to dissipate heat in air and liquid cooling are the same because both utilize active heat dissipation techniques. In contrast, the heat pipe and phase-change methods are passive. The heat pipe method involves the encapsulation of phase-change materials within hollow tubes, enabling indirect contact with the battery. On the other hand, the heat dissipation makes direct contact between the phase-change materials and the battery. Due to its high latent heat characteristics, the PCM can efficiently absorb a substantial amount of heat generated by the battery without causing any significant temperature changes during the melting process. Wang [20] introduced a technique for heating batteries using an array of micro-heated pipes. Through simulation, it was observed that the temperature variation within the battery pack module remained below 3 °C. A heat pipe-based BTMS was developed by Zhang [21]. The experimental data showed that the system could operate stably for a long time. Heat pipe systems have limitations in terms of temperature uniformity and must be encapsulated. In contrast, PCMs directly or indirectly contact a material with a large area of the battery module to obtain a stronger heat dissipation effect [22]. Rao [23] designed a BTMS that combines paraffin and copper foam, which showed a 5 °C drop in the highest temperature and a 3 °C decrease in the temperature gap. Yang [24] designed a new type of BTMS based on flexible PCMs. Paraffin was used as the PCM, expanded graphite (EG) was employed as a high-thermal-conductivity agent, and styrene was used as the supporting material skeleton. The results suggested that the utilization of PCM resulted in a reduction of 2 °C in the highest temperature observed within the battery system while also demonstrating enhanced durability compared to the initial configuration. Li [25] designed a CPCM composed of paraffin and copper foam, controlled the proportion of EG in the mixture, and investigated its thermal absorption capability across different operational scenarios. The battery temperature and temperature difference were significantly influenced by the phase transition temperature of the CPCM, which was identified as a crucial factor from the experimental findings, followed by the latent heat value and thermal conductivity of the CPCM. Ma [26] opted for lauric acid (LA) as the PCM, and EG was selected as the thermally conductive agent to fabricate a qualitative PCM. The BET analysis revealed that the CPCM had a specific surface area of 15.9326 m2/g along with a diverse range of pore sizes. Experiments showed that the pore size in the CPCM could load a large amount of molten LA and provide numerous heat transfer channels. The thermal conductivity of the material was 8.4 times that of LA, reaching 2.546 W/(m·K). In the subsequent battery discharge experiment, the inclusion of a PCM resulted in a significant decrease of 13.4 °C in the battery temperature, which was substantially below the battery’s recommended temperature range for safe operation. Yang [27] prepared a CPCM of polyethylene glycol (PEG), EG, and halloysite nanotubes (HNTs). HNTs and EG can coordinate with each other to form a cross-network, adsorb the melted PEG, and offer sufficient room for the efficient dissipation of the battery’s thermal energy. The thermal conductive properties of the CPCM were improved to 1.15 W·m−1·k−1, and the latent heat was at least 103.65 J·g−1. Additionally, measuring various parameters during battery discharge was possible. These findings indicate that the battery module’s temperature could be effectively regulated to remain below 60 °C, even when subjected to an ambient temperature of 3 °C and discharged at a rate of 3C. Sun [28] conducted a comparative experiment using paraffin as the material for phase-change energy storage, copper foam as the supporting material, and 16 batteries to form a battery module. The distinctions among the four heat release methods are illustrated in Table 1.
In this study, we conducted a comparison between the degree of battery-heating under air cooling and a PCM. The battery discharge rate in this experiment was set to three levels: 1 C, 2 C, and 3 C. The use of a PCM and air cooling was compared, resulting in effective temperature control with a maximum deviation of only 5 °C observed in the power source. Conversely, the highest recorded temperature for the CPCM was lower, at 51.4 °C.
The consistency of battery temperature significantly impacts the overall safety performance of a battery pack [29]. In this study, a new type of BTMS was developed that relies on a qualitative PCM to dissipate heat. Copper foam, which has good support performance, was used as a directional PCM. Afterwards, polyethylene glycol was utilized with a molecular chain length of 1500 as a phase-change endothermic material because it possesses an exceptionally elevated heat capacity while changing phases. Finally, EG was added as a thermally conductive agent to enhance heat transfer. Simultaneously, it can adsorb the melted PEG to prevent leakage.
In previous studies, limited research had been conducted on the application of a CPCM for battery heat dissipation. This experiment aims to utilize the newly developed CPCM, derived from the aforementioned materials, to enhance thermal management in electric vehicle batteries based on 18650 lithium-ion technology.
2. Materials and Methods
2.1. Materials
PEG 1500 (PEG1500) (Wuxi United Chemical, molecular chain 1500, melting temperature 46 °C), EG (worm-like, 400× expansion), and copper foam (40 ppi) were used to prepare the composite PCMs. The basic properties of PEG1500 are shown in Table 2.
2.2. Preparation
2.2.1. Preparation of Composite PCMs
Primarily, the steps for sample preparation are outlined as follows:
- (1)
- First, PEG1500 was heated in a water bath at 70 °C until complete melting of all samples occurred, and then it was maintained at an elevated temperature to ensure the PEG1500 remained in a molten state.
- (2)
- Subsequently, EG was measured using an electronic balance, transferred into a beaker, and the weight in grams accurately recorded.
- (3)
- The molten PEG1500 and EG were combined using a magnetic stirrer and agitated at 800 RPM for an additional half hour, followed by a resting period of one hour.
- (4)
- Following a period of rest, the specimen was subsequently placed in a drying oven and subjected to desiccation at 70 °C for a duration of 6 h.
- (5)
- After the completion of the drying process, the sample was removed.
Secondly, some models and manufacturers of equipment are outlined as follows:
- (1)
- The batteries used in this study were cylindrical lithium-ion batteries (Sony VTC6, dimensions: diameter = 18 mm, height = 65 mm), and their real capacity was nearly 2600 mAh, which was used to calculate the C-rate;
- (2)
- Battery test equipment (AODAN CD1810U5, China);
- (3)
- A data logger (Keysight, 34970A, USA);
- (4)
- A temperature chamber (GZP 360BE, China).
In this stage, a total of four samples containing different mass fractions of EG were prepared with 1% (PCM-1), 3% (PCM-3), 5% (PCM-5), and 8% (PCM-8), respectively. The incorporation of additional EG would exert an influence on the physical and chemical morphology of the composite phase-change material. The samples are listed in Table 3.
Finally, four samples were embedded in copper foam. Because PCM-3, PCM-5, and PCM-8 retained a large amount of EG in the periphery of the copper foam, PCM-1 was selected for embedding in the copper foam.
2.2.2. Battery Pack Production
A total of 16 batteries were arranged in a 4 × 4 pattern in the holes of the copper foam. Then, a battery in the middle position was selected, and the battery was equipped with thermocouples that were wrapped in electrostatic tape at the upper, middle, and lower sections. Finally, the batteries were connected in series and in parallel.
After spot welding was completed, each system was connected. The battery pack was subjected to continuous temperature control throughout the experiment. After standing for 6 h, the computer-side thermocouple data were recorded. Finally, to avoid the risk of a short circuit caused by leakage, resin glue was used to seal the battery base. Figure 1 shows images of the experimental setup and process.
2.3. PCM-1 Performance Test
Differential scanning calorimetry (DSC) was used to measure the thermophysical properties of the EG/PEG1500 composites. The function of DSC is to assess the temperature and latent heat throughout the phase-change process of the CPCM, including melting and solidification. The rate of temperature increase/decrease was 5 °C per min, the temperature range was adjusted to be between 10 and 80 °C, and the cooling temperature range was set to 80–10 °C. The latent heat and enthalpy of the CPCMs were obtained by integrating the DSC peaks. The microstructures and surface morphologies of the materials were analyzed using SEM. X-ray diffraction analysis (XRD) was used to analyze the experimental samples. The main purpose of this study was to examine the crystallization behaviors of CPCM with different compositions. Quantitative analysis and purity determination of EG, PEG1500, and PCM-1 were conducted using FT-IR over a detection range of 450 cm−1 to 4000 cm−1. The thermal stabilities of EG, PEG1500, and EG/PEG1500 composites were evaluated by thermogravimetric (TG) analysis. This experiment also used a battery cycler and thermocouple to cycle the battery and measure the temperature data.
2.4. Battery Performance Test
In this experiment, the batteries in the second row and column of the 4 × 4 battery matrix were selected for temperature measurement. To monitor the operating temperature of the battery, thermocouples were affixed at three different positions: the uppermost, middle, and lowermost sections [30,31,32,33]. The starting temperature of all batteries was approximately 27 °C.
First, the battery pack module was charged with a small 5 V charger. After waiting for full charge, the battery pack module was put into the incubator at 27 °C and then connected to the battery cycler. An 18650-type battery was used in the experiment. The charging cut-off voltage of a single battery was 4.2 V, and the discharge voltage was 2.75 V. Simultaneously, the battery charging and discharging were completed by a programmed battery cycler. During charging, a 1C (C represents a measurable parameter used to determine the rate at which the battery is discharged) rate was used. The cut-off voltage was set to 16.8 V, the charging current and cut-off current were set to 12 A, and the cut-off current was set to 1 A. The battery module was programmed to stop discharging the lithium battery when the voltage reached 11.2 V. According to the law governing battery discharge, the discharge current was adjusted to 12 A/24 A/36 A when the battery discharge rate was at a level of 1C/2C/3C, respectively. The thermocouple data were collected each time the battery module was charged or discharged.
Charging and discharging were performed using a thermostat. After each charge–discharge cycle, the samples were left in a thermostat for 6 h. The battery was subsequently discharged twice. The first was to discharge at three different rates in the natural environment of the incubator, followed by three different rates of discharge in the foamed copper immersed in the CPCMs.
2.5. Uncertainty Analysis
In this experiment, in accordance with the metrological technical specification, the uncertainty primarily arose from instrumental errors and actual measurements. These two types of uncertainty can be mathematically represented as follows.
This formula mainly deals with uncertainties in the measurement process such as temperature. The equation is defined as follows: n represents the number of measurements, xi denotes the actual measurements, and x’ signifies the average value obtained from repeated measurements.
This formula mainly reflects the uncertainty of the instrument, where a and K represent the instrument error range provided in the instructions.
Based on the above formula, the uncertainty of this experiment is shown in Table 4.
3. Results and Discussion
3.1. FT-IR Analysis of CPCMs
Figure 2 exhibits the FT-IR spectra obtained from the PCM-1 sample, pure PEG, and EG within the wavelength range of 4000 cm−1 to 400 cm−1. For the FT-IR spectra of PEG, the bending vibration of the -CH2CH2O- functional group was observed at 842 cm−1, and the bending vibration of the functional group -C-O-C- was detected at 962 cm−1. The -C-O functional group exhibited tensile vibration at 1114 cm−1. The -OH functional group underwent stretching, and characteristic peaks appeared at 1239 cm−1 and 1280 cm−1. The characteristic peak at 1466 cm−1 corresponded to the -CH2 functional group. In addition, we observed the characteristic stretching peaks of -CH2 and -OH at 2882 cm−1 and 3429 cm−1. The EG and PCM-1 curves were analyzed as follows. Based on the FT-IR spectrum of the EG, the vibration observed at 1625 cm−1 corresponded to the stretching motion of the -C=O functional group. After analyzing the FT-IR spectrum of PCM-1, it was evident that all of the distinctive peaks corresponding to the functional groups present in the initial PEG1500 spectrum were observed, with only a slight offset, and a new characteristic peak appeared at 2354 cm−1. In this case, the curve of the PCM-1 sample exhibited a prominent absorption peak, which can be ascribed to the presence of a pressure plate that hindered the penetration of most rays. The results show that the reaction between PEG1500 and EG was not a chemical reaction and that the molten PEG1500 was stabilized in the gap of the EG carbon material by capillary force [30].
3.2. XRD Analysis of CPCMs
Figure 3 shows the XRD patterns of EG, PEG1500, and PCM-1. The EG percentages of the sample, other than those mentioned, were unsuitable for battery thermal management due to a significant retention of EG in the copper foam. According to the figure, the main peak position of PCM-1 was similar to that of PEG1500, which proves that the addition of 1% EG to PEG did not significantly change the crystal structure of PEG1500. However, as the mass fraction of EG continued to increase, the main peak of PEG1500 gradually decreased and then split into several small characteristic peaks. As the EG content increased, the crystallinity of the composites decreased. This can be attributed to EG, which is an amorphous carbon material with extremely low crystallinity [34]. In addition, EG has a good porous structure, which allowed the melted PEG1500 to be well absorbed by the EG, leading to a further decrease in the crystallization peak and crystallinity.
3.3. SEM Analysis of CPCMs
Figure 4 illustrates the morphologies and cross-sections of the EG, copper foam, and PCM-1. Figure 4a shows that there were many voids inside the copper foam that could accommodate EG and PEG. Meanwhile, the bracket structure in these spaces was very favorable for heat dissipation and the surface of the copper foam scaffold structures contained some voids, which facilitated PEG adsorption. The cross-section of the CPCM is shown in Figure 4b. Through two images with different magnifications, it can be observed that the pores of the EG carbon materials were completely occupied by PEG crystals. The original EG surface was pitted and filled with voids, and the layered structure was clear. Compared with the original, the surface became smoother, which was due to the adsorption of PEG1500 on the surface and inside of the EG. It is evident from the depiction in Figure 4c,d that the composition of the EG carbon material consisted of two distinct components: layered graphite and block pores. The void and sheet structure can be inferred from the high-magnification diagram. Additionally, due to the high porosity of the EG, it had good adsorption capacity, thus trapping the melted PCM.
3.4. Thermal Analysis of CPCMs
Figure 5 shows the DSC curves of PEG1500 and the CPCMs, including the two processes of heating and cooling solidification. Table 5 shows the latent heat of all samples during melting and solidification as well as the maximum temperature during the phase transition. These data show that when the mass percentage of EG increased, the phase transition temperature changed significantly. The resulting melting peak temperature was also delayed, the crystallization peak temperature increased, and the total temperature difference decreased. This is because EG is an inorganic carbon material, and the internal space is filled with rough surfaces. Therefore, it can be used as the nucleation center for PEG1500 and can also help reduce the grain size of PEG1500 in the crystallization stage, thereby promoting crystallization [35].
Figure 6 shows the thermal conductivities of the samples. The inclusion of EG resulted in a noticeable enhancement in the thermal conductivity of the specimen. However, the sample had to infiltrate the copper foam. If the EG content was too high, it would have been difficult for it to penetrate the copper foam, especially as the EG could easily have remained in the periphery of the foam.
After incorporating EG into PEG1500, a gradual decrease in the latent heat of the phase transition was observed. Furthermore, as the proportion of EG increased, a corresponding reduction in the latent heat required for the phase change was observed. This finding can be attributed to the fact that EG primarily functions as an adsorbent and has a relatively smaller impact on the latent heat involved in phase transition. Given the significance of adsorption in the thermal management of batteries, it is crucial to consider alternative phrasing to minimize similarity scores when using plagiarism detection tools. The sample with only 1% EG was selected as the PCM for subsequent trials.
To assess the heat resistance of PCM-1, the TG curves of pure PEG and the PCM-1 composites were obtained, as depicted in Figure 7. Once the temperature reached approximately 200 °C, PEG1500 began to decompose, and the decomposition rate of PEG1500 reached the maximum at 350 °C and then decreased slowly. The decomposition of the prepared PCM-1 sample began at approximately 350 °C, and the decomposition rate reached the maximum at 425 °C. Unlike for pure PEG1500, different mass fractions of EG greatly enhanced the thermal resistance of PEG1500. Furthermore, compared with PCM1500, the decomposition rate of PCM-1 was greater, indicating that the addition of EG to the PCM enhanced the thermal stability. Simultaneously, the residual mass after decomposition of PCM-1 was roughly equivalent to the amount of EG added to PEG.
4. Battery Heat Production Analysis
4.1. Battery Performance Changes at Different Rates
Each time the cycler was used to charge the battery pack, it was overcharged to 17 V to prevent insufficient voltage during the real discharge. Figure 8 shows the voltage curves for multiple discharges. After six discharges, the initial voltage value gradually decreased from 16.24 V of the 1C rate to 16.15 V of the 1C (PCM-1) rate and then decreased to 15.7 V, 15.48 V, 15.26 V, and 14.91 V based on the order of the 2C rate, 2C (PCM-1) rate, 3C rate, and 3C (PCM-1) rate, respectively. The maximum attenuation rate was 2.8%, which is significantly higher than the normal battery operating loss. The values of the 3C, 2C, and 1C rates were 95, 43, and 40, respectively. The values at 1C and 2C were very similar, whereas the discharge rate value at 3C was much larger than that at the 2C and 1C rates. These findings indicate that the battery experienced a significantly higher voltage drop when subjected to a 3C rate compared with both the 1C and the 2C rate. There was a direct correlation between the battery discharge rate, its produced heat, and the electrical energy loss. In the diagram, the minimum voltage reached 11.08 V in several discharges at different rates, which is less than the rated cut-off voltage of 11.2 V. It has been proven that a high-power discharge accelerated the capacity loss of the battery.
Figure 9 shows the power curves for several discharges. The power loss at the 1C, 2C, and 3C rates was 0.21 mAh, 0.36 mAh, and 0.78 mAh, respectively. The loss of battery power in the three stages increased by 71.4% and 116.7%. The observation data showed that, in addition to the periodic heat loss, the power data provided strong evidence that the increase in battery capacity loss was a direct result of the increase in the discharge rate.
After six discharges, the attenuation of the battery voltage and power could be attributed to battery self-heating. Without the intervention of heat dissipation, the battery temperature at the 3C rate reached 70.1 °C, which is approximately twice the typical temperature at which the battery operates normally. Under normal circumstances, regardless of the heat factor, the number of cycles that lithium-ion batteries can reach is more than 800 while ensuring that the power can produce normal work. However, after only six cycles, the amount of electricity dropped significantly, indicating that the temperature effect was fatal to the battery.
4.2. Temperature Distribution within the Batteries
The discharge experiment for the entire battery module was conducted within the incubator to maintain a consistent ambient temperature of 27 °C for the battery module. The lithium-ion battery was divided into three parts, and the temperature was measured using a thermocouple. Figure 10 shows the battery temperature data curve at the 2C discharge rate. Through the curve identification in the figure, it can be inferred that the battery’s discharge voltage was merely 15.7 V, which was below its rated voltage, but the termination voltage was 11.2 V. This was because, after a certain number of cycles, the rated capacity of the battery began to decay.
The temperature data curve shows that the temperature of the battery exhibited a significant downward trend after PCM-1 was embedded in the copper foam. The data showed that the maximum temperatures of the upper, middle, and lower parts of the battery were 56.1 °C, 59.3 °C, and 59.2 °C, respectively, when PCM-1 was not incorporated. In addition, when adding PCM-1, the Tmax of the battery was 47.5 °C, 49.2 °C, and 49.3 °C, respectively, which was 15.3%, 17%, and 16.7% lower than the previous temperature. There was a noticeable decrease in the highest temperature recorded by the battery, with a gradual decline from 3.2 °C to 1.8 °C, resulting in a decrease of approximately 43.6%. It is foreseeable that, if the heat dissipation from the battery alone is employed, an increase in temperature would lead to irreversible thermal runaway. In contrast, CPCM controlled this effect very well.
4.3. Effect of Different Discharge Rates
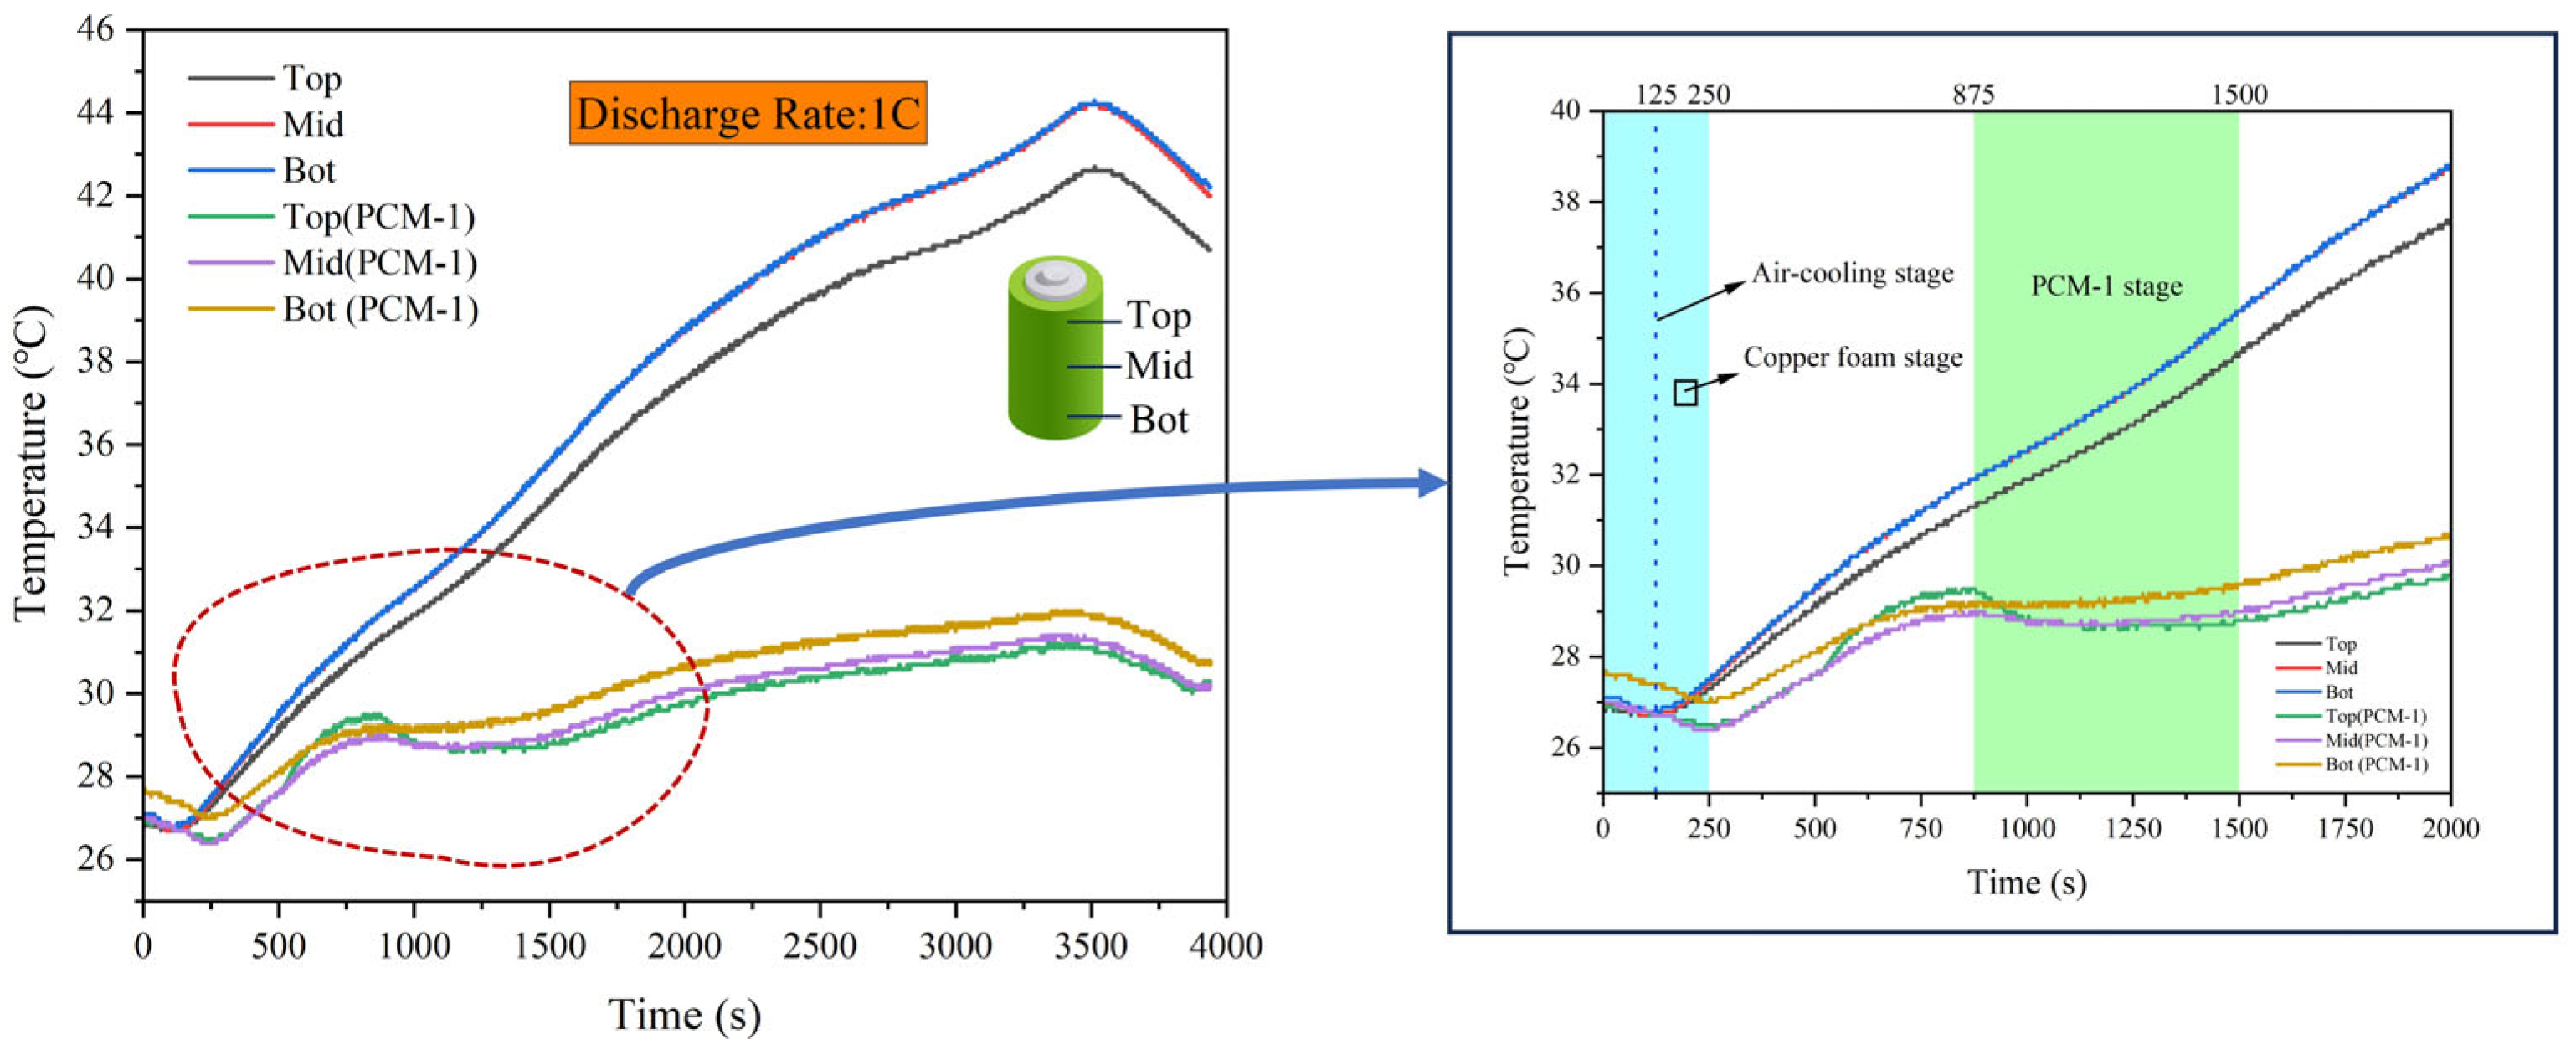
The experiment also included testing the discharge rates at 1C and 3C. The data show that the maximum temperatures of the upper, central, and lower sections of the battery reached 42.6 °C, 44.1 °C, and 44.2 °C, respectively, when discharging at the 1C rate without adding additional heat dissipation. Therefore, with the implementation of supplementary heat dissipation and a 1C discharge, the upper, middle, and lower sections of the battery experienced maximum temperatures of approximately 31 °C, 31.2 °C, and 31.8 °C, respectively. According to these data, the implementation of the CPCM led to noticeable effects; the Tmax of the battery’s upper, middle, and lower sections decreased by 27.9%, 29.2%, and 28%, respectively, compared with the original copper foam form. Because of the CPCM, the Tmax of the battery stayed below 32 °C, allowing the PCM in the copper foam to remain in a solid form, which was conducive to subsequent heat dissipation. From another perspective, the diagram indicates that, following the CPCM, there was a slight decrease in the battery temperature during the pre-discharge phase. The phenomenon of PEG melting was observed, resulting in a slowdown in the increase in battery temperature. In summary, compared to previous studies, the battery temperature was effectively regulated, resulting in a gradual deceleration in the temperature increase trend.
The discharge rate of the battery was tripled compared to its capacity. It can be inferred that, when using pure copper foam, the temperatures of the three sections of the battery reached a maximum of 66.2 °C, 70.5 °C, and 70.1 °C, respectively. The battery utilizing the CPCM experienced successive temperature peaks of 50.2 °C, 51.6 °C, and 50.6 °C, respectively. In contrast, the battery temperatures decreased by 24.2%, 26.8%, and 27.8%, respectively. Differential temperature regulation for individual batteries exhibited exceptional performance. The temperature decreased by 67.4% from the original 4.3 °C to 1.4 °C. A significant temperature disparity between the battery and the module resulted in capacity loss, leading to a substantial decrease in the overall battery efficiency. In serious cases, this could cause thermal runaway.
4.4. Temperature Response under Dynamic Load Conditions
Figure 11 shows the battery temperature data under 4C dynamic conditions; the battery test environment was based on the CPCMs. Considering the actual daily use of electric vehicles, there would be a deep throttle on urban roads, electric vehicles often bind large-scale batteries on the chassis, and the maximum discharge rate of the battery would not be higher than 4C. Therefore, this experiment tested a set of 4C dynamic conditions. The specific experimental strategy was to adjust the discharge rate to 4C, and a total of four 4C discharges were performed at intervals of 30 s. Figure 11 shows that the maximum temperatures of the three battery parts were 37 °C, 36.5 °C, and 35.9 °C, respectively. It is evident that the rate of increase in the upper section of the battery was higher than that in the middle and lower sections during rapid discharge, which is the opposite result of the previous normal discharge.
After the introduction of PCM-1, the rate of increase in battery temperature exhibited a notable decline. Simultaneously, the data curve in Figure 11 shows that the temperature consistency of the single cell was well protected under the dynamic 4C rate condition, and the maximum temperature difference between the upper, middle, and lower parts of the battery was only 1.1 °C. Compared with the conventional linear discharge at the 2C rate, the temperature drop reached 38.9% again.
4.5. PCM-Based Battery-Cooling Mechanism
Figure 12 shows that the temperature data map of the 1C rate was partially enlarged, and an enlarged map on the right side was obtained. Without the intervention of PCM-1, the temperature trended downward from 0 to 125 s. After 125 s, the temperature increased rapidly. This behavior can be explained by the fact that the copper foam skeleton, as a supporting material, could quickly remove heat when the battery was starting to operate. The pale-blue area in Figure 12 indicates the participation of PCM-1 cells. The battery temperature trended downward between 0 and 250 s, and after 250 s, the battery temperature gradually stabilized and no longer exhibited its previous sharp increase. It is evident that the use of PCM-1 significantly mitigated the battery temperature, resulting in a more balanced thermal condition. The combination of copper foam and PCM-1 resulted in better temperature transference and absorbed and removed more heat.
The light-green area of Figure 12 provides feedback on the cooling effect of PCM-1. After the incorporation of PCM-1, from 875 to 1500 s, the battery temperature decreased slightly as the solid PCM-1 in the copper foam began to undergo a phase change, and PCM-1 was melted by heat. Currently, the latent heat of the CPCM could absorb the heat generated by the battery. Owing to the high latent heat properties of PEG1500, the battery temperature did not increase significantly after some PCM-1 melted.
In summary, we found that, for long-term stable discharge, the lower part of the battery was more likely to accumulate heat, which can be understood as heat being more likely to be generated and accumulated in the negative electrode of the battery. This can also be attributed to the fact that, in the incubator, without other airflow interferences, the temperature was expected to decline. Simultaneously, after loading the CPCM, the Tmax of the battery was effectively controlled, and the temperature stability of the individual battery was effectively regulated.
5. Conclusions and Future Directions
In this experiment, a battery test experiment was conducted using copper foam as the supporting material, PEG1500 as the PCM, EG as the thermal conductivity agent, and an 18650-power battery. The following conclusions were drawn.
- (1)
- Based on the experimental feedback, we developed a consistent phase-change material battery thermal management system specifically designed for 18650 model lithium batteries. Furthermore, we proposed an innovative battery heat dissipation strategy that is extensively suitable for practical commercial applications.
- (2)
- The optimal ratio of polyethylene glycol (PEG) and ethylene glycol (EG) was determined, resulting in a significant enhancement in the material’s thermal conductivity while ensuring its enthalpy value. Furthermore, various tests revealed that PEG1500 and low-mass-percentage EG exhibited compatibility in terms of both physical and chemical properties.
- (3)
- The synthesis of the PEG/EG/CF material led to the preparation of a novel fixed phase-change material with enhanced adsorption capabilities, superior thermal conductivity, and high latent heat. Furthermore, the non-flammable nature of PEG1500, coupled with the flame-retardant properties of EG at room temperature, significantly enhanced the overall safety performance of the system.
- (4)
- The findings reveal that the negative electrode of the 18650 battery generated a greater amount of heat than the positive electrode when the discharge time was extended at a low discharge rate. Conversely, under high-rate discharge conditions (4C), the positive electrode temperature of the 18650 battery surpassed that of the negative electrode. This phenomenon merits further investigation and corresponding enhancements in the thermal management system.
- (5)
- Compared to the prevailing liquid cooling system, the battery thermal management system based on fixed phase-change materials effectively ensures uniformity of battery temperature, significantly reduces the temperature variation of individual batteries, enhances heat dissipation efficiency, and safeguards the overall safety performance of the battery.
Author Contributions
Conceptualization, Z.X. and C.L.; experiments, Z.X. and C.L.; writing—review and editing, H.Y. and Z.W. All authors have read and agreed to the published version of the manuscript.
Funding
This study was supported by the Zhejiang Provincial Natural Science Foundation of China (grant No. LQ22E080011).
Data Availability Statement
Data are contained within the article.
Conflicts of Interest
The authors affirm that there are no identifiable conflicting financial interests or personal associations that could have been perceived as exerting any influence on the research presented in this manuscript.
References
- Li, J.; Zhang, H. Thermal characteristics of power battery module with composite phase change material and external liquid cooling. Int. J. Heat Mass Transf. 2020, 156, 119820. [Google Scholar] [CrossRef]
- Wang, C.; Xu, J.; Wang, M.; Xi, H. Experimental investigation on reciprocating air-cooling strategy of battery thermal management system. J. Energy Storage 2023, 58, 106406. [Google Scholar] [CrossRef]
- Hakeem Akinlabi, A.A.; Solyali, D. Configuration, design, and optimization of air-cooled battery thermal management system for electric vehicles: A review. Renew. Sustain. Energy Rev. 2020, 125, 109815. [Google Scholar] [CrossRef]
- Houache, M.S.E.; Yim, C.-H.; Karkar, Z.; Abu-Lebdeh, Y. On the Current and Future Outlook of Battery Chemistries for Electric Vehicles—Mini Review. Batteries 2022, 8, 70. [Google Scholar] [CrossRef]
- He, L.; Jing, H.; Zhang, Y.; Li, P.; Gu, Z. Review of thermal management system for battery electric vehicle. Energy Storage 2023, 59, 106443. [Google Scholar] [CrossRef]
- Kim, J.; Oh, J.; Lee, H. Review on battery thermal management system for electric vehicles. Appl. Therm. Eng. 2019, 149, 192–212. [Google Scholar] [CrossRef]
- Feng, X.; Ouyang, M.; Liu, X.; Lu, L.; Xia, Y.; He, X. Thermal runaway mechanism of lithium-ion battery for electric vehicles: A review. Energy Storage Mater. 2018, 10, 246–267. [Google Scholar] [CrossRef]
- Panchal, S.; Gudlanarva, K.; Tran, M.-K.; Herdem, M.S.; Panchal, K.; Fraser, R.; Fowler, M. Numerical Simulation of Cooling Plate Using K-Epsilon Turbulence Model to Cool Down Large-Sized Graphite/LiFePO4 Battery at High C-Rates. World Electr. Veh. J. 2022, 13, 138. [Google Scholar] [CrossRef]
- Liang, K.; Wang, M.; Gao, C.; Dong, B.; Feng, C.; Zhou, X.; Liu, J. Advances and challenges of integrated thermal management technologies for pure electric vehicles. Sustain. Energy Technol. Assess. 2021, 46, 101319. [Google Scholar] [CrossRef]
- Mei, J.; Shi, G.; Liu, H.; Wang, Z.; Chen, M. Investigation on the optimization strategy of phase change material thermal management system for lithium-ion battery. J. Energy Storage 2022, 55, 105365. [Google Scholar] [CrossRef]
- Zhao, G.; Wang, X.; Negnevitsky, M.; Zhang, H. A review of air-cooling battery thermal management systems for electric and hybrid electric vehicles. J. Power Sources 2021, 501, 230001. [Google Scholar] [CrossRef]
- Qin, P.; Liao, M.; Mei, W.; Sun, J.; Wang, Q. The experimental and numerical investigation on a hybrid battery thermal management system based on forced-air convection and internal finned structure. Appl. Therm. Eng. 2021, 195, 117212. [Google Scholar] [CrossRef]
- Zhang, F.; Liu, P.; He, Y.; Li, S. Cooling performance optimization of air-cooling lithium-ion battery thermal management system based on multiple secondary outlets and baffle. J. Energy Storage 2022, 52, 104678. [Google Scholar] [CrossRef]
- Qin, P.; Sun, J.; Yang, X.; Wang, Q. Battery thermal management system based on the forced-air convection: A review. Transportation 2021, 7, 100097. [Google Scholar] [CrossRef]
- Zhao, G.; Wang, X.; Negnevitsky, M.; Li, C. An up-to-date review on the design improvement and optimization of the liquid-cooling battery thermal management system for electric vehicles. Appl. Therm. Eng. 2023, 219, 119626. [Google Scholar] [CrossRef]
- Yang, H.; Wang, Z.; Li, M.; Ren, F.; Feng, Y. A manifold channel liquid cooling system with low-cost and high temperature uniformity for lithium-ion battery pack thermal management. Therm. Sci. Eng. Prog. 2023, 41, 101857. [Google Scholar] [CrossRef]
- He, P.; Lu, H.; Fan, Y.; Ruan, H.; Wang, C.; Zhu, Y. Numerical investigation on a lithium-ion battery thermal management system utilizing a double-layered I-shaped channel liquid cooling plate exchanger. Int. J. Therm. Sci. 2023, 187, 108200. [Google Scholar] [CrossRef]
- Xu, J.; Guo, Z.; Xu, Z.; Zhou, X.; Mei, X. A systematic review and comparison of liquid-based cooling system for lithium-ion batteries. eTransportation 2023, 17, 100242. [Google Scholar] [CrossRef]
- Weragoda, D.M.; Tian, G.; Burkitbayev, A.; Lo, K.-H.; Zhang, T. A comprehensive review on heat pipe-based battery thermal management systems. Appl. Therm. Eng. 2023, 224, 120070. [Google Scholar] [CrossRef]
- Wang, L.; Zhao, Y.; Quan, Z.; Liang, J. Investigation of thermal management of lithium-ion battery based on micro heat pipe array. J. Energy Storage 2021, 39, 102624. [Google Scholar] [CrossRef]
- Zhang, W.; Qiu, J.; Yin, X.; Wang, D. A novel heat pipe assisted separation type battery thermal management system based on phase change material. Appl. Therm. Eng. 2020, 165, 114571. [Google Scholar] [CrossRef]
- Nasajpour-Esfahani, N.; Garmestani, H.; Rozati, M.; Smaisim, G.F. The role of phase change materials in lithium-ion batteries: A brief review on current materials, thermal management systems, numerical methods, and experimental models. J. Energy Storage 2023, 63, 107061. [Google Scholar] [CrossRef]
- Rao, Z.; Huo, Y.; Liu, X.; Zhang, G. Experimental investigation of battery thermal management system for electric vehicle based on paraffin/copper foam. J. Energy Inst. 2015, 88, 241–246. [Google Scholar] [CrossRef]
- Yang, X.; Deng, G.; Cai, Z.; Li, H.; Zeng, J.; Yang, H. Experimental study on novel composite phase change materials with room-temperature flexibility and high-temperature shape stability in a battery thermal management system. Int. J. Heat Mass Transf. 2023, 206, 123953. [Google Scholar] [CrossRef]
- Li, C.; Ding, Y.; Zhou, Z.; Jin, Y.; Ren, X.; Cao, C.; Hu, H. Parameter optimization and sensitivity analysis of a Lithium-ion battery thermal management system integrated with composite phase change material. Appl. Therm. Eng. 2023, 228, 120530. [Google Scholar] [CrossRef]
- Ma, Y.; Yang, H.; Zuo, H.; Zuo, Q.; He, X.; Chen, W.; Wei, R. EG@Bi-MOF derived porous carbon/lauric acid composite phase change materials for thermal management of batteries. Energy 2023, 272, 127180. [Google Scholar] [CrossRef]
- Yang, W.; Lin, R.; Li, X.; Li, C.; Wu, Y.; Zhang, G.; Liu, X.; Li, S.; Wang, Y. High thermal conductive and anti-leakage composite phase change material with halloysite nanotube for battery thermal management system. J. Energy Storage 2023, 66, 107372. [Google Scholar] [CrossRef]
- Sun, Z.; Guo, Y.; Zhang, C.; Whitehouse, J.; Zhou, Q.; Xu, H.; Wang, C. Experimental study of battery passive thermal management system using copper foam-based phase change materials. Int. J. Thermofluids 2023, 17, 100255. [Google Scholar] [CrossRef]
- Zhang, Z.; Li, Y. Experimental study of a passive thermal management system using copper foam-paraffin composite for lithium-ion batteries. Energy Procedia 2017, 142, 2403–2408. [Google Scholar] [CrossRef]
- Zhang, D.; Chen, M.; Wu, S.; Liu, Q.; Wan, J. Preparation of expanded graphite/polyethylene glycol composite phase change material for thermoregulation of asphalt binder. Constr. Build. Mater. 2018, 169, 513–521. [Google Scholar] [CrossRef]
- Liu, G.; Ouyang, M.; Lu, L.; Li, J.; Han, X. Analysis of the heat generation of lithium-ion battery during charging and discharging considering different influencing factors. J. Therm. Anal. Calorim. 2014, 116, 1001–1010. [Google Scholar] [CrossRef]
- Sheng, L.; Su, L.; Zhang, H.; Fang, Y.; Xu, H.; Ye, W. An improved calorimetric method for characterizations of the specific heat and the heat generation rate in a prismatic lithium-ion battery cell. Energy Convers. Manag. 2019, 180, 724–732. [Google Scholar] [CrossRef]
- Bian, H.; Wang, Z.; Jiang, J.; Yang, Y.; Wang, H.; Chen, S. Thermal runaway hazard characteristics and influencing factors of Li-ion battery packs under high-rate charge condition. Fire Mater. 2019, 44, 189–201. [Google Scholar] [CrossRef]
- Pan, C.; He, P.; Wu, J.; Chen, N.; Wei, J.; Xu, T.; Shi, E.; Wang, A.; Jia, H. Copper foam effectively improves the thermal performance of graphene-aerogel composite phase-change materials for thermal storage. J. Energy Storage 2022, 51, 104485. [Google Scholar] [CrossRef]
- Xia, L.; Zhang, P. Thermal property measurement and heat transfer analysis of acetamide and acetamide/expanded graphite composite phase change material for solar heat storage. Sol. Energy Mater. Sol. Cells 2011, 95, 2246–2254. [Google Scholar] [CrossRef]
Figure 1.
(a) Preparation of the CPCM; (b) experimental setup and process.

Figure 2.
FT-IR curve of PEG1500, PCM-1, and EG.
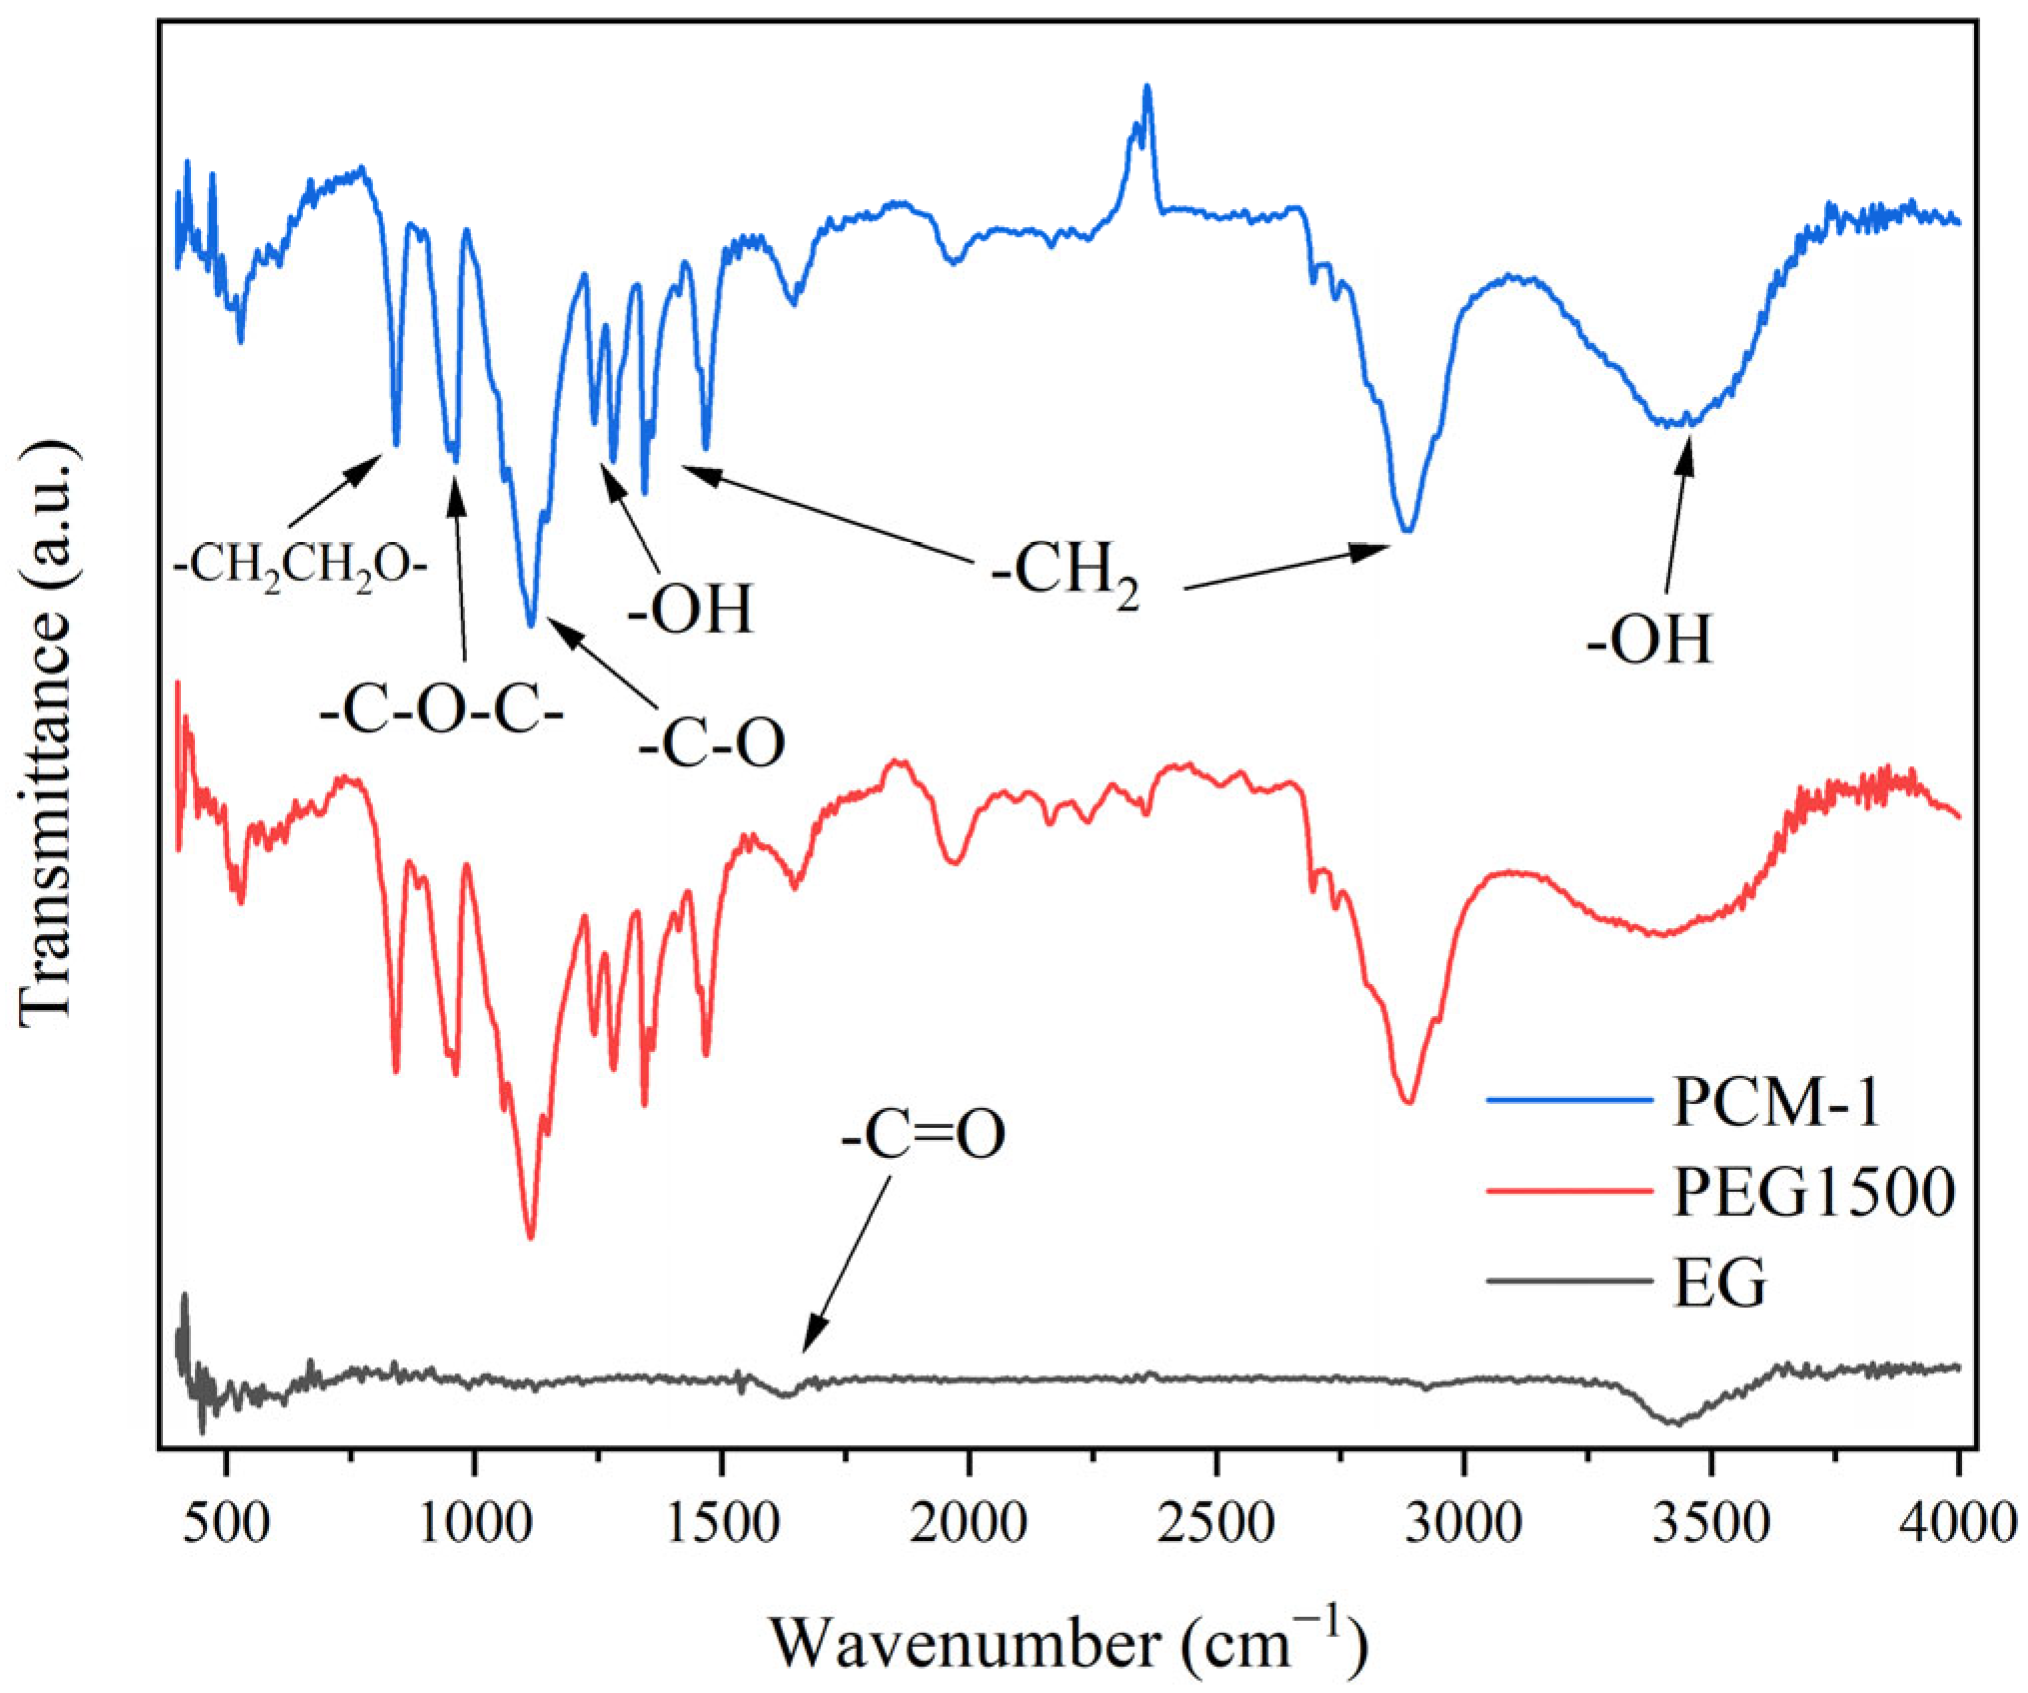
Figure 3.
XRD curves of EG, PEG1500, and PCM-1.
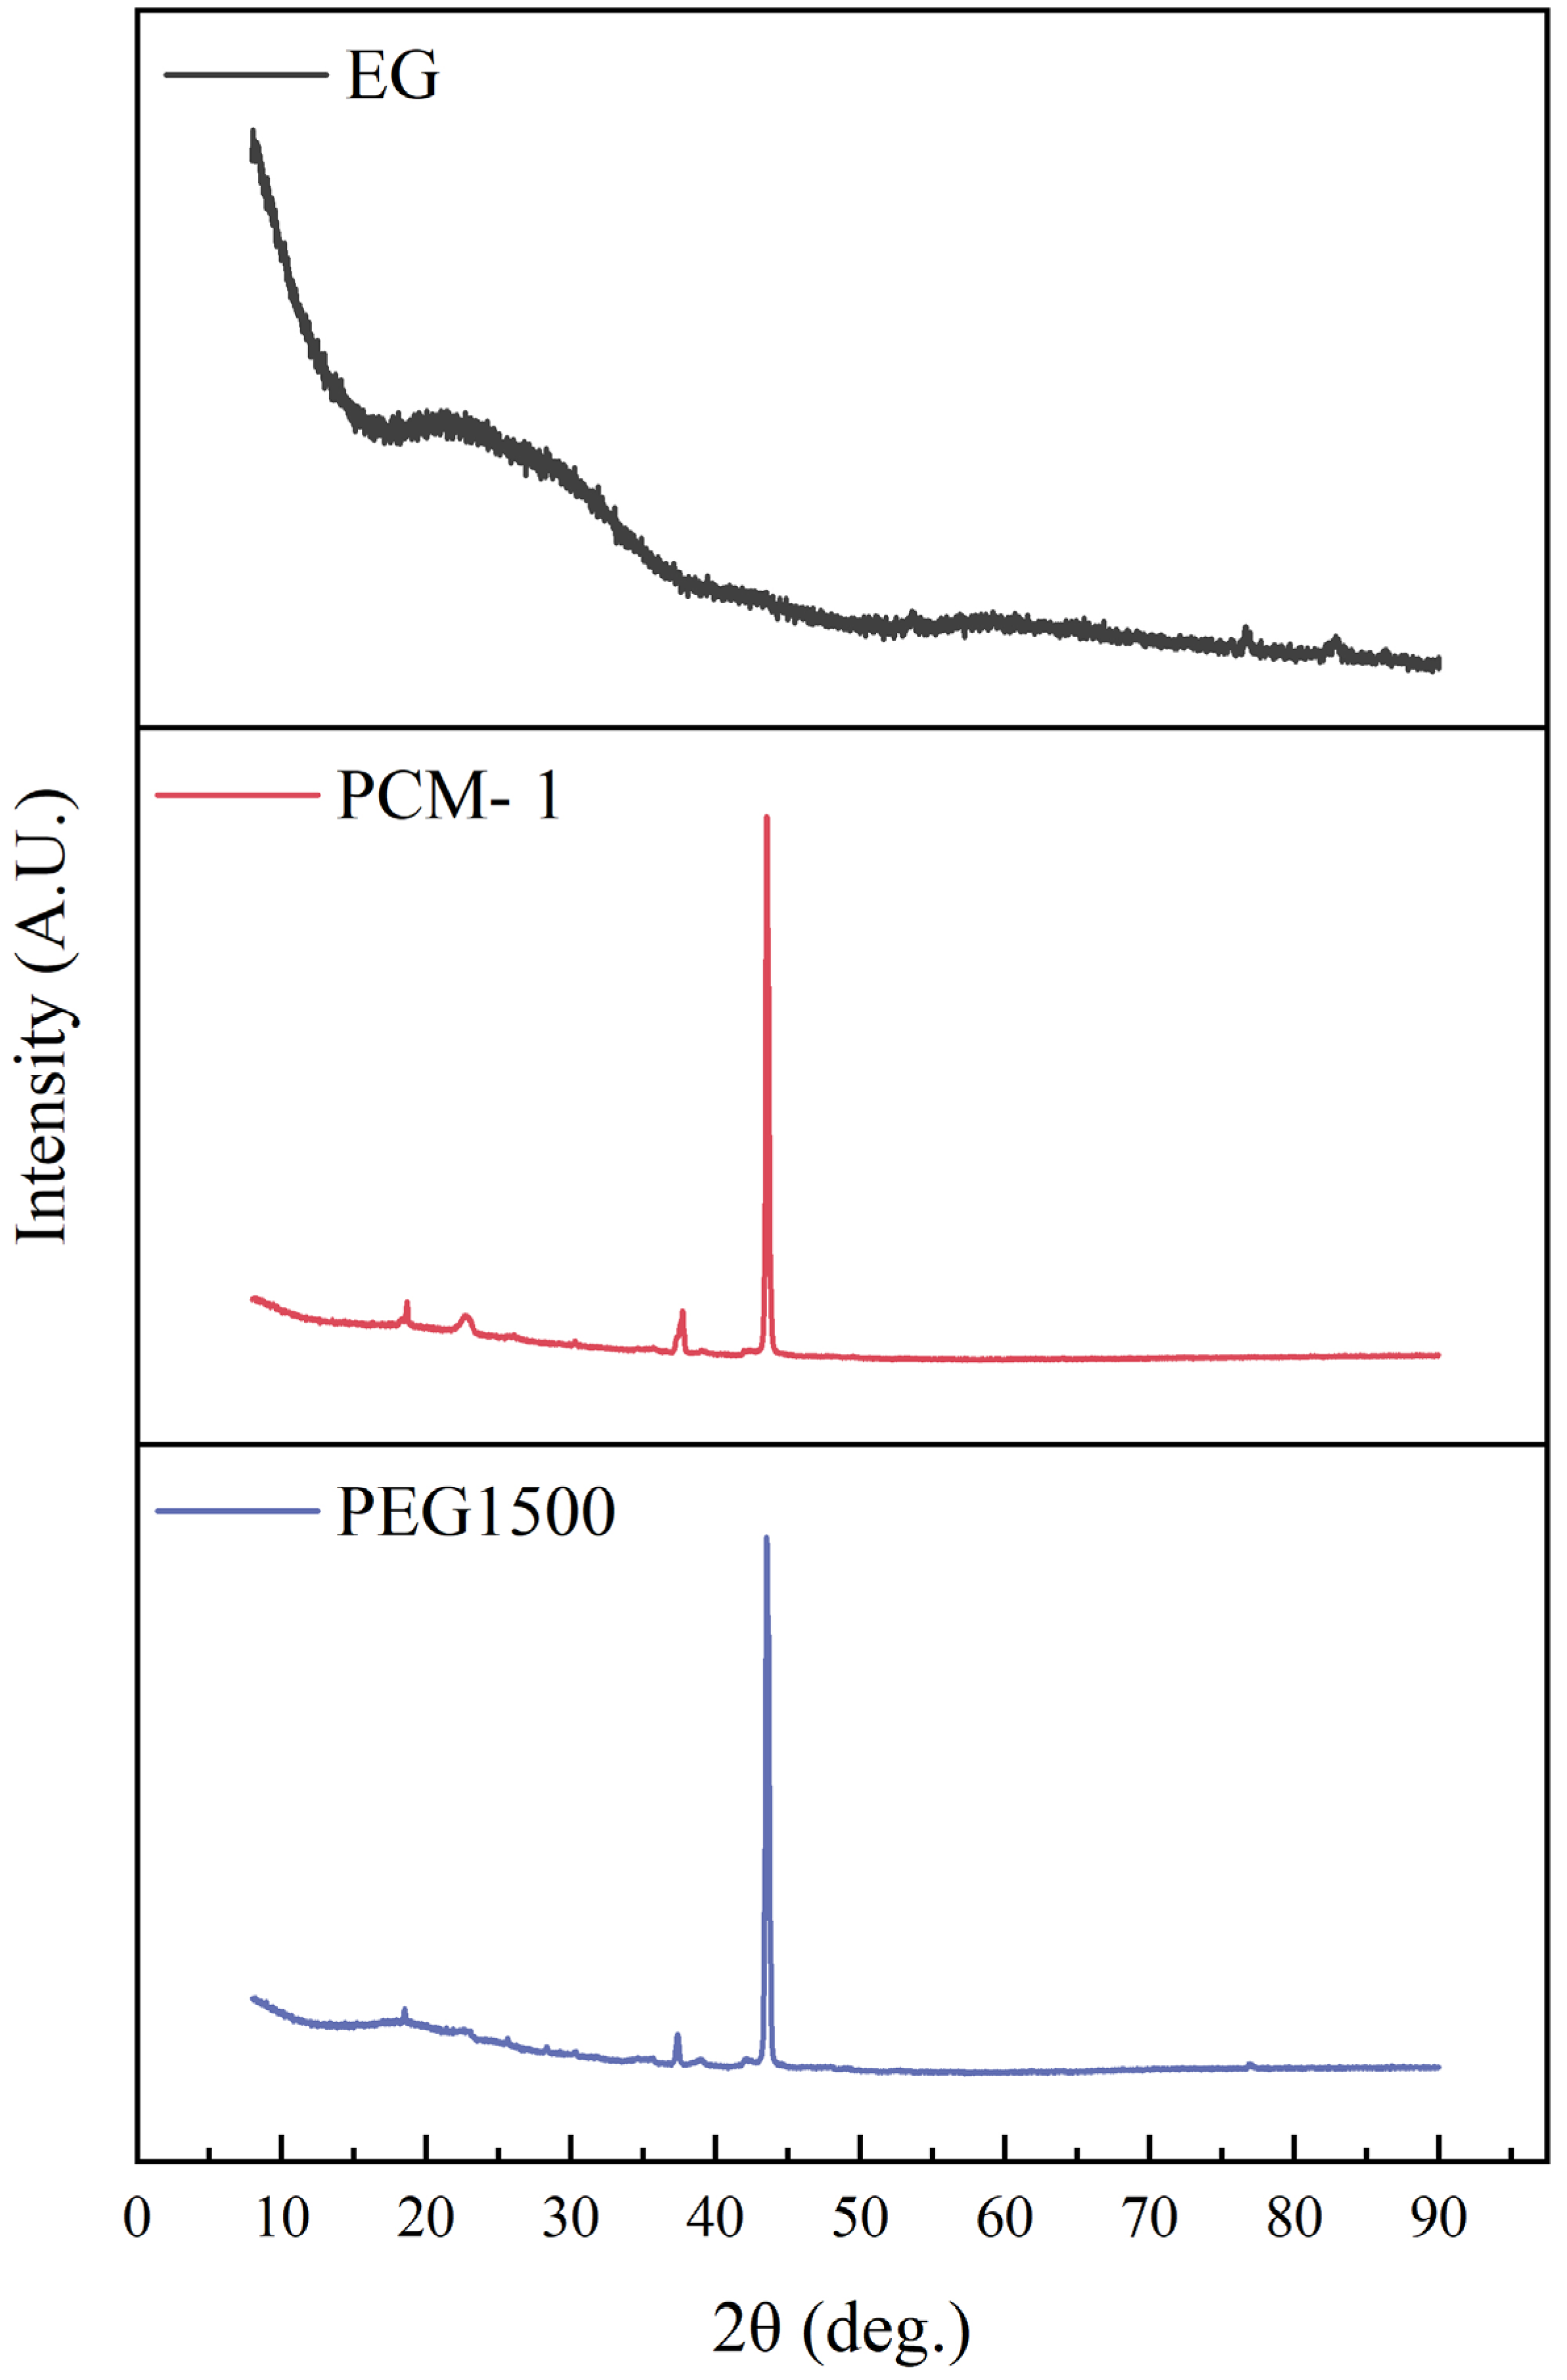
Figure 4.
(a) Morphologies of Cu foam; (b) morphologies of PCM-1; (c,d) morphologies of EG (different magnification).
Figure 4.
(a) Morphologies of Cu foam; (b) morphologies of PCM-1; (c,d) morphologies of EG (different magnification).
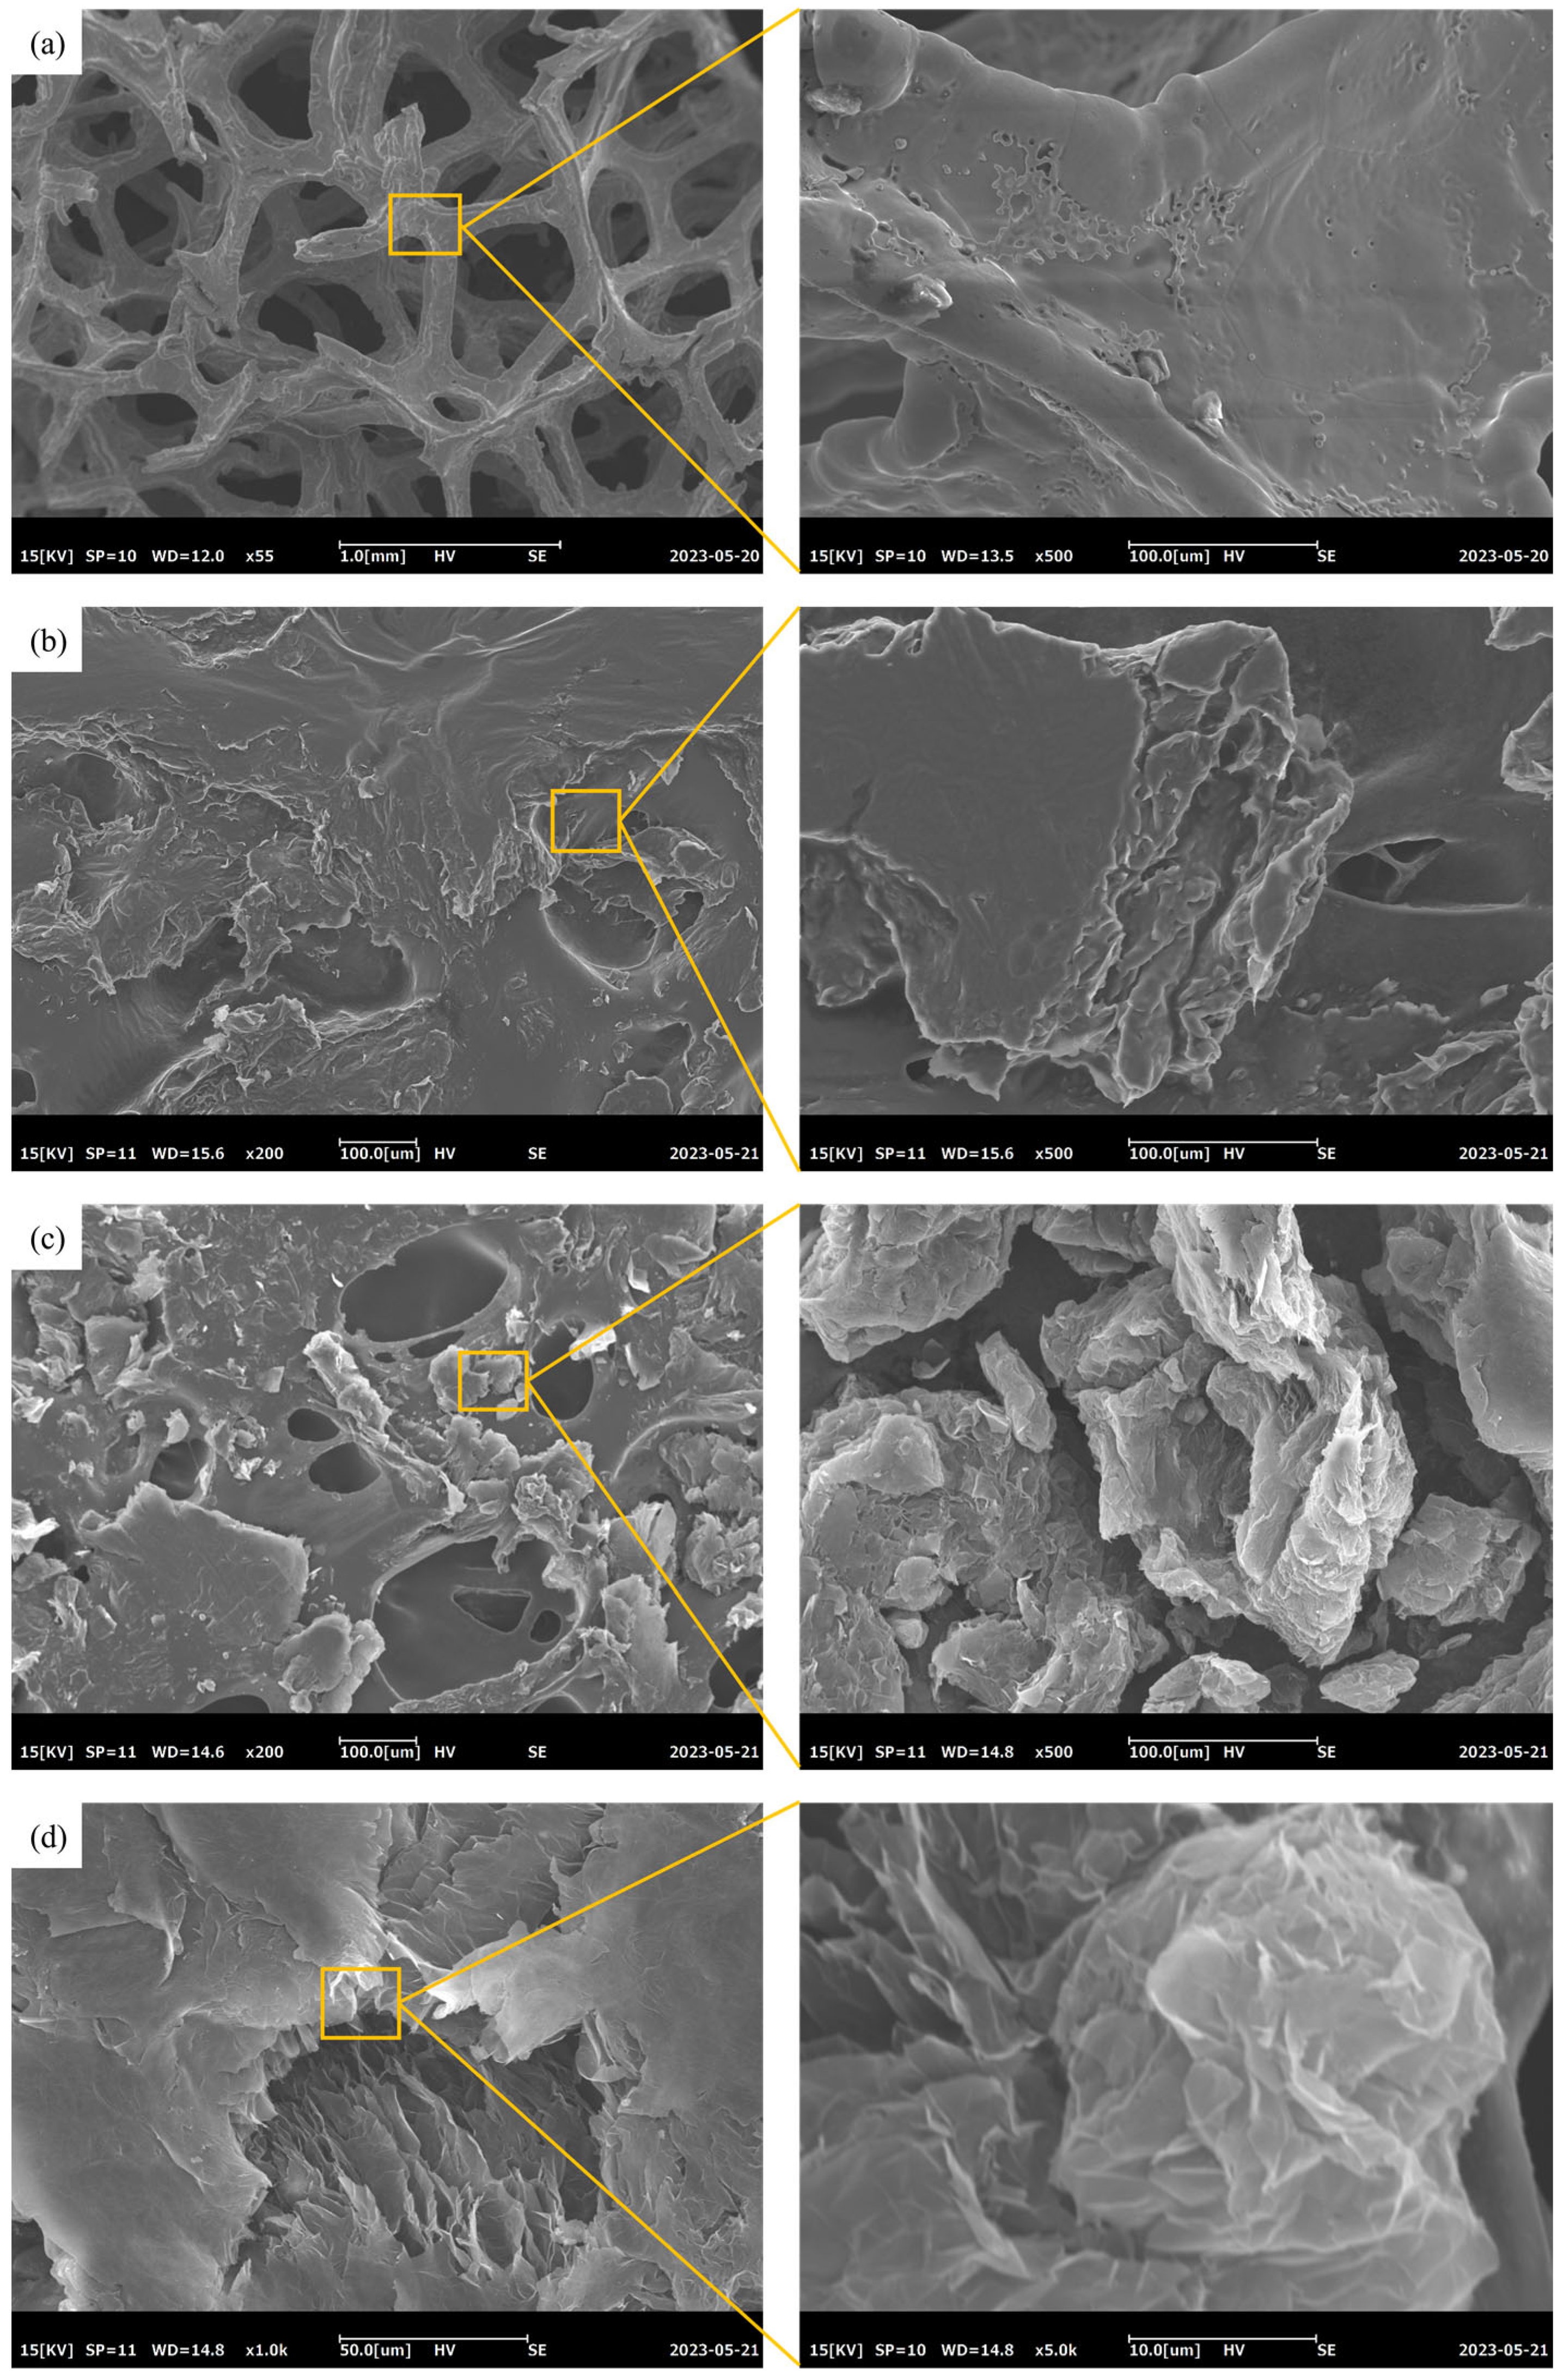
Figure 5.
DSC curves of PEG1500 and EG/PEG composites.
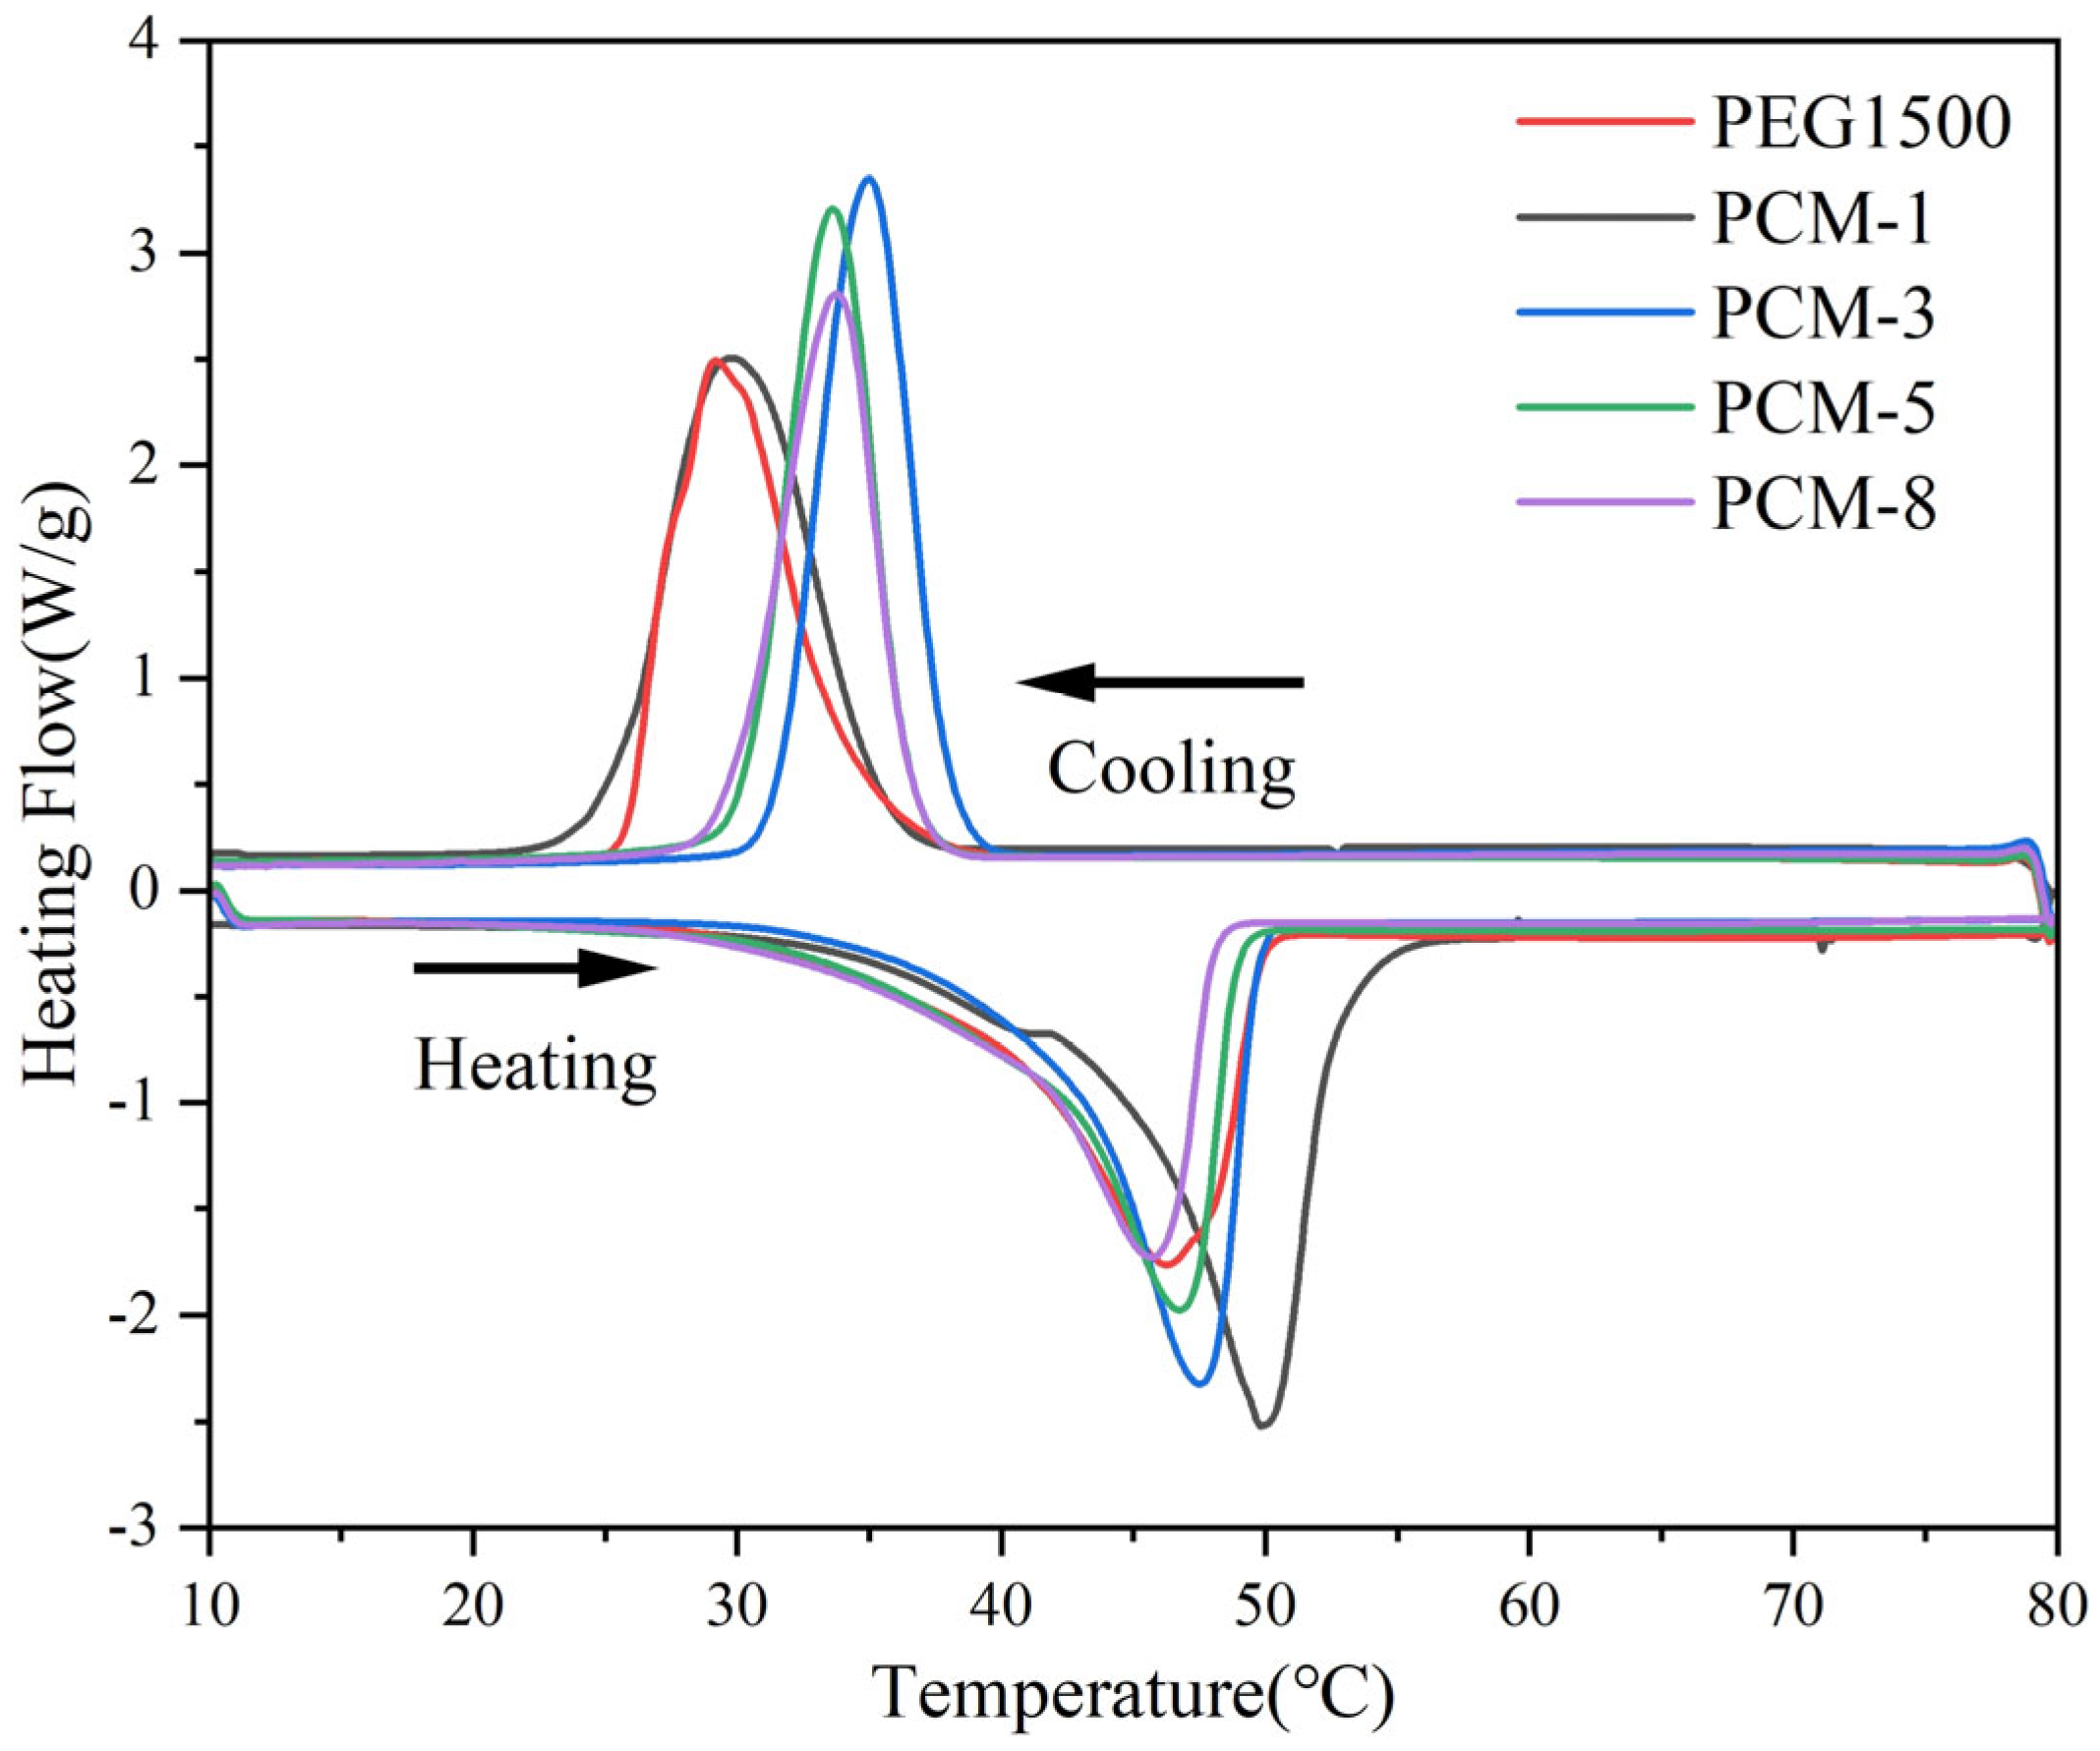
Figure 6.
Thermal conductivity of PEG, PCM-1, and PCM-3.

Figure 7.
TG curves of pure PEG and PCM-1.
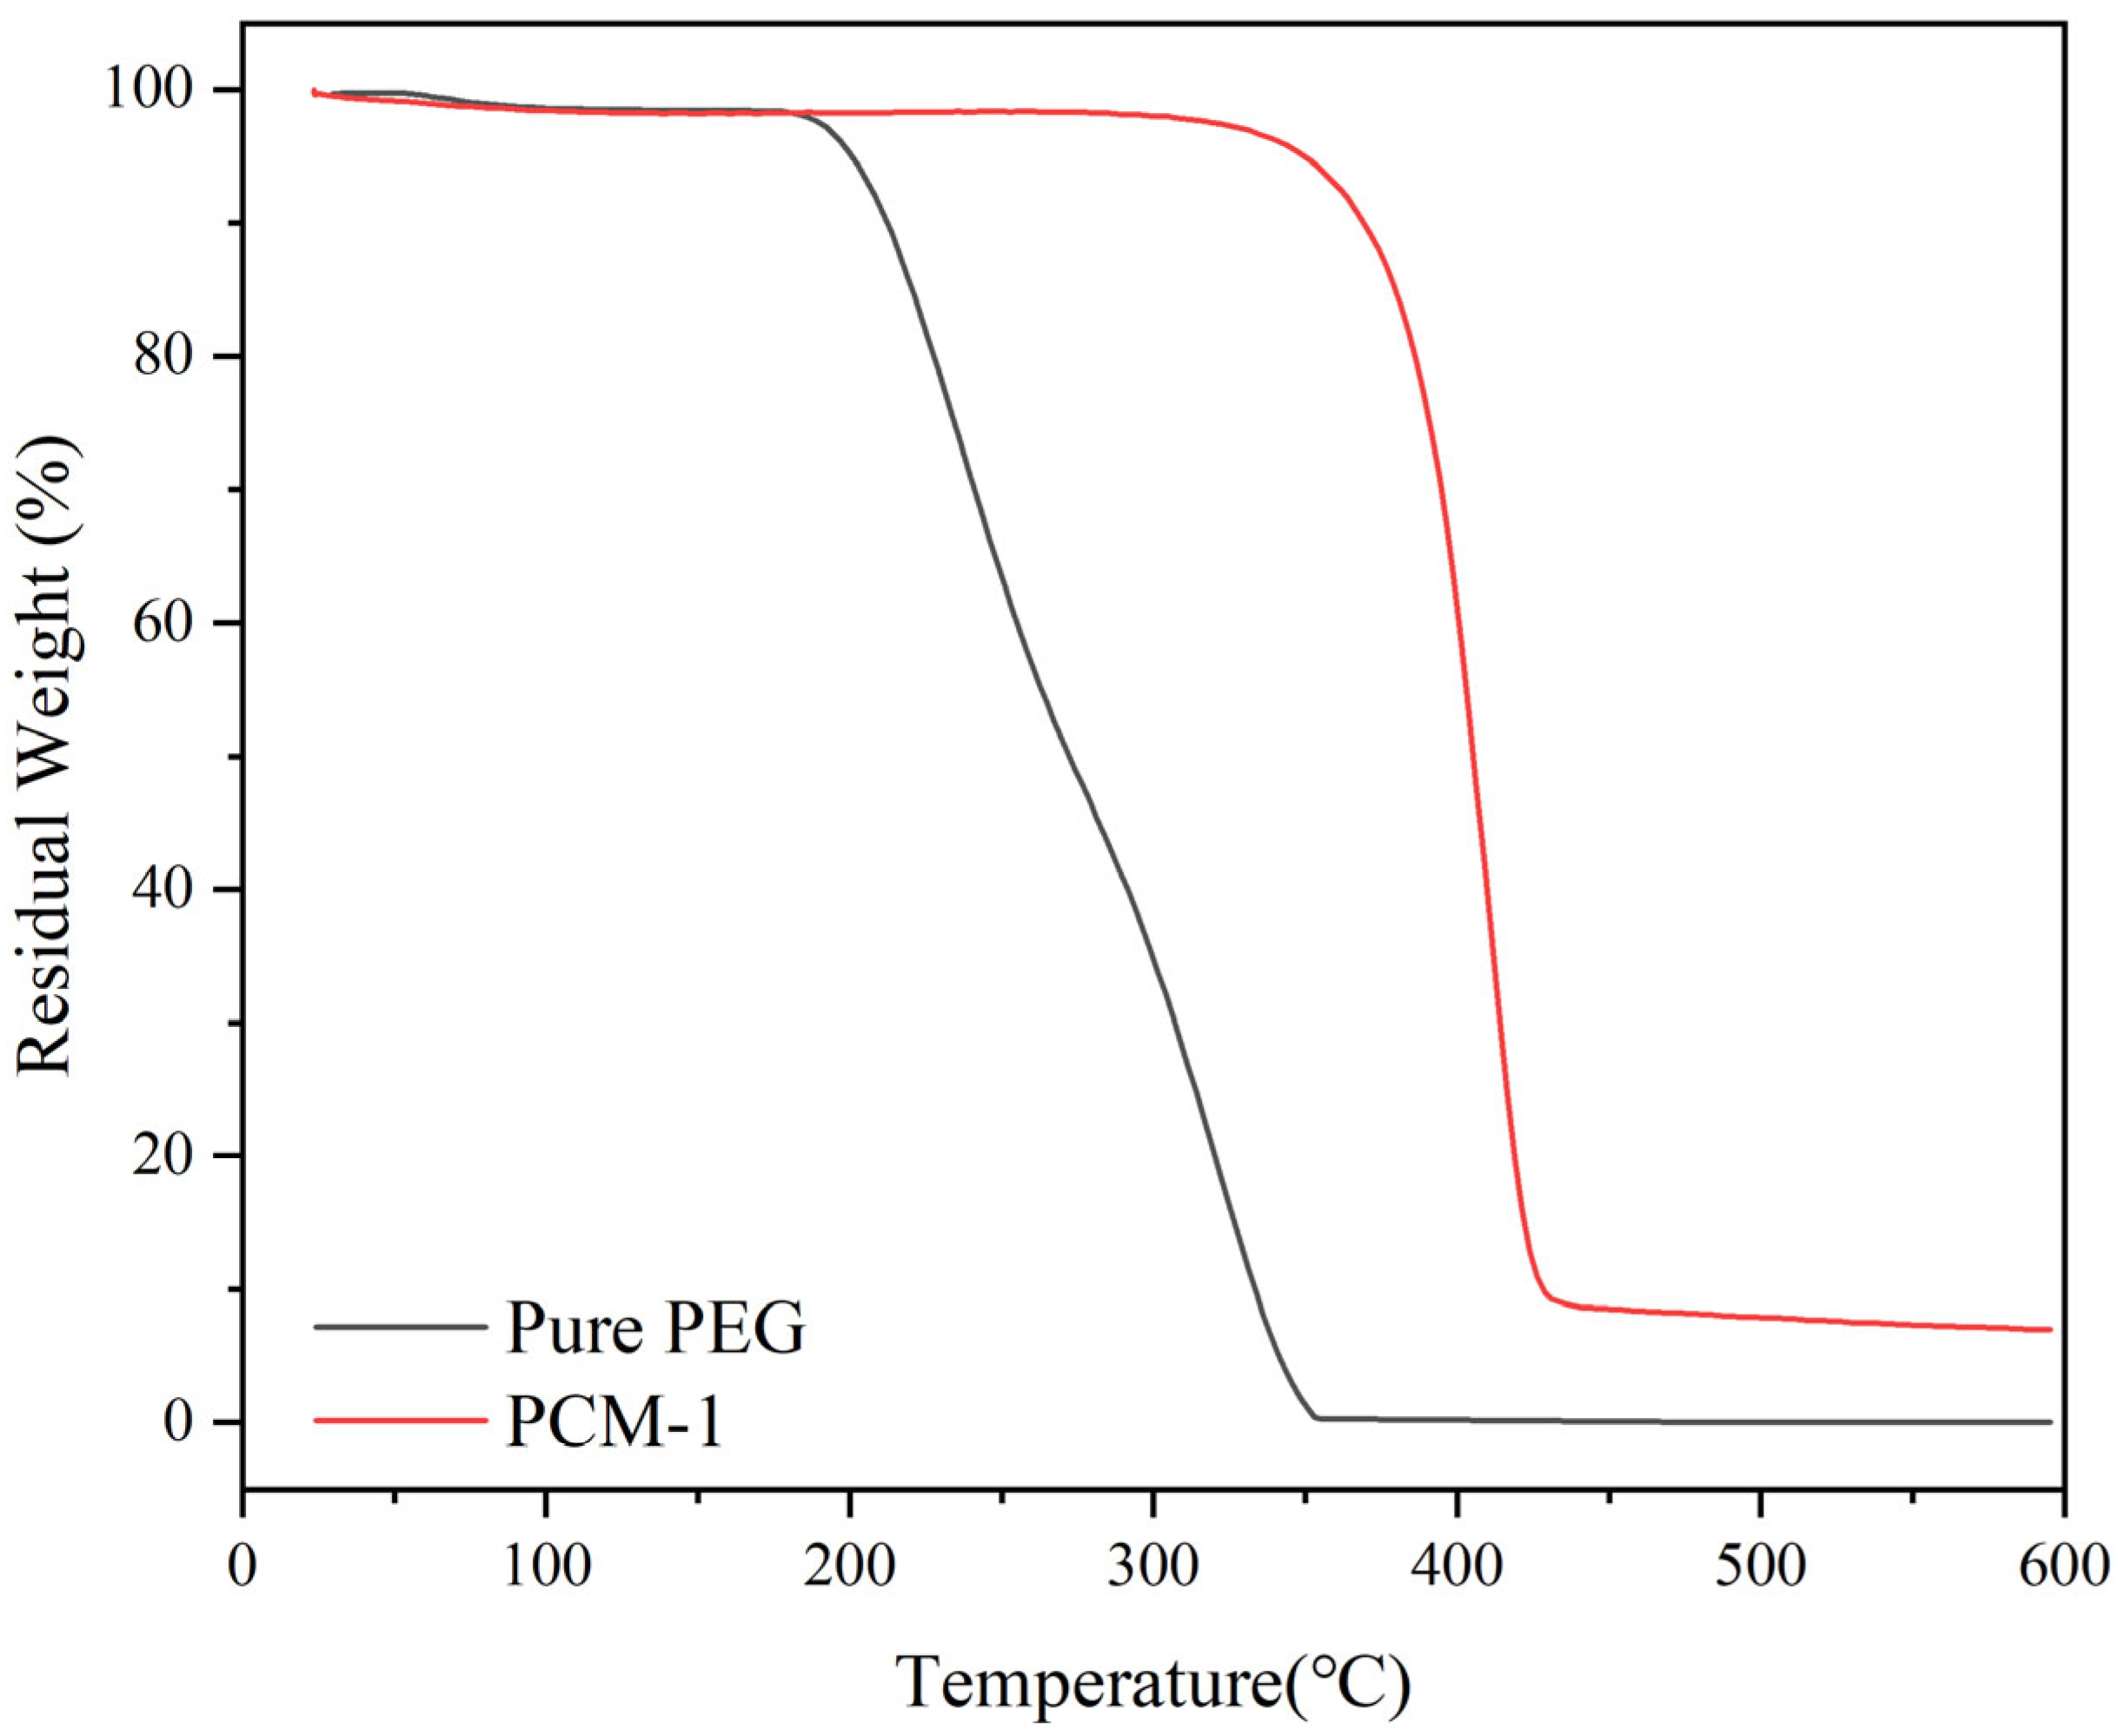
Figure 8.
Voltage curve after multiple discharges. The length value is representative of the time-series value.
Figure 8.
Voltage curve after multiple discharges. The length value is representative of the time-series value.
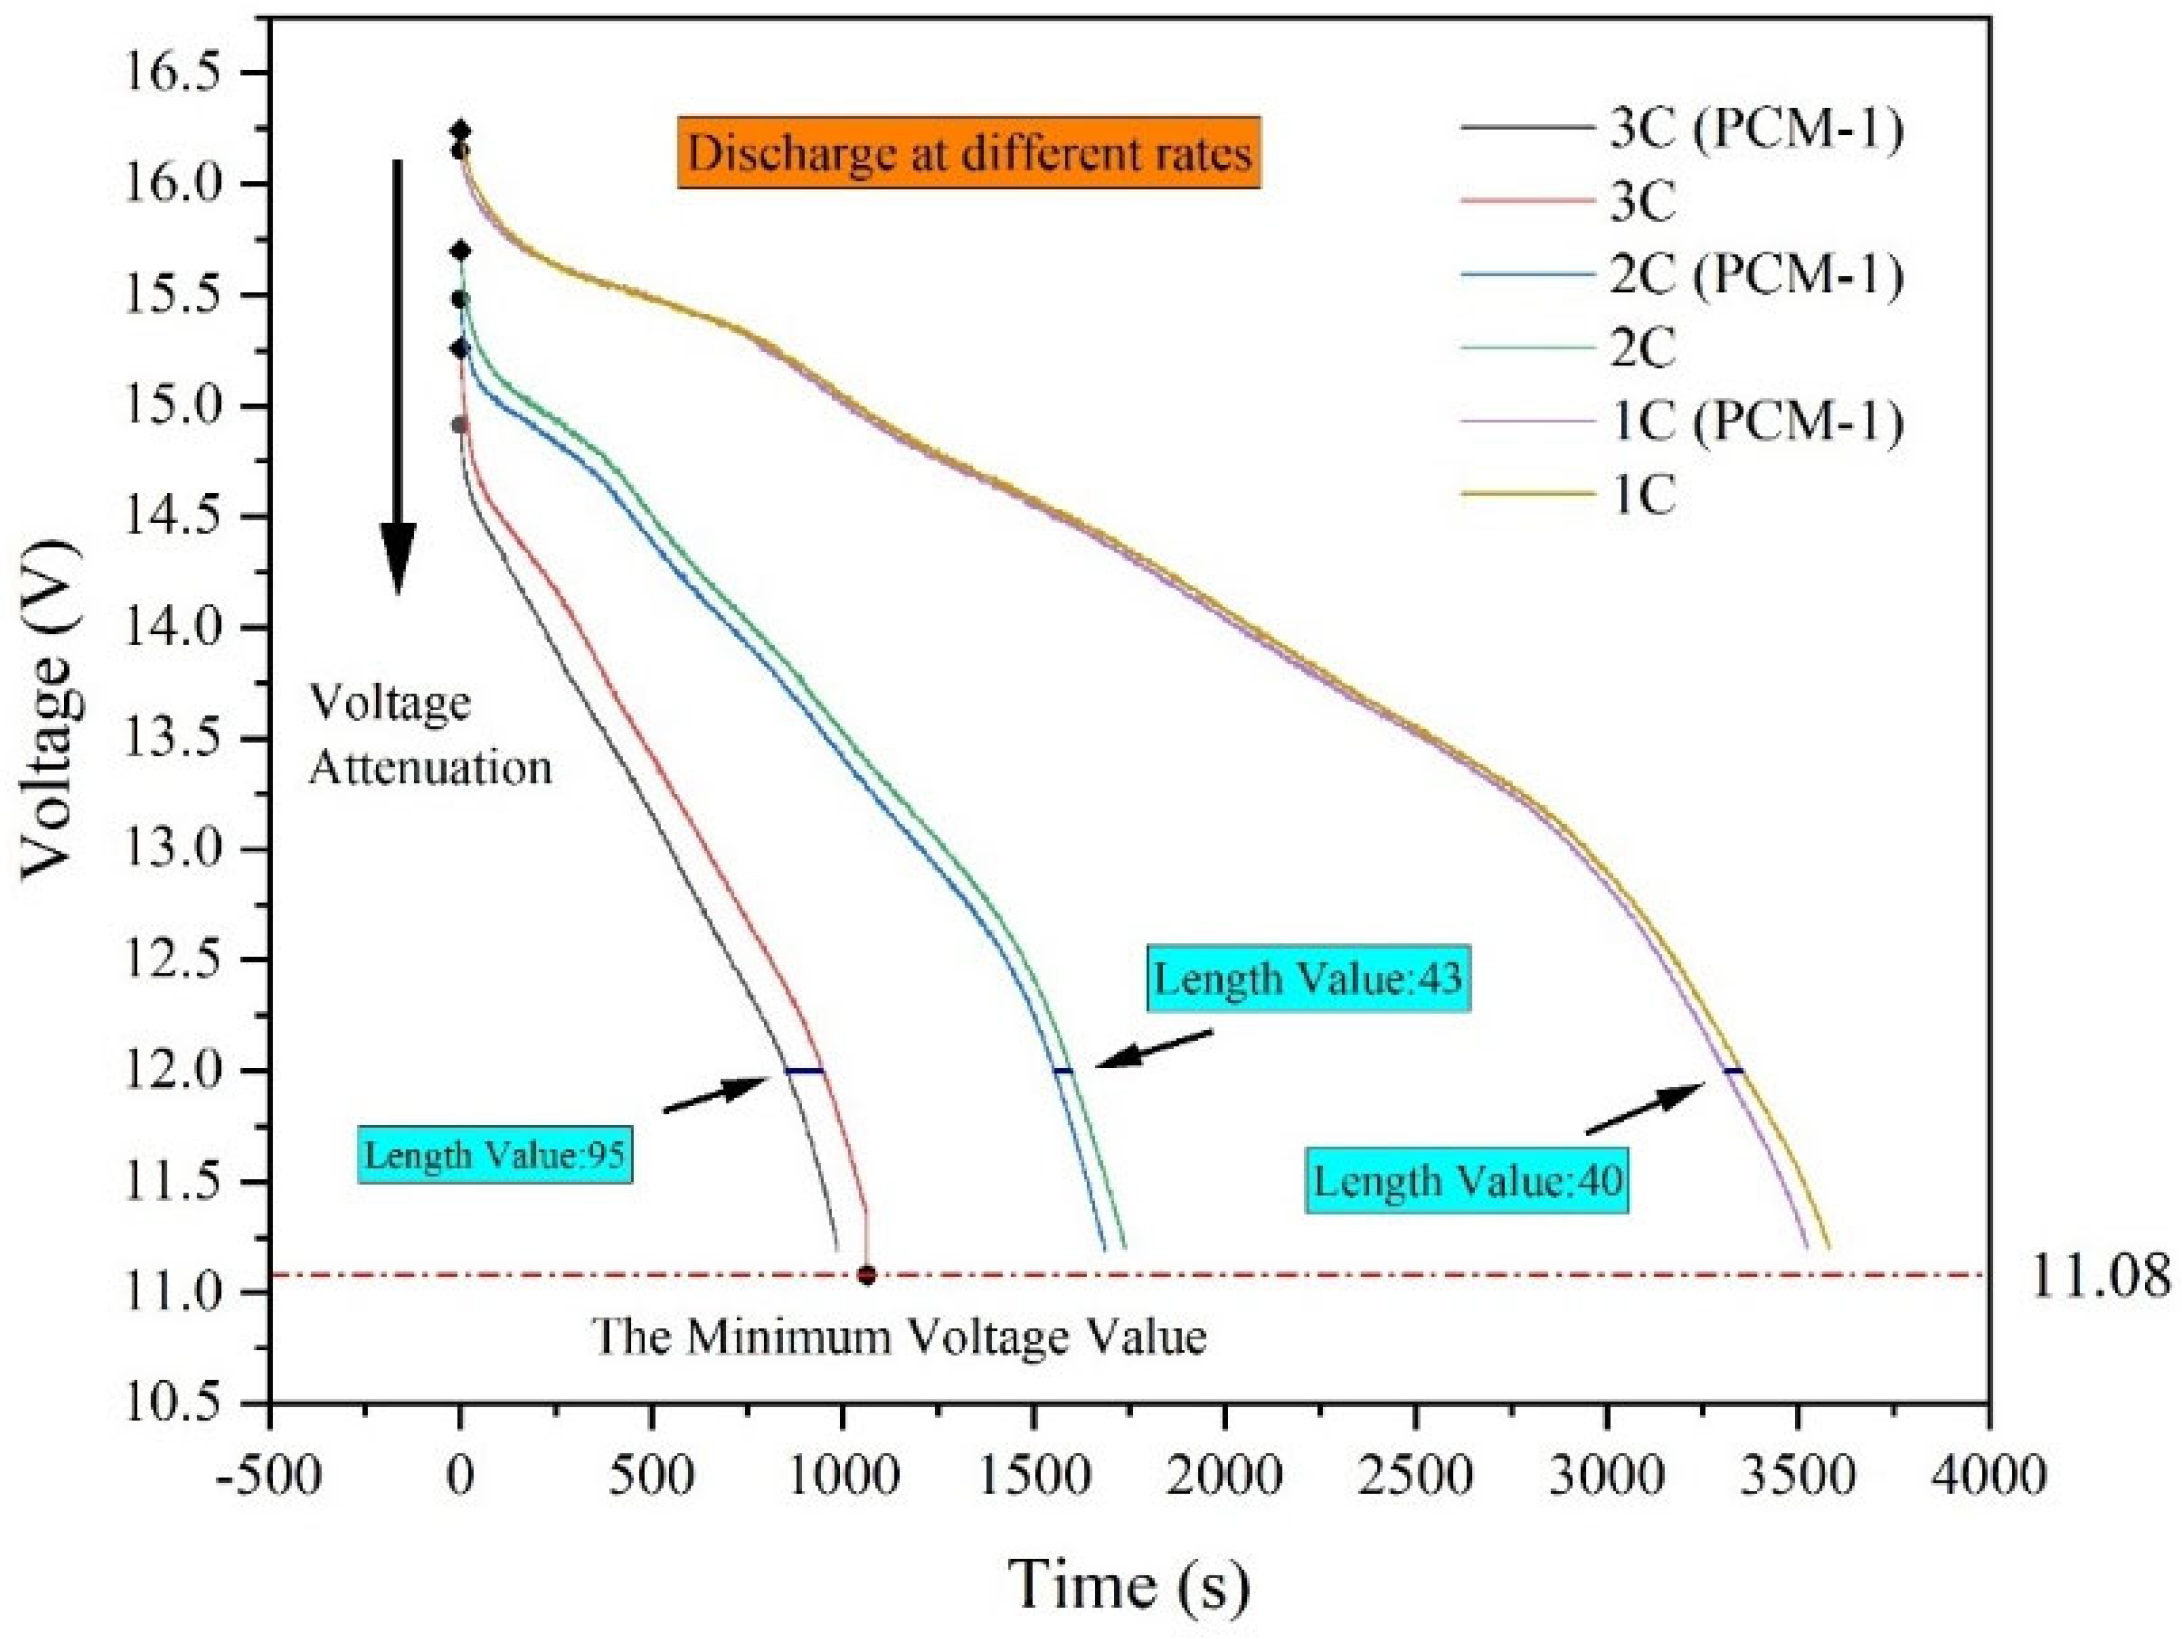
Figure 9.
Electric quantity curve after multiple discharges.
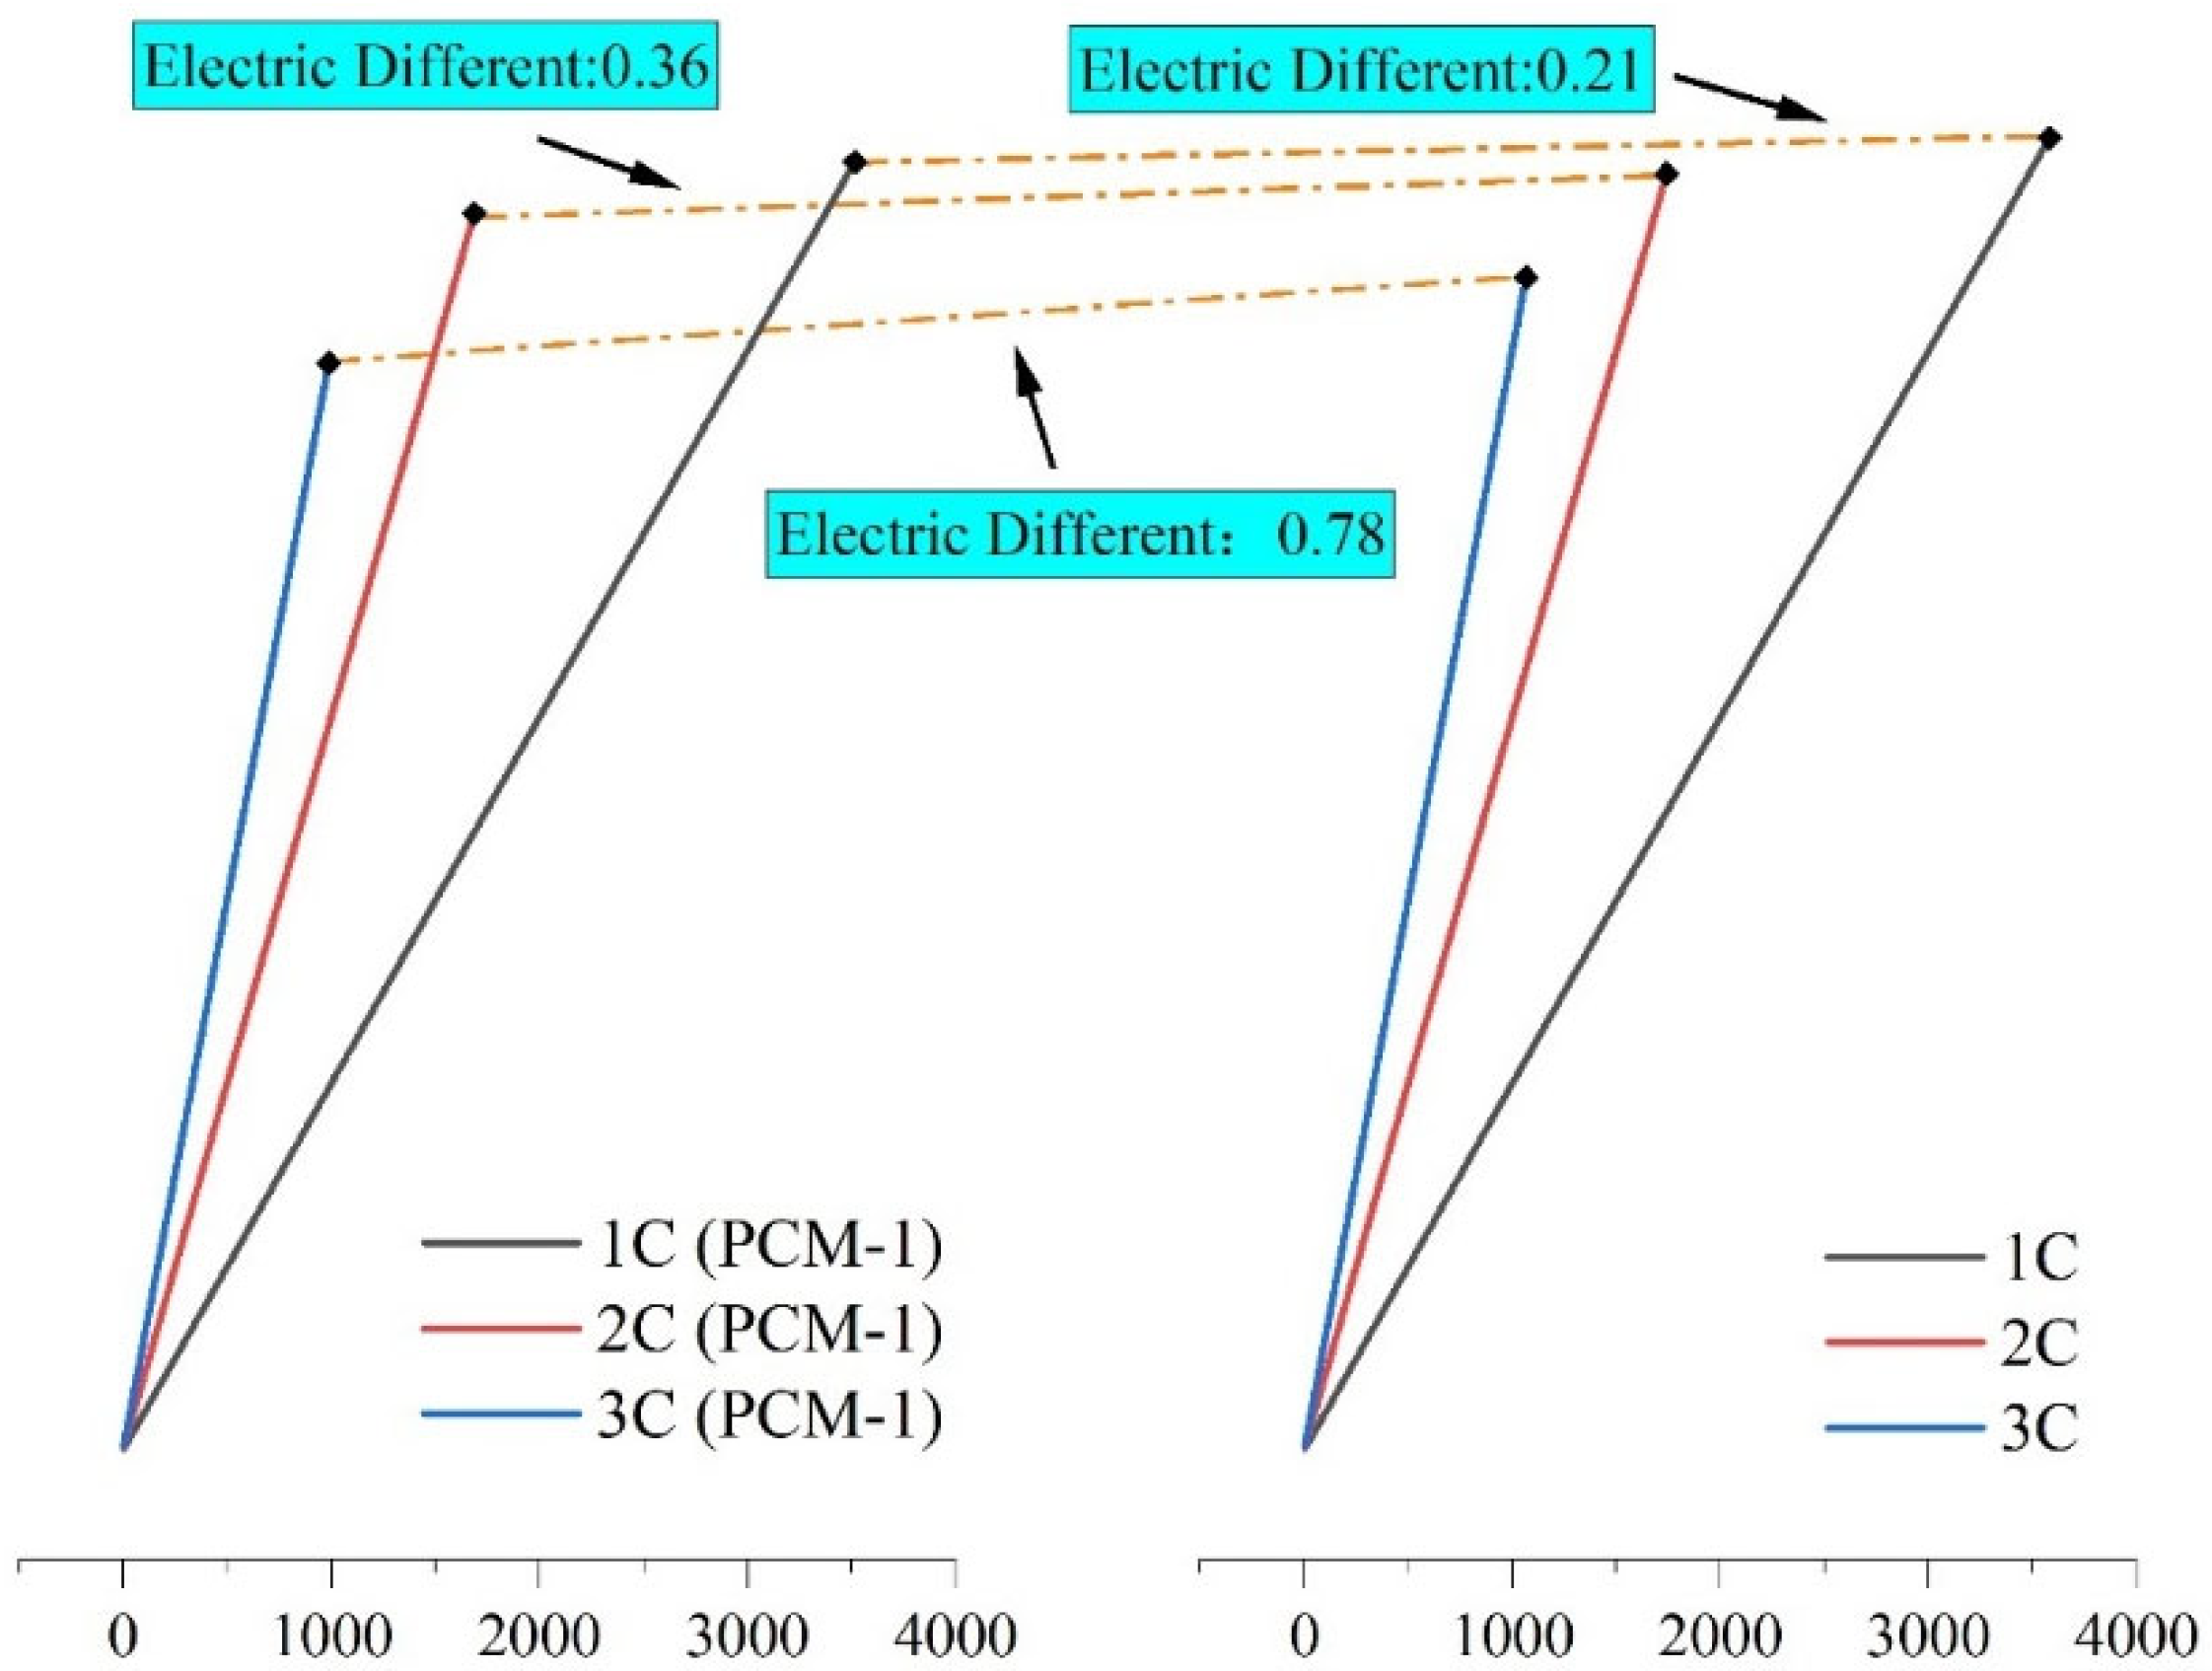
Figure 10.
Temperature curve at the 2C rate.
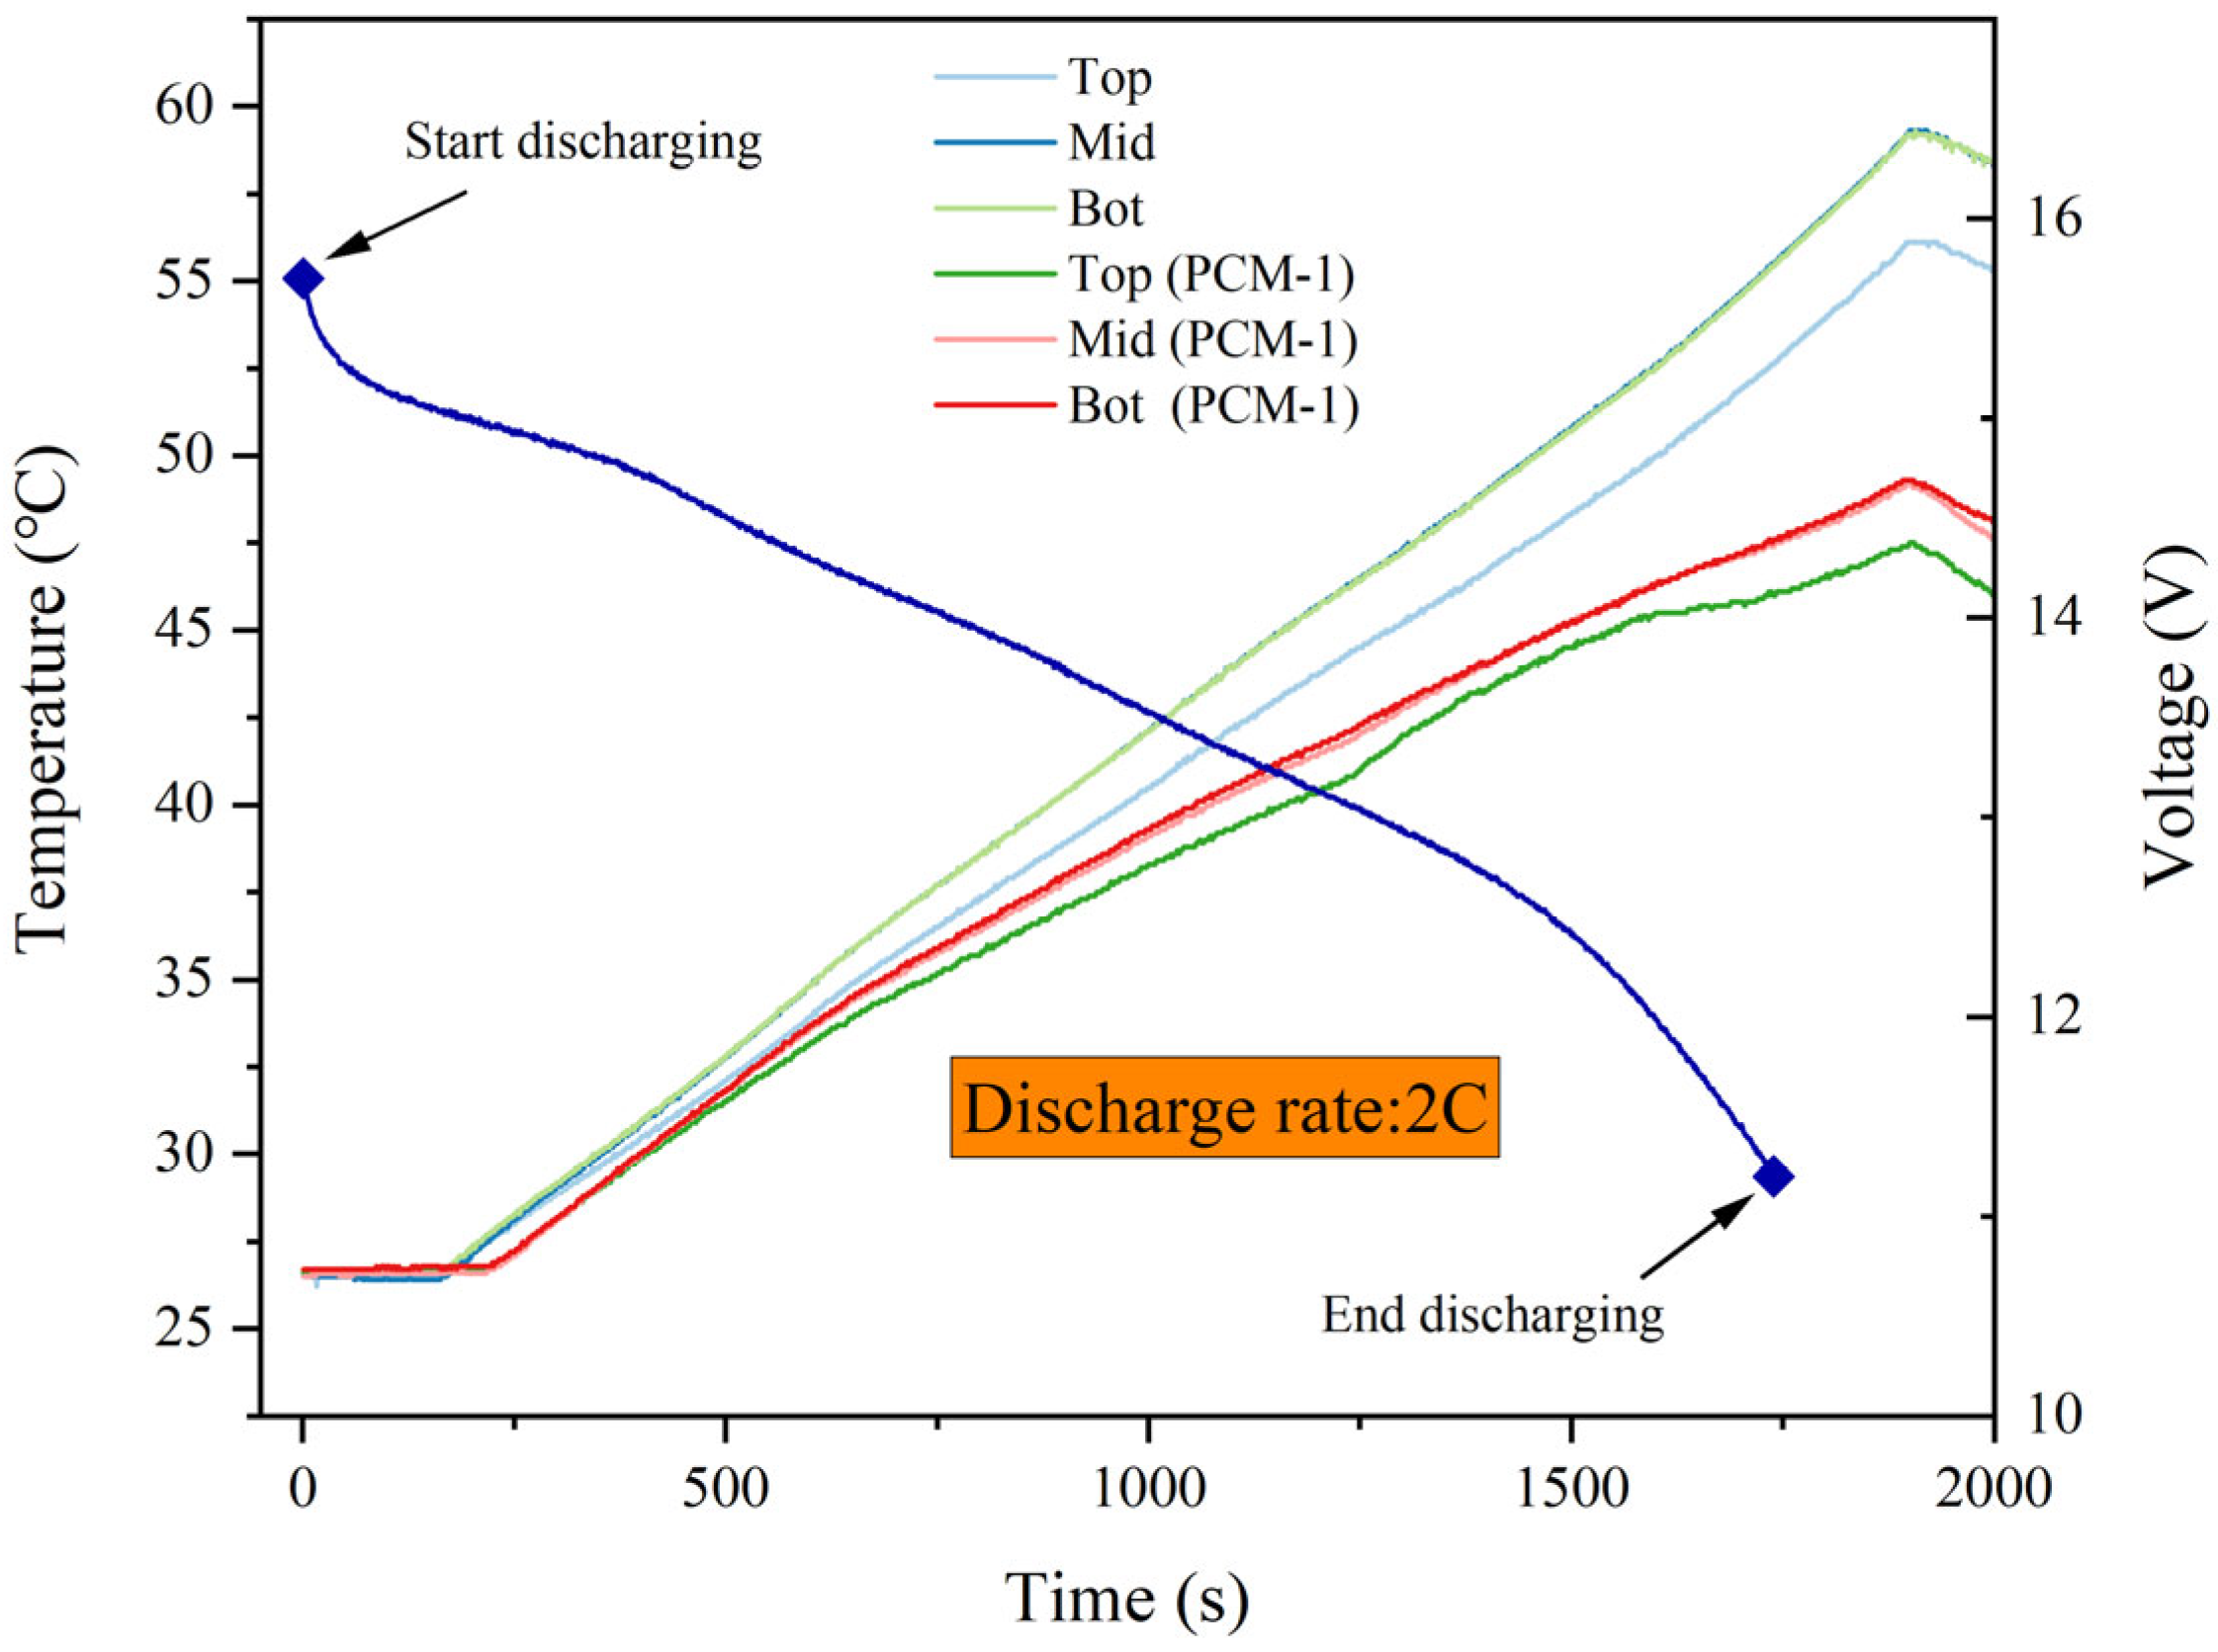
Figure 11.
The 4C dynamic condition.

Figure 12.
Phase transition process.

Table 1.
Four types of heat dissipation.
| Advantage | Disadvantages | |
|---|---|---|
| Air cooling | Simple structure; low cost; large volume | Low thermal conductivity of gas |
| Liquid cooling | High heat-exchange efficiency; moderate volume | Complex structure; large weight; liquid leakage hazards |
| Heat pipe | Good temperature uniformity; small size | Potential liquid leakage hazards |
| Phase change | Simple structure; high heat-exchange efficiency | Low thermal conductivity of materials |
Table 2.
General physicochemical properties of PEG.
| Properties | Value |
|---|---|
| Melting point | 64~66 °C |
| Boiling point | >250 °C |
| Density | 1.27 g/mL |
| Solubility | 50 mg/mL (water) |
| Stability | Stable, but easily oxidized by strong oxidants |
Table 3.
CPCM compositions.
| Samples | PCM Percentage | EG Percentage |
|---|---|---|
| PCM-1 | 99% | 1% |
| PCM-3 | 97% | 3% |
| PCM-5 | 95% | 5% |
| PCM-8 | 92% | 8% |
Table 4.
Experimental uncertainty.
| Apparatus | Formula | Uncertainty |
|---|---|---|
| Thermocouples | (1) | ±0.053 °C |
| Electronic balance | (2) | ±0.56 mg |
| TGA | (2) | ±0.56% |
| DSC | (2) | ±0.56% |
Table 5.
Thermal storage characteristics of composites containing PEG and EG/PEG.
| Samples | Melting | Crystallization | ||
|---|---|---|---|---|
| ΔHm (J/g) | Tm (°C) | ΔHc (J/g) | Tc (°C) | |
| PEG | 157.65 | 46.2 | 157.49 | 29.1 |
| PCM-1 | 155.74 | 46.0 | 156.31 | 34.6 |
| PCM-3 | 150.82 | 47.5 | 155.56 | 34.9 |
| PCM-5 | 144.89 | 45.9 | 144.62 | 33.6 |
| PCM-8 | 140.78 | 45.6 | 135.75 | 33.7 |
Disclaimer/Publisher’s Note: The statements, opinions and data contained in all publications are solely those of the individual author(s) and contributor(s) and not of MDPI and/or the editor(s). MDPI and/or the editor(s) disclaim responsibility for any injury to people or property resulting from any ideas, methods, instructions or products referred to in the content. |
© 2023 by the authors. Licensee MDPI, Basel, Switzerland. This article is an open access article distributed under the terms and conditions of the Creative Commons Attribution (CC BY) license (https://creativecommons.org/licenses/by/4.0/).
Share and Cite
MDPI and ACS Style
Xia, Z.; Li, C.; Yu, H.; Wang, Z. Experimental Study of a Passive Thermal Management System Using Expanded Graphite/Polyethylene Glycol Composite for Lithium-Ion Batteries. Energies 2023, 16, 7786. https://doi.org/10.3390/en16237786
AMA Style
Xia Z, Li C, Yu H, Wang Z. Experimental Study of a Passive Thermal Management System Using Expanded Graphite/Polyethylene Glycol Composite for Lithium-Ion Batteries. Energies. 2023; 16(23):7786. https://doi.org/10.3390/en16237786
Chicago/Turabian StyleXia, Zhenggang, Chaoen Li, Hang Yu, and Zhirong Wang. 2023. "Experimental Study of a Passive Thermal Management System Using Expanded Graphite/Polyethylene Glycol Composite for Lithium-Ion Batteries" Energies 16, no. 23: 7786. https://doi.org/10.3390/en16237786
Note that from the first issue of 2016, this journal uses article numbers instead of page numbers. See further details here.