Article

Investigation of Pyrolysis Kinetic Triplet, Thermodynamics, Product Characteristics and Reaction Mechanism of Waste Cooking Oil Biodiesel under the Influence of Copper Slag

1
Engineering Research of Metallurgy Energy Conservation & Emission Reduction, Ministry of Education, Kunming University of Science and Technology, Kunming 650093, China
2
Kunming Institute of Metallurgy, College of Metallurgy and Mining, Kunming 650033, China
3
State Key Laboratory of Complex Nonferrous Metal Resources Clean Utilization, Kunming University of Science and Technology, Kunming 650093, China
*
Author to whom correspondence should be addressed.
Energies 2023, 16(5), 2137; https://doi.org/10.3390/en16052137
Submission received: 25 January 2023 / Revised: 15 February 2023 / Accepted: 18 February 2023 / Published: 22 February 2023
(This article belongs to the Collection Bioenergy and Biofuel)

Abstract

:
WCO-Biodiesel can be used as a fuel instead of fossil energy for the copper smelting industry will not only save resources but also protect the environment. The pyrolysis of WCO-Biodiesel in the melting pool is influenced to some extent by the copper slag (CS) generated during the copper smelting process. In this study, the effects of CS on the kinetic triplet, thermodynamics, product characteristics and reaction mechanism of WCO-Biodiesel are comprehensively investigated via a thermogravimetric analyzer and pyrolysis experimental system. Firstly, the apparent activation energy (Eα) is calculated using STR, and Eα decreased at different α under the influence of CS. Then, the trend of the WCO-Biodiesel pyrolysis mechanism with α is determined by the master plots method based on 18 commonly used models similar to the Pn and D1 models. The analysis of WCO-Biodiesel pyrolysis gas products shows that more flammable gases containing H are formed under the influence of CS. The analysis of the liquid products shows that more PAHs and more small molecule products are generated under the influence of CS. Two coke products are produced at high temperatures, which differ significantly in microscopic morphology, spherical carbon particle size and chemical structure. Finally, the mechanism of pyrolysis of the main components in WCO-Biodiesel in the high-temperature environment of melt pool melting is explored.

1. Introduction

Over the past few decades, the significant increase in global consumption of fossil fuel has led to a number of environmental problems, such as greenhouse gas emissions and deterioration of air quality caused by pollutants such as SOx, NOx and fine particulate matter. In addition, the volatility of fossil fuel prices and the depletion of fossil resources affect the development of the global economy [1]. As one of the top ten global producers and consumers of non-ferrous metals, China’s non-ferrous metal industry consumes 4.39% of the total energy consumption of the entire country [2]. Therefore, it is urgent to find a clean and sustainable energy source to cope with the energy, and the environmental crisis has become an increasingly important issue. Therefore, replacing non-renewable fossil fuels in the smelting process of non-ferrous metals fossil fuels with green renewable biomass energy is an effective way to reduce emissions in the non-ferrous metals industry.
Biodiesel is a clean and sustainable liquid fuel that reduces emissions of greenhouse gases that contribute to global warming [3,4]. Waste cooking oil biodiesel (WCO-Biodiesel) is a fatty acid methyl ester obtained from waste cooking oil through an esterification process, which can be used as a fuel. The low-cost feedstock of used cooking oil is a good choice for biodiesel production and further solves many environmental problems [5,6]. In contrast to used waste cooking oil, WCO-Biodiesel has the advantage that used waste cooking oil contains high levels of sulfur-containing compounds (mainly sulfur-containing organics from household, restaurant and other facility wastewater) that can be converted to harmful sulfur dioxide during combustion when burned directly as fuel, leading to serious environmental and health problems [7].
Many researchers have previously conducted many studies on the application of biodiesel. Bahadorizadeh et al. [8] investigated the emissions of boiler combustion systems using the addition of Al2O3, CeO2 and Co3O4 blended with WCO-Biodiesel in single, binary blends and ternary blends and found that the addition of nanoparticles significantly reduced CO emissions and the combination of CeO2 and Co3O4 had a synergistic effect on reducing the emissions of pollutants such as CO and NOx. Gad et al. [9] investigated the combustion characteristics of diesel engines, comparing WCO-Biodiesel with the addition of gasoline and kerosene and pure WCO-Biodiesel as fuel. It was found that the blends achieved better improvements in diesel engine performance, combustion characteristics and emission reduction. Blends of gasoline or kerosene with WCO-Biodiesel can be used as a replacement for diesel engines. Additionally, other researchers investigated the efficiency of diesel filters [10]. Simbi et al. [11] investigated the chemical and qualitative properties of sunflower biodiesel–gasoline blends and palm biodiesel–gasoline blends and found that sunflower biodiesel–gasoline blends had more energy content and lower acid values. The palm biodiesel–gasoline blends were also found to have good thermal stability and better cold-start characteristics. Therefore, as a kind of clean fuel, biodiesel has a wide range of application prospects [12].
Yunnan is one of the important copper production bases in China, and a large amount of copper slag (CS) is generated in the process of copper smelting [13]. Previous studies [14,15] have shown that the high content of iron olivine (Fe2SiO4) in CS promoted the pyrolysis of biomass. Many previous studies have been conducted on the application of biomass in the non-ferrous metals industry. Du et al. [16] studied the co-treatment of CS with rubber seed oil and found that CS had a facilitative effect on the bond breaking of rubber seed oil, and the co-treatment not only improved the utilization efficiency of rubber seed oil, in addition to made CS more harmless and resourceful. Supriyatna et al. [17] found that when charcoal and palm husk were used as reducing agents to replace coal coke for ferromanganese production, the highest manganese extraction rate reached 49.91 and 44.16%, respectively, and which indicates that palm husk and charcoal have great potential as reducing agents in ferromanganese production. Zhou et al. [18] found that when walnut shell charcoal was used as a reducing agent to recover iron from waste copper slag, the main phase of the reduced CS samples was found to be iron at 1300 °C, indicating that biochar could effectively reduce the iron phase in CS. Li et al. [19] found that the use of waste cooking oil as a reducing agent could not only reduce the magnetic iron in CS but also reduce the carbon emission during copper smelting, and the study also developed a kinetic model for the reduction of magnetic iron in CS by waste cooking oil. These studies show that biomass has great potential in the non-ferrous metals industry.
Therefore, it is excellent to apply WCO-Biodiesel instead of traditional fossil fuels in the copper smelting process. Moreover, the high temperature and excellent heat and mass transfer conditions of the thermal storage melting pool can make the WCO-Biodiesel gasify rapidly. More combustible gases are generated by the pyrolysis of WCO-Biodiesel during the copper melting process due to CS catalysis, which facilitates the high-value utilization of WCO-Biodiesel. Therefore, the effect of CS on the kinetics, thermodynamics and pyrolysis mechanism of WCO-biodiesel is investigated. According to the previous study [20], the simultaneous use of more than two iso-conversional methods is only indicative of the nuanced Eα values calculated by different methods, and only one precise method should be used, so only the STR method of iso-conversional methods is used in this study [20]. The effect of CS on WCO-biodiesel pyrolysis products is further analyzed by GC, GC/MS, Raman and SEM.

2. Materials and Methods
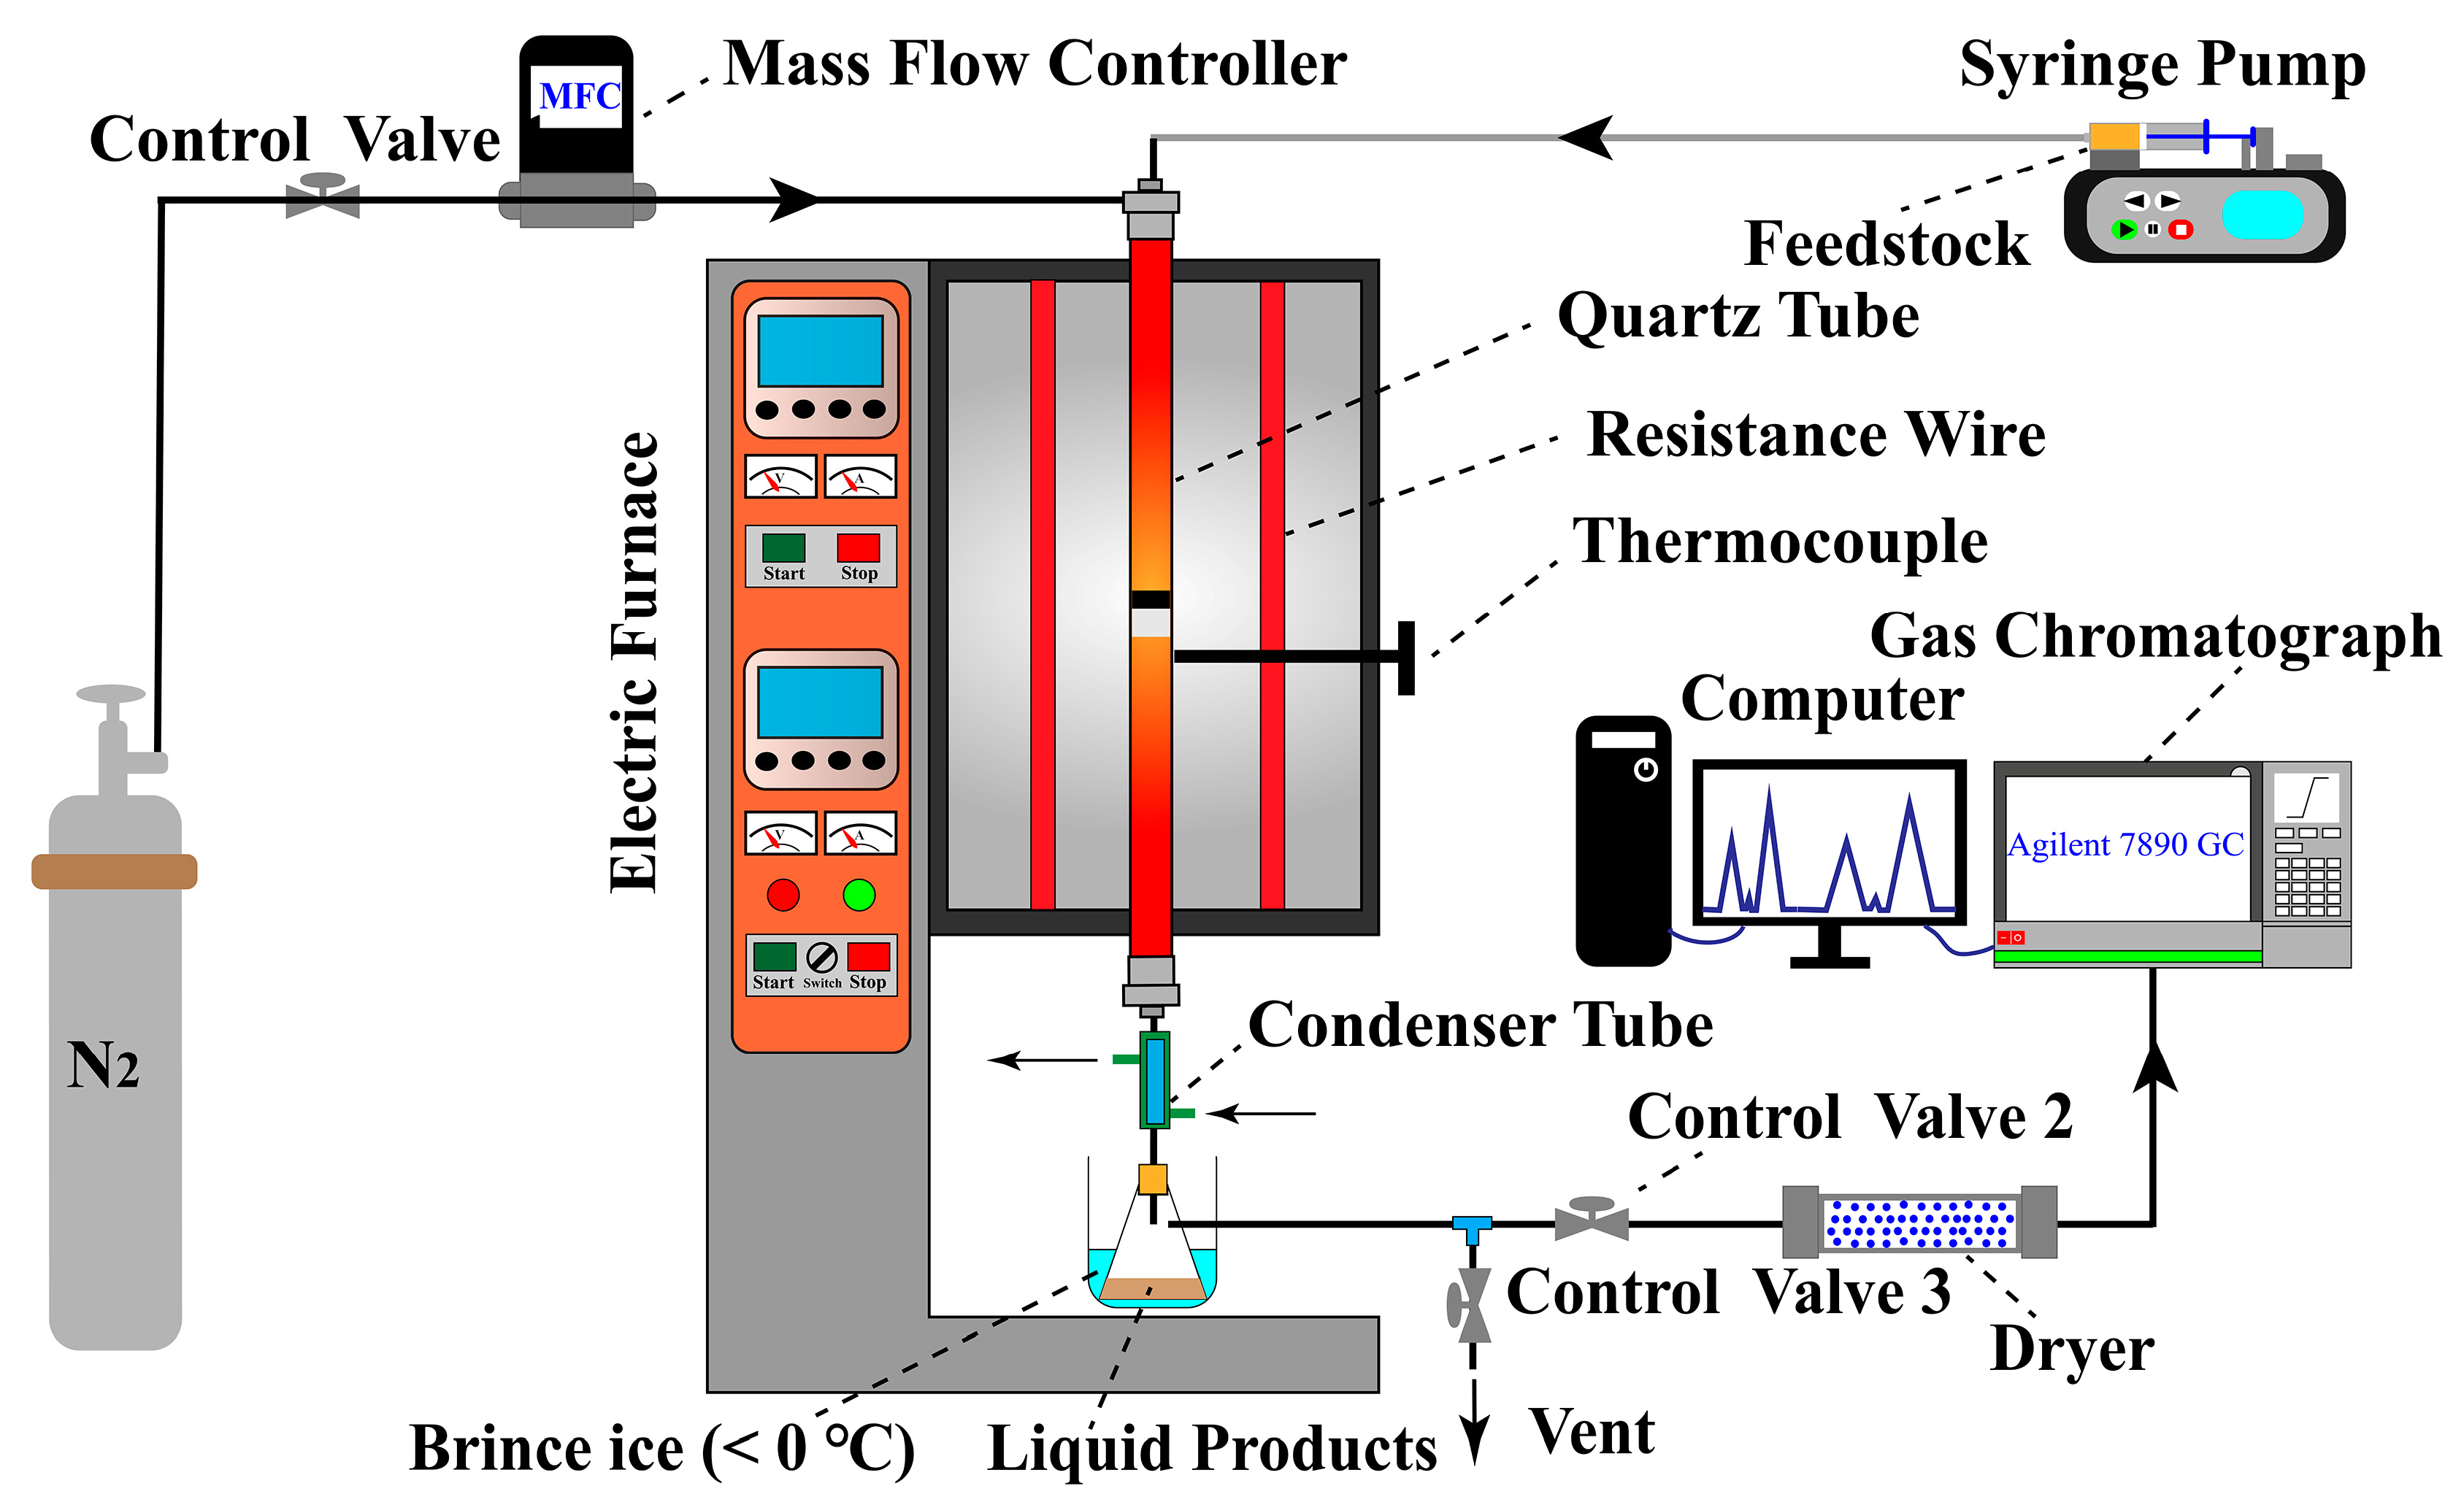
The instrument used to analyze the elemental composition of WCO-Biodiesel was the Vario EL III elemental analyzer. National standard GB/T212-2008 was used to determine the volatile fraction, fixed carbon and ash content of WCO-Biodiesel. Dulong formula was used to calculate the high heating value (HHV) of WCO-Biodiesel. Gas chromatography–mass spectrometry (GC-MS; Thermo Finnigan Trace DSQ mass spectrometer; USA) was used to measure the fatty acid composition of WCO-Biodiesel. WCO-Biodiesel was stored in sealed glass bottles prior to the start of the experiment.
Table 1 shows the main components of CS used in this study, which are mainly composed of SiO2, Al2O3, CaO, MgO, ZnO and Fe3O4. X-ray diffraction (XRD) was used to analyze the physical phase of CS with Cu target, diffraction angle 2θ of 10°~80°, scanning speed of 2°/min, voltage 40 kV and current 40 mA. From the XRD patterns of CS shown in Figure 1, intense diffraction peaks of Fe3O4, Fe2SiO4 and Cu2S can be observed, but the glassy phases such as Al2O3, CaO and MgO in CS cannot be detected. CS samples with a diameter of less than 0.5 mm were obtained by crushing, and then the obtained samples were dried in a drying oven at 105 °C for 24 h.

2.1. Experiments

NETZSCH STA 449F3 thermogravimetric analyzer (Germany) was used to perform TGA experiments WCO-Biodiesel and blends of CS and WCO-Biodiesel (1:10 mass ratio). Approximately 10 mg of the sample was placed in an Al2O3 crucible. The experiments were performed in N2 (99.999%) environment with heating rates of 10, 30 and 50 °C min−1 from 25 °C to 1000 °C. According to the TGA results of pure CS, its total weight loss was negligible compared to the loss of WCO-Biodiesel weight.
The WCO-Biodiesel pyrolysis experiments were carried out in the experimental system shown in Figure 2. The experimental system consists of a vertical tube furnace, reactor (quartz tube), syringe pump, temperature controller, mass flow controller, condenser, drying tube, nitrogen bottle, liquid product collector and gas bag. Before starting the experiment, 0.5 g of CS was placed in a quartz tube (inner diameter = 15 mm). Then, the gas cylinder and gas control valve was opened, N2 was passed into the quartz tube (time = 5 min), the air in the reactor was discharged, and the flow rate of nitrogen was controlled to 10 mL/min with a mass flow controller. After the preparation was completed, the reactor was heated to 600, 700, 800, 900 and 1000 °C using a vertical tube furnace at a heating rate of 10 °C/min. After reaching the reaction temperature, WCO-Biodiesel was injected into the reactor by a syringe pump at a rate of 0.05 mL/min. The liquid product was condensed and collected in a liquid product collector, the gaseous product was dried and collected in a gas bag and the solid product remained in the reactor.

2.2. Pyrolysis Products Analysis and Characterization

GC-Agilent 7890A (USA) gas chromatograph was used to determine the type and content of gaseous products, and its detector type was a thermal conductivity detector (TCD). The chromatographic segments were HP-PLOT/Q (30 m × 0.53 mm × 0.05 mm) for the partition of CO2, C2H4 and C2H6 and HP-MOLESIEVE (30 m × 0.53 mm × 0.05 mm) for the detachment of H2, CO, N2 and CH4. Argon gas at a flow rate of 4 mL/min was used as the carrier gas. Argon gas at a flow rate of 4 mL/min was used as the carrier gas. The instrument needed to be held at 50 °C for 5 min; afterward, it was heated to 150 °C with the 20 °C/min heating rate and held for 6 min.
Thermo Trace DSQ GC-MS (USA) was used to determine the type and content of liquid products. The chromatographic column was a DB-17MS column (30 m × 0.25 mm × 0.25 μm). GC-MS operated under the following conditions: helium (99.999%) at a flow rate of 1.0 mL/min as the carrier gas; the oven was initially set at 40 °C and held for 3 min, then heated to 300 °C at 20 °C/min and held at 300 °C for 10 min (ion source: EI, ionization energy: 70 eV, ion source temperature: 200 °C). National Institute of Standards and Testing (NIST) 2011 mass spectrometry library was used to determine the compound types of WCO-Biodiesel liquid products. The relative contents of the different compounds can be obtained by the area normalization method based on GC-MS data.
Quanta FEG 250 scanning electron microscope (SEM) analyzer (USA) was used to analyze the microscopic morphology of coke products. Renishaw inVia Raman spectrometer (UK) was used to analyze the chemical structure of coke. The spectra with a resolution of 1 cm−1 were scanned for samples from 800 to 2000 cm−1 with a scan time of 15 s per sample.

2.3. Yield of Pyrolysis Products

The yields of coke and liquid products were obtained by the growth of the mass after experiments with quartz tubes and liquid product collectors. The gas products were obtained by mass balance. The equations for the three product yields are shown in Equations (1)–(3).
C o k e y i e l d ( w t / % ) = M a s s c o k e M a s s W C O Biodiesel × 100 %
L i q u i d y i e l d ( w t / % ) = M a s s L i q u i d M a s s W C O Biodiesel × 100 %
G a s y i e l d ( w t / % ) = 1 C o k e y i e l d ( w t / % ) L i q u i d y i e l d ( w t / % )
The yield of the different gases in the gas product can be calculated by the volume fraction of the different gases obtained by GC, with the equation shown in Equation (4).
Y i e l d g a s i = q N 2 X g a s i t X g a s N 2 m W C O Biodiesel
where i is the different gas compositions, Yieldgas-I is the yield of gas components, q N 2 is the flow rate of N2 ( q N 2 = 10 mL/min), X g a s i is the percentage of content for different gases, X g a s N 2 is the percentage of content for N2, and t is the sampling time.

2.4. Kinetic Triplet and Thermodynamics

The kinetic equation for the non-isothermal thermal solution is derived from the Arrhenius equation as [20,21,22,23]:
d α d T = A β exp ( E α R T ) f ( α )
where α is the conversion rate, T is the absolute temperature (K), A is the pre-exponential factor (s−1), β is the heating rate, Eα is the apparent activation energy (J·mol−1), R is the universal gas constants (8.314 J·mol−1·K−1), and f(α) is the reaction mechanism.
α = m 0 m t m 0 m f
where m0 is the sample mass before the start of the experiment, mt is the remaining mass of the sample when the experimental time reaches t, mf is the mass of the residual sample at the end of the experiment.
If α = 0 α d α f ( α ) in Equation (5), then Equation (5) can be rewritten as Equation (7).
g ( α ) = 0 a d α f ( α ) = T 0 T A β exp ( E α R T ) d T
Equation (8) [22] is shown for the three iso-conversional methods used in this study.
STR:
l n ( β T 1.92 ) = l n ( A E α R g ( α ) ) E α R T
Equation (9) is the formula for calculating A [24].
A = β E α R T m 2 e x p ( E α R T m )
After determining the Eα for the pyrolysis of WCO-Biodiesel and CS and WCO-Biodiesel blends, the reaction mechanism of the pyrolysis process was determined by the master plots method. The equation is shown in Equation (10) [25].
Z ( α ) Z ( 0.5 ) = f ( α ) g ( α ) f ( 0.5 ) g ( 0.5 ) = ( T α T 0.5 ) 2 d α / d T ( d α / d T ) 0.5
where T0.5 is the temperature at α = 0.5, (/dT)0.5 is the reaction rate at α = 0.5, f(0.5) is the value of f(α) at α = 0.5, and g(0.5) is the value of the integral function g(α) of f(α) at α = 0.5. The common kinetic reaction models are shown in Table 2. The reaction mechanism of WCO-Biodiesel under the influence of CS was determined by comparing the curve of the theoretical model plotted on the left side of Equation (10) with the curve of the experimental data plotted on the right side of Equation (10).
Equations (11)–(13) show the thermodynamic parameters involved in this study [26].
Enthalpy change (ΔH):
Δ H = E α R T
Gibbs free energy (ΔG):
Δ G = E α + R T m l n ( K B T m h A )
Entropy change (ΔS):
Δ S = Δ H Δ G T m
where KB is the Boltzmann’s constant (1.381 × 10⁻²³ J/K) and h is the Planck’s constant (6.626 × 10⁻³⁴ J·s−1).

3. Results and Discussion

3.1. Physicochemical Properties of WCO-Biodiesel

Table 3 shows the elemental analysis, proximate analysis and fatty acid analysis of WCO-Biodiesel. According to the elemental analysis, the contents of the four elements in WCO-Biodiesel are 70.26 wt% for C, 11.26 wt% for H, 17.60 wt% for O and 0.87 wt% for N. The content of O influences the HHV for evaluating the properties of WCO-Biodiesel fuel. A previous study [27] showed that both C-O and C-H single bonds contain less energy than C-C single bonds. Therefore, according to the elemental analysis, low O/C and H/C values of fuel give rise to a low HHV of fuel. As can be seen from Table 3, the O/C and H/C of WCO-Biodiesel are 0.25 and 0.16, and the HHV is 36.97 MJ·kg−1. The approximate analysis of WCO-Biodiesel showed that the content of fixed carbon is only 0.09 wt%, the ash content is 0 wt%, and the content of volatile fraction is as high as 99.91 wt%. The higher HHV and volatile matter content indicate that the pyrolysis of WCO-biodiesel will generate more available energy. Fatty acid composition shows that the main components of WCO-Biodiesel are palmitic acid, oleic acid, linoleic acid and linolenic acid with 23.70, 42.27, 29.37 and 2.32 wt%, respectively. Unlike those large molecular triglycerides, WCO-Biodiesel is composed of various fatty acid methyl esters [28].

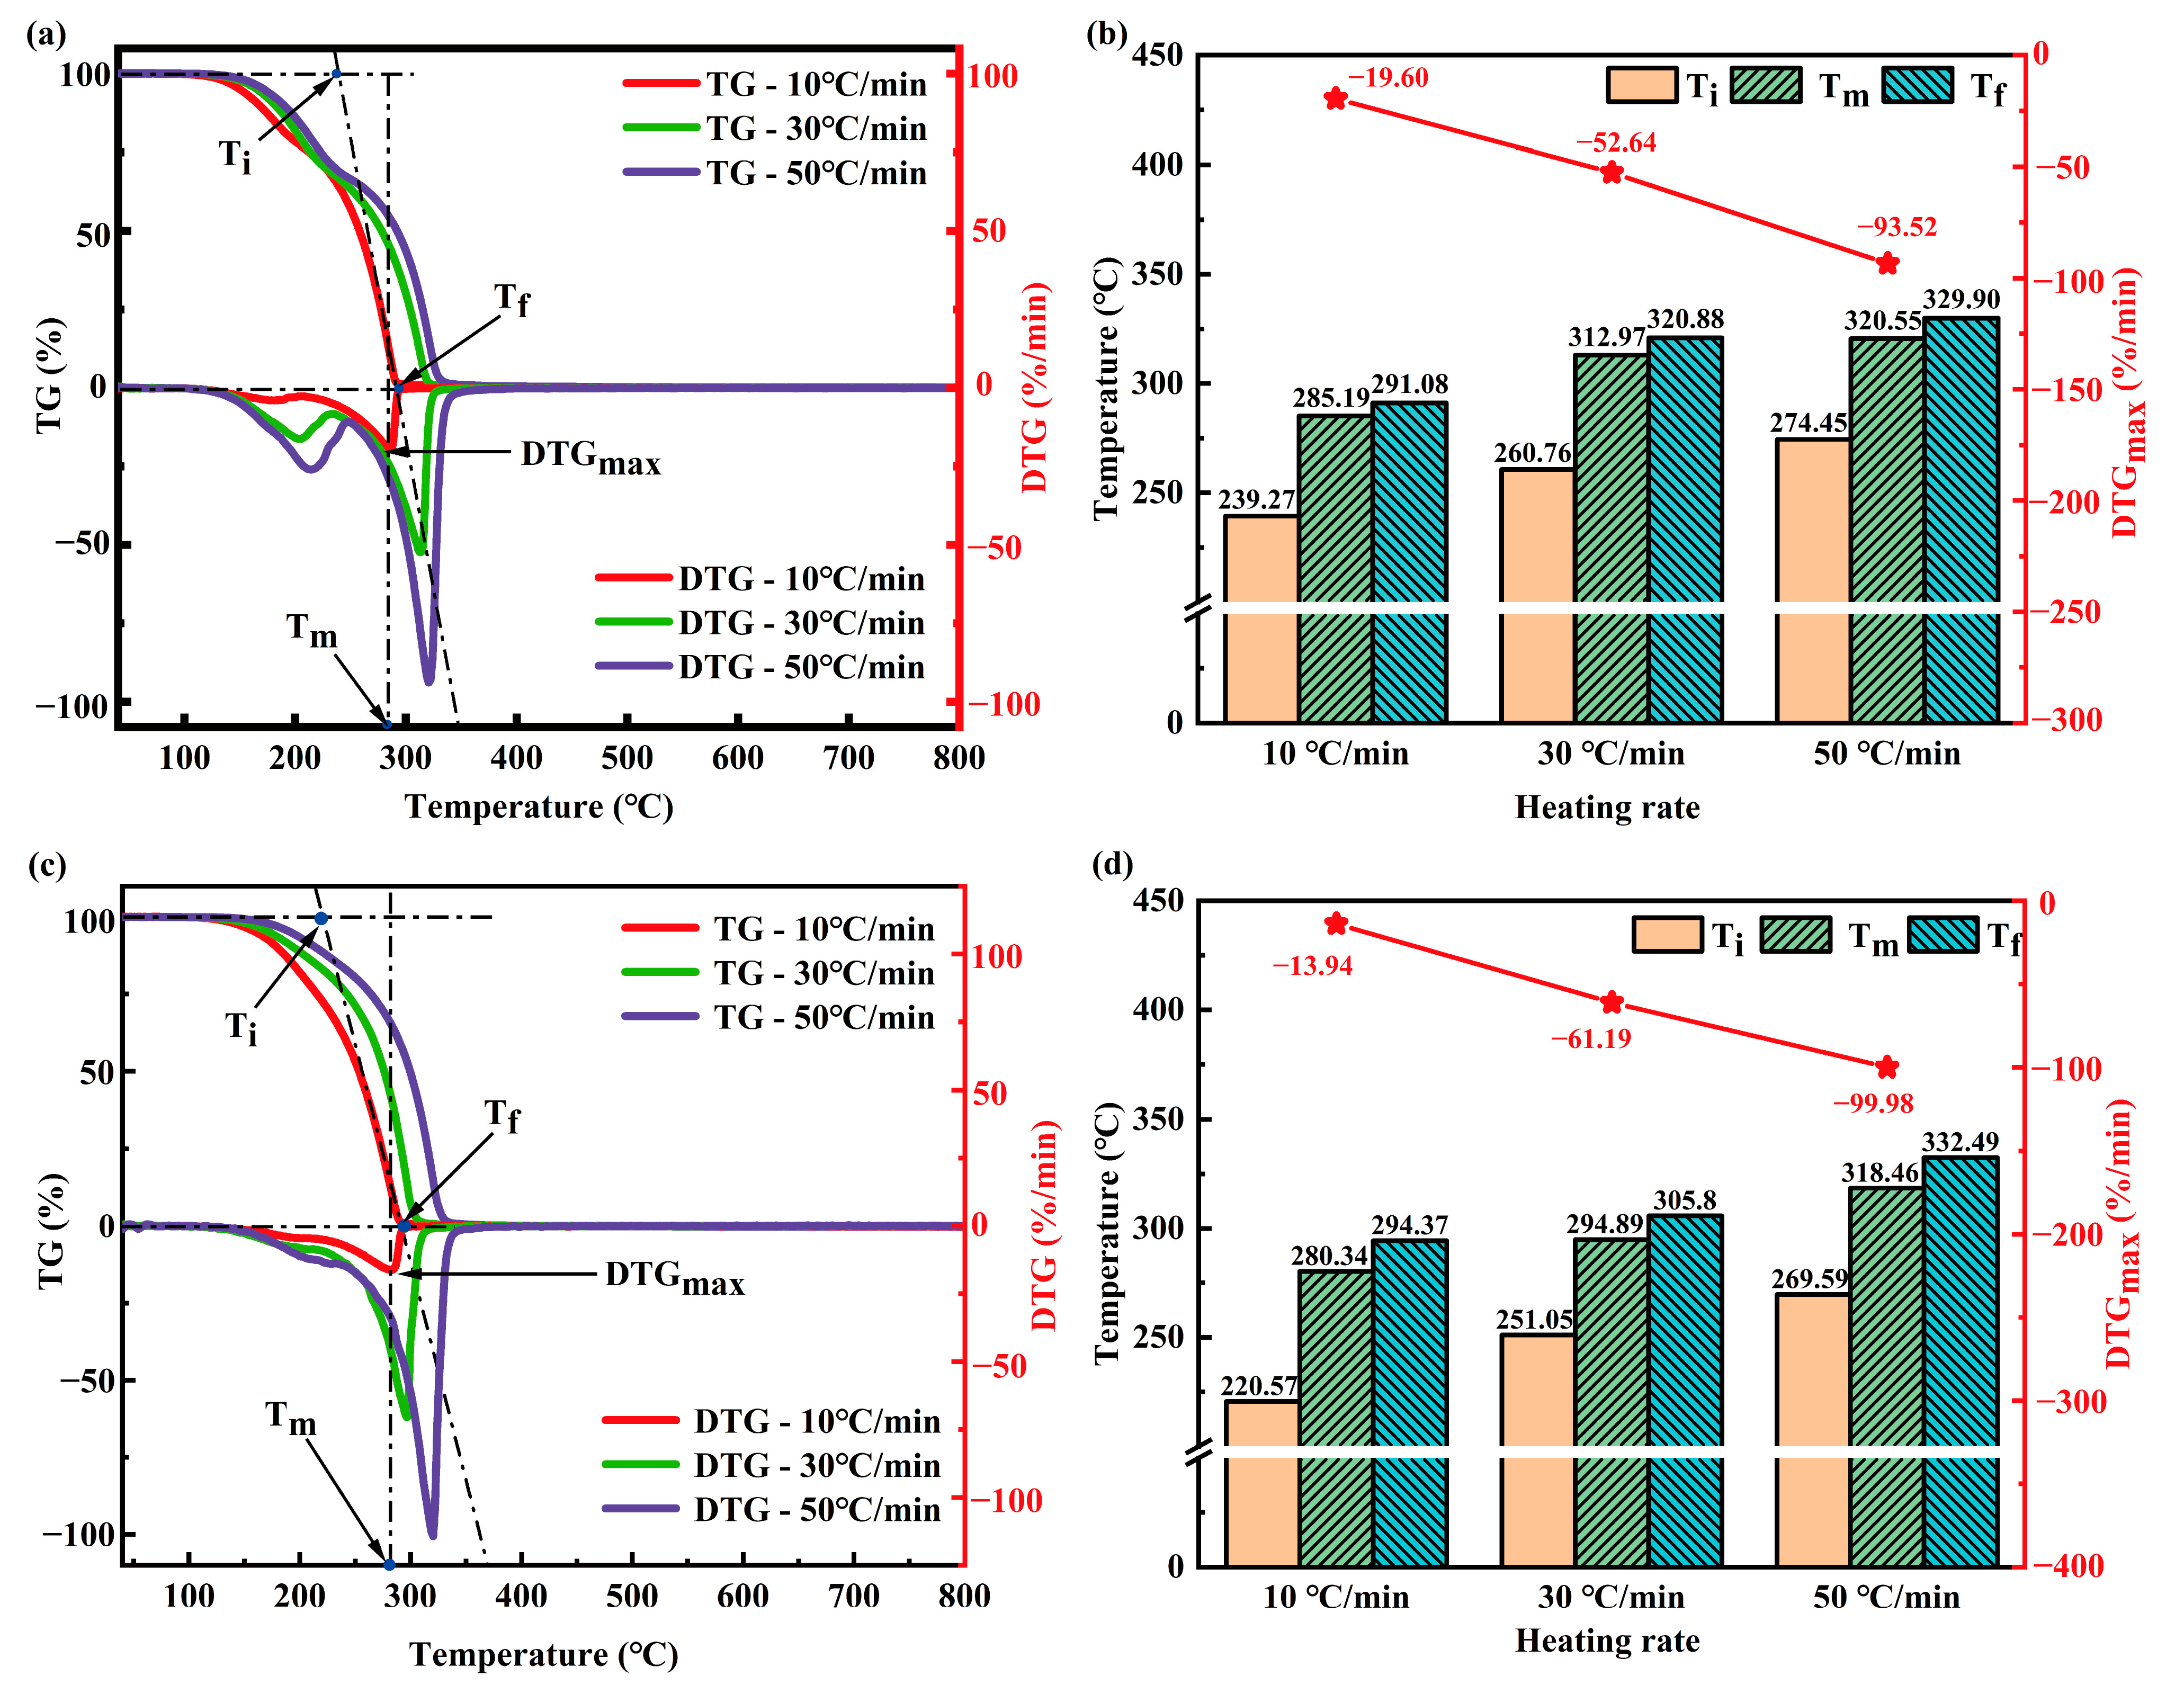
3.2. Thermal Decomposition Properties

Figure 3a,c shows the TG and DTG curves of WCO-Biodiesel and blends of WCO-Biodiesel with CS at different heating rates. The trends of TG and DTG curves are similar for these three different heating rates, with two peaks in the DTG curves. As the heating rate increased, the TG and DTG curves shifted toward higher temperature intervals, and the peaks of the DTG curve increased. The first stage of pyrolysis shows a small shoulder peak on the DTG curves (150–250 °C), which is due to the fact that WCO-Biodiesel is obtained by the methyl esterification of the feedstock, so a large number of lighter components are removed at this stage [29]. The mass of WCO-Biodiesel decreases a lot in the second stage (250–350 °C), and the mass loss rate of WCO-Biodiesel reaches the maximum in this stage. In this stage, WCO-Biodiesel decomposes rapidly, the mass decreases rapidly, and volatile components are generated in large quantities in this stage. Since the volatile matter is depleted in the second stage and what remains is mainly carbonaceous carbon, it does not decompose further in the third stage (>350 °C) [30]. It can be seen that the shoulder peak of the first stage of WCO-Biodiesel pyrolysis is reduced due to the effect of CS, which indicates that the presence of CS makes the WCO-Biodiesel pyrolysis more efficient [31].
In Figure 3b,d, Ti, Tm, Tf and DTGmax are the four characteristic parameters of WCO-Biodiesel pyrolysis under the influence of CS. All the characteristics parameters of WCO-Biodiesel pyrolysis increase with the heating rate. Ti, Tm and Tf are the temperatures corresponding to the beginning of WCO-Biodiesel pyrolysis, the temperature at which the mass loss rate of WCO-Biodiesel is maximum and the temperature at the end of WCO-Biodiesel pyrolysis. Ti, Tm, Tf and DTGmax increased from 220.57 to 269.59 °C, 280.34 to 318.46 °C, 294.37 to 332.49 °C and 19.34 to 99.98%/min as the heating rate increased from 10 to 50 °C/min. Under the influence of CS, Ti, Tm, Tf and DTGmax increased from 239.87 to 274.45 °C, 285.19 to 320.55 °C, 291.08 to 329.90 °C and 19.60 to 93.52%/min, respectively. Other researchers found the same phenomenon in the thermogravimetric analysis of sewage sludge [32] and another biomass [33]. The shift in Ti, Tm and Tf with increasing heating rates is due to thermal hysteresis and heat transfer limitation, and the peaks at high heating rates are higher than those at low heating rates, indicating that high heating rates contribute to the pyrolysis reaction [34]. Increased DTGmax indicates that the rate of temperature increase plays an auxiliary role in the WCO-Biodiesel pyrolysis process [21]. The presence of CS shifts the peak of the DTG curve slightly to the left, indicating a slight decrease in the temperature of the WCO-Biodiesel thermal degradation process due to the influence of CS [31].

3.3. Kinetic Triplet and Thermodynamics

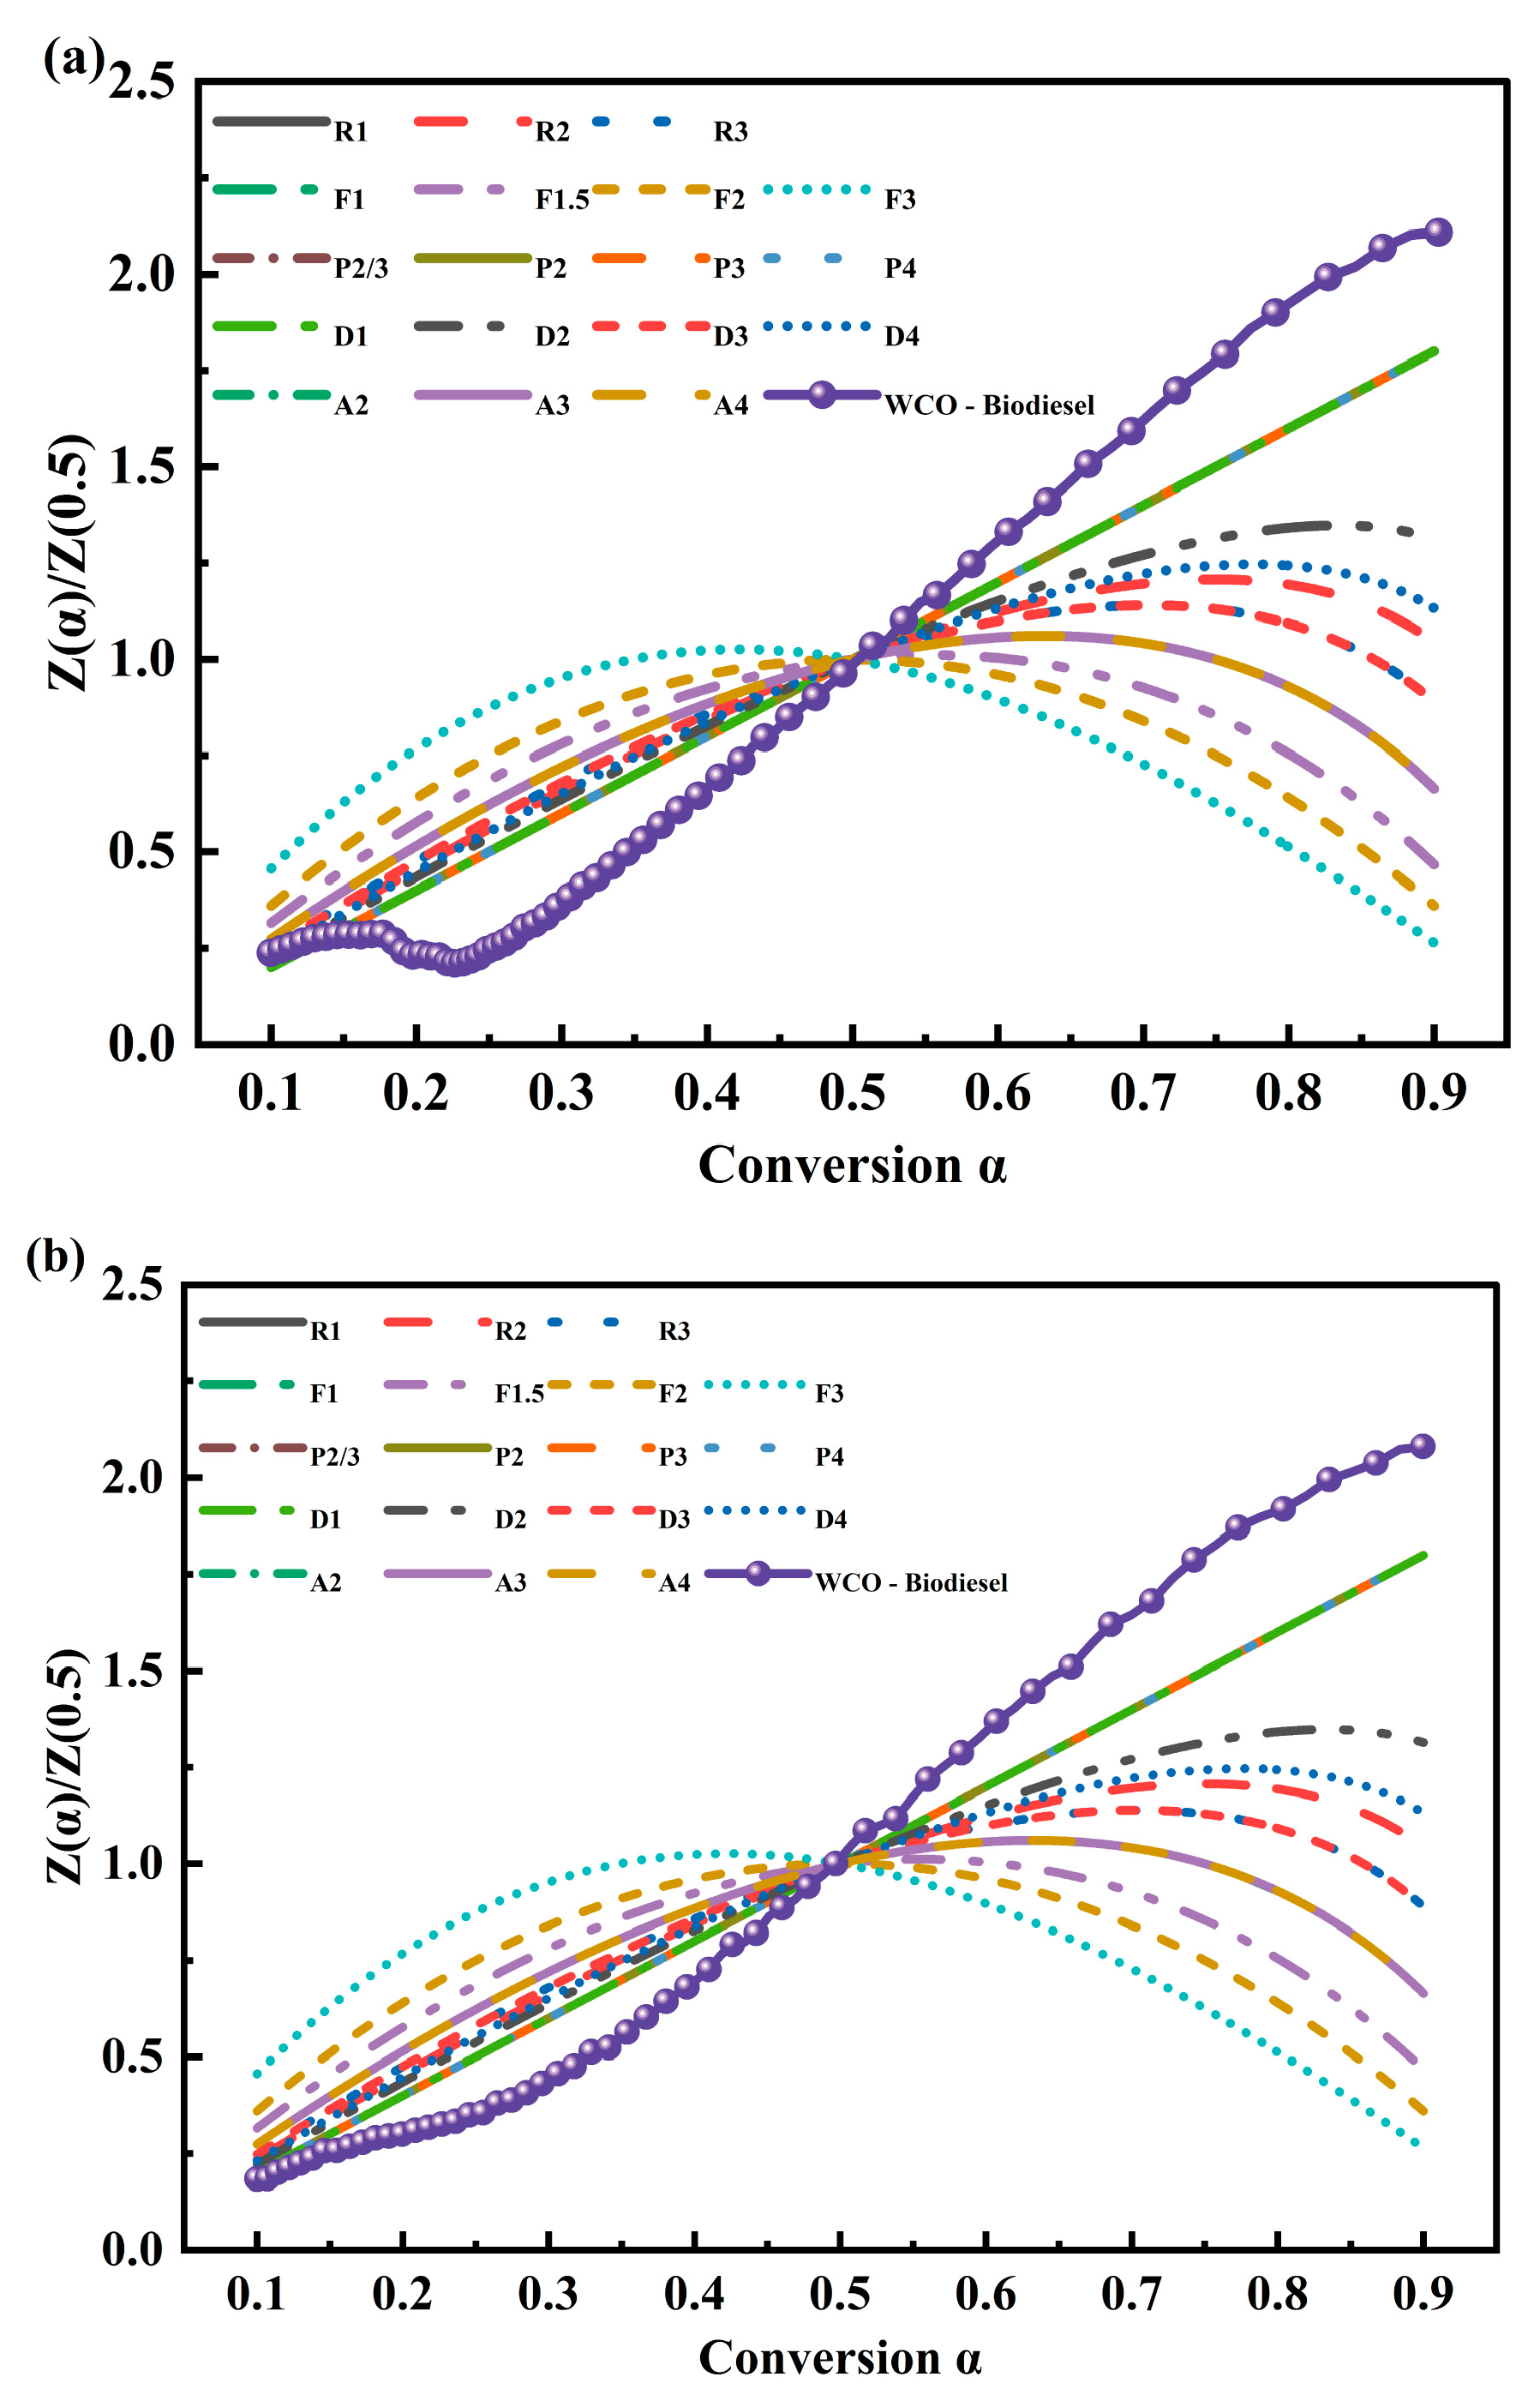
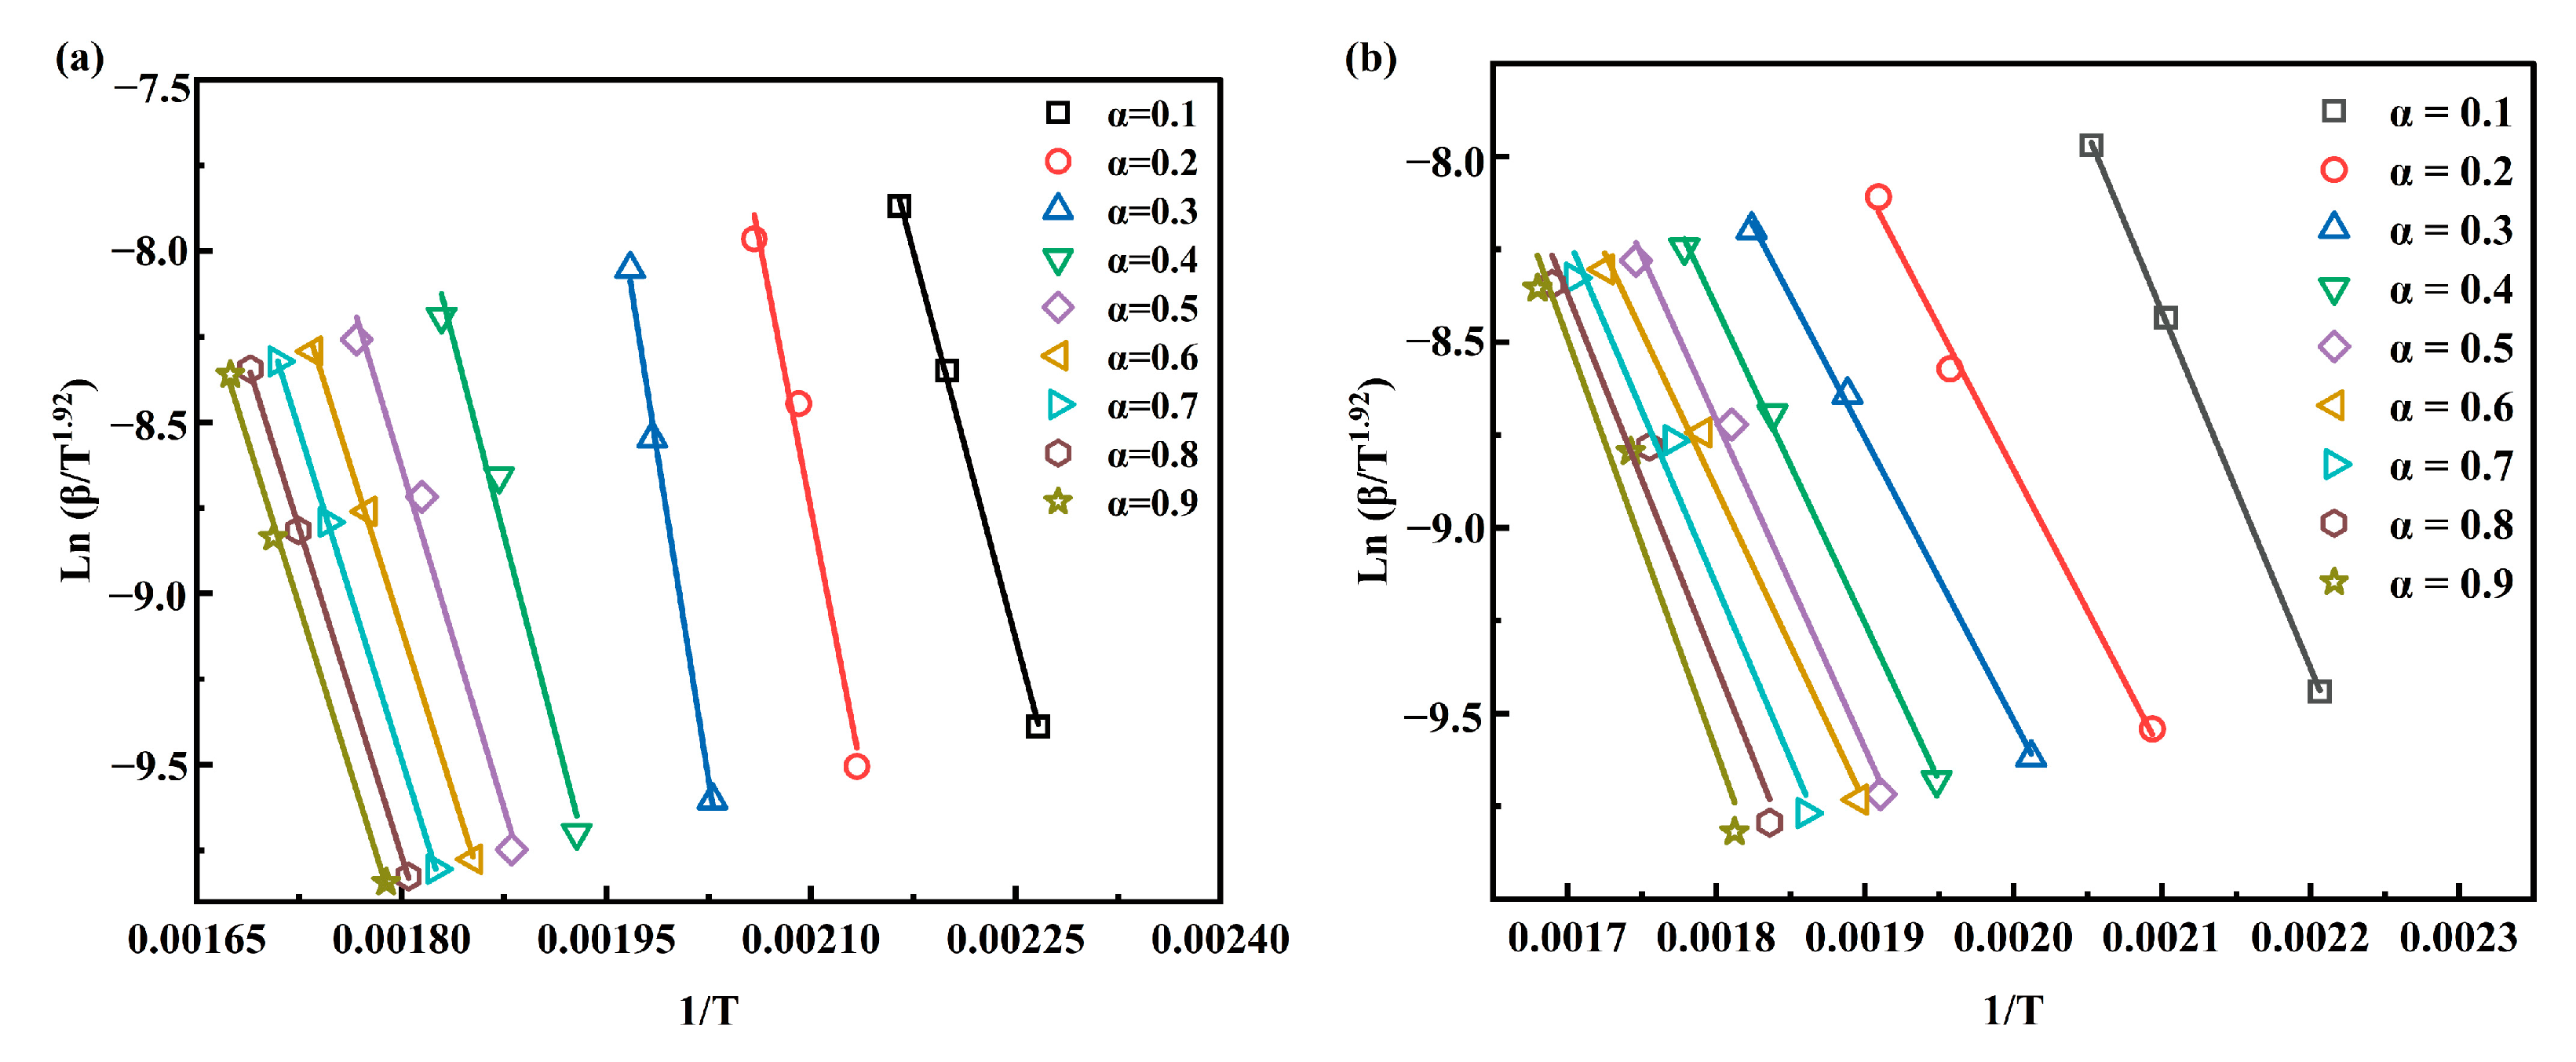
3.3.1. Kinetic Triplet

After analyzing the thermogravimetric results, the pyrolysis kinetics of pure WCO-Biodiesel and blends of WCO-Biodiesel with CS are studied using the iso-conversional method. Figure 4 shows the fitted plots obtained by these three iso-conversional methods, and Table 4 shows the pyrolysis kinetic parameters. Table 4 shows that the correlation coefficients R2 obtained by STR are all greater than 0.9, which proves that the calculated results are reliable. The Eα ranges of WCO-Biodiesel obtained using STR is 105.62–210.87 kJ/mol. The Eα ranges of WCO-Biodiesel obtained with STR under the influence of CS are 63.21–92.34 kJ/mol. The Eα is the energy threshold that must be overcome to form other substances through chemical reactions [21]. The results show that CS influences Eα during the pyrolysis of WCO-Biodiesel. Other researchers in the study of co-pyrolysis of municipal sewage sludge and CS have similarly found that the Eα during pyrolysis can be effectively reduced due to the presence of CS [35]. This situation arises because the presence of a large number of metal oxides in CS catalyzes the pyrolysis of organic substances [35].
The A represents the pyrolysis control mechanism of WCO-Biodiesel, which is a constant related only to the reaction properties. When A < 10−9 s−1, the pyrolysis process is related to the surface area, and when A ≥ 10−9 s−1, the pyrolysis process is unrelated to the surface area [23]. With the use of STR, the calculated values of A range from 3.10 × 10⁹ to 4.36 × 10¹⁹ s−1. The A values calculated by STR are greater than 10−9, which implies that the pyrolysis of WCO-Biodiesel is a complex process not controlled by the surface. The average values of A calculated with STR for the WCO-Biodiesel pyrolysis process under the influence of CS are reduced to 2.60 × 10⁷ s−1. The decrease in the A value indicates that the collision rate of molecules is reduced under the influence of CS, and less energy is required for the reaction [35].
The experimental data curve and theoretical curves of 18 different mechanistic models in Table 2 are shown in Figure 5. The mechanism of the WCO-Biodiesel pyrolysis reaction is determined by fitting the plot with the master plots method shown in Figure 5. The trend of the WCO-Biodiesel pyrolysis process with increasing α is inferred by the master plots method to follow the D1, Pn model. Almazrouei et al. [29] analyzed the mechanism of pure glycerol pyrolysis using the master plots method, in which the pure glycerol was also found to follow the Pn, D1 reaction mechanism model. It can be seen from Figure 5 that the pyrolysis mechanism of WCO-Biodiesel has not changed significantly due to the effect of CS, and the trend of the reaction mechanism with α remained similar to that of the Pn and D1 models. Since the 18 theoretical models chosen cannot describe the whole pyrolysis process well, the empirical model proposed by Šesták and Berggren [36] was chosen to determine the reaction mechanism functions for the pyrolysis of pure WCO-Biodiesel and WCO-Biodiesel under the influence of CS. During kinetic calculations, the SB (m, n, p) model can be highly flexible to accommodate various types of rate behavior. The truncated form of the B model, SB (m, n), is equally useful as an empirical model [37]. The equation of the empirical model is shown in Equation (14).
f ( a ) = a m ( 1 a ) n [ l n ( 1 a ) ] p
where m is the reaction order, n is the diffusion–reaction mechanisms, and p is the nucleation reaction mechanisms.
The mechanism function of pure WCO-Biodiesel pyrolysis reaction calculated from the empirical model is shown in Equation (15), and the mechanism function of WCO-Biodiesel pyrolysis reaction under the influence of CS is shown in Equation (16). m < 1 indicates that the reaction order has little effect on WCO-Biodiesel pyrolysis, and n > 1 indicates that the diffusion–reaction mechanism is the main reaction mechanism of WCO-Biodiesel pyrolysis [31]. The higher order of n and p indicates the influence of diffusion and nucleation mechanisms on pyrolysis, with the influence of CS decreasing the influence of diffusion and nucleation mechanisms in the pyrolysis process [38]. The order of n and p in the reaction mechanism function of the catalytic pyrolysis process becomes smaller, indicating that the diffusion and nucleation mechanisms in the catalytic pyrolysis process become less influential on the pyrolysis process. In general, m < n < p indicates that both non-catalytic and catalytic pyrolysis reactions are mainly controlled by the nucleation mechanism.
f 1 ( a ) = a 7.328 ( 1 a ) 3.048 [ l n ( 1 a ) ] 8.321
f 2 ( a ) = a 7.208 ( 1 a ) 2.967 [ l n ( 1 a ) ] 8.090

3.3.2. Thermodynamics

The ΔH, ΔG and ΔS listed in Table 5 are the thermodynamic parameters of WCO-Biodiesel pyrolysis at a heating rate of 50 °C/min studied in this work. ΔH denotes the heat to be absorbed or released by the pyrolysis of WCO-Biodiesel under the influence of CS. The calculated average value of ΔH using STR is 125.86 kJ/mol. ΔH > 0 indicates that the pyrolysis process is a heat absorption reaction. There is a small difference in the average values of Eα and ΔH, which is consistent with the results of other bioenergy sources [39] and favors the formation of products [40]. The average value of ΔH for the pyrolysis process of WCO-biodiesel under the influence of CS calculated using STR is 70.68 kJ/mol. It can be seen that the value of ΔH is effectively reduced when the pyrolysis of WCO-Biodiesel is influenced by CS. This indicates that less energy is required when the pyrolysis of WCO-Biodiesel is affected by CS. The calculated average value of ΔG using STR is 144.06 kJ/mol.
ΔG denotes the available energy value after WCO-Biodiesel pyrolysis [21]. The values of both ΔH and ΔG are greater than 0, indicating that the pyrolysis of WCO-Biodiesel is a non-spontaneous reaction process [31]. ΔS is an indicator to determine whether the pyrolysis system is disordered in the pyrolysis process [21]. The range of ΔS values calculated according to the STR method is −76.46–118.49 J/mol⋅K. ΔS has both negative and positive values at different α, indicating the complexity of the pyrolysis process of WCO-Biodiesel. Similar phenomena have been found in the studies of others [24,40]. The decrease in the value of ΔS under the influence of CS indicates that more volatile products are generated, reducing the disorderly nature of the reaction.

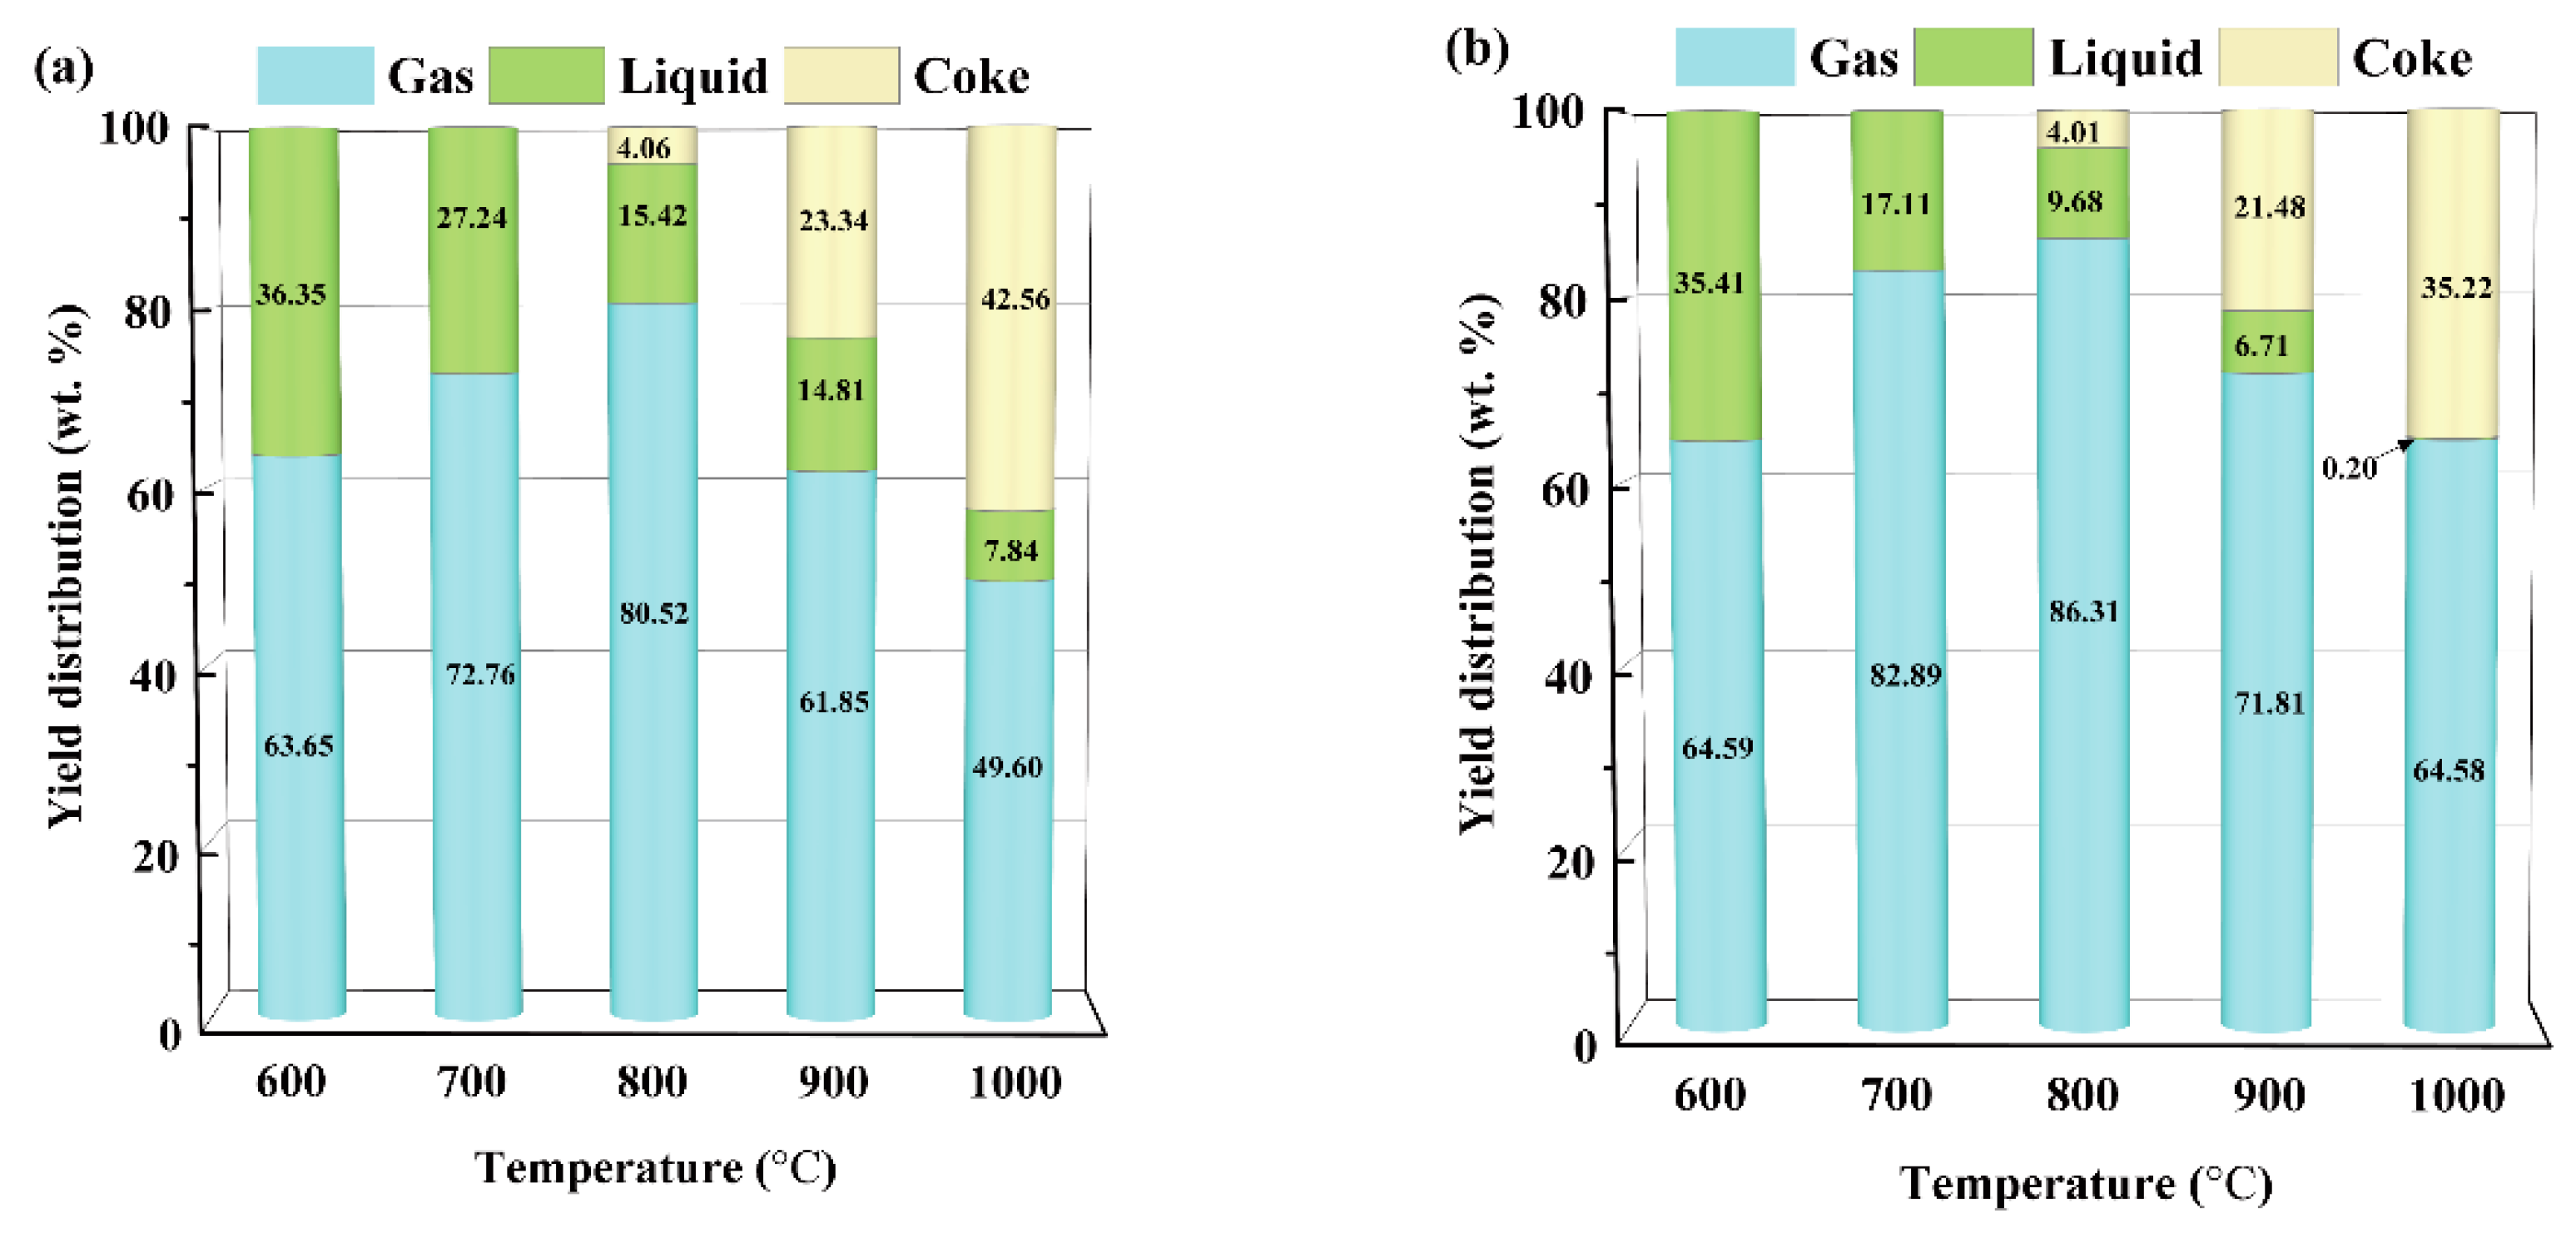
3.4. Distribution of Pyrolysis Products

Figure 6a,b shows the distribution of gas, liquid and coke yields for pure WCO-Biodiesel and WCO-Biodiesel under the influence of CS at 600, 700, 800, 900 and 1000 °C. It can be seen from Figure 6a that the yield of the liquid product decreases from 36.35% to 7.84% as the temperature increases from 600°C to 1000°C. The highest yield of gaseous product was reached at 800 °C with 86.31%. The highest yield of coke product was reached at 1000 °C with 35.22%. It is important to note that there is no coke formation at 600 °C and 700 °C. There is only unformed coke formation in the tube wall at 800 °C. There are two kinds of coke formation at 1000 °C, quartz tube wall coke (QTW-Coke) and quartz wool surface coke (QCS-Coke). However, only QTW-Coke is formed at 900 °C. From Table 2, it is known that CS contains components consisting of Fe, Cu, Al, Ca, Mg and Zn, all of which have a facilitative effect on the pyrolysis of WCO-Biodiesel [41,42,43]. The effect of CS on WCO-biodiesel pyrolysis products at different temperatures can be seen in Figure 6b. CS all catalyzed the pyrolysis of WCO-Biodiesel at 600–1000 °C, and the effect became more obvious with the increase in temperature. Different elements in CS can have different effects on the pyrolysis of WCO-Biodiesel. For Fe, the breakage of C-C, C=C and C-H bonds in the presence of Fe would be simpler. For Mg, Cu and Zn, Mg has a facilitating effect on the gasification of water-soluble organic matter, and the combined effect of Cu and Zn promotes the breaking of C-O and C-H bonds in WCO-Biodiesel. Therefore, more gases are generated in the WCO-Biodiesel pyrolysis process due to the influence of CS. In the process of WCO-Biodiesel as a fuel for copper smelting, pyrolysis gas can be directly involved in copper smelting. The yield of both liquid and solid products of WCO-Biodiesel pyrolysis is decreased under the influence of CS, with only 0.2% of liquid yield and 35.22% of coke yield at 1000 °C. The effect of catalytic gasification becomes more obvious with the increase in temperature, and the growth rate of gas products reaches up to 14.98% at 1000 °C.

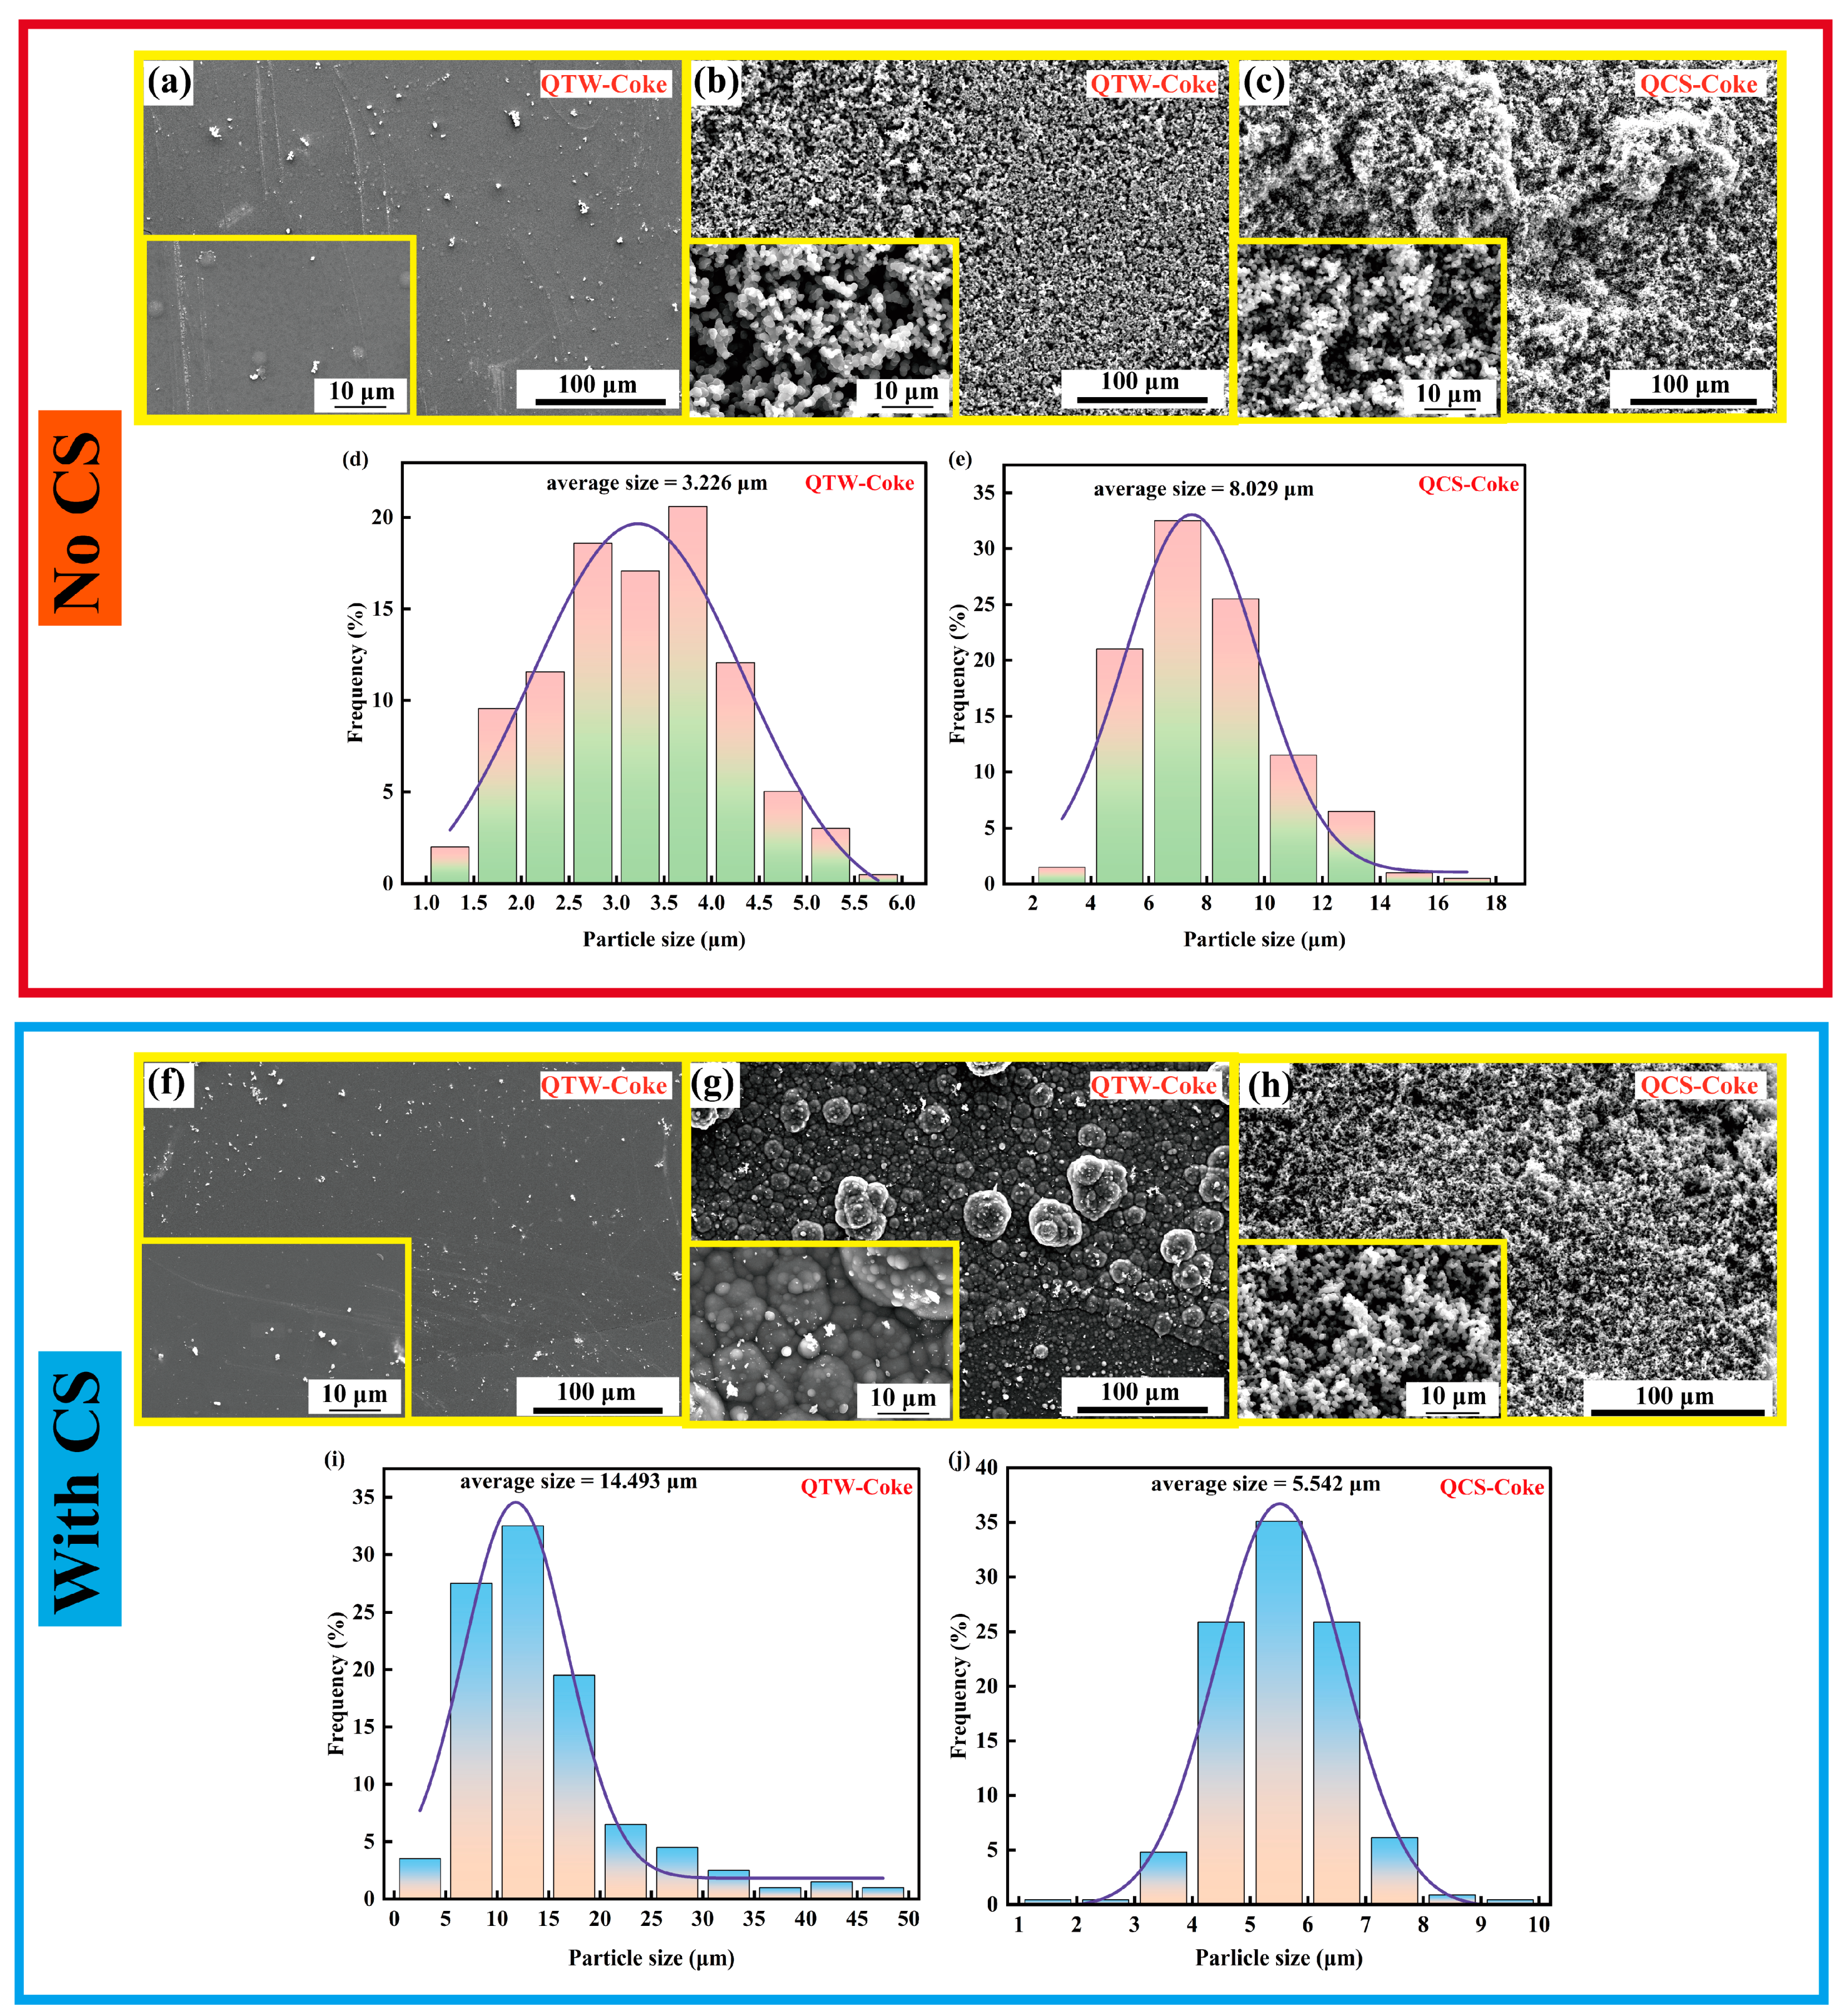
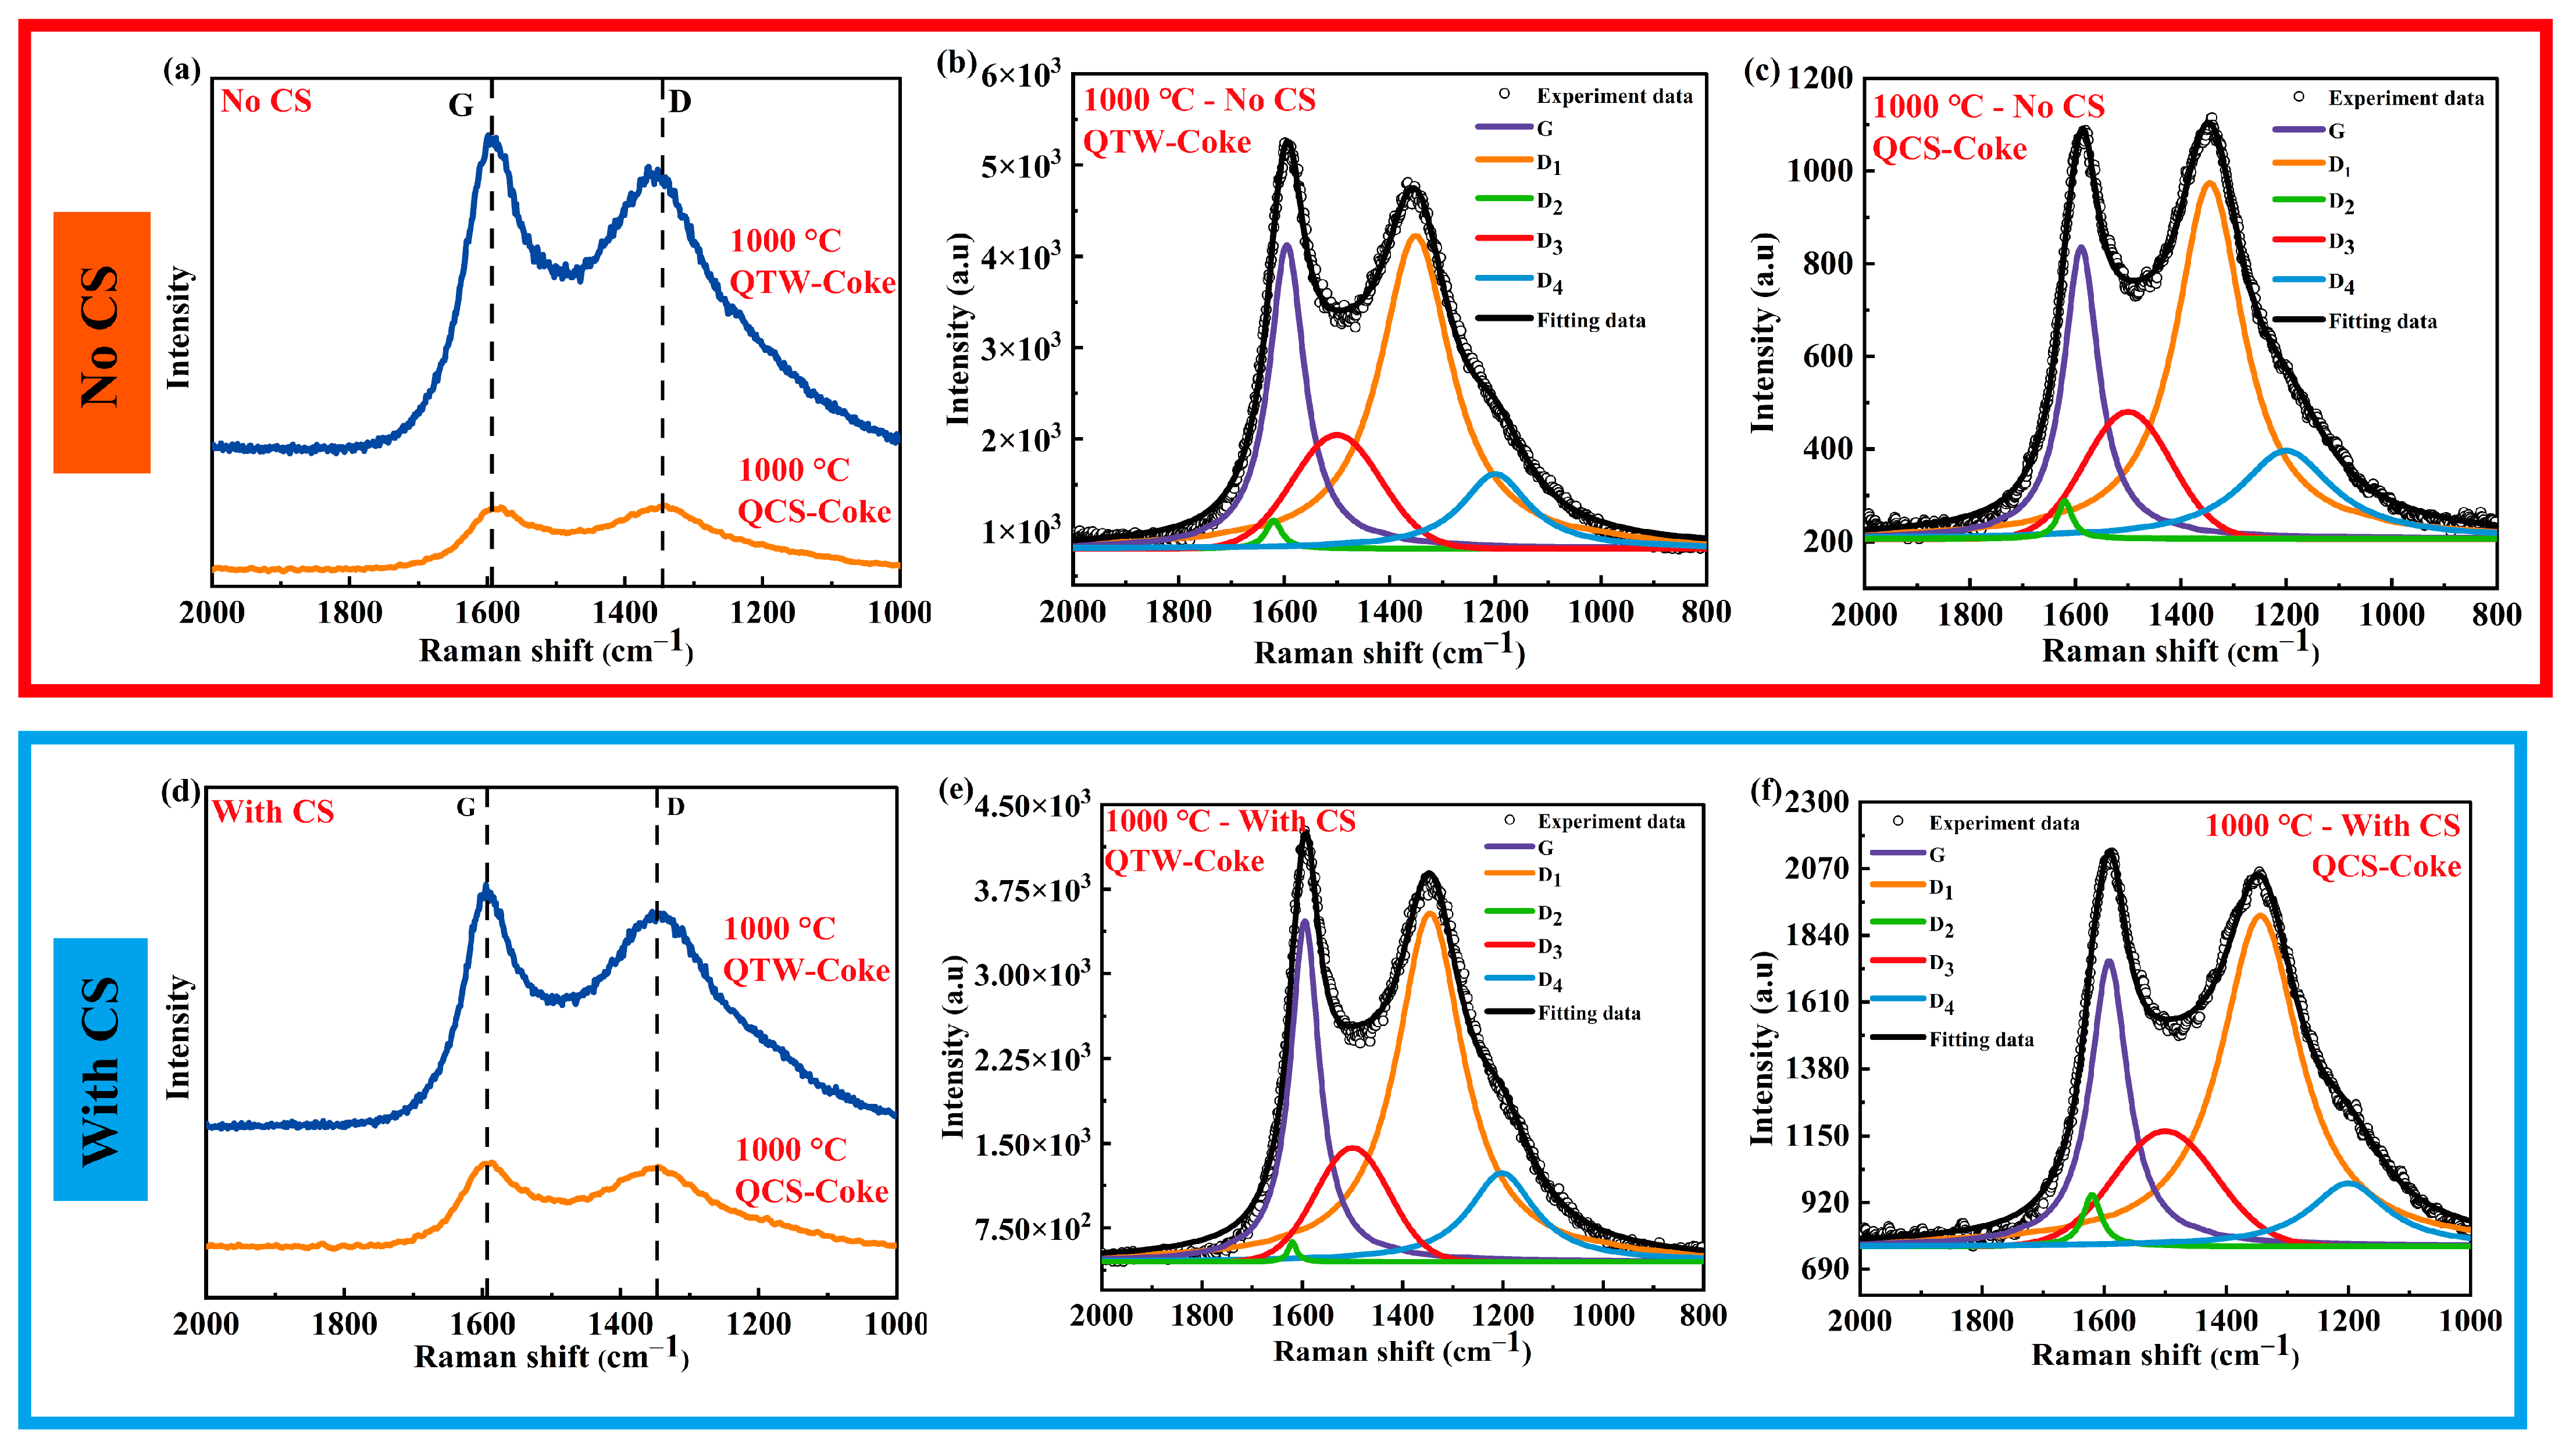
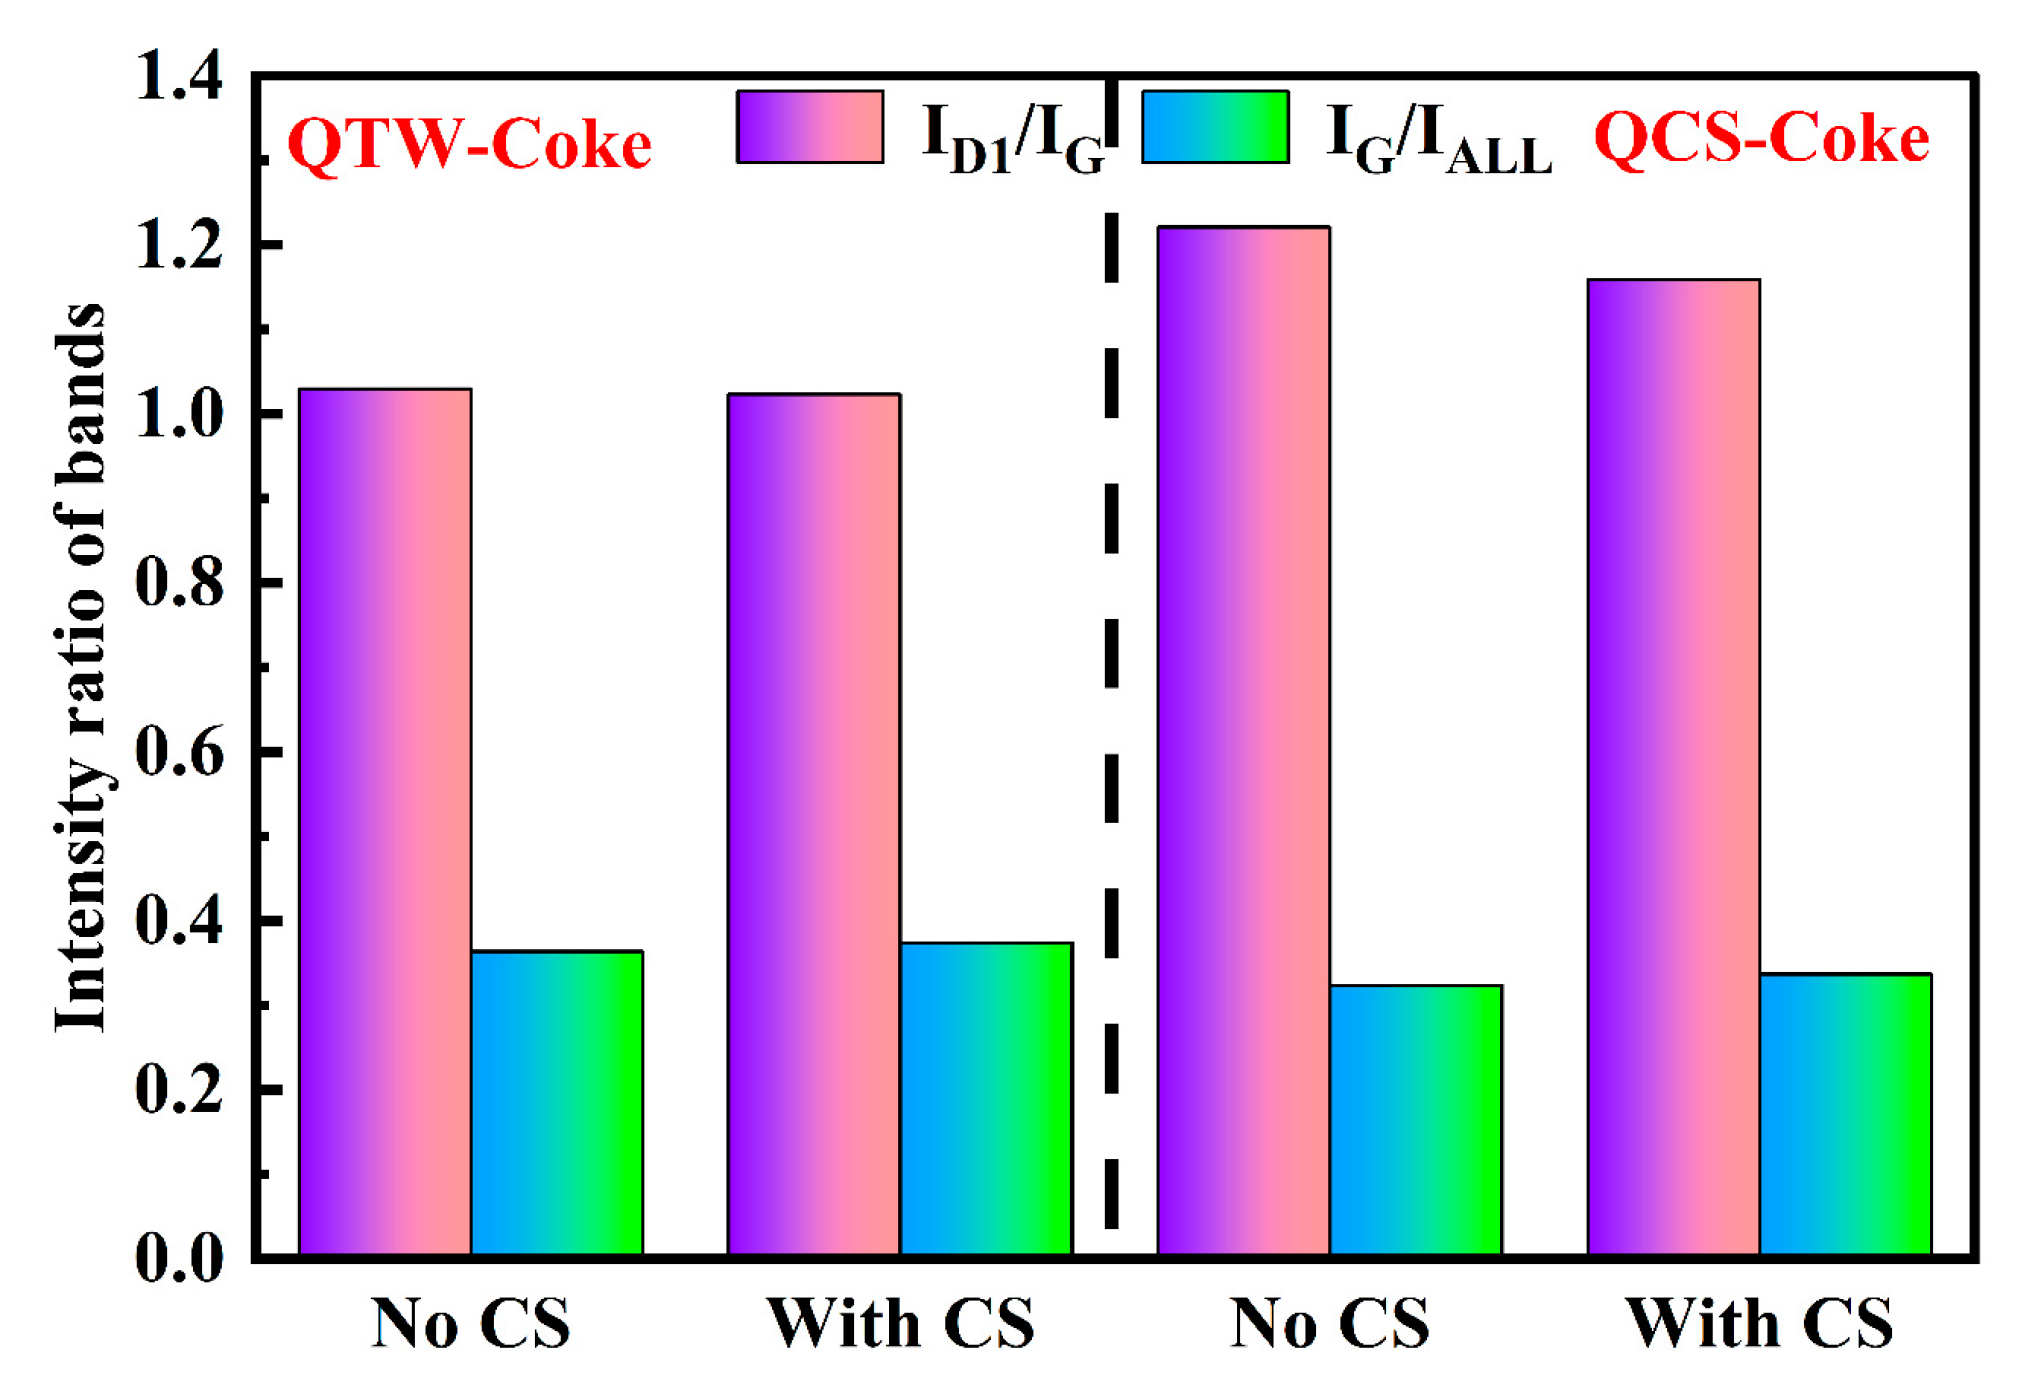
3.5. Characterization of Coke

The SEM images of QTW-Coke and QCS-Coke at 1000 °C and the size distribution of spherical carbon particles are shown in Figure 7. The microscopic morphologies of QTW-Coke and QCS-Coke show great differences. The outer surface (Figure 7a,f) and the inner surface (Figure 7b,g) of QTW-Coke show two completely different morphologies. The outer surface shows a smooth morphology, while the inner surface shows a rough morphology due to the coverage of carbon particles. The outer surface (Figure 7a,f) and the inner surface (Figure 7b,g) of QTW-Coke show two completely different morphologies. The outer surface shows a smooth morphology, while the inner surface shows a rough morphology due to the coverage of carbon particles. QCS-Coke is formed by the accumulation of numerous carbon particles, and its microscopic morphology appears coral-like. In the presence of CS, the average size of QTW-Coke particle size increased from 3.226 μm to 14.493 μm due to the formation of more polycyclic aromatic hydrocarbons and, thus, larger carbon particles catalyzed by CS [43]. The average size of QTW-Coke particles decreased from 8.029 μm to 5.542 μm. This is due to the slow consumption of coke as volatiles inevitably react with coke when reacting with the catalyst under the catalytic action of CS, resulting in a decrease in the particle size of coke [44].
Raman spectroscopy is a widely used method for characterizing structural and species information of coke-containing substances. In Figure 8a,d, two different peaks in the first-order Raman spectra are shown as D-band and G-band, respectively. Since the overlap between the D-band and G-band of disordered carbon materials hides a large amount of structural information, the D-band and G-band peaks alone cannot be considered [45]. Therefore, to obtain more detailed information about the coke structure, the first-order Raman spectra were deconvoluted into four Lorentz peaks and one Gaussian peak, according to Sadezky et al. [46]. The inverse fold accumulation of coke produced by pyrolysis of WCO-Biodiesel and blends of WCO-Biodiesel with CS at 900 °C and 1000 °C was performed, and the results are shown in Figure 8b,c,e,f. The G peak is assigned to the symmetric stretching vibration mode of E2g at the edge of the graphene layer [45]. The D1 peak is attributed to defects in the graphite crystal, such as the presence of amorphous carbon [47]. The D2 peak is attributed to the E2g vibration of the graphite surface layer [46]. The D3 peak corresponds to a wide distribution of carbon structures in the coke, such as non-planar defects, organic molecules, fragments or functional groups with sp2 bonds [48]. The D4 peak is associated with the sp2-sp3 or C-C and C=C bond vibrational modes of the polyene structure [46]. Figure 9 shows the intensity ratios of the D1 band to the G band and the G band to all bands. As can be seen in Figure 9, the value of ID1/IG increased, and IG/IAll decreased for QTW-Coke due to the influence of CS. While the value of ID1/IG for QCS-Coke decreased and the value of IG/IAll increased [45]. This is attributed to the fact that the defective condensed aromatic ring structure in QTW-Coke increases due to the effect of CS, thus leading to more disordered QTW-Coke. On the contrary, volatiles inevitably react with the coke due to the addition of CS. The condensed aromatic ring structure in the QCS-coke is reduced, resulting in a more ordered coke structure [44].

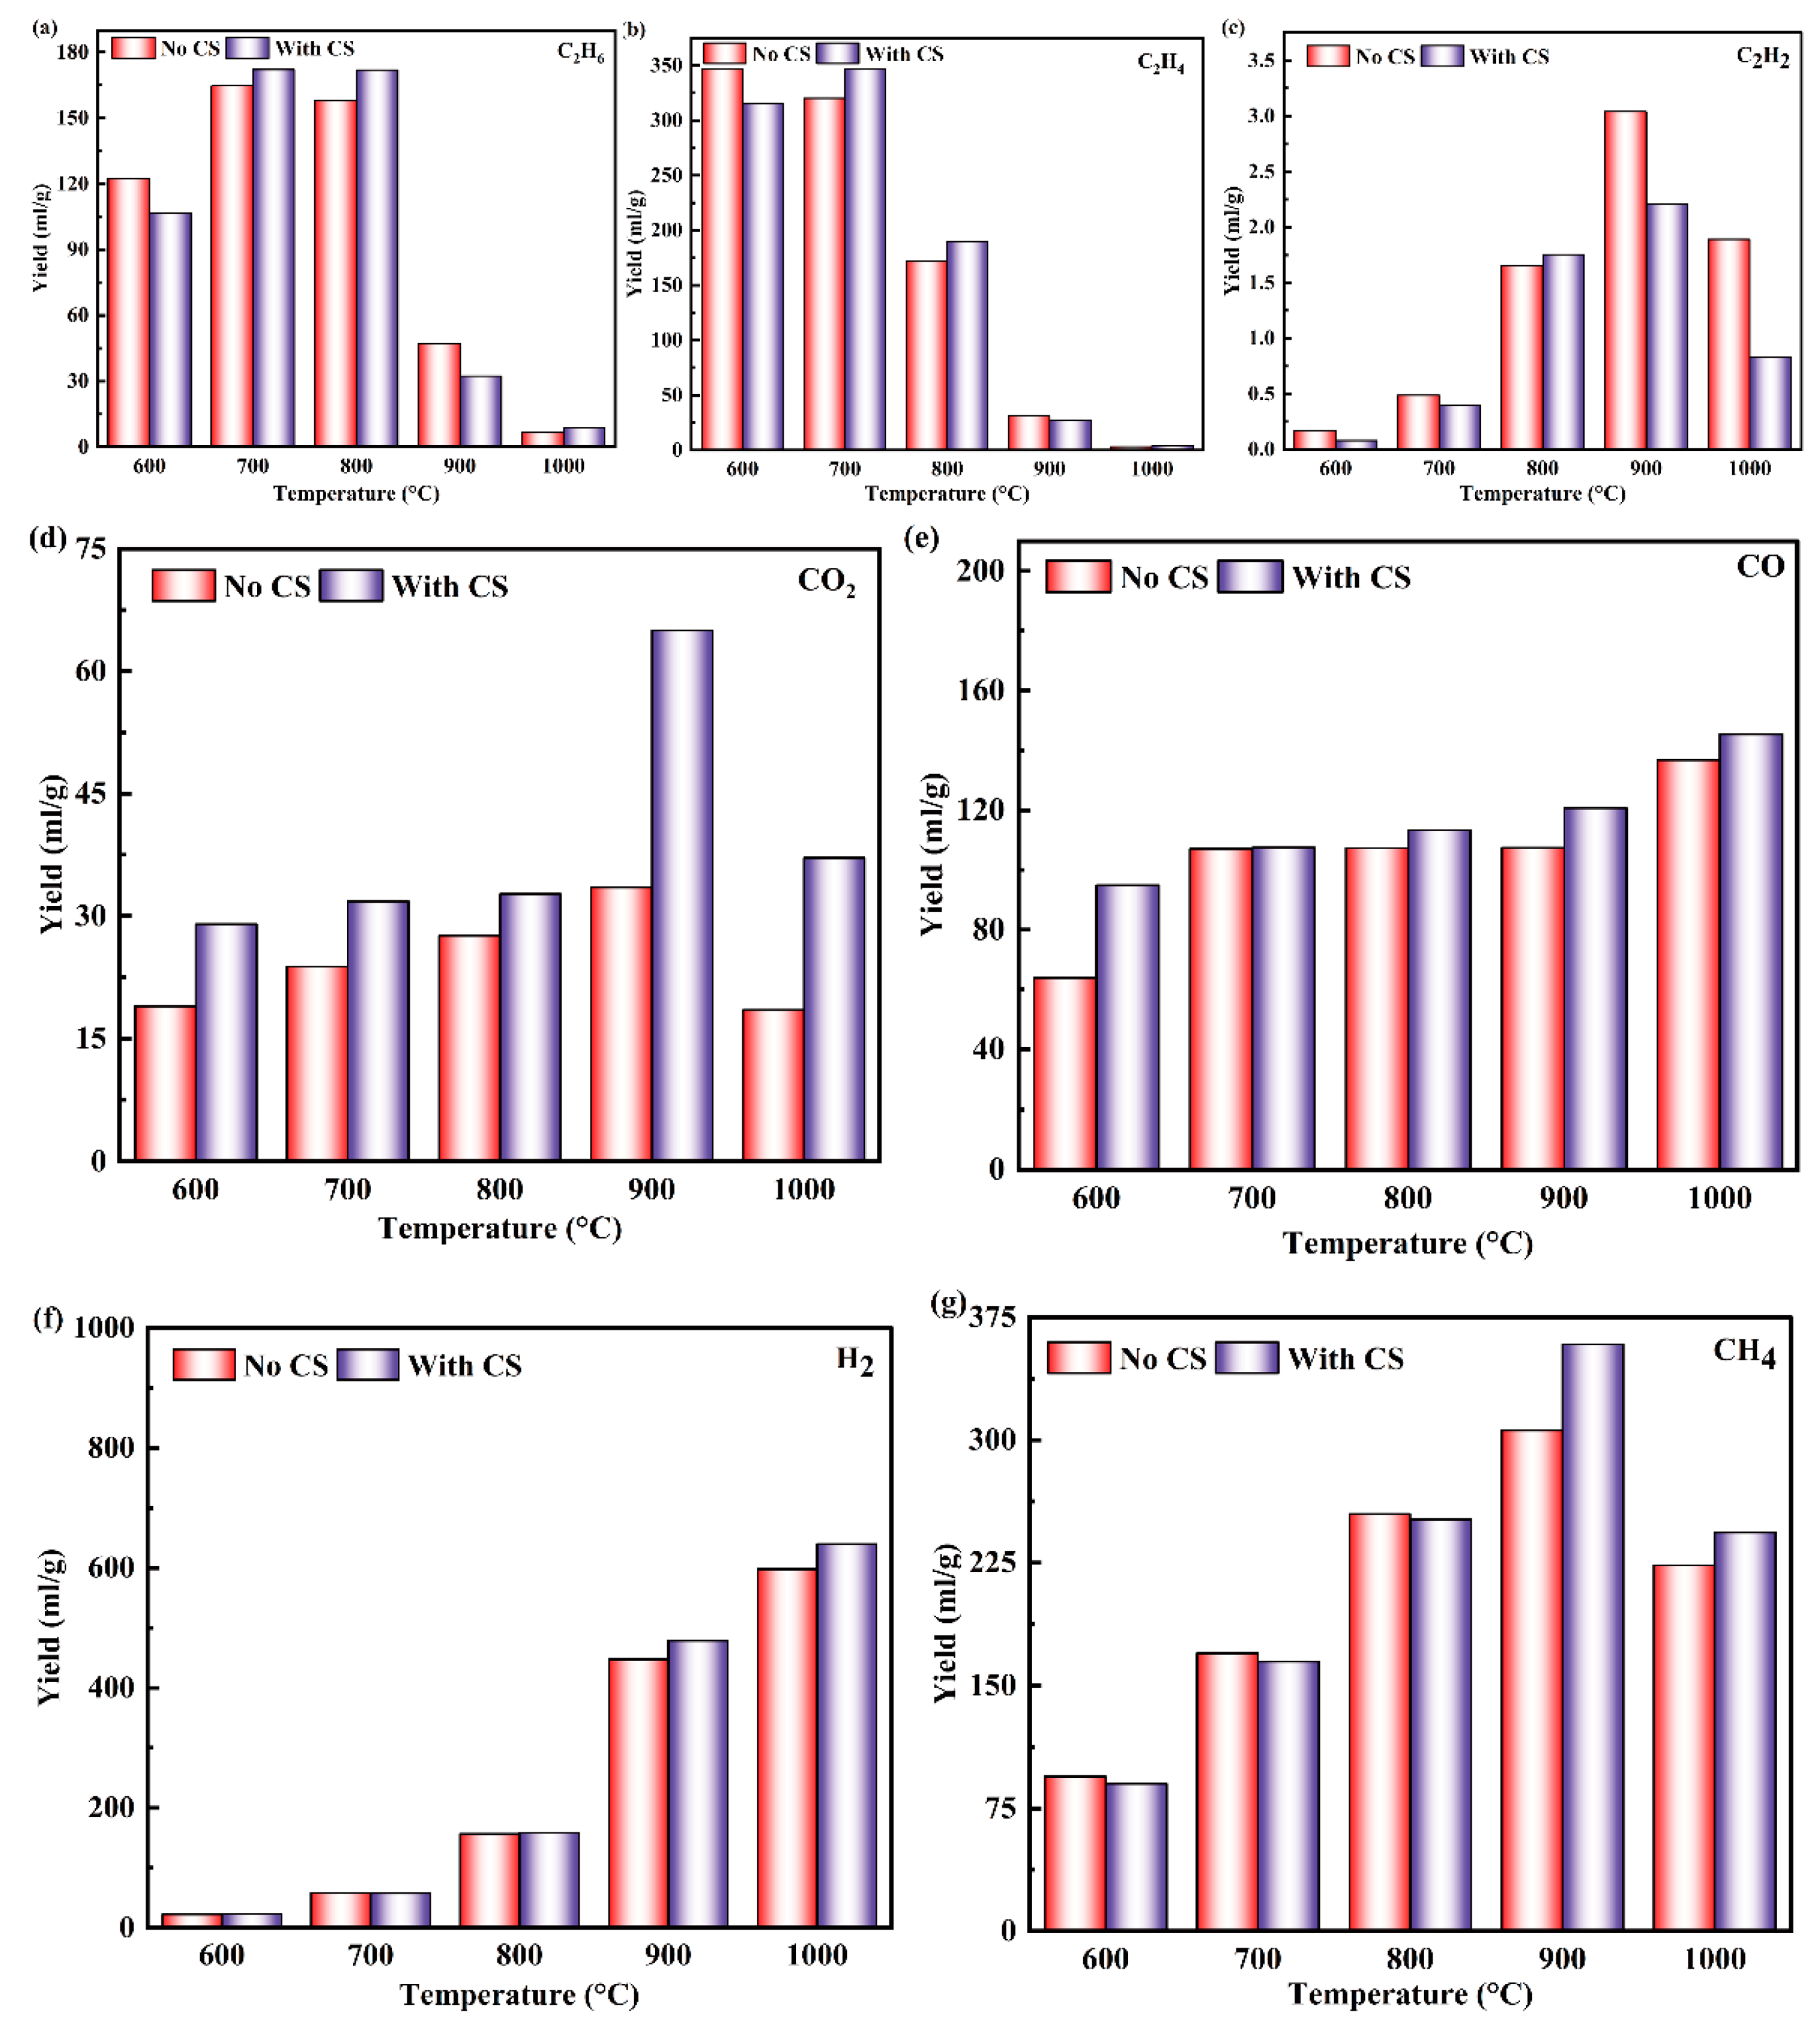
3.6. Effect of CS on the Gaseous Products of WCO-Biodiesel

The variation in different gas yields of WCO-Biodiesel at different pyrolysis temperatures under the influence of CS is shown in Figure 10. As shown in Figure 10, when the pyrolysis is increased from 600 °C to 1000 °C, the yield of CO increases to 145.40 mL/g under the influence of CS and to 136.76 mL/g without CS. The yield of H2 increases by 616.78 mL/g in the presence of CS and by 575.45 mL/g in the absence of CS. Under the influence of CS, the yield of CH4 increases to 199.1 mL/g when the pyrolysis temperature is increased from 600 °C to 900 °C and then decreases to 243.64 mL/g at 1000 °C. However, without CS, the yield of CH4 increases to 306.01 mL/g when the pyrolysis temperature is increased from 600 °C to 900 °C and then decreases at 1000 °C to 223.45 mL/g. Overall, the effect of CS will make WCO-biodiesel pyrolyze more combustible gases to participate in smelting. The yields of both CO2 and C2 gas increase with and without CS and then decrease with increasing pyrolysis temperature.
The increase in CO yield is due to the fact that Fe3O4 in CS provides oxygen for the pyrolysis process, and the coke reacts with Fe3O4 to form CO [49]. The increase in H2 yield is due to the fact that Cu and Fe in CS catalyze the pyrolysis of WCO-Biodiesel. In particular, C-C, C=C and C-H bond breaking is favored by Fe, which can lead to higher yields of gaseous products [43]. The cracking of long-chain hydrocarbons is the source of CH4, and the yield of CH4 decreases at high temperatures indicating that too-high temperatures instead reduce the production of CH4 [50]. CO2 production decreases when the temperature rises to 1000 °C due to losses caused by the reaction between the coke and CO2 [16]. C2H6 is derived from the cracking of long-chain hydrocarbons, and C2H4 and C2H2 from the cracking of olefinic compounds [50,51]. The increasing temperature promoted the pyrolysis of WCO-Biodiesel, which reduced the C2H6, C2H4 and C2H2 yields. Smaller amounts of Ca, Mg and Zn in CS have catalytic effects on WCO-Biodiesel [52]; Ca contributes to the condensation reaction of aldehydes and ketones [42]; and Zn and Cu synergistically promote the breakage of C-O and C-H bonds [41]. When WCO-Biodiesel is used as a fuel for copper smelters, it pyrolyzes to produce a large amount of hydrogen-containing gas as a secondary fuel for the smelting process, which can also reduce CO2 emissions.

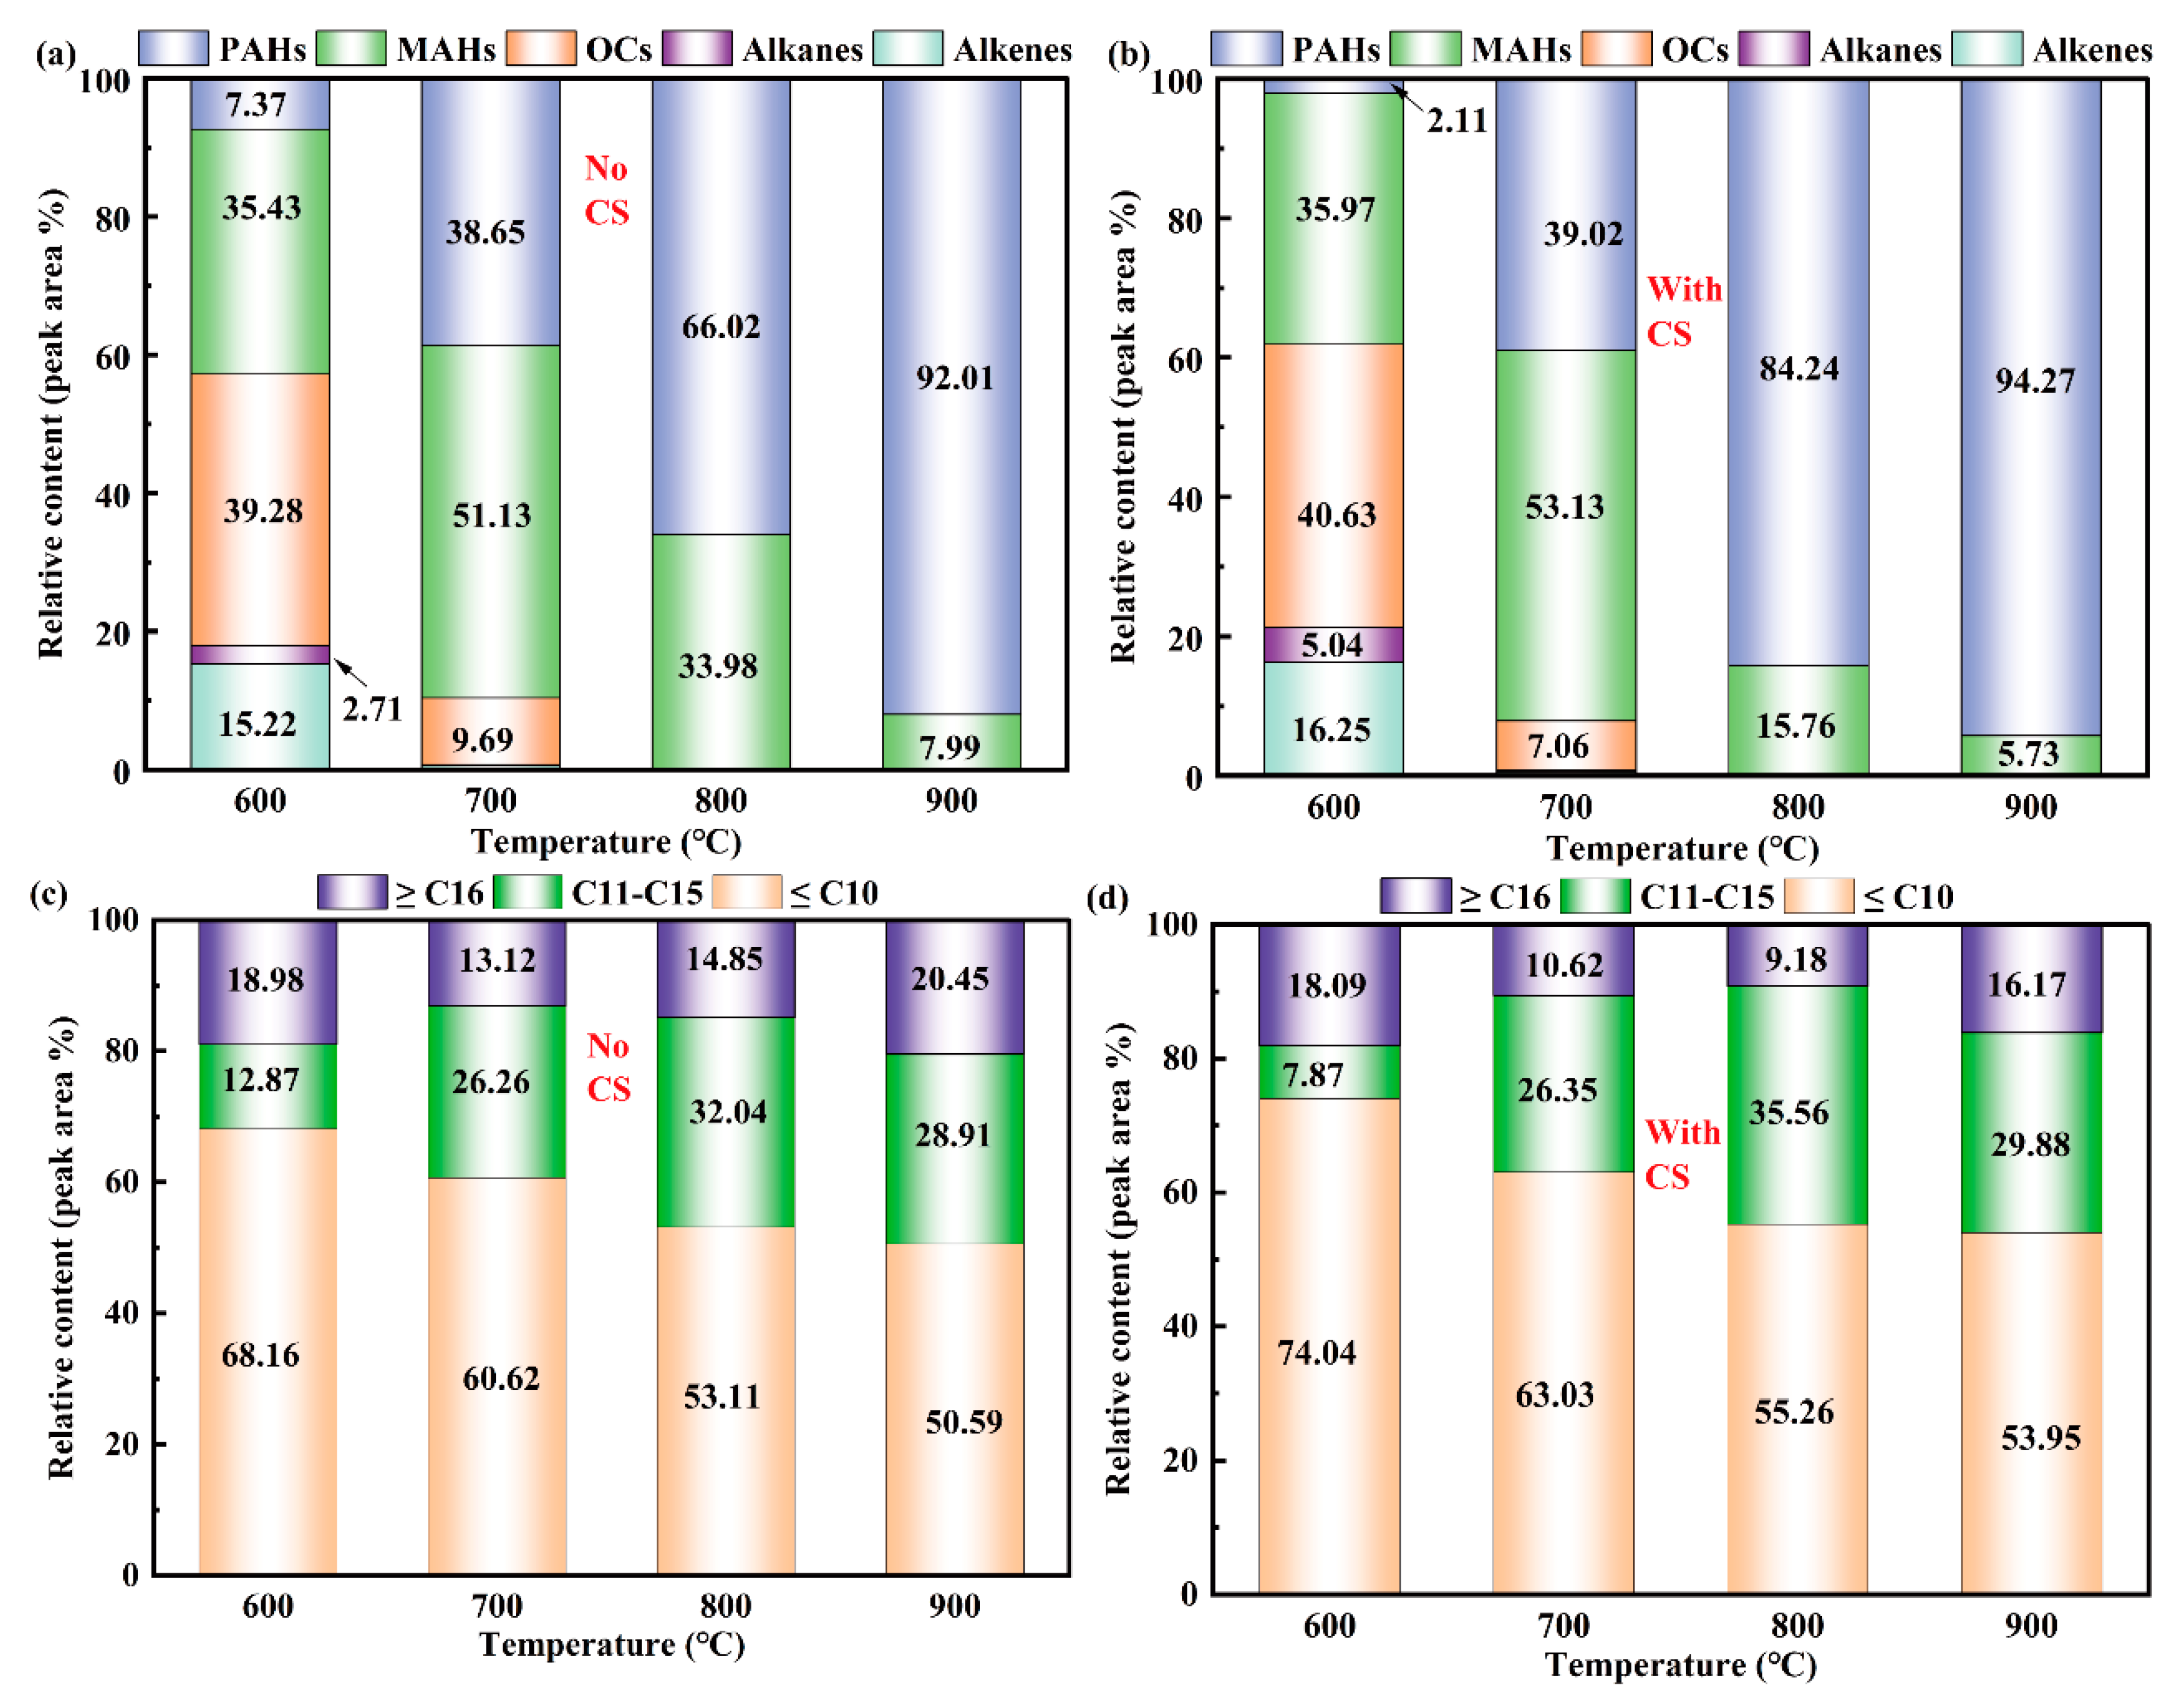
3.7. Liquid Products Analysis of WCO-Biodiesel

GC-MS analysis of liquid products obtained from the rapid pyrolysis experiments of pure WCO-Biodiesel and WCO-Biodiesel under the influence of CS was performed. According to the results of GC-MS, the yield of monocyclic aromatic hydrocarbons (MAHs) decreases with increasing temperature, and the yield of polycyclic aromatic hydrocarbons (PAHs)) increases with increasing temperature, regardless of whether influenced by CS. For alkanes, olefins and oxygenated compounds (OCs), their presence is not detected at high temperatures. The specific composition of the liquid products of pure WCO-Biodiesel and WCO-Biodiesel at 600, 700, 800 and 900 °C under the influence of CS can be obtained from Tables S1 and S2 in the Supplementary Material.
The composition of pure WCO-Biodiesel liquid products at 600, 700, 800 and 900 °C is shown in Figure 11a. It can be seen from Figure 11a that the pyrolysis temperature greatly affects the composition of the liquid product. When the pyrolysis temperature is 600 °C, the highest percentage of OCs fraction in the liquid products least percentage is PAHs with only 7.37%. When the temperatures reached 800 and 900°C, no OCs existed in the liquid products, which indicated that the QCs had been completely deoxygenated to form hydrocarbons at this time [21]. With the increase in temperature, the relative content of MAHs showed a trend of first increasing and then decreasing. The yield of MAHs reaches a maximum of 51.13% at 700 °C, in which the higher contents are Benzene (10.08%) and Toluene (11.30%). Unlike MAHs, the relative content of PAHs increased continuously with the increase in pyrolysis temperature, reaching 92.01% at the temperature of 900°C, and the content of Naphthalene reached 47.11%. This is due to the fact that the yield of PAHs increases with increasing temperature. The higher pyrolysis temperature environment makes it easier for reactions such as deoxygenation and dehydrogenation of OCs to occur, producing more products such as alkanes, olefins and flammable gases [53]. The reactivity of alkanes and olefins also shows more strongly in the higher pyrolysis temperature environment, and they are converted into PAHs through reactions such as dehydrogenation and aromatization, and coke is formed through further polymerization reactions [54]. The results likewise explain why the liquid products become less and less, and the coke products become more and more in Section 3.3. As can be seen in Figure 11b, the liquid product of WCO-Biodiesel under the influence of CS has the same composition as the liquid product of pure biodiesel pyrolysis, with only MAHs and PAHs. The content of OCs in WCO-biodiesel liquid products decreases by 2.63% at 700 °C under the influence of CS. The content reduction in MAHs decreases by 18.22% at 800 °C and by 2.26% at 900 °C. The content of PAHs increases by 18.22% at 800 °C and by 2.26% at 900 °C. All these phenomena suggest that CS contributes to more complete pyrolysis of WCO-Biodiesel and thus an increased content of PAHs in the products, which is the reason why WCO-Biodiesel pyrolysis produces more gaseous products after being influenced by CS in Section 3.6.
Figure 11c shows the distribution of different carbon atom numbers in the liquid products at different pyrolysis temperatures. As shown in Figure 11c, the relative content of ≥C16 compounds decreases by 9.91% when the temperature increases from 600 to 800 °C. As can be seen from Table S1 (Supplementary Material), the C11-C15 compounds are composed of some fatty acid methyl esters, of which the highest content at 600 °C is hexadecanoic acid methyl ester (12.08%). With the increasing temperature, these long-chain fatty acid methyl esters are further cleaved. The relative content of C11-C15 compounds increased from 12.87 to 32.04%, and ≤C10 compounds increased from 68.16 to 53.11%. The relative content of ≥C16 compounds increased to 20.45% when the temperature increased to 900 °C, while C11–C15 and ≤C10 compounds decreased to 28.91 and 50.59%, respectively. As seen in Figure 11d, the liquid product of WCO-Biodiesel is further pyrolyzed under the influence of CS, with a decrease in the content of large-molecule products and an increase in the content of low-molecule products. More PAHs are produced as the aromatization, and polymerization reactions become more intense with the increase in pyrolysis temperature. This means that more combustible gas and coke may be involved in secondary smelting [16].

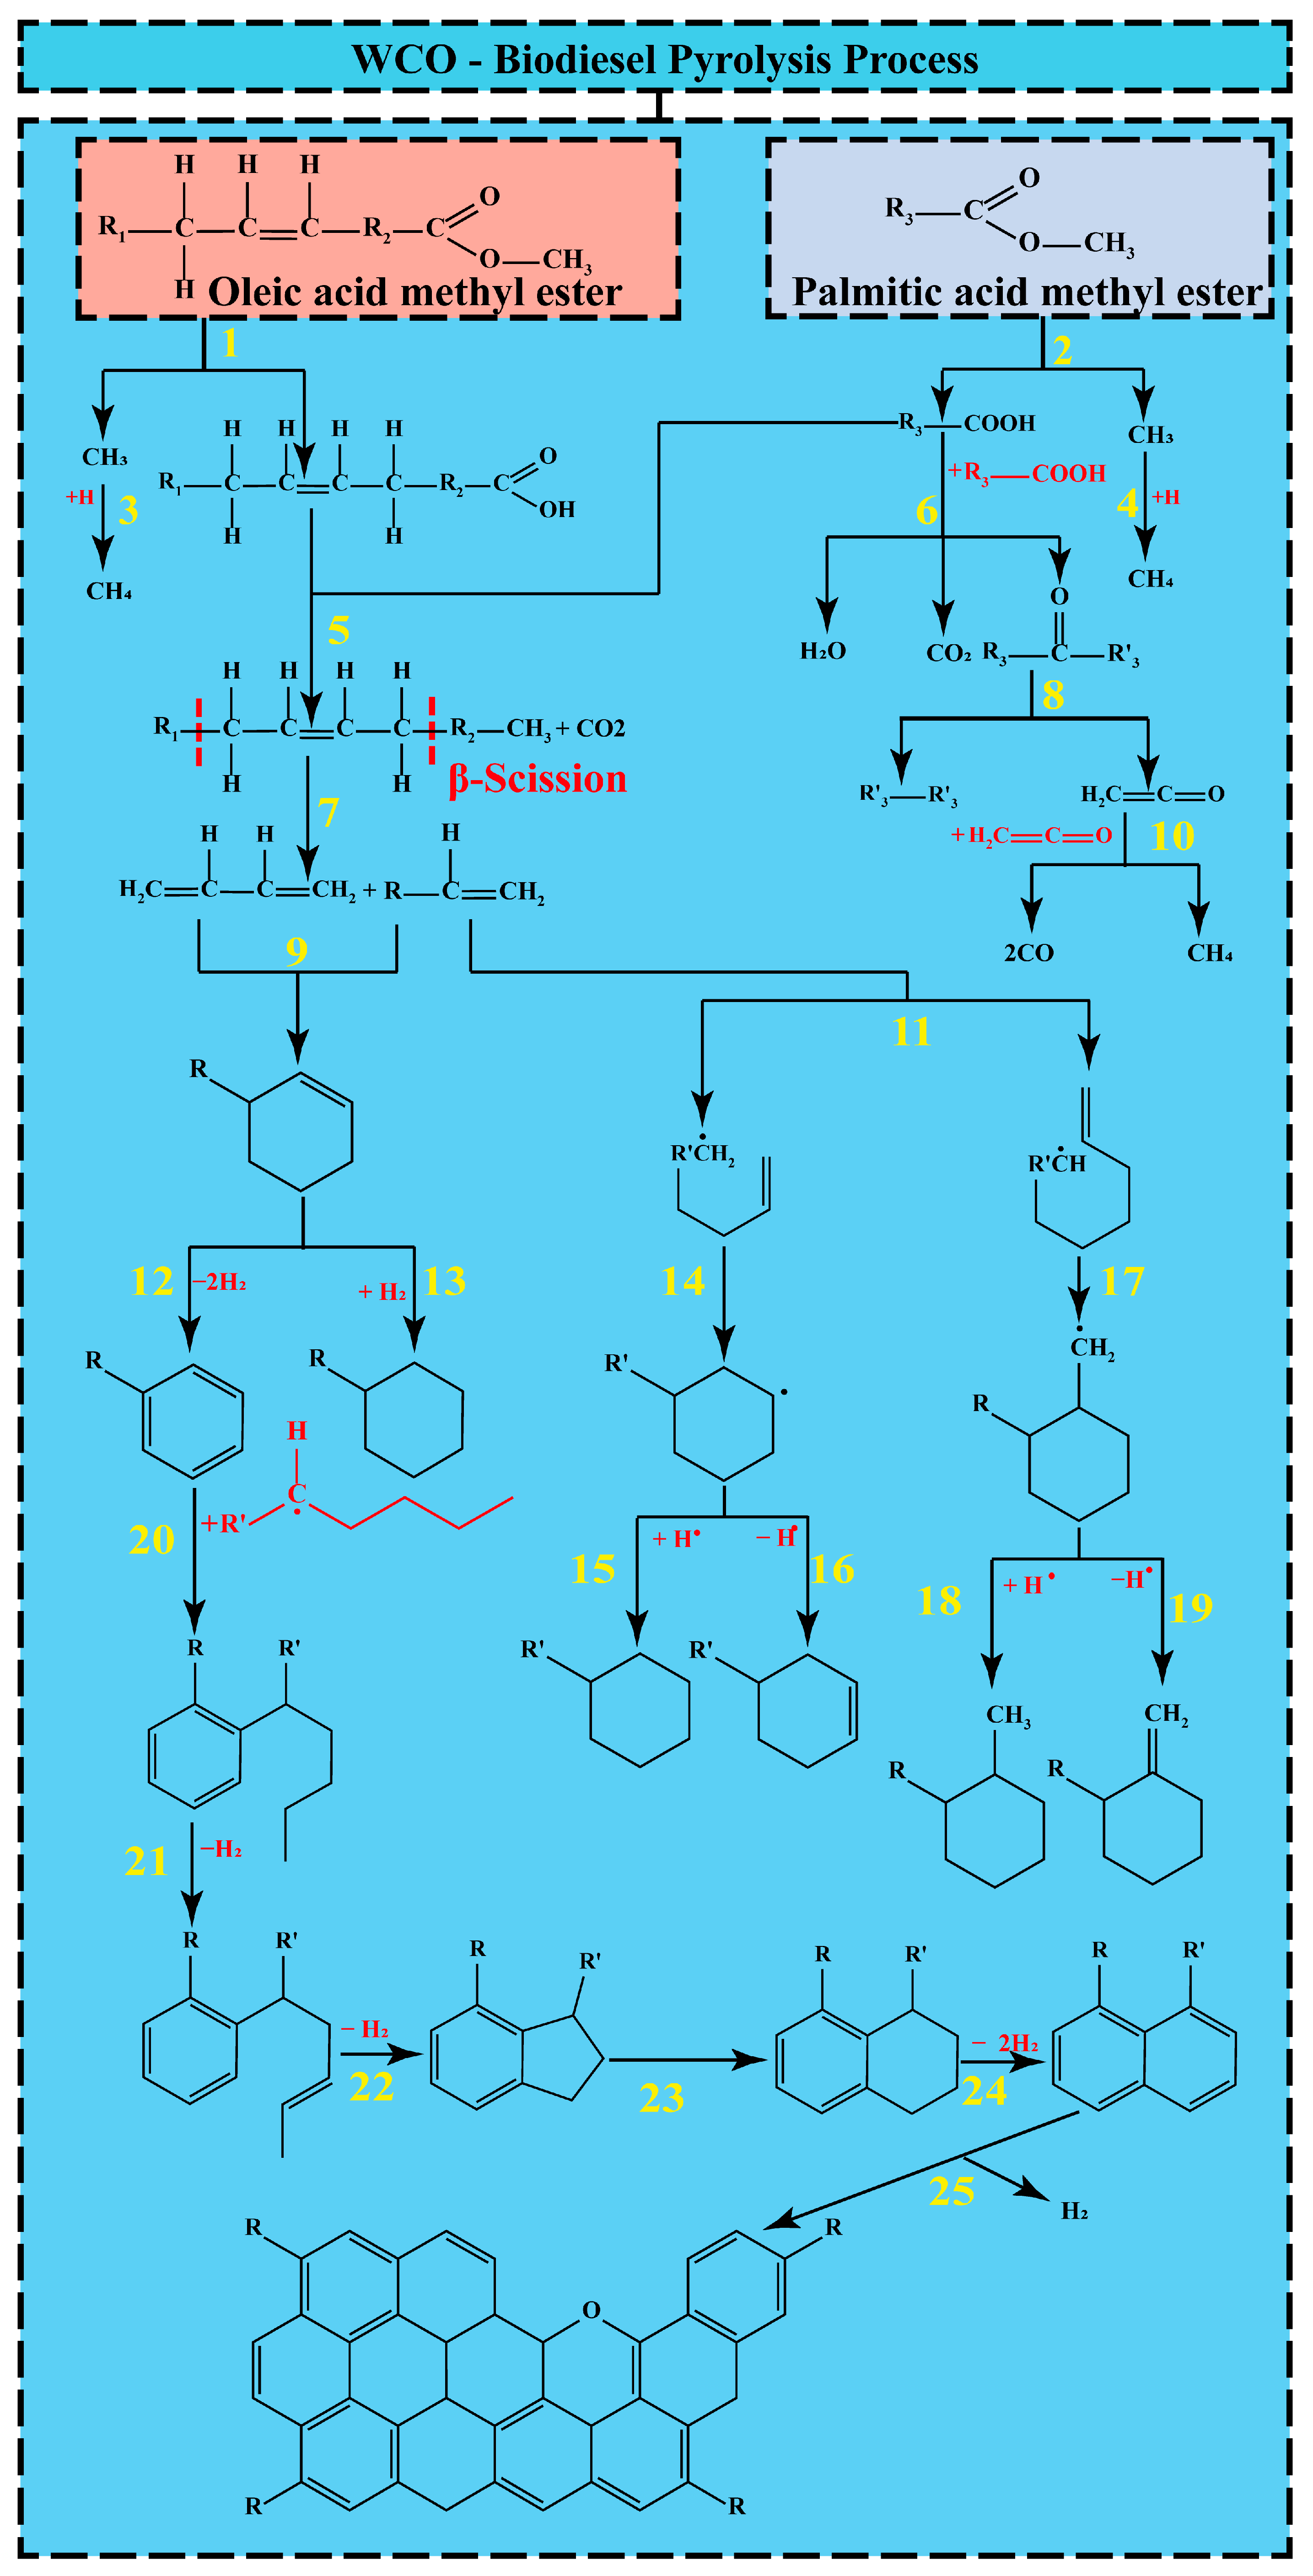
3.8. WCO-Biodiesel Pyrolysis Process

Figure 12 shows the mechanism of formation of rapid pyrolysis products of the two most dominant fatty acid methyl esters (oleic acid methyl ester and palmitic acid methyl ester) in WCO-Biodiesel. Understanding the mechanism of the pyrolysis reaction of WCO-Biodiesel under the influence of CS is an important aspect. Therefore, based on previous studies, this study investigated the mechanism of pyrolysis reactions of two major components (methyl oleate and methyl palmitate) in WCO-Biodiesel.
Previous studies have shown that when fatty acid methyl esters are cleaved at high temperatures, the main initial reaction is the direct cleavage of the C-O bond leading to the generation of CH3 radicals, and the main products of the initial reaction are long-chain fatty acids and CH4 (reactions (1), (2), (3) and (4)) [55]. C-O bonds in fatty acids break rapidly at high temperatures to form CO2 and generate long-chain linear hydrocarbons, ketones and H2O through other reactions (reactions (5) and (6)) [55,56]. The generated ketones are further converted to hydrocarbons, CO and CH4 through decarbonization reactions (reactions (8) and (10)) [23]. According to some studies, the C=C bond in the long-chain hydrocarbons obtained by reaction 5 leads to enhanced cleavage of the H2C=CH-CH2-position (β-of the double bond) of the long chain. Many short-chain hydrocarbons were obtained by β-cleavage (reaction (7)) [57]. Similarly, olefins and alkenyl groups generated through the cleavage of long-chain hydrocarbons are possible sources for the generation of aromatic and cycloalkanes [58]. Diels–Alder reaction (reaction (9)) and intramolecular cyclization reaction (reaction (14) and (17)) are the two main pathways for the formation of cyclic hydrocarbons [59,60]. The analysis of liquid products in Section 3.6 shows that the content of aromatic compounds is much higher than that of cyclic hydrocarbons, which may be due to the fact that dehydrogenation reactions are more violent than hydrogenation reactions in high-temperature environments [21]. The alkyl-substituted compounds in the liquid products of Table S1 (Supplementary Material) (e.g., Benzene, 1-ethyl-3-methyl-, Benzene, (1-methylethyl)-, Benzene, 1-methyl-4-(1-propynyl)-, etc.) are aromatic hydrocarbons obtained by alkylation reactions (reaction (20)) [53]. The alkyl polycyclic aromatic hydrocarbons (e.g., 1,4-Ethenoanthracene, 1,4-dihydro-, Naphthalene, 2-methyl-, etc.) in Table S1 are obtained by conversion of alkyl aromatic hydrocarbons through hydrogen transfer and isomerization reactions (reaction (21)–(24)) [23]. At high temperatures, the MAHs and PAHs produced by pyrolysis form coke through further polymerization and dehydrogenation (reaction (25)) [53,54].

4. Conclusions

In this study, the pyrolysis process of WCO-Biodiesel under the influence of CS is comprehensively investigated using a thermogravimetric analyzer and pyrolysis experimental system. The following conclusions were obtained: (1) The apparent activation energy (Eα) and the pre-exponential factor (A) of WCO-Biodiesel affected by CS were reduced according to the STR calculations. The empirical model was used to determine the pyrolysis mechanism function as f1(α) = α7.328(1 − α)3.048[−ln(1 − α)]8.321 for pure WCO-biodiesel and f2(α) = α−7.208(1 − α)2.967[−ln(1 − α)]8.090 for WCO-biodiesel under the influence of CS. (2) Thermodynamic parameters (enthalpy change (ΔH), Gibbs free energy (ΔG) and entropy change (ΔS)) were calculated based on the obtained Eα, A and thermogravimetric experimental data. (3) According to the analysis of the pyrolysis gas products by GC, it was found that more combustible gases containing H are formed under the influence of CS. The analysis of pyrolysis liquid products by GC-MS revealed that only aromatic hydrocarbons are present at high temperatures. The analysis of pyrolysis coke products by SEM and Raman revealed that two types of coke products are produced at high temperatures, which differ greatly in microscopic morphology, spherical carbon particle size and chemical structure. (4) The mechanism of the pyrolysis reaction of WCO-Biodiesel at high temperature was proposed, and the pyrolysis process was found to be a complex reaction involving many reactions. The work conducted in this study will be useful information for the application of WCO-Biodiesel as a fuel in the copper smelting process.

Supplementary Materials

The following supporting information can be downloaded at: https://www.mdpi.com/article/10.3390/en16052137/s1: Figure S1: SEM images of QTW-Coke and QCS-Coke at 900 °C: (a, b) no CS; (c, d) with CS; Figure S2: Raman spectra and fitted bands of coke at 900 °C; Table S1: Compounds of pure WCO-Biodiesel liquid products at different pyrolysis temperatures analyzed by GC-MS; Table S2: Compounds of WCO-biodiesel in liquid products under the influence of CS at different pyrolysis temperatures were analyzed by GC-MS.

Author Contributions

Conceptualization, methodology, formal analysis, investigation and writing—Original Draft, T.S.; validation and formal analysis, F.Z.; writing—review and editing, visualization and project administration, S.Y.; project administration, visualization, resources and supervision, H.W.; conceptualization, writing—review and editing, project administration and funding acquisition, J.H. All authors have read and agreed to the published version of the manuscript.

Funding

This work was supported by the National Natural Science Foundation of China (Grant No. U2102213, No. 51966007) and the Yunnan Fundamental Research Projects (Grant No. 202001AS070027).

Data Availability Statement

No new data were created or analyzed in this study. Data sharing is not applicable to this article.

Conflicts of Interest

The authors declare no conflict of interest.

References

  1. Wang, S.; Dai, G.; Yang, H.; Luo, Z. Lignocellulosic biomass pyrolysis mechanism: A state-of-the-art review. Prog. Energy Combust. Sci. 2017, 62, 33–86. [Google Scholar] [CrossRef]
  2. Wen, Z.; Li, H. Analysis of potential energy conservation and CO2 emissions reduction in China’s non-ferrous metals industry from a technology perspective. Int. J. Greenh. Gas Control 2014, 28, 45–56. [Google Scholar] [CrossRef]
  3. Rajendran, N.; Kang, D.; Han, J.; Gurunathan, B. Process optimization, economic and environmental analysis of biodiesel production from food waste using a citrus fruit peel biochar catalyst. J. Clean. Prod. 2022, 365, 132712. [Google Scholar] [CrossRef]
  4. Kurczyński, D.; Wcisło, G.; Łagowski, P. Experimental Study of Fuel Consumption and Exhaust Gas Composition of a Diesel Engine Powered by Biodiesel from Waste of Animal Origin. Energies 2021, 14, 3472. [Google Scholar] [CrossRef]
  5. Guo, M.; Jiang, W.; Ding, J.; Lu, J. Highly active and recyclable CuO/ZnO as photocatalyst for transesterification of waste cooking oil to biodiesel and the kinetics. Fuel 2022, 315, 123254. [Google Scholar] [CrossRef]
  6. Orlinski, P.; Wojs, M. Influence of the use of Bioethanol Additive on Waste Cooking Oil Methyl Ester on the Parameters of the CI Engine and Emissions of Toxic Exhaust Components. In Proceedings of the 23rd International Conference Transport Means 2019, Palanga, Lithuania, 2–4 October 2019. [Google Scholar]
  7. Jiang, X.; Long, F.; Cao, X.; Zhao, J.; Liu, P.; Xu, J. Catalytic cracking of waste cooking oil followed with hydro-isomerization for high-quality biofuel production. J. Clean. Prod. 2022, 345, 131027. [Google Scholar] [CrossRef]
  8. Bahadorizadeh, O.; Sobati, M.A.; Shahnazari, S. Emission characteristics of a semi-industrial boiler fueled by waste cooking oil biodiesel containing different metal oxide nanoparticles. Process. Saf. Environ. Prot. 2022, 158, 199–209. [Google Scholar] [CrossRef]
  9. Gad, M.; Ismail, M.A. Effect of waste cooking oil biodiesel blending with gasoline and kerosene on diesel engine performance, emissions and combustion characteristics. Process. Saf. Environ. Prot. 2021, 149, 1–10. [Google Scholar] [CrossRef]
  10. Jarosiński, W.; Wiśniowski, P. Verifying the Efficiency of a Diesel Particulate Filter Using Particle Counters with Two Different Measurements in Periodic Technical Inspection of Vehicles. Energies 2021, 14, 5128. [Google Scholar] [CrossRef]
  11. Simbi, I.; Aigbe, U.O.; Oyekola, O.O.; Osibote, O.A. Chemical and quality performance of biodiesel and petrol blends. Energy Convers. Manag. X 2022, 15, 100256. [Google Scholar] [CrossRef]
  12. Kurczyński, D.; Wcisło, G.; Leśniak, A.; Kozak, M.; Łagowski, P. Production and Testing of Butyl and Methyl Esters as New Generation Biodiesels from Fatty Wastes of the Leather Industry. Energies 2022, 15, 8744. [Google Scholar] [CrossRef]
  13. Guo, Z.; Zhu, D.; Pan, J.; Zhang, F. Innovative methodology for comprehensive and harmless utilization of waste copper slag via selective reduction-magnetic separation process. J. Clean. Prod. 2018, 187, 910–922. [Google Scholar] [CrossRef]
  14. Pinto, R.; Yaremchenko, A.; Baptista, M.; Tarelho, L.; Frade, J. Synthetic fayalite Fe2SiO4 by kinetically-controlled reaction between hematite and silicon carbide. J. Am. Ceram. Soc. 2019, 102, 5090–5102. [Google Scholar] [CrossRef]
  15. Mishra, G. Synthesis of Fayalite Fe2SiO4 as a Tar Removal Catalyst for Biomass Gasification. In Proceedings of the Materiai’s 2017, Aveiro, Portugal, 9–12 April 2017. [Google Scholar]
  16. Du, J.; Zhang, F.; Hu, J.; Yang, S.; Liu, H.; Wang, H. Pyrolysis of rubber seed oil over high-temperature copper slag: Gas and mechanism of coke formation. Renew. Energy 2022, 185, 1209–1220. [Google Scholar] [CrossRef]
  17. Supriyatna, Y.; Zulhan, Z.; Triapriani, Y. The ferromanganese production using Indonesian low-grade manganese ore using charcoal and palm kernel shell as reductant in mini electric arc furnace. IOP Conf. Ser. Mater. Sci. Eng. 2018, 285, 012022. [Google Scholar] [CrossRef]
  18. Zhou, S.; Wei, Y.; Li, B.; Wang, H. Cleaner recycling of iron from waste copper slag by using walnut shell char as green reductant. J. Clean. Prod. 2019, 217, 423–431. [Google Scholar] [CrossRef]
  19. Li, B.; Wang, X.; Wang, H.; Wei, Y.; Hu, J. Smelting reduction and kinetics analysis of magnetic iron in copper slag using waste cooking oil. Sci. Rep. 2017, 7, 2406. [Google Scholar] [CrossRef] [Green Version]
  20. Muravyev, N.V.; Vyazovkin, S. The Status of Pyrolysis Kinetics Studies by Thermal Analysis: Quality Is Not as Good as It Should and Can Readily Be. Thermo 2022, 2, 435–452. [Google Scholar] [CrossRef]
  21. Chen, F.; Zhang, F.; Yang, S.; Liu, H.; Wang, H.; Hu, J. Investigation of pyrolysis kinetics, thermodynamics, product characteristics and reaction mechanism of rubber seed oil. Energy Convers. Manag. 2021, 244, 114535. [Google Scholar] [CrossRef]
  22. Starink, M.J. The determination of activation energy from linear heating rate experiments: A comparison of the accuracy of isoconversion methods. Thermochim. Acta 2003, 404, 163–176. [Google Scholar] [CrossRef] [Green Version]
  23. Dong, R.; Chen, F.; Zhang, F.; Yang, S.; Liu, H.; Wang, H.; Hu, J. A comprehensive evaluation on pyrolysis kinetics, thermodynamics, product properties and formation pathways of jatropha oil for high-value utilization. Fuel 2022, 313, 122982. [Google Scholar] [CrossRef]
  24. Qiao, Y.; Wang, B.; Ji, Y.; Xu, F.; Zong, P.; Zhang, J.; Tian, Y. Thermal decomposition of castor oil, corn starch, soy protein, lignin, xylan, and cellulose during fast pyrolysis. Bioresour. Technol. 2019, 278, 287–295. [Google Scholar] [CrossRef]
  25. Criado, J. Kinetic analysis of DTG data from master curves. Thermochim. Acta 1978, 24, 186–189. [Google Scholar] [CrossRef]
  26. Tabal, A.; Barakat, A.; Aboulkas, A.; El Harfi, K. Pyrolysis of ficus nitida wood: Determination of kinetic and thermodynamic parameters. Fuel 2021, 283, 119253. [Google Scholar] [CrossRef]
  27. McKendry, P. Energy production from biomass (part 1): Overview of biomass. Bioresour. Technol. 2002, 83, 37–46. [Google Scholar] [CrossRef]
  28. Lam, S.S.; Mahari, W.A.W.; Cheng, C.K.; Omar, R.; Chong, C.T.; Chase, H.A. Recovery of diesel-like fuel from waste palm oil by pyrolysis using a microwave heated bed of activated carbon. Energy 2016, 115, 791–799. [Google Scholar] [CrossRef]
  29. Almazrouei, M.; Janajreh, I. Model-fitting approach to kinetic analysis of non-isothermal pyrolysis of pure and crude glycerol. Renew. Energy 2020, 145, 1693–1708. [Google Scholar] [CrossRef]
  30. Ordonez-Loza, J.; Chejne, F.; Jameel, A.G.A.; Telalovic, S.; Arrieta, A.A.; Sarathy, S.M. An investigation into the pyrolysis and oxidation of bio-oil from sugarcane bagasse: Kinetics and evolved gases using TGA-FTIR. J. Environ. Chem. Eng. 2021, 9, 106144. [Google Scholar] [CrossRef]
  31. Li, Y.; Yellezuome, D.; Liu, R.; Cai, J.; Gao, Y. Investigation of product selectivity and kinetics of poplar sawdust catalytic pyrolysis over bi-metallic Iron-Nickel/ZSM-5 catalyst. Bioresour. Technol. 2022, 349, 126838. [Google Scholar] [CrossRef]
  32. Naqvi, S.R.; Tariq, R.; Hameed, Z.; Ali, I.; Naqvi, M.; Chen, W.; Ceylan, S.; Rashid, H.; Ahmad, J.; Taqvi, S.A.; et al. Pyrolysis of high ash sewage sludge: Kinetics and thermodynamic analysis using Coats-Redfern method. Renew Energy 2019, 131, 854–860. [Google Scholar] [CrossRef]
  33. Xu, Z.-X.; Liu, P.; Xu, G.-S.; He, Z.-X.; Ji, H.-S.; Wang, Q. Behenic acid pyrolysis to produce diesel-like hydrocarbons. Energy Convers. Manag. 2017, 138, 393–399. [Google Scholar] [CrossRef]
  34. Xu, F.; Wang, B.; Yang, D.; Hao, J.; Qiao, Y.; Tian, Y. Thermal degradation of typical plastics under high heating rate conditions by TG-FTIR: Pyrolysis behaviors and kinetic analysis. Energy Convers. Manag. 2018, 171, 1106–1115. [Google Scholar] [CrossRef]
  35. Chen, F.; Yang, S.; Hu, J.; Xiong, Q. n Situ Catalytic Pyrolysis of Municipal Sewage Sludge under Calcined Copper Slag: Thermokinetic Analysis and Real-Time Monitoring of Evolved Gases. ACS Sustain. Chem. Eng. 2022, 10, 14381–14390. [Google Scholar] [CrossRef]
  36. Šesták, J.; Berggren, G. Study of the kinetics of the mechanism of solid-state reactions at increasing temperatures. Thermochim. Acta 1971, 3, 1–12. [Google Scholar] [CrossRef]
  37. Koga, N.; Vyazovkin, S.; Burnham, A.K.; Favergeon, L.; Muravyev, N.V.; Pérez-Maqueda, L.A.; Saggese, C.; Sánchez-Jiménez, P.E. ICTAC Kinetics Committee recommendations for analysis of thermal decomposition kinetics. Thermochim. Acta 2023, 719, 179384. [Google Scholar] [CrossRef]
  38. Bhuyan, N.; Choudhury, N.D.; Dutta, B.K.; Upadhyaya, K.; Saikia, N.; Kataki, R. Assessment of kinetic parameters, mechanisms and thermodynamics of Tithonia diversifolia pyrolysis. Biomass-Convers. Biorefinery 2021, 13, 2703–2718. [Google Scholar] [CrossRef]
  39. Zou, H.; Zhang, J.; Liu, J.; Buyukada, M.; Evrendilek, F.; Liang, G. Pyrolytic behaviors, kinetics, decomposition mechanisms, product distributions and joint optimization of Lentinus edodes stipe. Energy Convers. Manag. 2020, 213, 112858. [Google Scholar] [CrossRef]
  40. Shahbeig, H.; Nosrati, M. Pyrolysis of municipal sewage sludge for bioenergy production: Thermo-kinetic studies, evolved gas analysis, and techno-socio-economic assessment. Renew. Sustain. Energy Rev. 2020, 119, 109567. [Google Scholar] [CrossRef]
  41. Niu, H.; Luo, J.; Li, C.; Wang, B.; Liang, C. Transfer Hydrogenation of Biomass-Derived Furfural to 2-Methylfuran over CuZnAl Catalysts. Ind. Eng. Chem. Res. 2019, 58, 6298–6308. [Google Scholar] [CrossRef]
  42. Fang, X.; Wang, Z.; Song, W.; Li, S. Aldol condensation of furfural with acetone over Ca/ZSM-5 catalyst with lower dosages of water and acetone. J. Taiwan Inst. Chem. Eng. 2020, 108, 16–22. [Google Scholar] [CrossRef]
  43. Chen, J.; Sun, J.; Wang, Y. Catalysts for Steam Reforming of Bio-oil: A Review. Ind. Eng. Chem. Res. 2017, 56, 4627–4637. [Google Scholar] [CrossRef]
  44. Lu, Q.; Yuan, S.; Wang, X.; Zhao, Y.; Xie, X.; Liu, H.; Liu, J. Coking behavior and syngas composition of the char supported Fe catalyst of biomass pyrolysis volatiles reforming. Fuel 2021, 298, 120830. [Google Scholar] [CrossRef]
  45. Omoriyekomwan, J.E.; Tahmasebi, A.; Zhang, J.; Yu, J. Formation of hollow carbon nanofibers on bio-char during microwave pyrolysis of palm kernel shell. Energy Convers. Manag. 2017, 148, 583–592. [Google Scholar] [CrossRef]
  46. Sadezky, A.; Muckenhuber, H.; Grothe, H.; Niessner, R.; Pöschl, U. Raman microspectroscopy of soot and related carbonaceous materials: Spectral analysis and structural information. Carbon 2005, 43, 1731–1742. [Google Scholar] [CrossRef]
  47. Mubarak, N.; Sahu, J.; Abdullah, E.; Jayakumar, N.; Ganesan, P. Single stage production of carbon nanotubes using microwave technology. Diam. Relat. Mater. 2014, 48, 52–59. [Google Scholar] [CrossRef]
  48. Beyssac, O.; Goffé, B.; Petitet, J.-P.; Froigneux, E.; Moreau, M.; Rouzaud, J.-N. On the characterization of disordered and heterogeneous carbonaceous materials by Raman spectroscopy. Spectrochim. Acta Part A Mol. Biomol. Spectrosc. 2003, 59, 2267–2276. [Google Scholar] [CrossRef]
  49. Zhou, S.; Wei, Y.; Zhang, S.; Li, B.; Wang, H.; Yang, Y.; Barati, M. Reduction of copper smelting slag using waste cooking oil. J. Clean. Prod. 2019, 236, 117668. [Google Scholar] [CrossRef]
  50. Taufiqurrahmi, N.; Bhatia, S. Catalytic cracking of edible and non-edible oils for the production of biofuels. Energy Environ. Sci. 2011, 4, 1087–1112. [Google Scholar] [CrossRef]
  51. Meier, H.; Wiggers, V.; Zonta, G.; Scharf, D.; Simionatto, E.; Ender, L. A kinetic model for thermal cracking of waste cooking oil based on chemical lumps. Fuel 2015, 144, 50–59. [Google Scholar] [CrossRef]
  52. Li, S.; Guo, L. Stability and activity of a co-precipitated Mg promoted Ni/Al2O3 catalyst for supercritical water gasification of biomass. Int. J. Hydrogen Energy 2019, 44, 15842–15852. [Google Scholar] [CrossRef]
  53. Xu, J.; Long, F.; Jiang, J.; Li, F.; Zhai, Q.; Wang, F.; Liu, P.; Li, J. Integrated catalytic conversion of waste triglycerides to liquid hydrocarbons for aviation biofuels. J. Clean. Prod. 2019, 222, 784–792. [Google Scholar] [CrossRef]
  54. Qiao, Y.; Wang, B.; Zong, P.; Tian, Y.; Xu, F.; Li, D.; Li, F.; Tian, Y. Thermal behavior, kinetics and fast pyrolysis characteristics of palm oil: Analytical TG-FTIR and Py-GC/MS study. Energy Convers. Manag. 2019, 199, 111964. [Google Scholar] [CrossRef]
  55. Sui, M.; Li, F.; Wang, S.; Wang, H. Molecular dynamics simulation and experimental research on the oxidation reaction of methyl linoleate at low oxygen and high temperature. Fuel 2021, 305, 121478. [Google Scholar] [CrossRef]
  56. Maher, K.D.; Bressler, D.C. Pyrolysis of triglyceride materials for the production of renewable fuels and chemicals. Bioresour. Technol. 2007, 98, 2351–2368. [Google Scholar] [CrossRef]
  57. Beims, R.; Botton, V.; Ender, L.; Scharf, D.; Simionatto, E.; Meier, H.; Wiggers, V. Effect of degree of triglyceride unsaturation on aromatics content in bio-oil. Fuel 2018, 217, 175–184. [Google Scholar] [CrossRef]
  58. Kozliak, E.; Sulkes, M.; Alhroub, I.; Kubátová, A.; Andrianova, A.; Seames, W. Influence of early stages of triglyceride pyrolysis on the formation of PAHs as coke precursors. Phys. Chem. Chem. Phys. 2019, 21, 20189–20203. [Google Scholar] [CrossRef]
  59. Kubátová, A.; Št’Ávová, J.; Seames, W.S.; Luo, Y.; Sadrameli, S.M.; Linnen, M.J.; Baglayeva, G.V.; Smoliakova, I.P.; Kozliak, E.I. Triacylglyceride Thermal Cracking: Pathways to Cyclic Hydrocarbons. Energy Fuels 2012, 26, 672–685. [Google Scholar] [CrossRef]
  60. Wang, Y.; Ke, L.; Peng, Y.; Yang, Q.; Du, Z.; Dai, L.; Zhou, N.; Liu, Y.; Fu, G.; Ruan, R.; et al. Characteristics of the catalytic fast pyrolysis of vegetable oil soapstock for hydrocarbon-rich fuel. Energy Convers. Manag. 2020, 213, 112860. [Google Scholar] [CrossRef]
Figure 1. XRD analysis of CS.
Energies 16 02137 g001
Figure 2. Schematic layout of WCO-Biodiesel pyrolysis experimental setup.
Energies 16 02137 g002
Figure 3. (a,c) TG and DTG curves of WCO-Biodiesel and WCO-Biodiesel-CS blends at heating rates of 10, 30 and 50 °C/min under the influence of CS, (b,d) pyrolysis characteristic parameters.
Energies 16 02137 g003
Figure 4. Arrhenius plots of STR: (a) no CS, (b) with CS.
Energies 16 02137 g004
Figure 5. Z(α) master plots of WCO-Biodiesel pyrolysis under the influence of CS: (a) no CS; (b) with CS.
Energies 16 02137 g005
Figure 6. Gas, liquid and coke yields of WCO-Biodiesel at 600, 700, 800, 900 and 1000 °C: (a) no CS; (b) with CS.
Energies 16 02137 g006
Figure 7. (ac,fh) SEM images of QTW-Coke and QCS-Coke at 1000 °C; (d,e,i,j) Particle size distribution of QTW-Coke and QCS-Coke at 1000 °C.
Energies 16 02137 g007
Figure 8. Raman spectra and fitted bands of coke at 1000 °C: (ac) no CS, (df) with CS.
Energies 16 02137 g008
Figure 9. Intensity ratio of the fitted bands of Raman spectra.
Energies 16 02137 g009
Figure 10. Effect of CS on gas products at different pyrolysis temperatures: (a) C2H6; (b) C2H4; (c) C2H2; (d) CO2; (e) CO; (f) H2; (g) CH4.
Energies 16 02137 g010
Figure 11. Liquid products of WCO-Biodiesel under the influence of CS at 600, 700, 800 and 900 °C: (a,b) classification of products based on their type; (c,d) classification of products based on the number of carbon atoms.
Energies 16 02137 g011
Figure 12. The possible rapid pyrolysis reaction mechanism of WCO-Biodiesel.
Energies 16 02137 g012
Table 1. Main components in CS (wt%).
Cu SiO2 Al2O3 CaO MgO ZnO S Fe (Total) Fe3O4
17.82 19.13 2.96 2.12 1.95 1.83 8.07 33.06 12.9
Table 2. The common kinetic reaction models [21,23].
Reaction MechanismCodef(α)g(α)
Limiting surface reactionOne-dimensional R1 1 α
Two-dimensional R2 2 ( 1 α ) 1 / 2 1 ( 1 α ) 1 / 2
Three-dimensional R3 3 ( 1 α ) 2 / 3 1 ( 1 α ) 1 / 3
Order of reactionFirst-order F1 1 α l n ( 1 α )
1.5-order F1.5 ( 1 α ) 3 / 2 2 [ ( 1 α ) 1 / 2 1 ]
Second-order F2 ( 1 α ) 2 ( 1 α ) 1 1
Third-order F3 ( 1 α ) 3 [ ( 1 α ) 2 1 ] / 2
Exponential nucleationPower law P2/3 ( 2 / 3 ) α 1 / 2 α 3 / 2
Power law P2 2 α 1 / 2 α 1 / 2
Power law P3 3 α 2 / 3 α 1 / 3
Power law P4 4 α 3 / 4 α 1 / 4
Diffusional1-D diffusional D1 1 / 2 α 1 α 2
2-D diffusional D2 [ l n ( 1 a ) ] 1 ( 1 α ) l n ( 1 α ) + α
3-D diffusional D3 1.5 ( 1 α ) 2 / 3 [ 1 ( 1 α ) 1 / 3 ] 1 [ 1 ( 1 α ) 1 / 3 ] 2
Ginstling-Brounshtein D4 1.5 [ ( 1 α ) 1 / 3 1 ] 1 1 ( 2 / 3 ) α ( 1 α ) 2 / 3
Random nucleation and nuclei growthTwo-dimensional A2 2 ( 1 α ) [ l n ( 1 α ) ] 1 / 2 [ l n ( 1 α ) ] 1 / 2
Three-dimensional A3 3 ( 1 α ) [ l n ( 1 α ) ] 2 / 3 [ l n ( 1 α ) ] 1 / 3
Four-dimensional A4 4 ( 1 α ) [ l n ( 1 α ) ] 3 / 4 [ l n ( 1 α ) ] 1 / 4
Table 3. Elemental analysis (wt%), HHV (MJ·kg−1) and fatty acid compositions (wt%) of WCO-Biodiesel.
Composition Values Composition Values
Elemental compositions (wt%) Fatty acid compositions (wt%)
 C 70.26  Palmitic acid 23.70
 H 11.27  Oleic acid 42.27
 O a 17.60  Dinoleic acid 29.37
 N 0.87  Linolenic acid 2.32
 O/C (molar ratio) 0.25 Other acids 2.34
 H/C (molar ratio)0.16Proximate analysis (wt%)
 Volatile matter99.91
Higher heating value (HHV) b (MJ·kg−1)36.97 Fixed carbon0.09
 Ash 0
a By difference. b By HHV(MJ/kg) = 0.3383C + 1.443(H − O/8) + 0.0927S.
Table 4. Pyrolysis kinetic parameters of WCO-Biodiesel and blends of WCO-Biodiesel with CS at different α.
αNo CSWith CS
Eα (kJ/mol) A (s−1) R2Eα (kJ/mol) A (s−1) R2
STR0.1 125.422.62 × 10110.9983379.791.06 × 1070.99965
0.2 172.268.68 × 10150.9617163.502.45 × 1050.99108
0.3 210.874.36 × 10190.9938763.212.29 × 1050.99775
0.4 127.794.46 × 10110.9657770.781.33 × 1060.99644
0.5 110.348.95 × 1090.9679573.472.48 × 1060.98213
0.6 105.623.10 × 1090.9985270.301.19 × 1060.98577
0.7 106.513.79 × 109177.956.96 × 1060.96176
0.8 105.983.36 × 1090.9993783.212.33 × 1070.94648
0.9 106.623.88 × 1090.9953192.341.88 × 1080.92555
average 130.164.84 × 10180.9867674.952.60 × 1070.97629
Table 5. Thermodynamic parameters of WCO-Biodiesel and blends of WCO-Biodiesel with CS at different α.
αNo CSWith CS
ΔH (kJ/mol) ΔG (kJ/mol) ΔS (J/mol·K) ΔH (kJ/mol) ΔG (kJ/mol) ΔS (J/mol·K)
STR0.1 121.75143.03−38.1176.02143.74−122.37
0.2 168.36141.5548.0259.53144.80−154.06
0.3 206.77140.61118.4959.08144.82−154.90
0.4 123.48142.94−34.8566.52144.30−140.53
0.5 105.92143.62−67.5369.12144.12−135.52
0.6 101.14143.82−76.4665.91144.33−141.67
0.7 101.95143.78−74.9273.48143.85−127.14
0.8 101.37143.81−76.0078.68143.55−117.21
0.9 101.97143.78−74.8887.75143.07−99.95
average 125.86142.99−30.6970.68144.06−132.59
Disclaimer/Publisher’s Note: The statements, opinions and data contained in all publications are solely those of the individual author(s) and contributor(s) and not of MDPI and/or the editor(s). MDPI and/or the editor(s) disclaim responsibility for any injury to people or property resulting from any ideas, methods, instructions or products referred to in the content.

