1. Introduction
Biomass is a key building block in biofuels, which can be defined as a fuel produced through contemporary biological processes. To support a 40% reduction of greenhouse gas emissions relative to 1990 levels, the EU aims for biomass to increase to at least a 27% share of renewable energy consumption [
1,
2]. Additionally, the United Nations has included efficient utilisation of renewable energy sources, including biomass, in their sustainable development goals.
The rapidly increased use of biomass impacts international trade as well as the need for optimal utilisation of fuel. Therefore, fast and reliable traceable measurement and characterisation of biofuels have become essential in this development. A critical factor in this context is the quick and accurate measurement of the content of water in solid biofuel materials, such as wood pellets or wood chips. This ensures optimal combustion efficiency and fair pricing of the fuel. For that reason, one of the specific objectives of the EURAMET project 19ENG09 BIOFMET (
http://www.biofmet.eu/ (accessed on 28 November 2023)) was to develop traceable measurements for water content in solid biofuels (mainly wood pellets and woodchips).
This work is a step towards the advancement of traceable in-line/on-line measurement of water content in solid biofuels, minimising process interruptions while ensuring metrological traceability to the SI system.
The most attractive measurement methods for water content used at, e.g., CHP plants are working on the in-line/on-line principle. Sensors are installed in-line directly at the processing, e.g., at a conveyor belt transporting the biomass to the boiler or connected intermittently or continuously to the process (on-line), e.g., combined with an automated sampling system for real-time or quasi-real-time monitoring and data collection. In both cases, the measurement time is short, typically less than 1 to 10 min. Examples of in-line/on-line instrumentation used at the CHP plants include methods based on infrared absorption (IR) [
3], radiofrequency (RF) [
4], and microwave (MW) [
5,
6]. These are fast and can measure large quantities of biofuels rapidly. However, often in-line measurement systems are not properly calibrated but rely on an adjustment curve from the manufacturer and/or a few test measurements using the loss-on-drying (LoD) technique [
7]. This is a problem because a prerequisite for obtaining reliable and accurate results using in-line measurement systems is their calibration.
In contrast to in-line measurement, so-called off-line measurements are also frequently used by the CHP plants, with the most well-known and widely used example being the traditional loss-on-drying (LoD) measurements [
7]. The method can provide more precise data on the extracted samples but is relatively slow (several hours duration) and in general requires an additional sampling process, in which samples are extracted from the bulk of biofuel. Therefore, bulk average values are subject to very significant additional uncertainty contribution from sampling processes.
It becomes clear that with proper calibration, in-line/on-line methods possess significant advantages over traditional off-line measurements (LoD). The goal of the calibration process is to make measurement results metrologically traceable to the basic definition of the relevant SI unit using a reference method. One significant challenge for the calibration process is minimising process interruptions. Furthermore, traditionally the reference methods for water determination in solid biofuels are based on loss-on-drying (LoD), but the reliability of the LoD method used with biofuels is questionable as it detects both water and volatile organic compounds.
To address the calibration challenge, this paper explores two new routes to achieving SI traceability. The first approach, direct traceability, involves calibrating the process instrument by directly comparing it to a reference standard. The second approach, indirect traceability, calibrates the in-line instrument through a transfer standard, which in turn is calibrated against a primary measurement standard. In this paper, the two new primary measurement standards are presented, including their validation. A new transfer standard based on broad-band microwave detection techniques (RF/MW) and its calibration are described, and the result of a full-scale demonstration of an SI-traceable calibration of an in-line microwave instrument using these new methods is given, together with its uncertainty budget.
2. Primary Reference Methods
A primary reference method for water content determination links the measured water in the material to the SI system directly through a water-specific measurement. The result is not obtained through comparison measurements with other water content measurement devices, but rather through more fundamental and direct measurements. These fundamental measurements typically involve primary physical quantities such as mass, flow, and temperature. By relying on these basic parameters, the method ensures more accurate and direct traceability to the SI system, providing a robust and reliable standard for water content determination.
While methods based on the loss-on-drying (LoD) technique link water content measurement to a fundamental parameter, namely mass, they are not classified as reference methods. This distinction arises because LoD methods lack specificity in detecting only water. In other words, these methods do not guarantee the exclusion of other evaporated compounds in the measurement. See, e.g., [
8,
9,
10]. A reference method must ensure that all the water, and that nothing more than the water, is measured.
Below, we present two methods capable of fulfilling the requirements of being a primary reference method as stated above. Common for both are that they evaporate the water from the sample into a stream of dry carrier gas, which is then analysed using a discriminative measuring tool that provides specific water detection, and thus only detects water and not any other compounds. Another example of a reference method that is often used, but may have issues related to biomass measurements, is the Karl Fischer titration method (see, e.g., [
10,
11,
12]).
2.1. DTI Reference Method
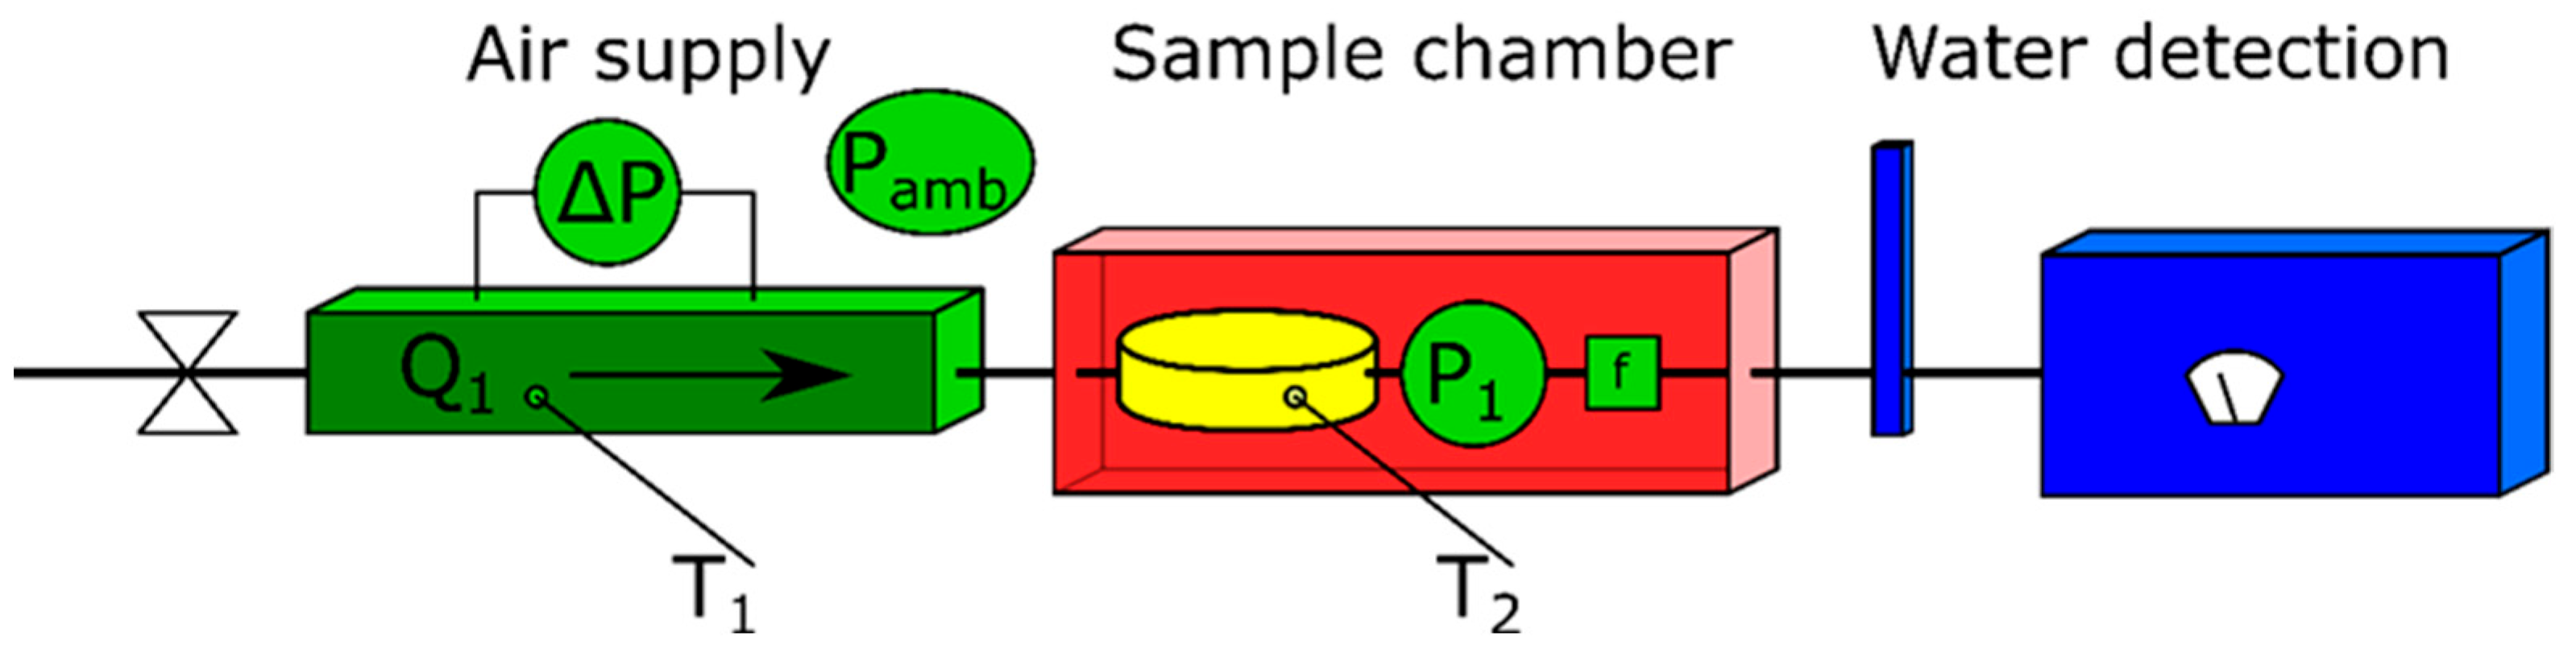
The reference method employed at DTI consists of three main parts: a flow metering device, an oven, and a dewpoint hygrometer. The setup is sketched in
Figure 1. Using a sample chamber with an atmosphere of dry air inside the oven, water can be extracted from the sample by heating it. Thus, the supplied dry air is passed over the (heated) sample, and the water is transported away from it and towards the dewpoint hygrometer used for water detection. By constantly measuring the amount of dry air entering the system and the absolute water concentration of the air exiting the system, the total amount of water extracted from the sample can be determined.
Since the dewpoint hygrometer measures the condensation temperature of the gas leaving the system, and water is expected to be present in the highest content and with the highest condensation temperature, any other compound evaporating from the sample will not be measured in this setup, making the measurement water-content-specific. A detailed description of the setup has been given by Østergaard and Nielsen [
13].
A calibrated laminar flow element (LFE) is used to measure the flow (Q1) of dry input gas. The temperature of the LFE (T1) is also measured to compensate for potential changes in the viscosity and density of the air. A differential pressure sensor measures the pressure drop over the LFE (ΔP), while another pressure sensor measures the absolute pressure of the gas in the setup (P1) before a particle filter (f).
The temperature of the sample (T2) does not enter the calculations of the water content but is still measured to keep track of temperature gradients and to control the sample temperature, thus ensuring that it is not overheated, since this may cause water to be created from the sample material by degradation of the biomatter. Lastly, a calibrated dewpoint hygrometer is used to discriminately measure the water content of the air leaving the sample. By integrating the water content passing by the dewpoint hygrometer over the time of the measurement, the total water content leaving the sample can be found.
In combination with the principles of the method, the calibration of the instruments ensures traceability to the SI system through pressure, airflow, temperature, and humidity (dewpoint) measurements.
2.2. LNE-CETIAT Reference Method: Evolved Eater Vapour Coulometric Analysis
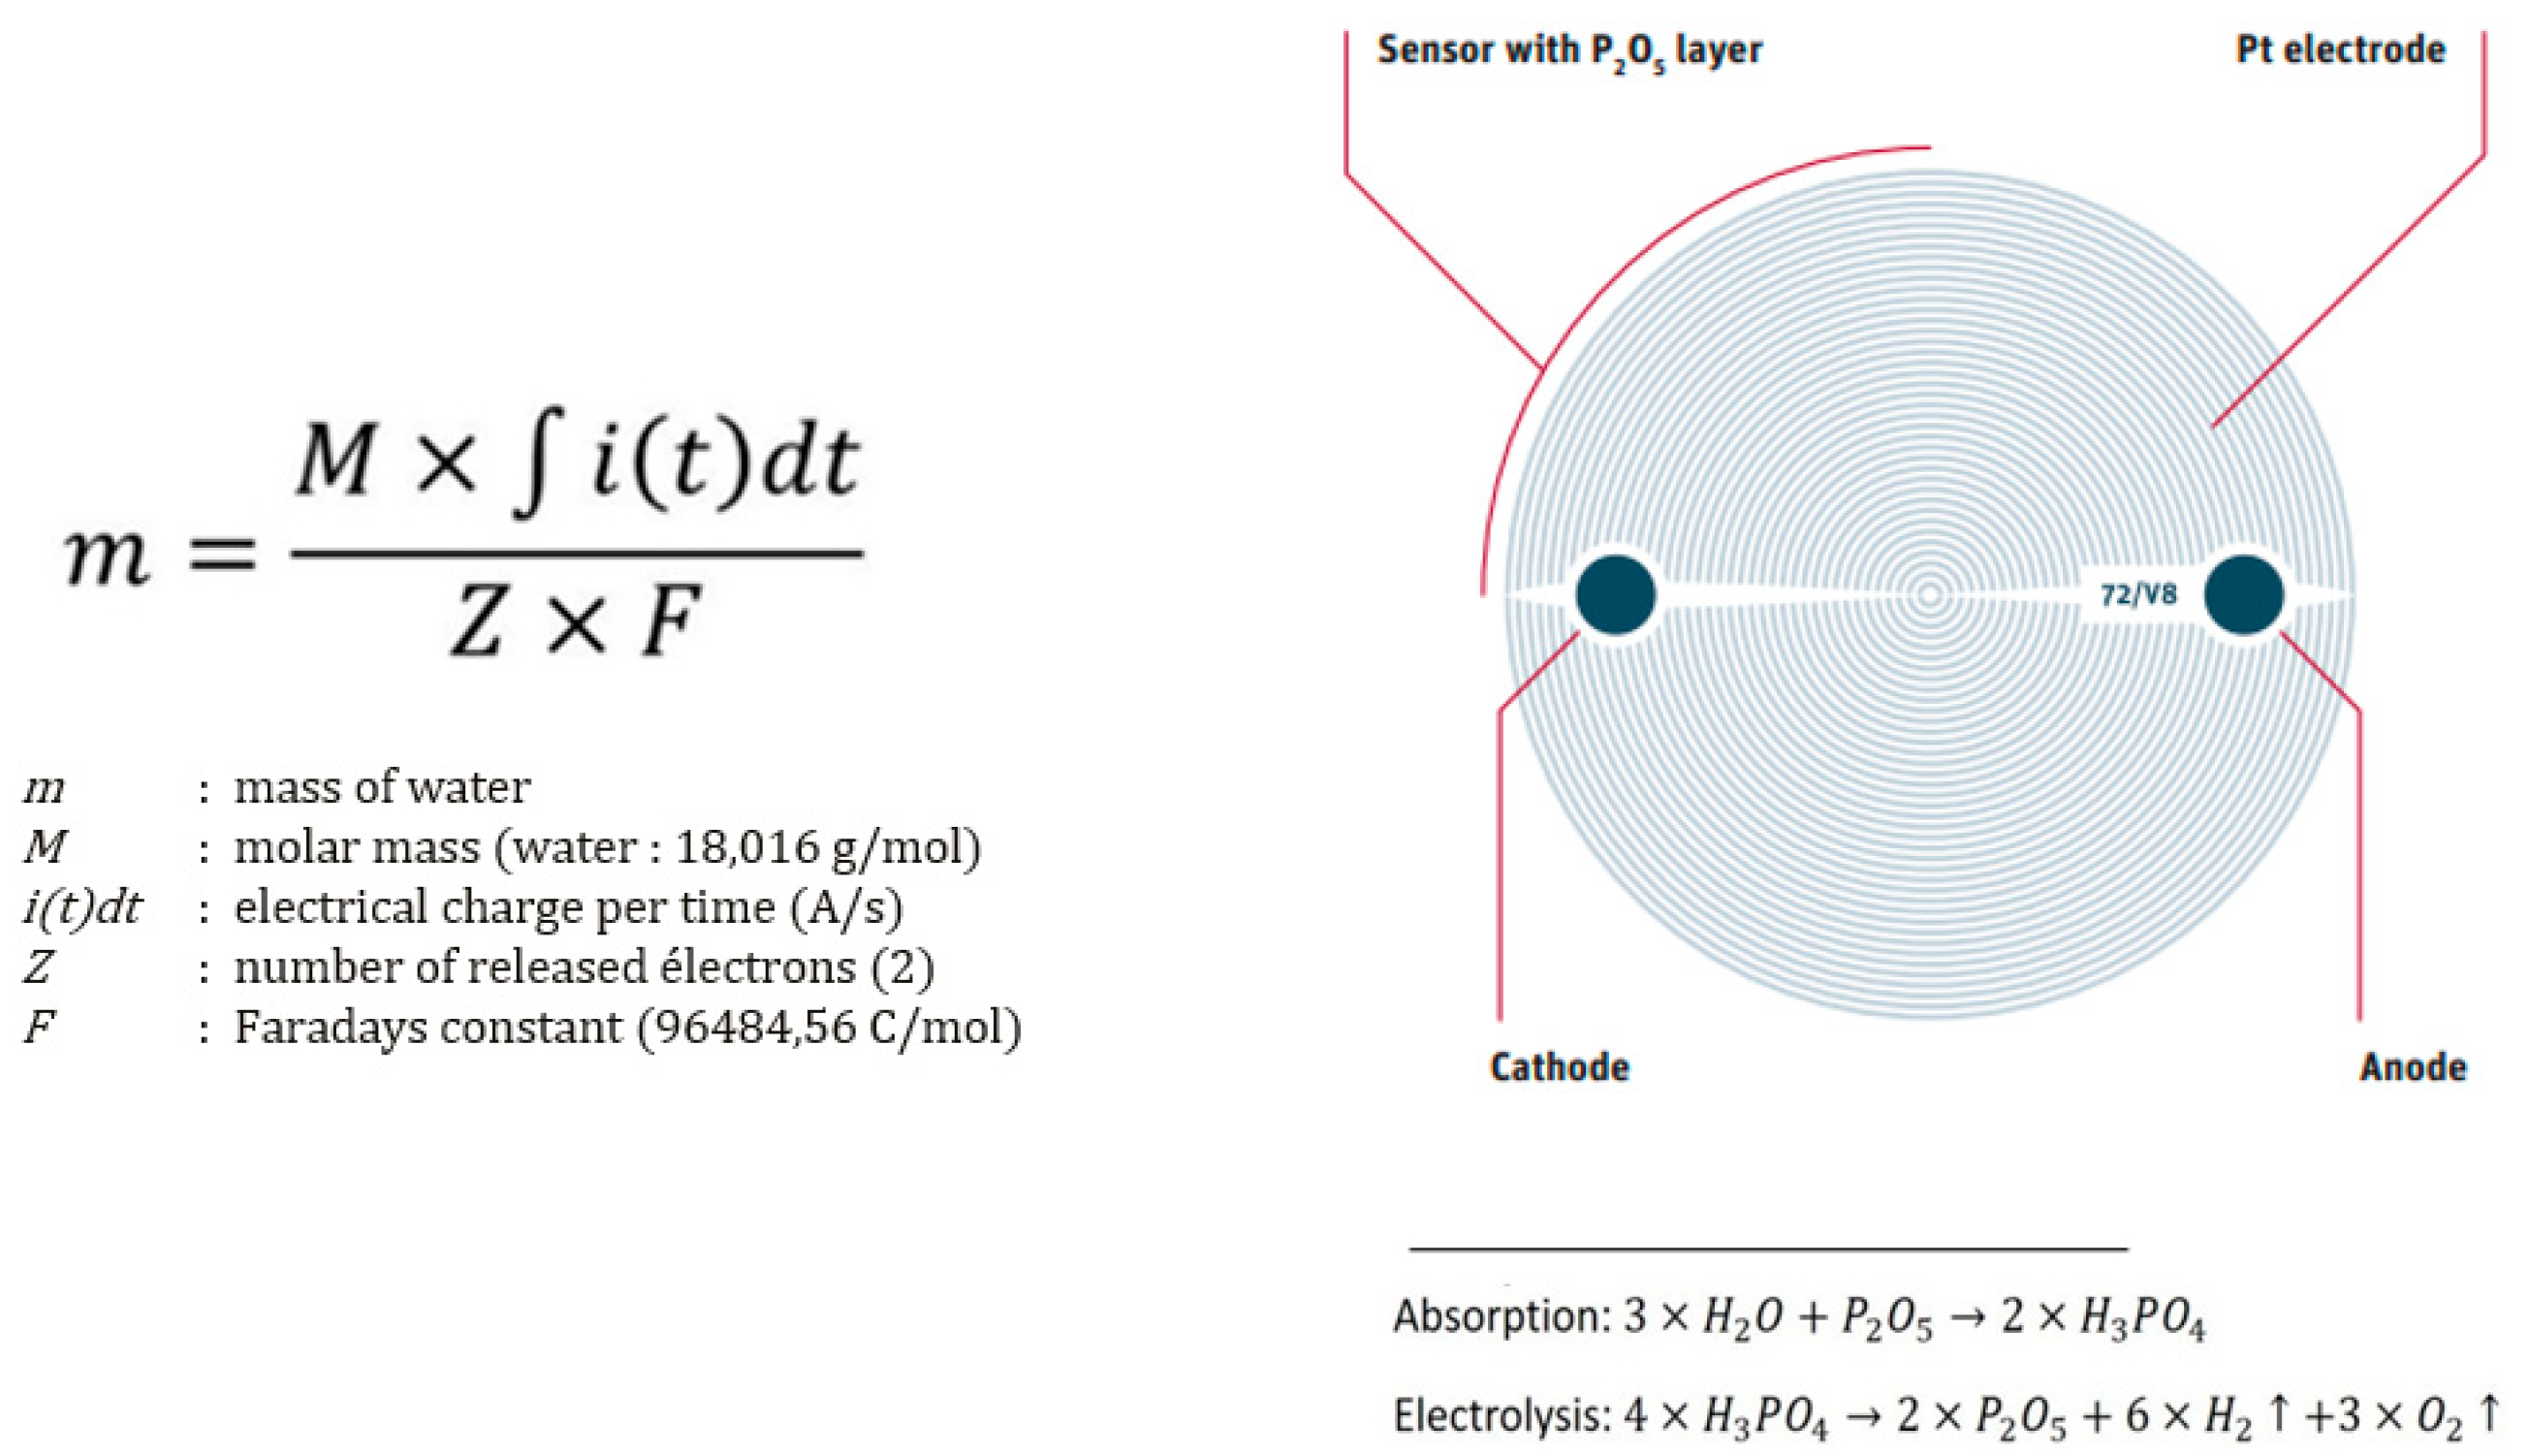
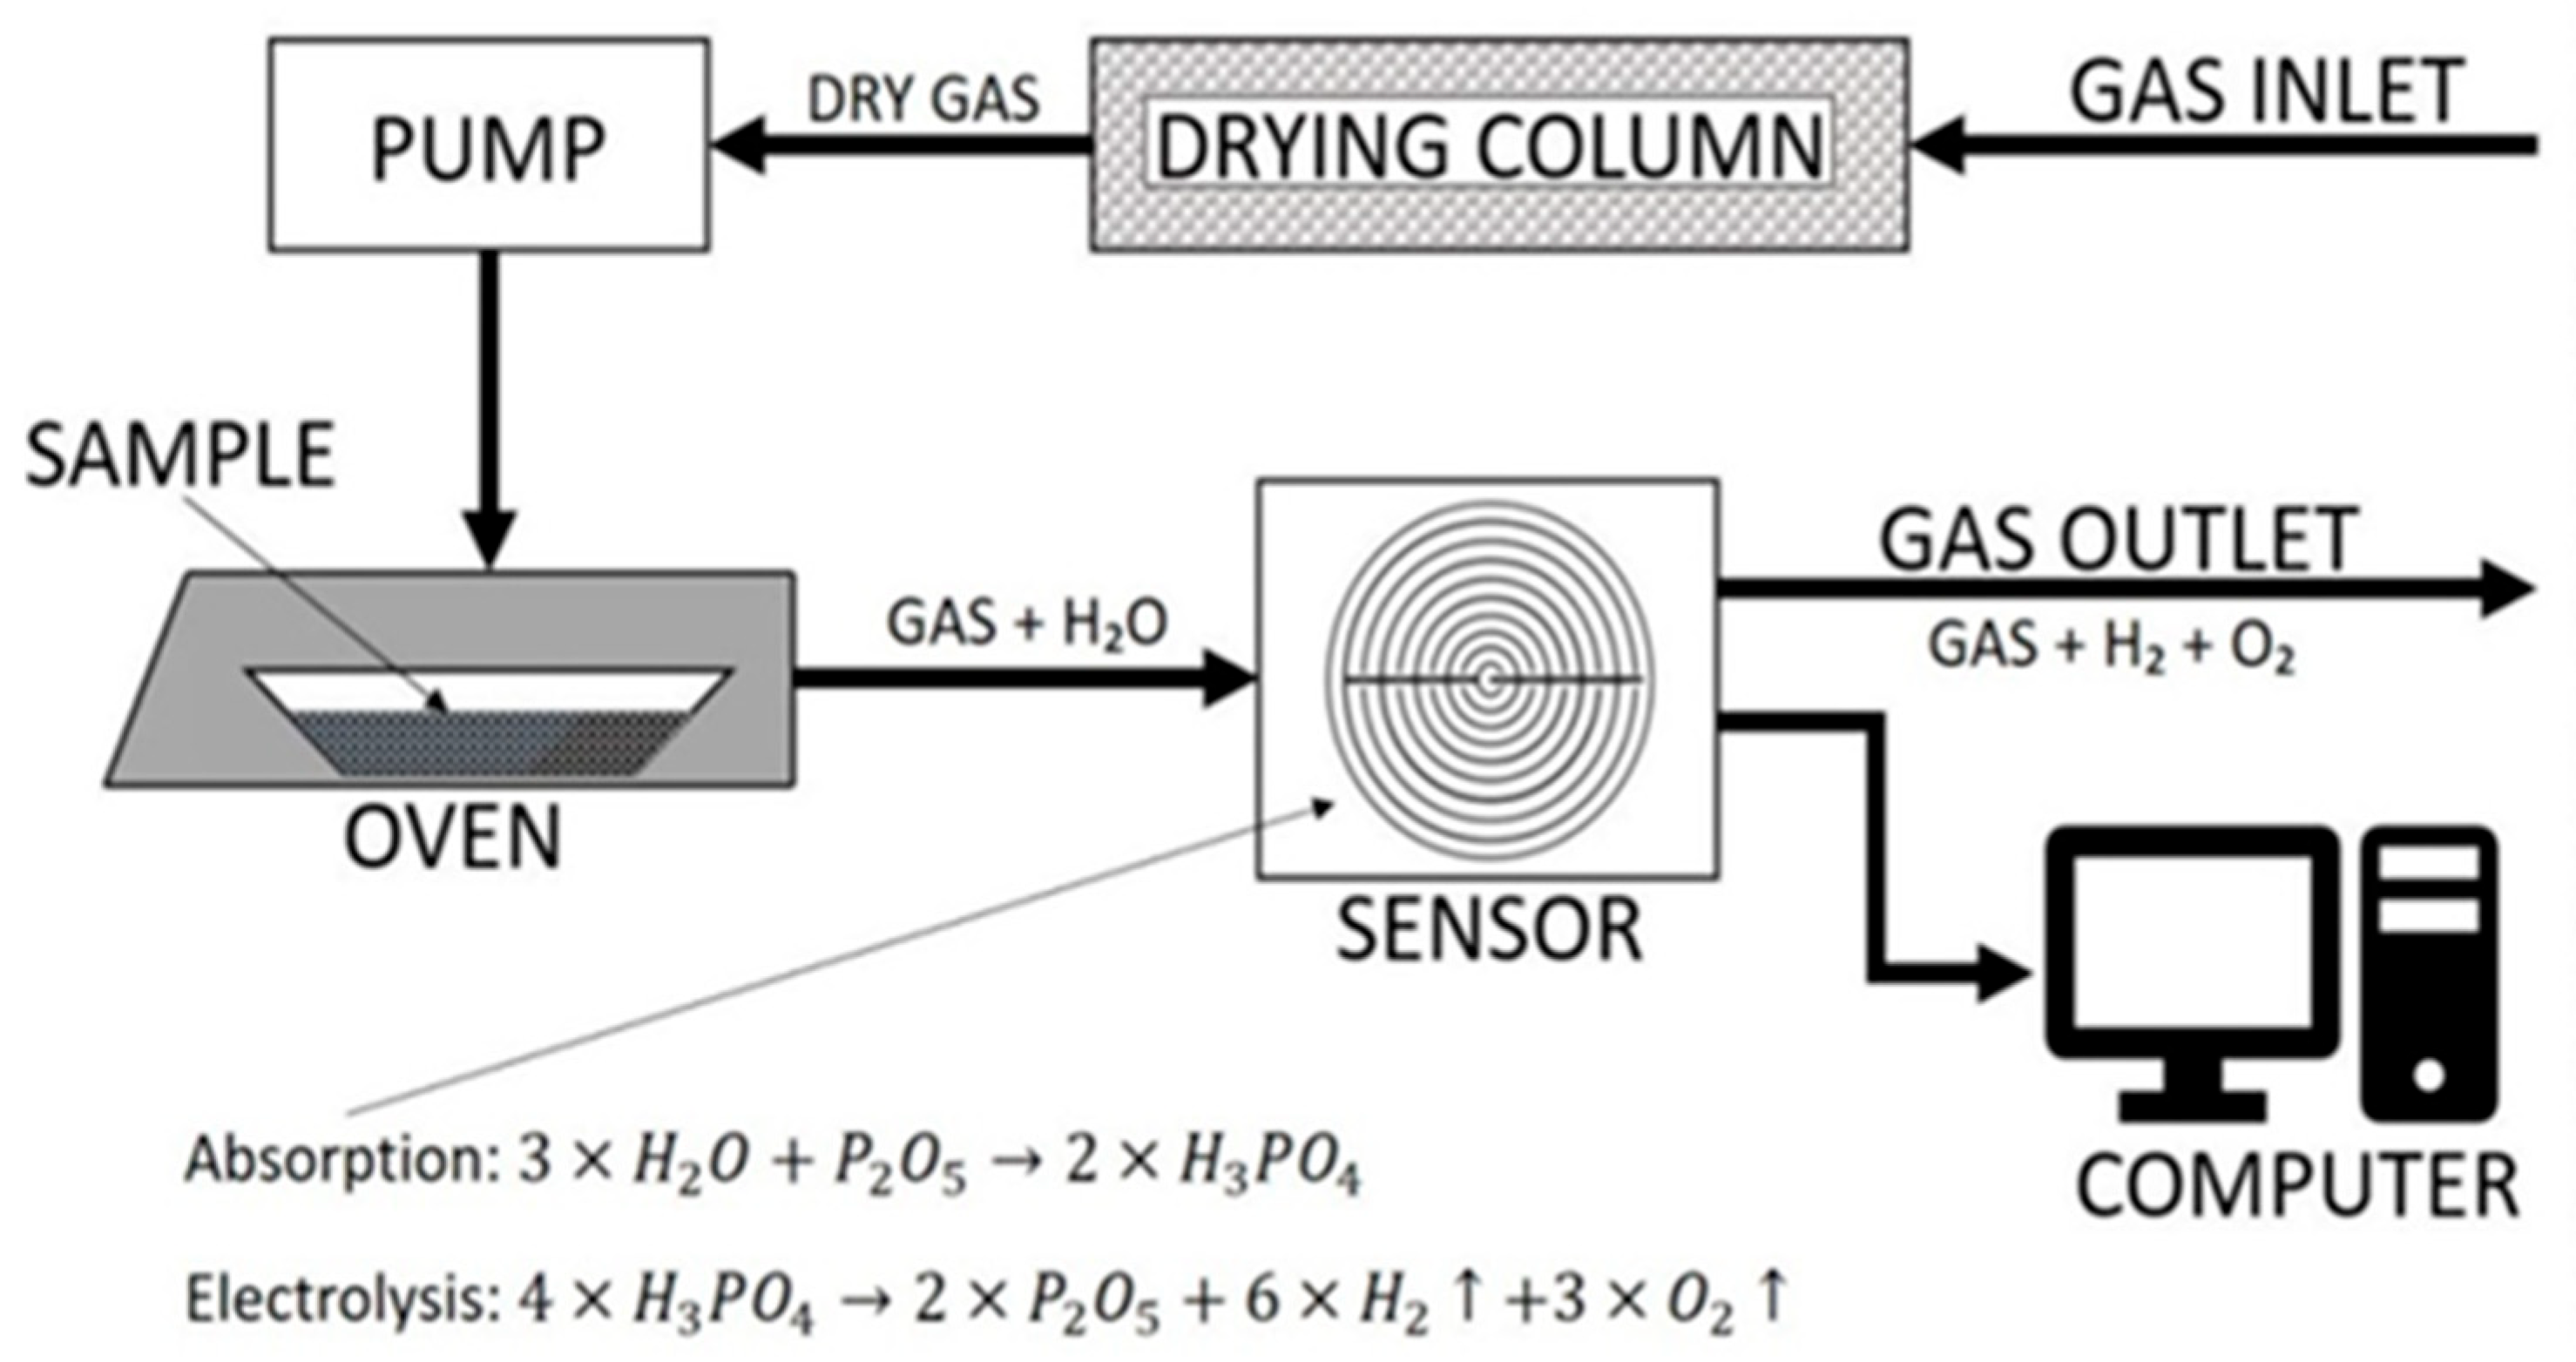
Evolved water vapour coulometric analysis is a technique involving the selective electrolysis of water vapour, which has been evaporated from a solid matrix and carried in a carrier gas stream. Initially, the sample is heated in an oven to evaporate its moisture content. Subsequently, the water molecules react with a P
2O₅ coating to form H₃PO₄. In the electrolytic cell, H₃PO₄ molecules dissociate into hydrogen and oxygen. The electric charge consumed during electrolysis is measured and integrated over time to determine the total charge, which is directly proportional to the water content in the sample according to Faraday’s law. This technique allows for the selective electrolysis of water molecules, and the current passing through the cell indicates the amount of water present. Refer to
Figure 2 and
Figure 3 for visual details.
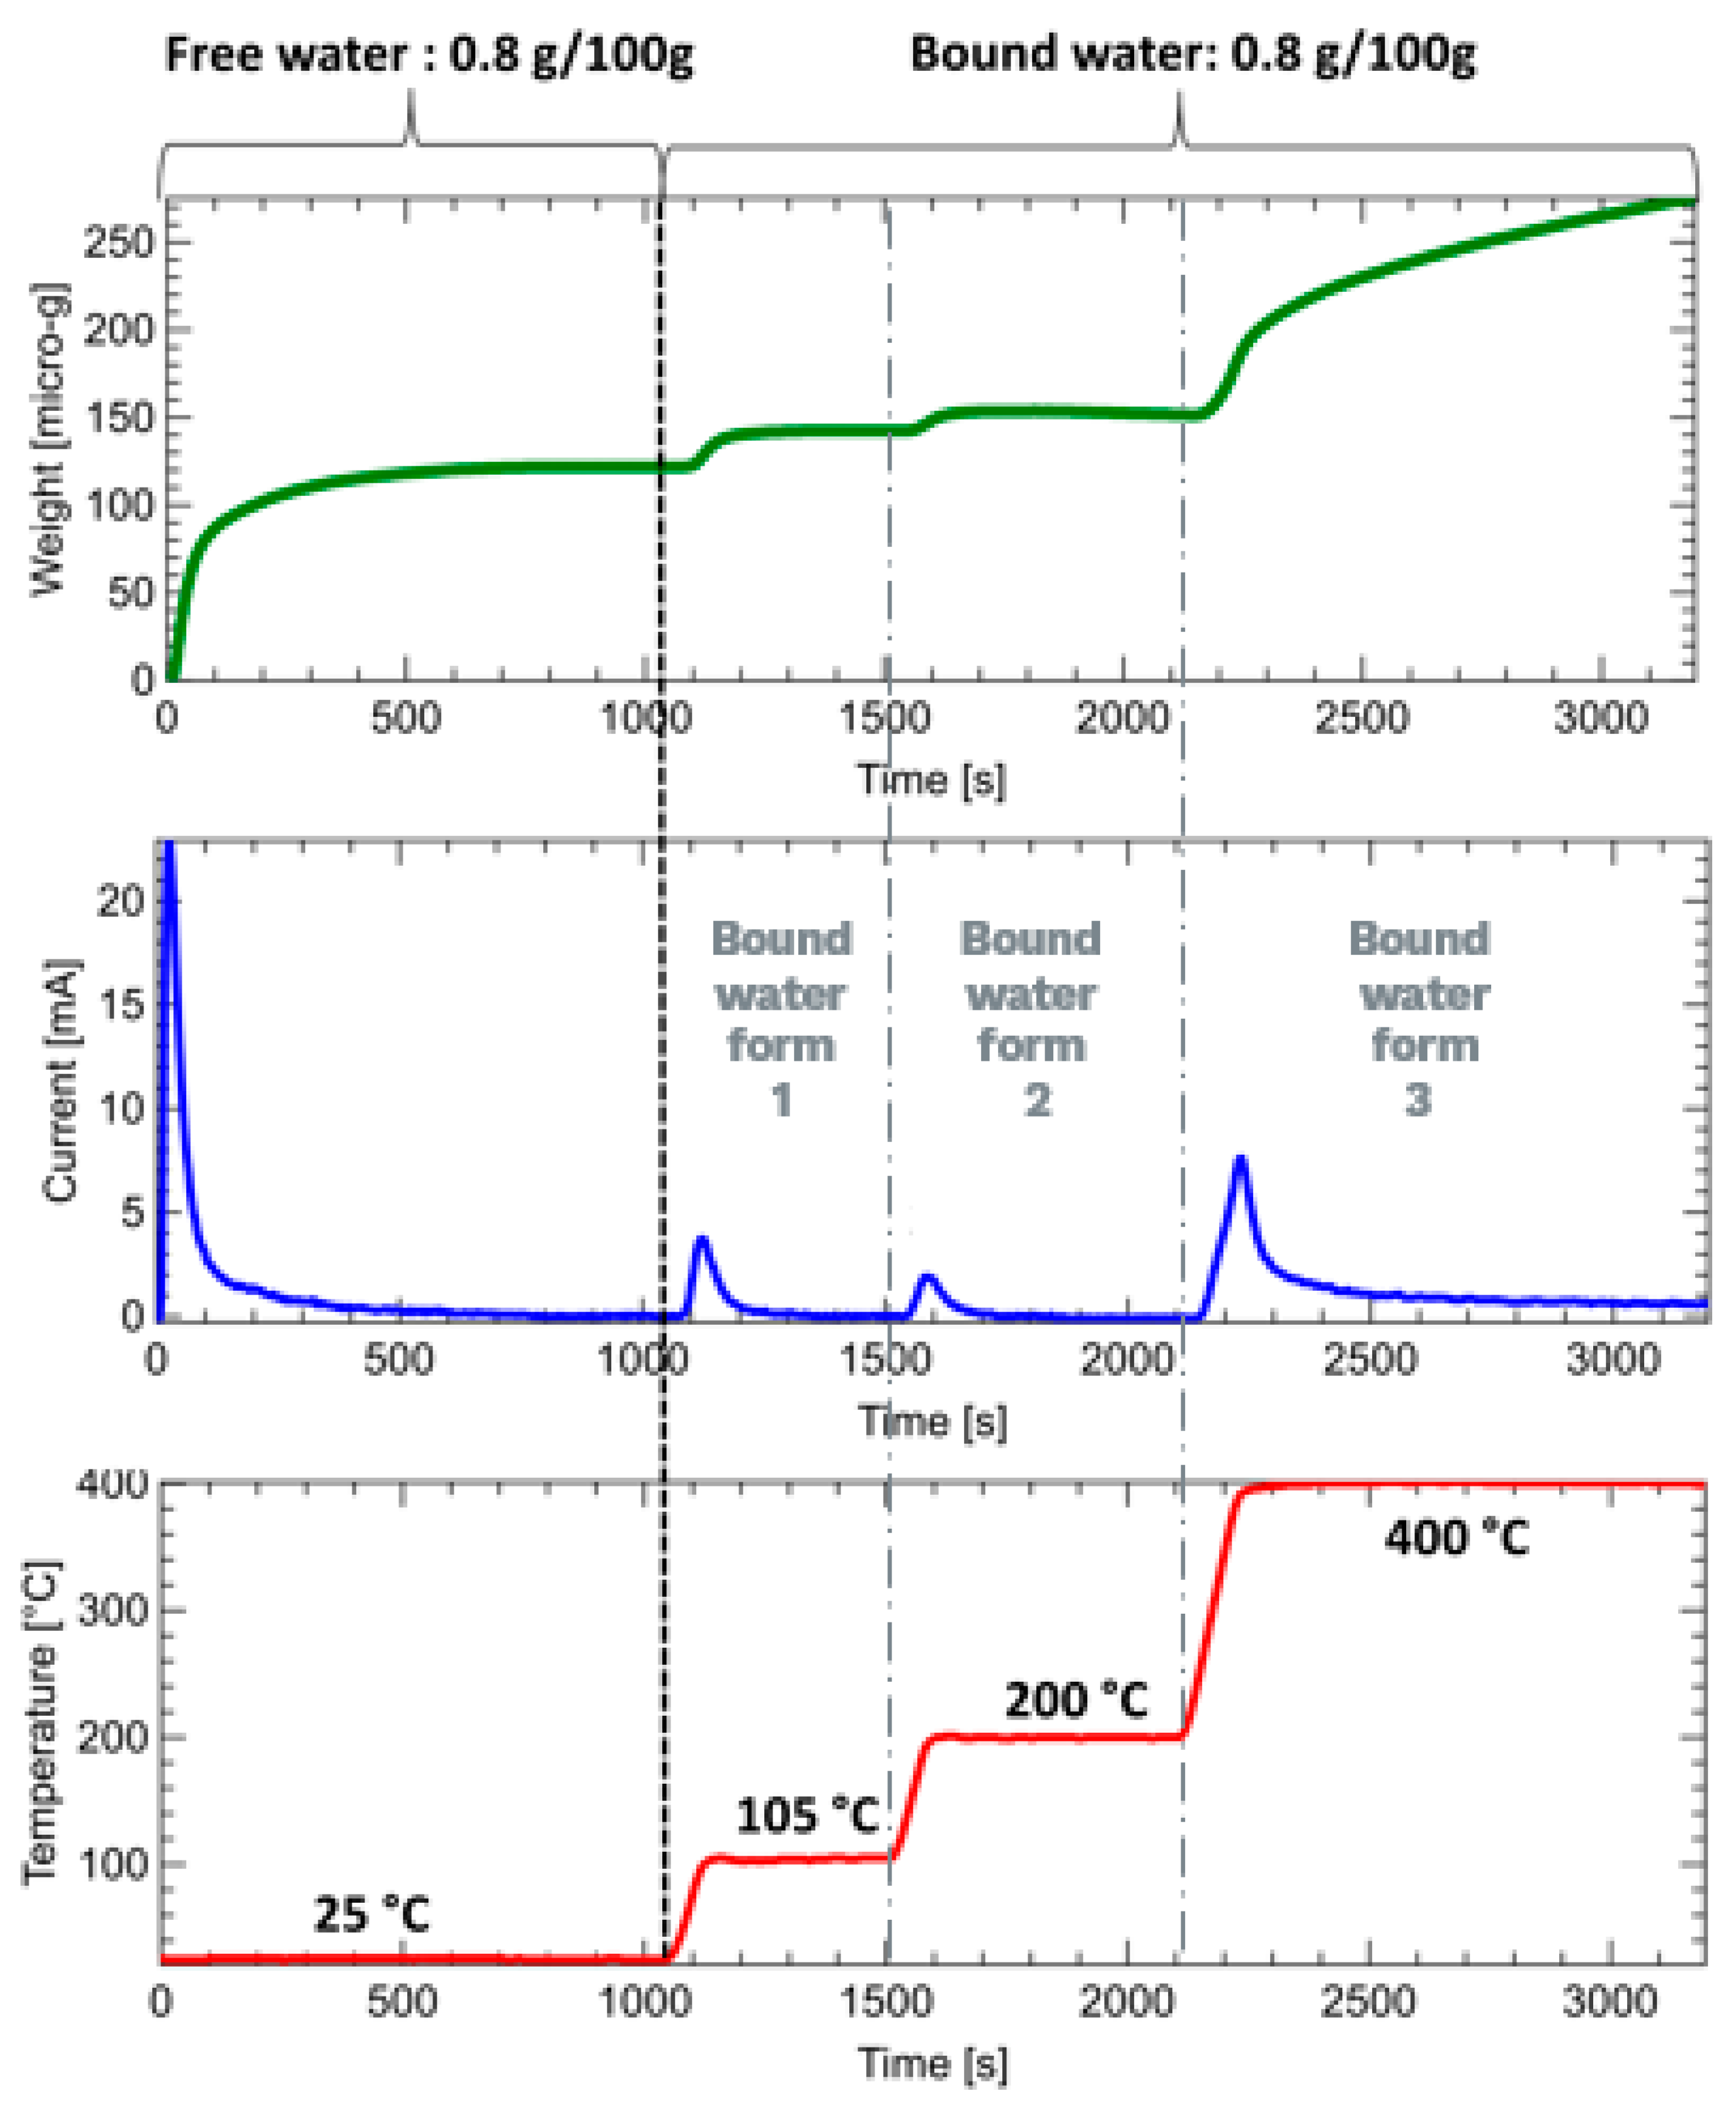
The differentiation of various forms of water bonding, such as free water and chemically bound water, is facilitated by this method (
Figure 4). The electrolysis of H₃PO₄ is commonly employed to measure low moisture levels, typically below 10%. Faraday’s law is essential in this approach as it describes the relationship between the electric charge passed through the electrochemical cell and the quantity of material dissolved at the electrodes. Utilising Faraday’s law, the water content in the sample can be determined based on the electric charge transmitted through the cell during the electrolysis process.
To enhance the measurement of trace water content in solid samples, a device called easyH
2O
® was developed by Berghof Products + Instruments GmbH (Eningen unter Achalm, Germany) [
14]. This instrument utilises the evolved water vapour coulometric analysis technique and comprises various components including a controlled system, the proprietary Berghof easyH
2O
® version 1 software for data registration, and a graphical display for real-time results (
www.berghof-instruments.com). The temperature profiles are adjustable within the range of ambient temperature to 400 °C, enabling the study of water evolution from the sample as a function of temperature. The reliability of the results depends on stable background currents, which are estimated from tare measurements and the displayed current value on standby.
During the analysis, the optimisation of the sample size and the total water content per sample is a process of paramount importance. This methodological consideration is crucial for ensuring the accuracy and reliability of moisture analysis results. The process commences with the placement of the sample within specialized containment units, commonly referred to as “boats”. These boats are designed to be chemically inert, thereby preventing any interaction with the sample that could skew the results.
The optimisation of the total water content per sample is critical in this process. This involves establishing a baseline for the moisture level that should be present in the sample to yield accurate and measurable results. For materials with inherently low moisture content, a larger sample might be necessary to ensure that the moisture level is within the detectable range of the instrument. Conversely, for high-moisture materials, smaller sample sizes may be sufficient and more practical. This is illustrated in
Figure 4.
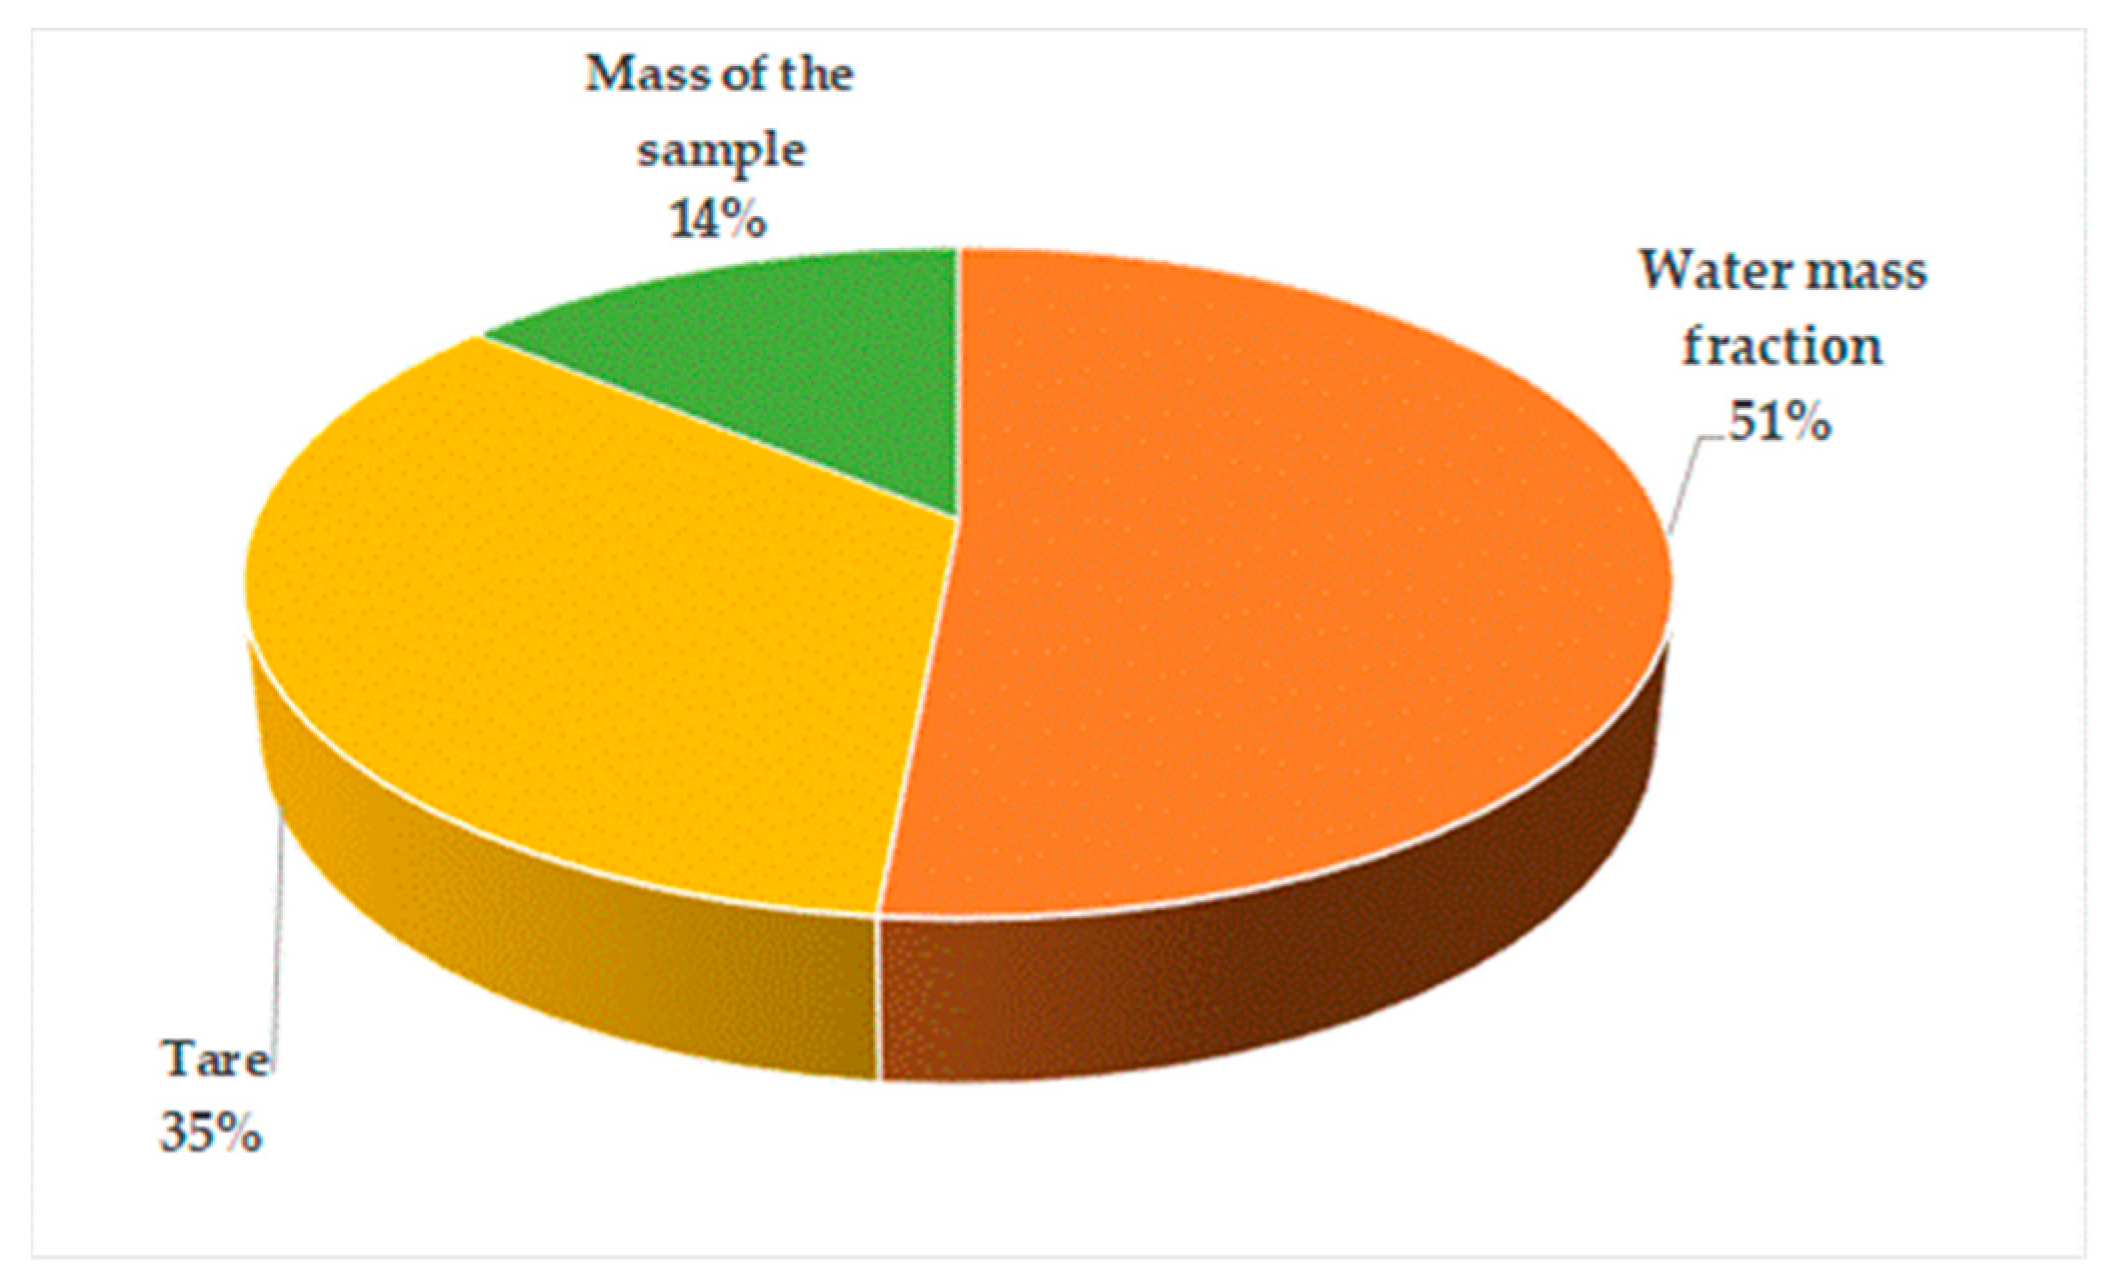
The temperature program is customised for each sample type to differentiate between different water-binding forms and control the release of water from the sample to avoid sensor saturation. The main uncertainty components in the analysis include the mass of the sample, tare determination, and water content measurement, which factors in repeatability, reproducibility, and bias.
LNE-CETIAT achieved typical uncertainties with wood pellets using this method, considering factors such as scale calibration, drift, resolution, experimental measurements, Archimedes buoyancy for the tray, and various uncertainties associated with tare determination and water content measurement. A comprehensive uncertainty budget detailing these aspects is presented in reference [
15]. See
Table 1 and
Figure 5.
To ensure traceability to SI (the International System of Units) for this equipment, two options can be considered: the use of certified reference materials or the utilisation of metrologically controlled humid gas. While certified reference materials with known water content are frequently used, their availability is often limited, and they may not always offer suitable values or materials that guarantee both SI traceability and well-characterised uncertainty [
16]. An alternative calibration approach is presented in [
17], which utilises the water content of humid gas with a defined dewpoint as a reference. This approach provides traceability to the SI through national humidity standards, offering a reliable foundation for calibration.
2.3. Verification of Reference Methods
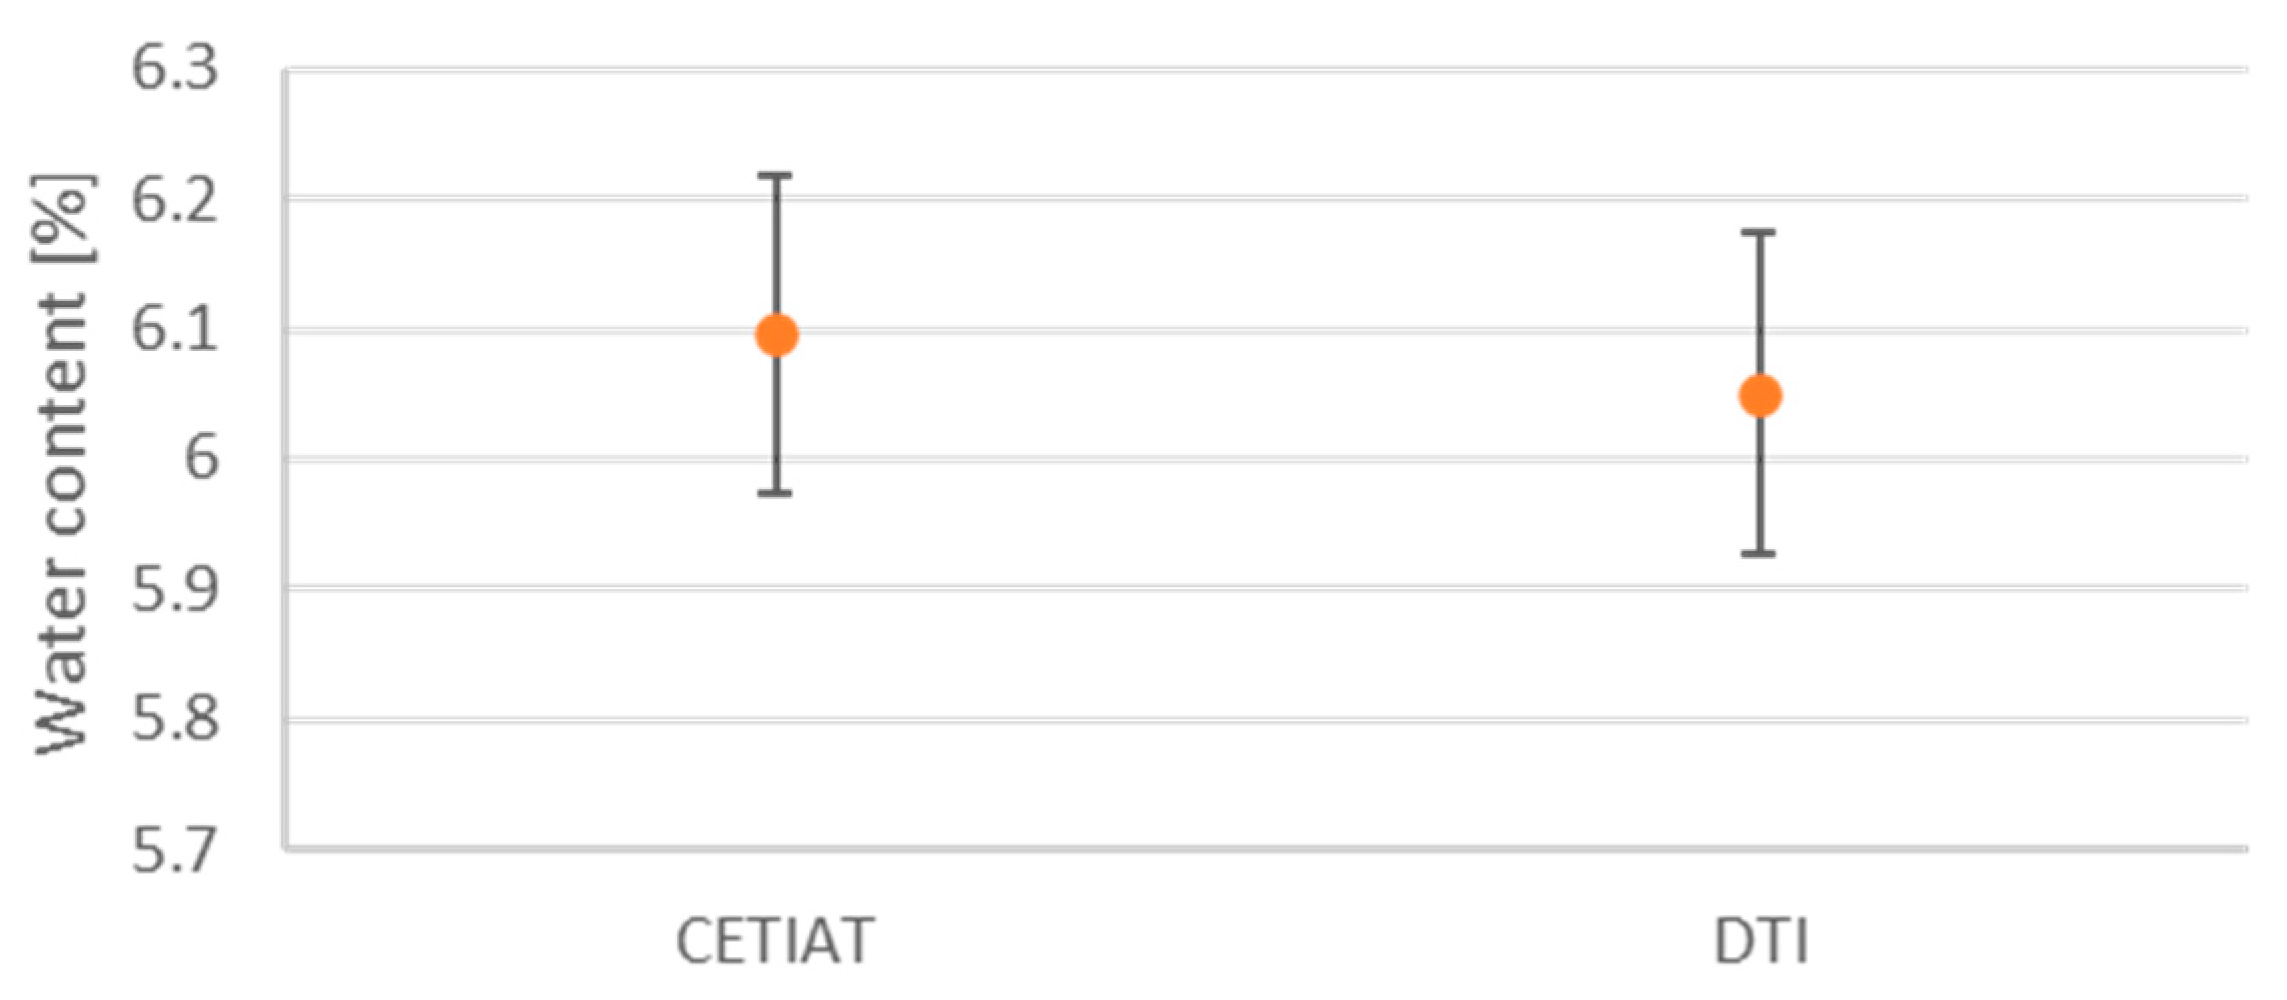
Verification is a critical part of developing reference methods, thus verifying that different methods yield the same result and securing confidence in the results, i.e., that the measurement principle is not distorted. To verify that the two reference methods measure identical values on identical samples, we performed a series of comparison measurements. This was completed by shipping wood pellets from DTI to LNE-CETIAT, letting both laboratories measure material from the same batch. To ensure that the transportation process of the sample material had no effect on the water content, an extra set of wood pellets was sent to LNE-CETIAT and returned to DTI, allowing DTI to also measure material that had been transported back and forth. Finally, the homogeneity of the batch was investigated by performing measurements on multiple sets of wood pellets from the same batch.
The results from the comparison are detailed in the BIOFMET project’s technical report, titled “D4: Report on traceable methods for the calibration of moisture transfer standards and reference materials” [
18] and reprinted in
Figure 6. These results confirm that the two reference methods yield statistically equivalent measurements in terms of water content.
Consequently, other water content measuring devices can use any of the two primary references for calibration and be sure that they will end up with the same results within the measurement uncertainty.
3. Transfer Standard (Electromagnetic Resonant Cavity) (LNE-CETIAT)
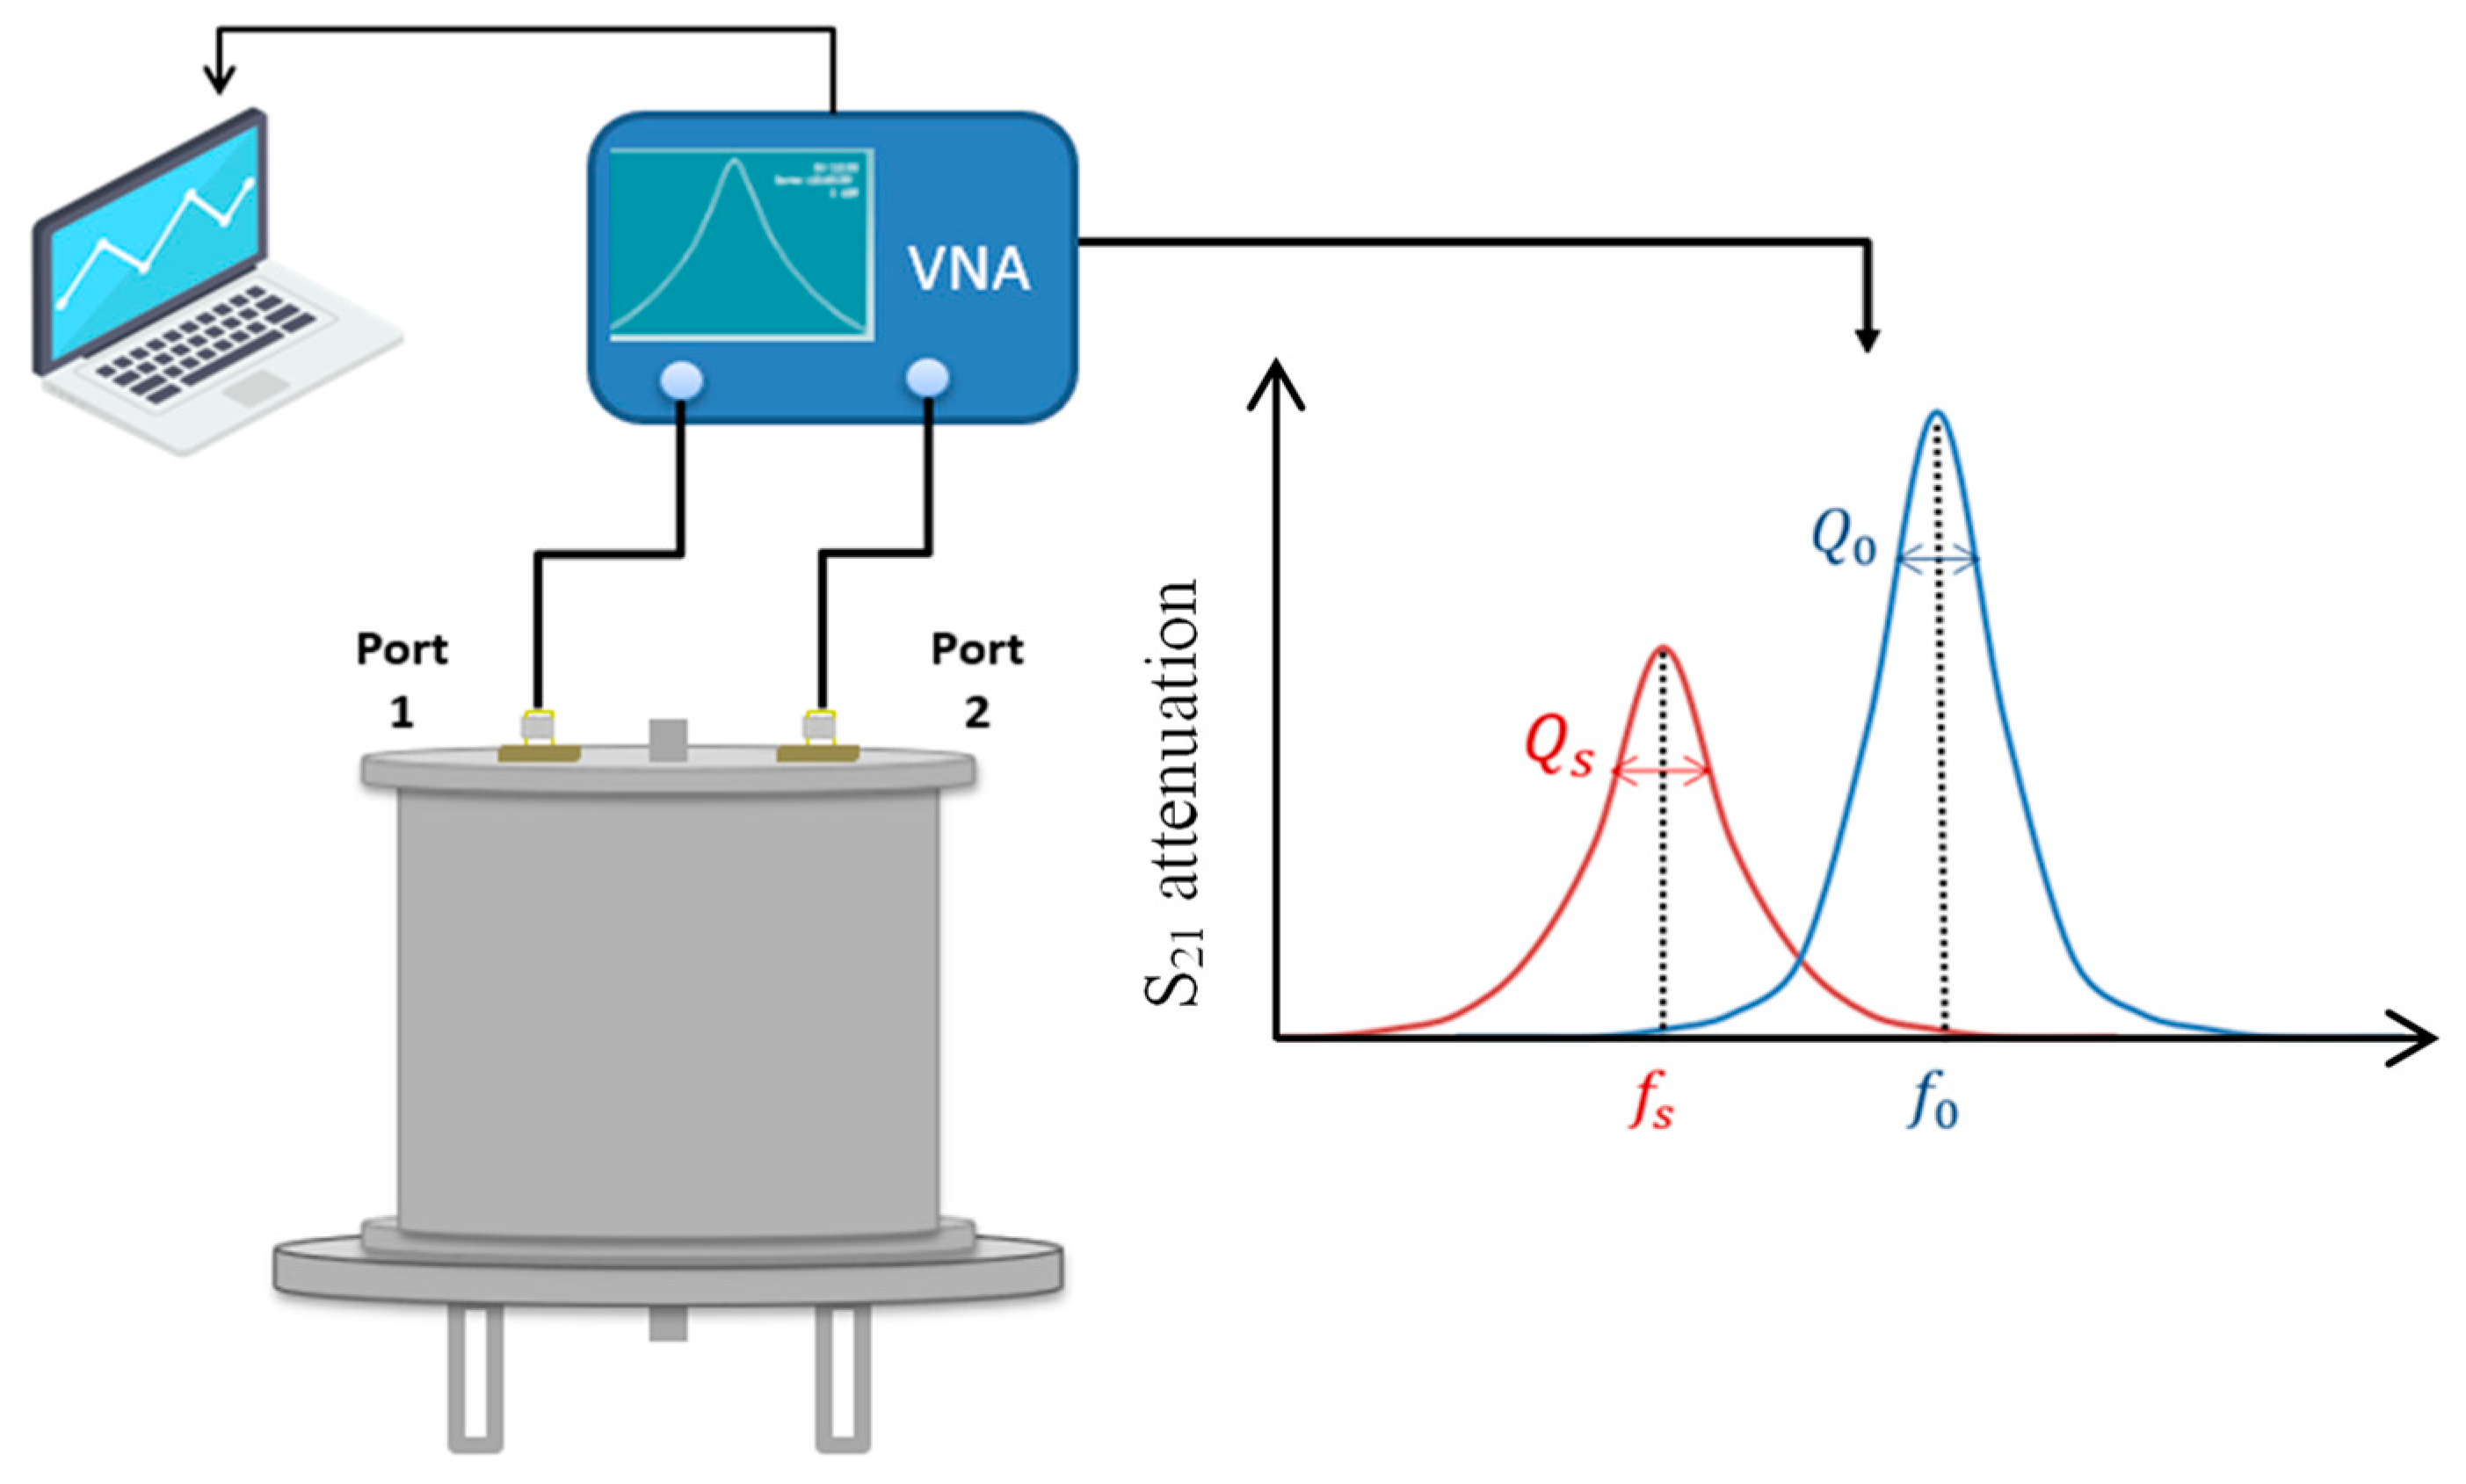
The transfer standard exploits the fact that the permittivity of water is much higher than that of dry wood, and consequently, a permittivity measurement can be employed to determine the water content. A key feature of this method is that it provides rapid results, in contrast to drying the sample. This is shown in
Figure 7 and
Figure 8.
Recent studies in resonance methods for dielectric property measurement have indeed showcased a wide range of applications beyond traditional materials. These methods have been employed in diverse domains such as pharmaceuticals for drug analysis [
19], the food industry for moisture content determination [
20], aerospace for composite material testing [
21], and electronics for characterising advanced semiconductor materials [
22]. This breadth of application underscores the versatility and adaptability of resonance methods in different research and industrial contexts. In the context of this project, LNE-CETIAT and the Fresnel Institute have collaborated to develop a resonant cavity using microwaves, which is based on the perturbation induced by the resonance frequency of the cavity. The cavity developed for this method is a closed, hollow cylinder made of stainless steel, featuring a cylindrical sample holder at its centre. The method used in this work is called the cavity perturbation method (CPM), which involves a comparative analysis of the electromagnetic properties between an empty cavity and a partially loaded cavity with the sample under analysis [
23]. The underlying hypothesis of CPM is that the introduction of a material affects the electromagnetic field inside the cavity, leading to observable variations in the electromagnetic field between the empty and loaded cavities [
24].
Maxwell’s equations are employed to derive analytical expressions for the real and imaginary parts of the complex dielectric permittivity, the resonance frequency shift, Δf, and the change in quality factor ΔQ [
25]. These expressions depend on various parameters such as the electric and magnetic fields in the empty and perturbed cavities, the permittivity and permeability of the sample, and the volumes of the cavity and the sample. A calibration constant C is also introduced, which can be determined experimentally using reference materials of known permittivity. Once this constant is known, the permittivity of an unknown material can be measured.
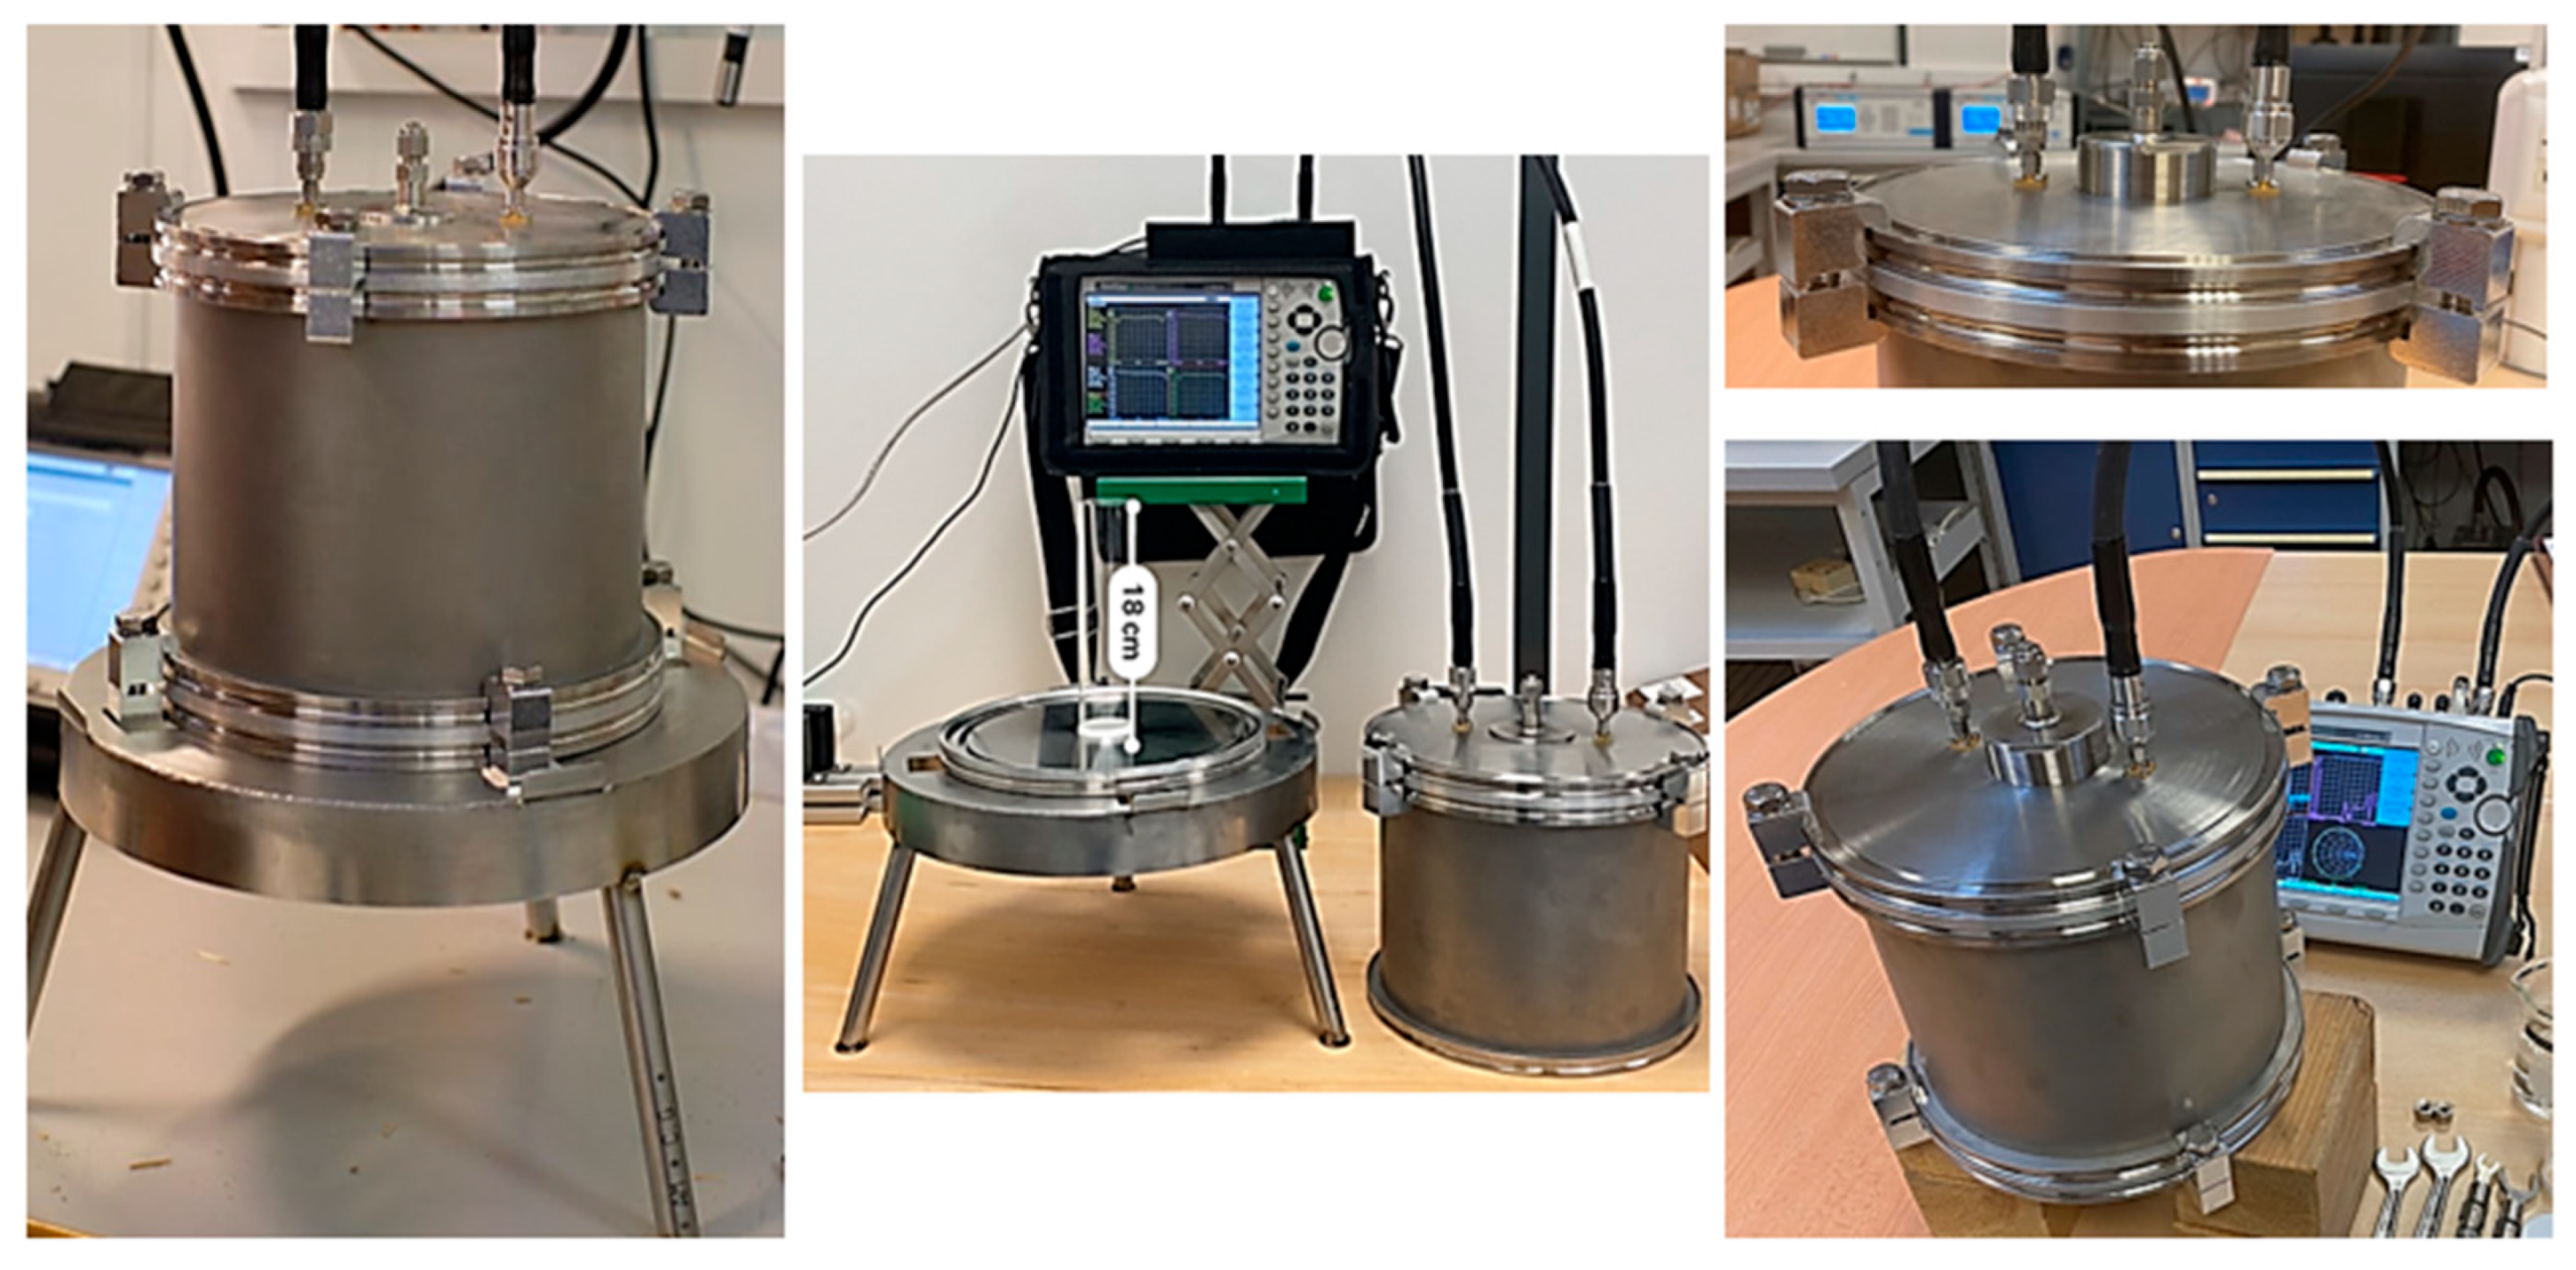
The developed system consists of a stainless steel cylinder with antennas on the upper side to excite the electromagnetic field inside the cavity. The sample holder, located at the centre of the cavity, is a glass tube. The system is connected to a vector network analyser that measures the attenuation inside the cavity, allowing for the determination of the resonance frequency and quality factor.
Numerical simulations using the HFFS software (Ansys 2023 R1) were performed to optimise the design of the measurement system. Experimental results were compared with the numerical simulations, and a configuration with two straight probes on the upper side, the TM010 mode, and a glass tube sample holder were found to be suitable based on the results of preliminary simulations. Details of this work are presented in a separate article [
26,
27].
Calibration of Transfer Standard (LNE-CETIAT)
To calibrate the electromagnetic resonant cavity and establish traceability for in-line instruments, we utilised the woodchip samples, as detailed in the following section. The calibration of the transfer instrument involved conducting parallel measurements: one using the DTI reference method of evolved water vapour dew point analysis evolved water vapour dew point analysis and the other measuring the frequency shift within the electromagnetic resonant cavity. Ten batches of wood chips, corresponding to five different water content levels ranging from 10% to 60%, were used for this work. These batches were subsequently designated to be reference batches. From this, we developed a calibration curve and a modelling curve, which enabled interpolation at any uncalibrated points and allowed for the averaging of statistical fluctuations.
The empirical model selected for the modelling is a polynomial fit, adjusted to the experimental data using ordinary least squares by using M-CARE software [
28]:
A numerical summary is presented in
Table 2. Specifically, it is reported that the discrepancy of the water mass fraction between the reference value and the cavity value, using the polynomial fit, ranges from −3.51 g/100 g to 4.08 g/100 g across the entire range of reference values, and ranges from −0.77 g/100 g to 0.22 g/100 g for the two unknown batches.
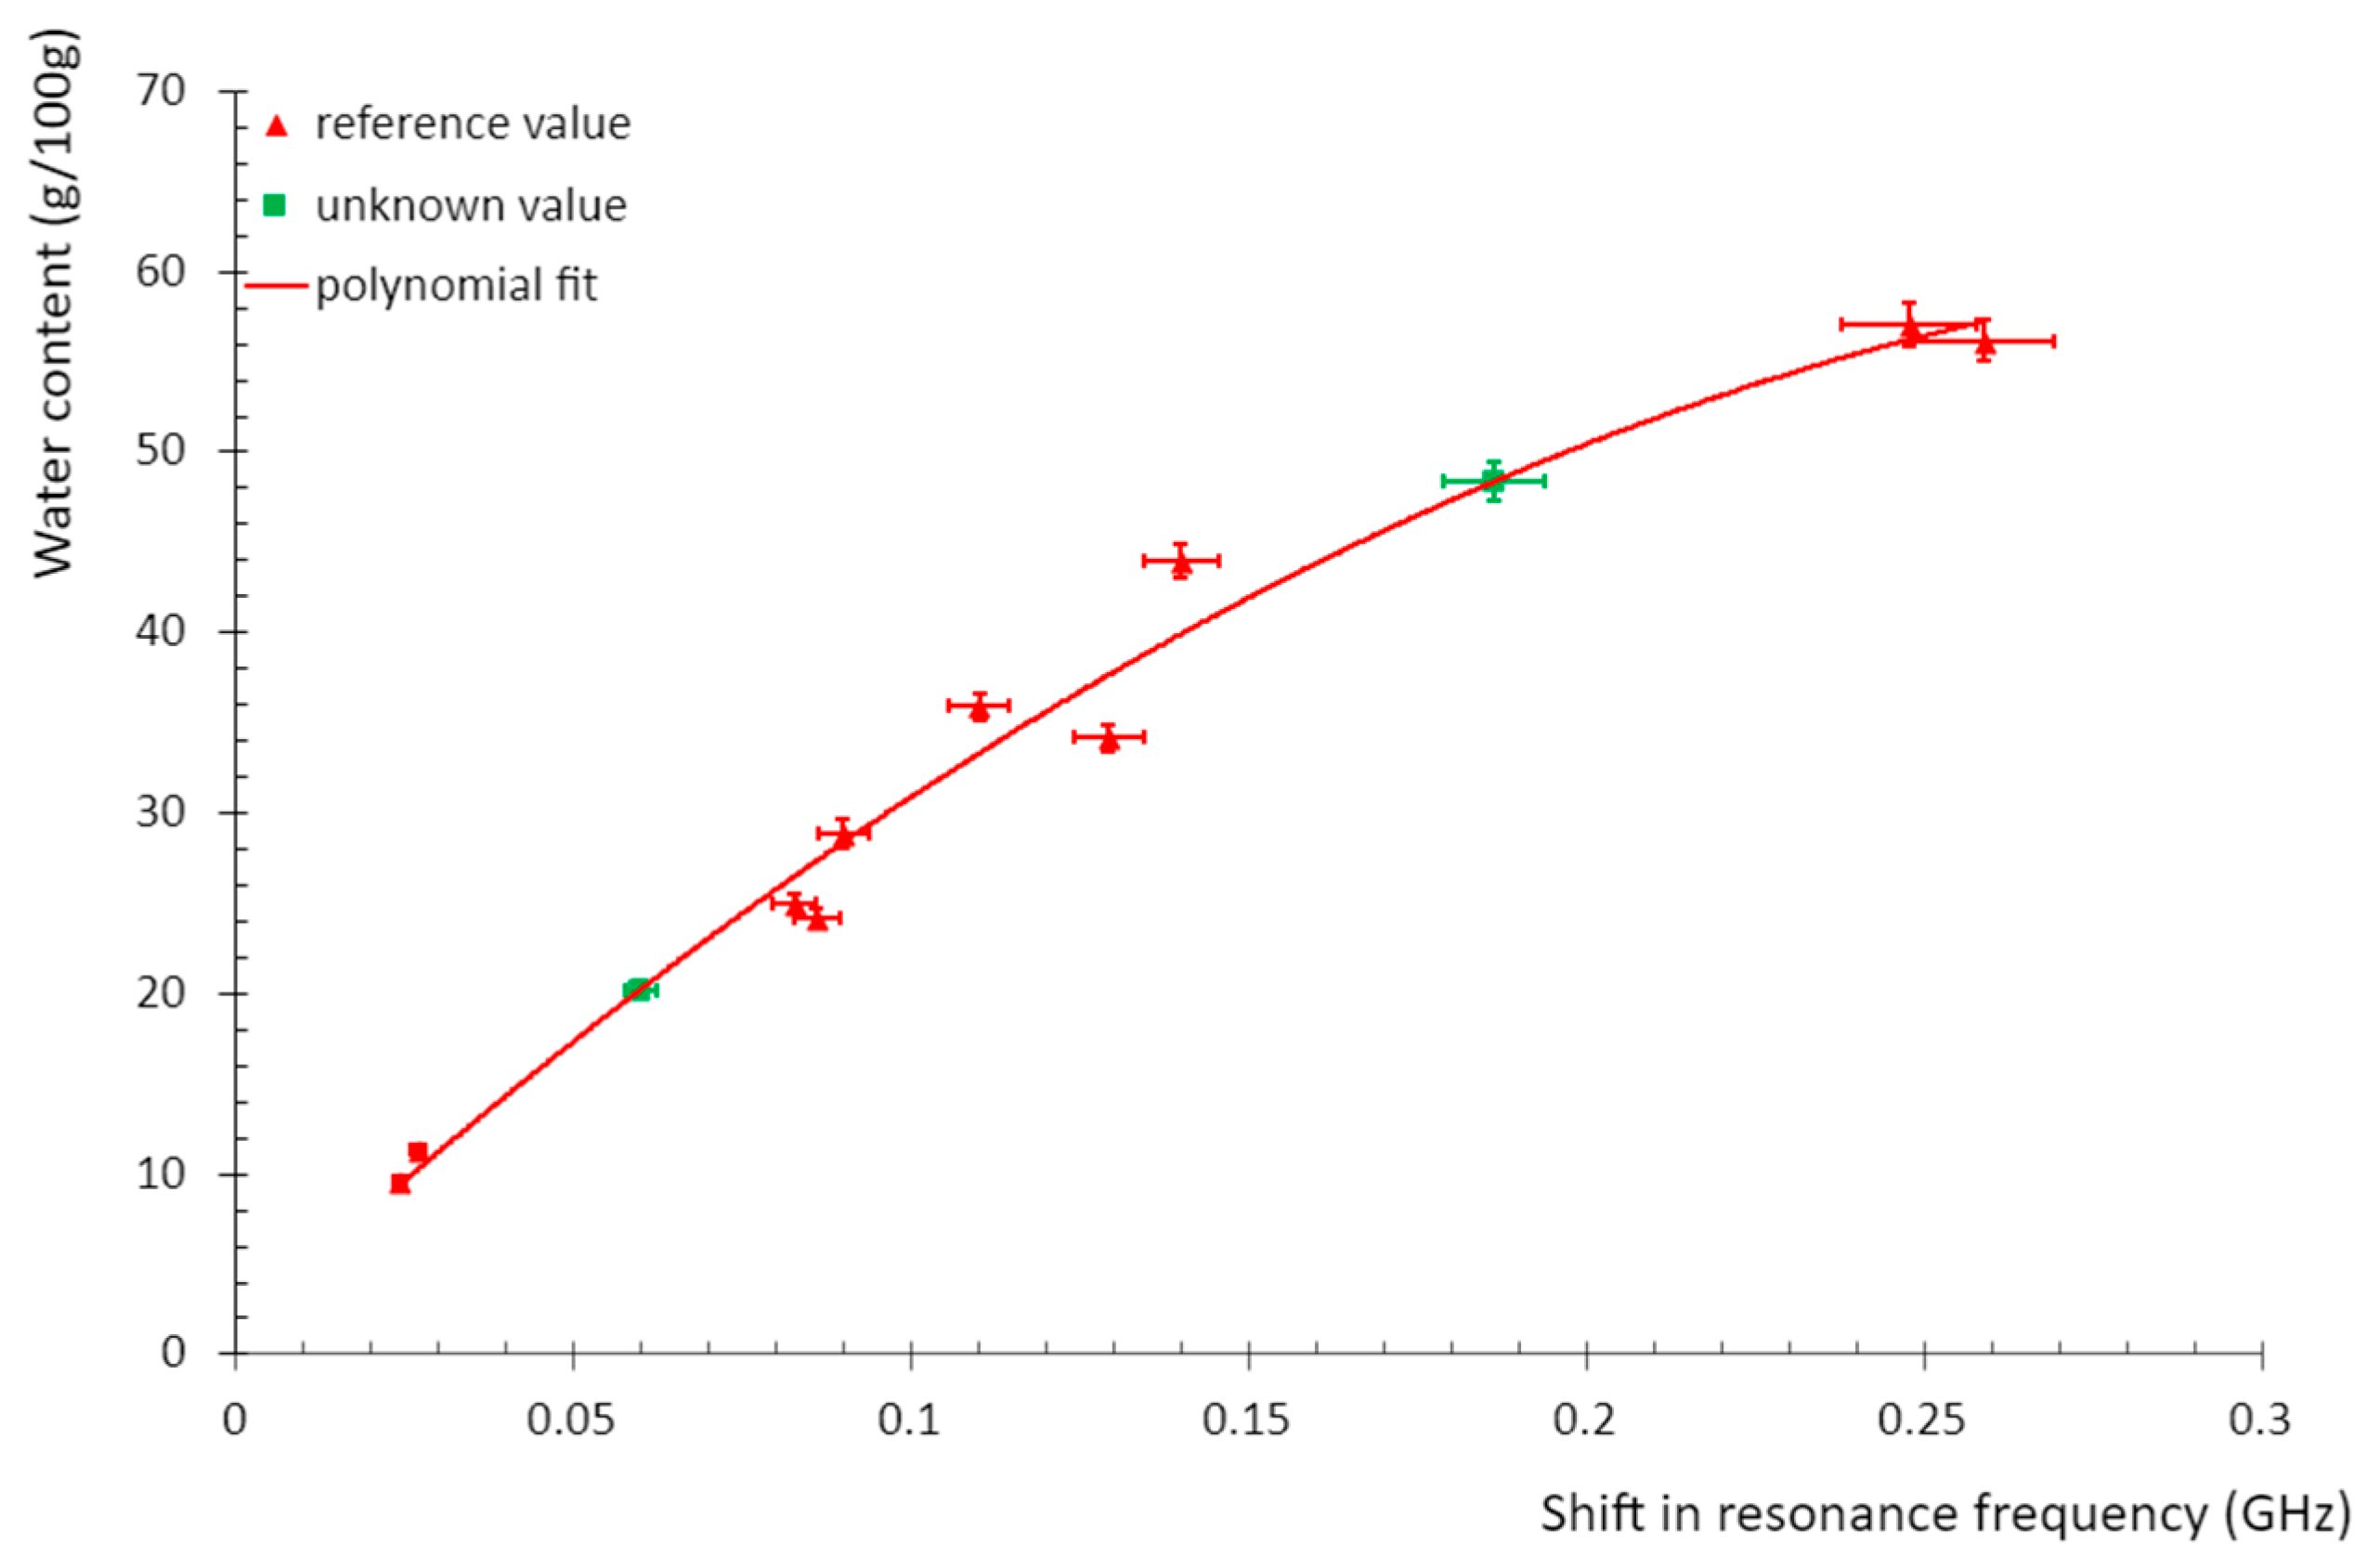
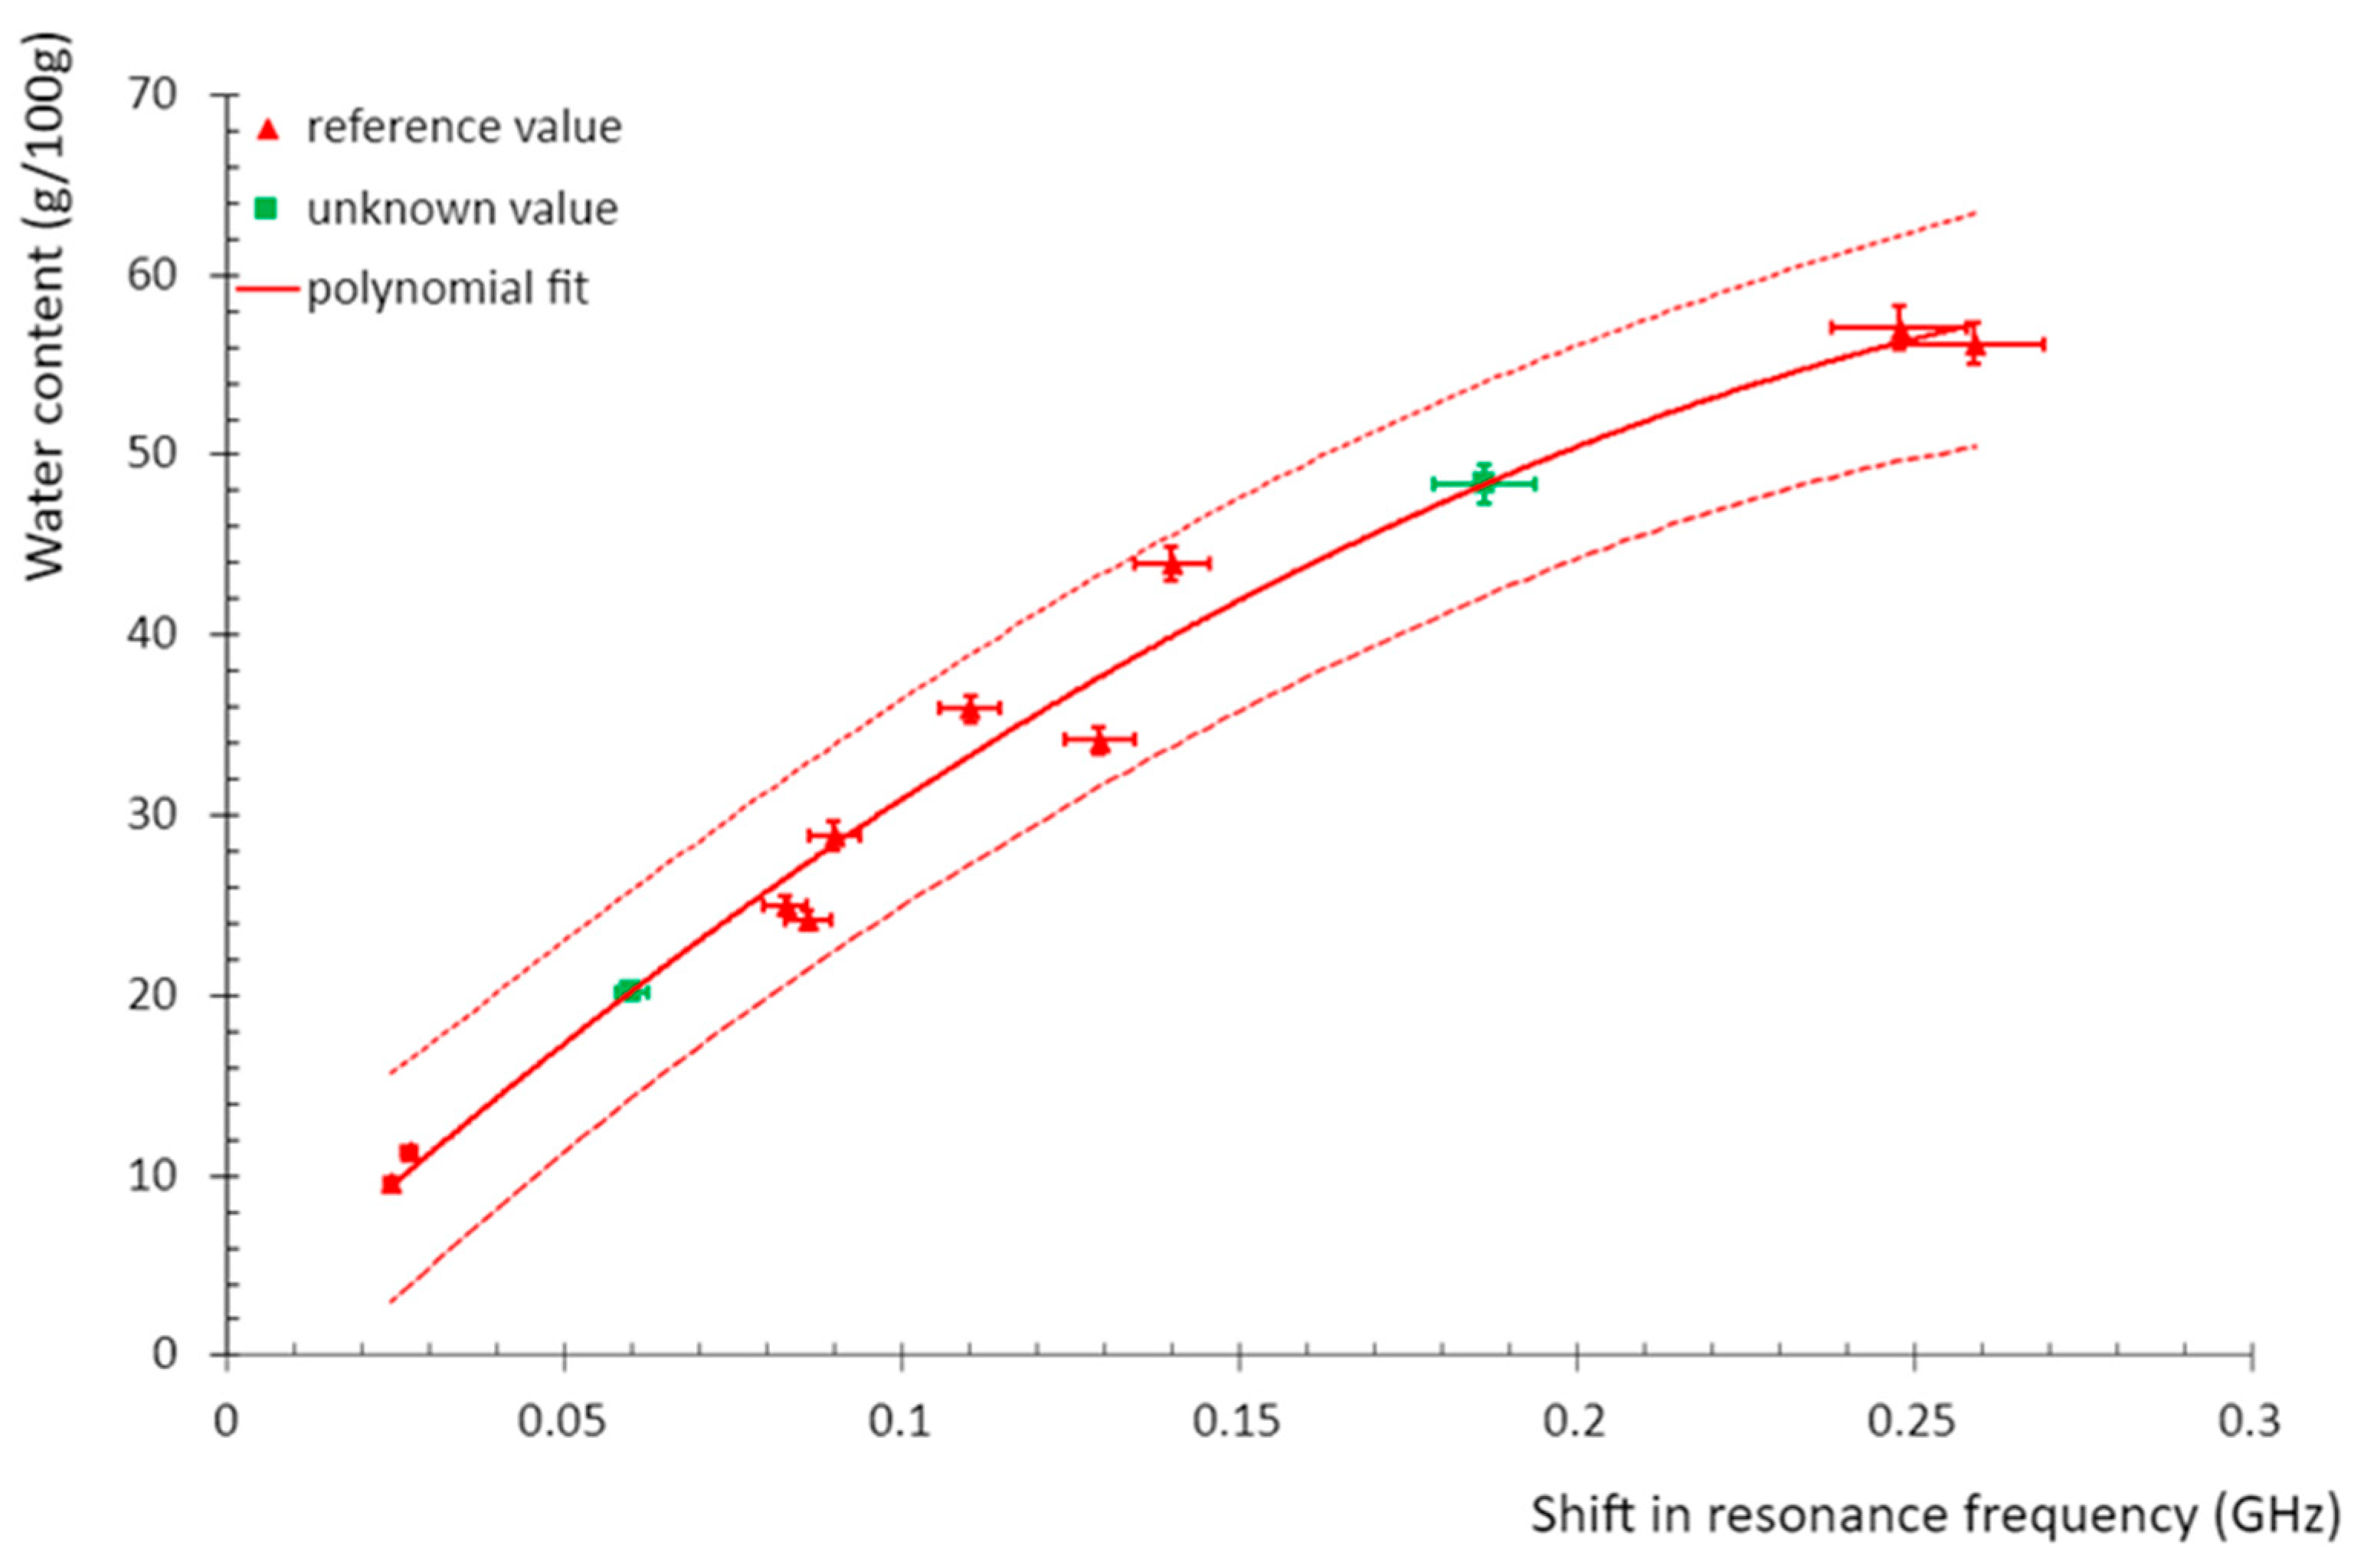
Later, the modelling curve was used to determine the reference value of the resonance cavity by correlating the frequency shift with the water content. The result of the calibration is given in
Figure 9.
4. Calibration of In-Line Measurement System at CPH Plant
The combined heating and power (CHP) plant of VERDO in the Danish town of Randers is largely fuelled by solid biofuel in the form of woodchips. The plant has a BERTHOLD microwave (MW) system installed at the conveyor belt, that transports biofuel to the boilers, to measure the water content of the fuel/woodchips ([
28], see also [
6,
29,
30,
31,
32,
33]). This system provides in-line, real-time measurements, and the result of these measurements is an important input for the control of the boilers because compensatory actions are required if significant variations in the water content of the woodchips occur. Therefore, it is important to invest a considerable amount of effort into improving the accuracy of the MW measurement system.
In the following, we describe the calibration of the above-described in-line MW measurement system at VERDO’s CHP. The goal of the calibration process is to make measurements with this system metrologically traceable to the basic definition of the relevant SI unit with the smallest possible uncertainty. In the present case, the SI unit relevant is the water mass fraction, i.e., the mass of the water divided by the mass of the original sample (i.e., wet basis). The basic calibration scheme consists of water content measurements on homogeneous test samples being performed with the in-line system and a reference method.
The in-line MW system for water content measurements at VERDO’s CHP plant is shown in
Figure 10 during the calibration process.
4.1. Samples
It is a requirement that the test sample material used for calibration is similar to the relevant biofuel used at the facility, i.e., woodchips in the present case. Furthermore, it is important that the water content of the test material spans the entire relevant measurement range. Finally, each subsample should be as homogeneous as possible as inhomogeneity will add to the uncertainty of the results.
The sample material chosen was a mixture of Picea Abies (Norway Spruce) and Picea Sitchensis (Sitka Spruce). The trunks had the bark removed and were subsequently chopped into relatively small woodchips. The fine chopping provided a significant advantage in relation to the handling and measurement process because it made it easier to mix and pack the woodchips homogenously, both when measured at the VERDO MW system and when using the transfer standard.
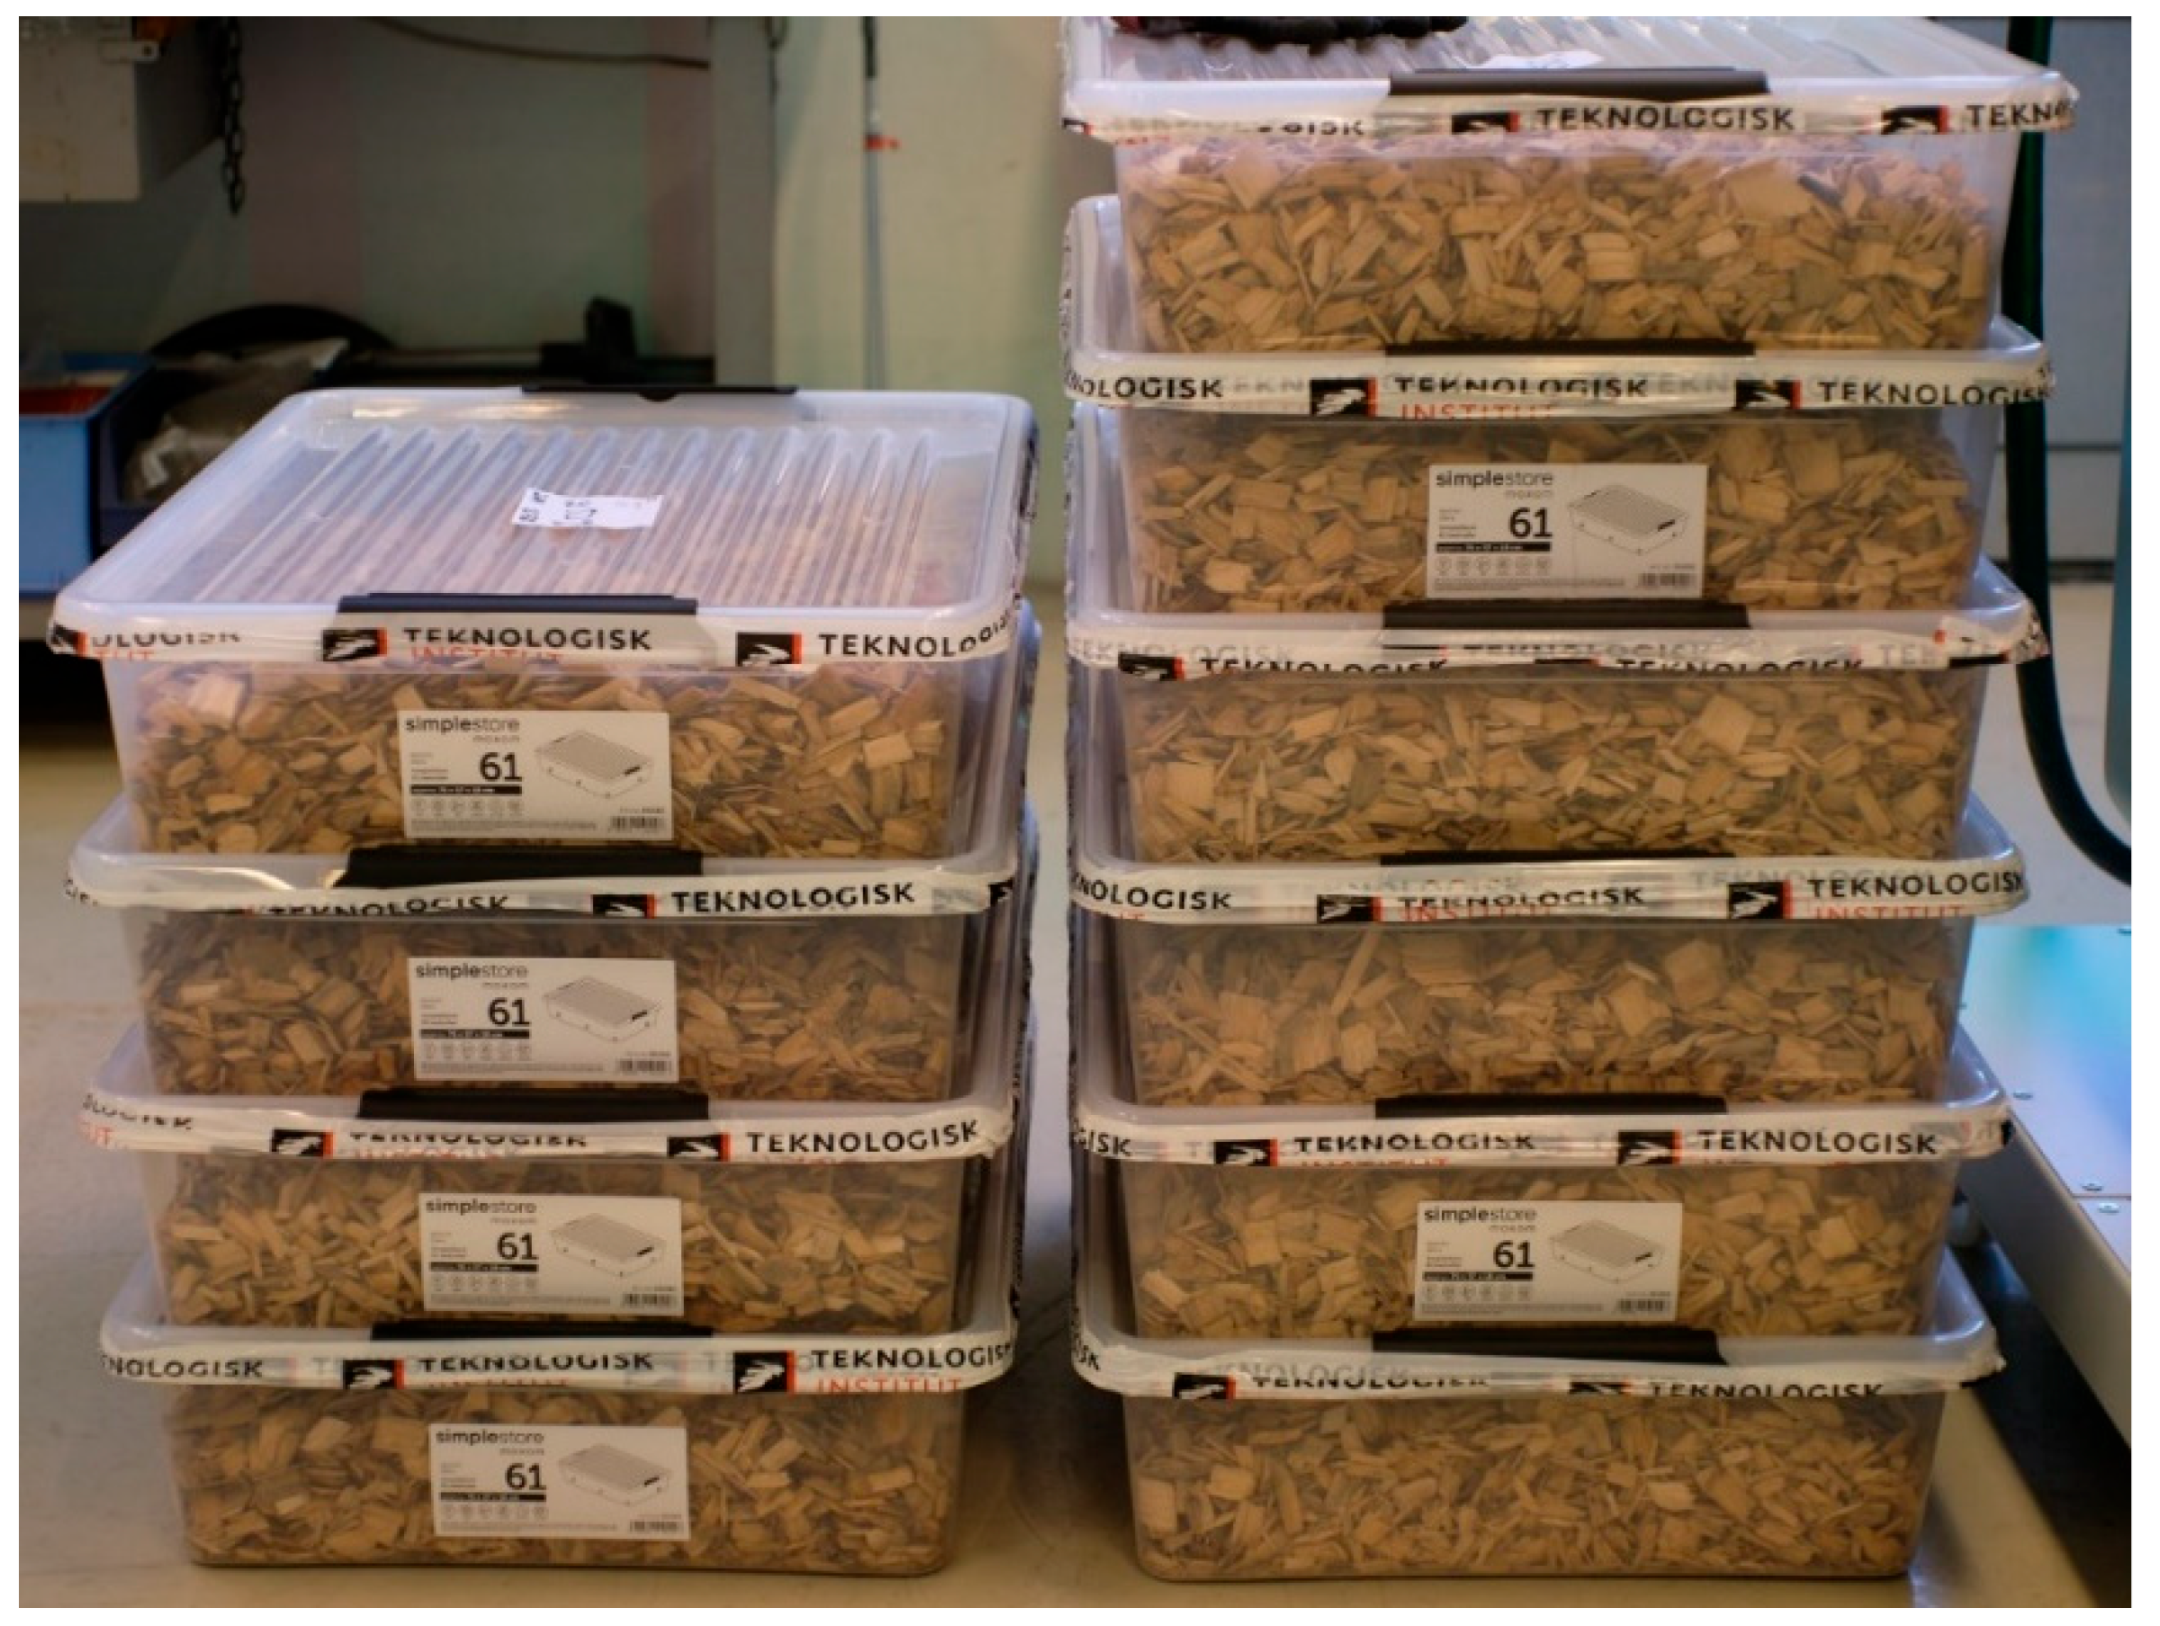
To span the entire measurement range of water content, five different samples were prepared, ranging in water content from 10% to 60%. Duplicates were produced of each moisture level and in addition, two samples of the original (i.e., unprepared) woodchips were included. Thus, in total, 12 samples were prepared. It was estimated that about 30 L was required for each measurement at VERDO, and to ensure a sufficient sample, 40 L was prepared. The test samples are shown in
Figure 11.
The different levels of water content of the test samples were produced by pre-drying and re-moisturising fractions of woodchips. This process was adopted for two reasons; firstly, to reach the required moisture levels, and secondly, to secure homogenous samples. From a batch of about 1 m3, woodchip fractions of 40 L were extracted. Each sample fraction was spread out over a large surface while being dried in an oven at 40 °C for approximately 24 h. The resulting moisture level was measured using loss-on-drying. The dry fractions were stored in sealed boxes until about 10 days prior to the VERDO measurements, and subsequently, the desired water content was reached by adding demineralised water while mixing the sample. The adoption of 10 days delay was made based on test experiments, that indicated that one week was sufficient time for the sample to absorb the added water.
4.2. Access to the In-Line System
Once the test samples were prepared, access to the in-line measurement system was required. Since the system is installed at conveyor belts, providing the fuel to the boilers, and the measurements needed for the calibration require that the belt be stopped, the feeding of fuel into the boilers is interrupted. Therefore, the calibration was performed while the CHP plant was undergoing maintenance, and the conveyor belt was stopped in any case. Approximately four hours in total were required for the measurements at the facility.
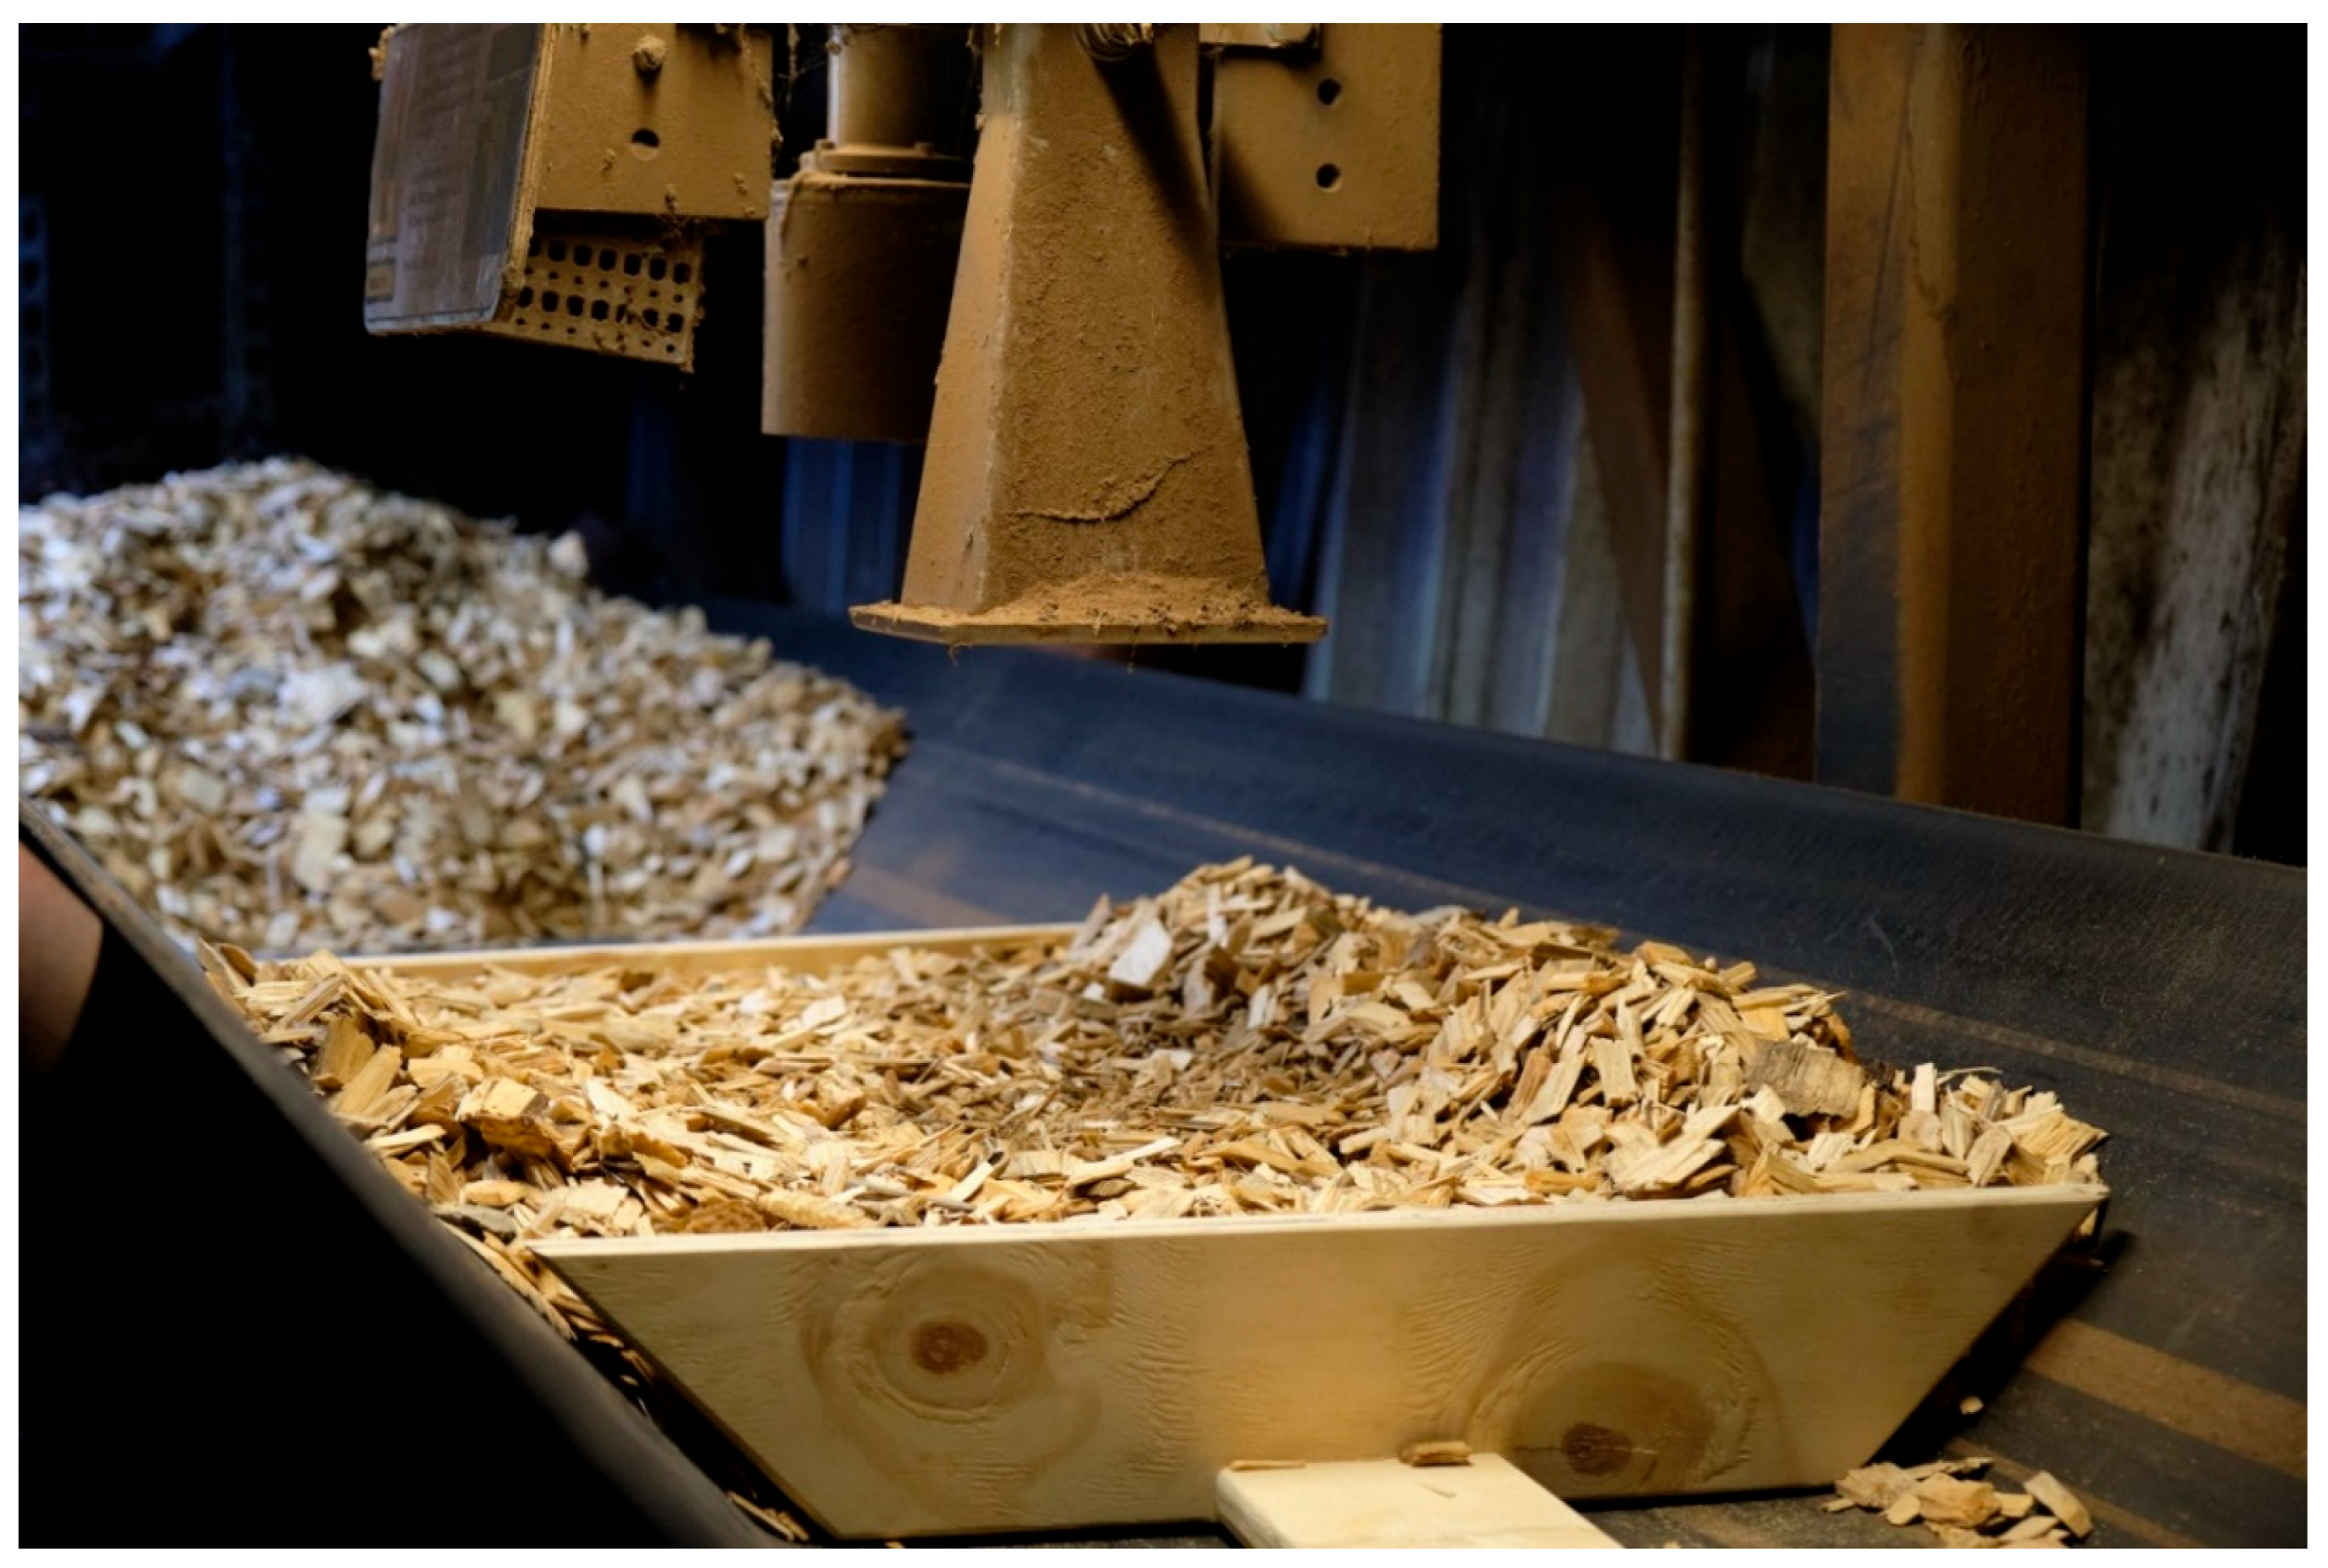
While the conveyor belt was stopped, the sample material was positioned on the belt at the position of the in-line measurement system. The tools shown in
Figure 10 were produced to ensure that the material was distributed in a uniform layer, as the output of the in-line systems was directly correlated to the load (kg/m
2) of woodchips on the belt. After the sample material had been placed, a measurement using the MW system was performed (average signal over 3 min), and a fraction of the sample material was extracted for the reference measurement. Rapid handling of samples is always a focus point during water content measurements because the samples should not be exposed to ambient conditions for too long—otherwise, the samples will exchange water with the atmosphere. About 10 min were required per sample in the present case.
4.3. Calibration of MW System at VERDO CHP Plant (LNE-CETIAT)
The transfer instrument, after successful calibration as previously described, was then utilised to extend SI traceability to the microwave (MW) measurement system at the CHP plant. This was accomplished through a calibration-by-comparison method, using the reference batches of wood chips to create a calibration curve. BERTHOLD, the manufacturer of the microwave instrument, establishes the correlation between moisture content and the signal’s phase shift and attenuation as follows.
The transfer instrument was successfully calibrated as shown above and subsequently used to disseminate SI traceability to the MW measurement system at the CHP plant. This was accomplished through a calibration by comparison method, using the reference batches of wood chips to establish a calibration curve. The manufacturer of the microwave instrument, BERTHOLD, provides the following correlation between moisture content and the signal’s phase shift and attenuation as follows:
By comparing the results obtained above for the transfer standard and the reading of the instrument to be calibrated (VERDO MW system), a calibration curve was established. The details and outcomes of this calibration are documented in
Table 3.
The coefficients
a,
b, and
c of the MW system can be adjusted to modify the instrument’s response and align it with the reference values obtained through the reference method. See
Table 4.
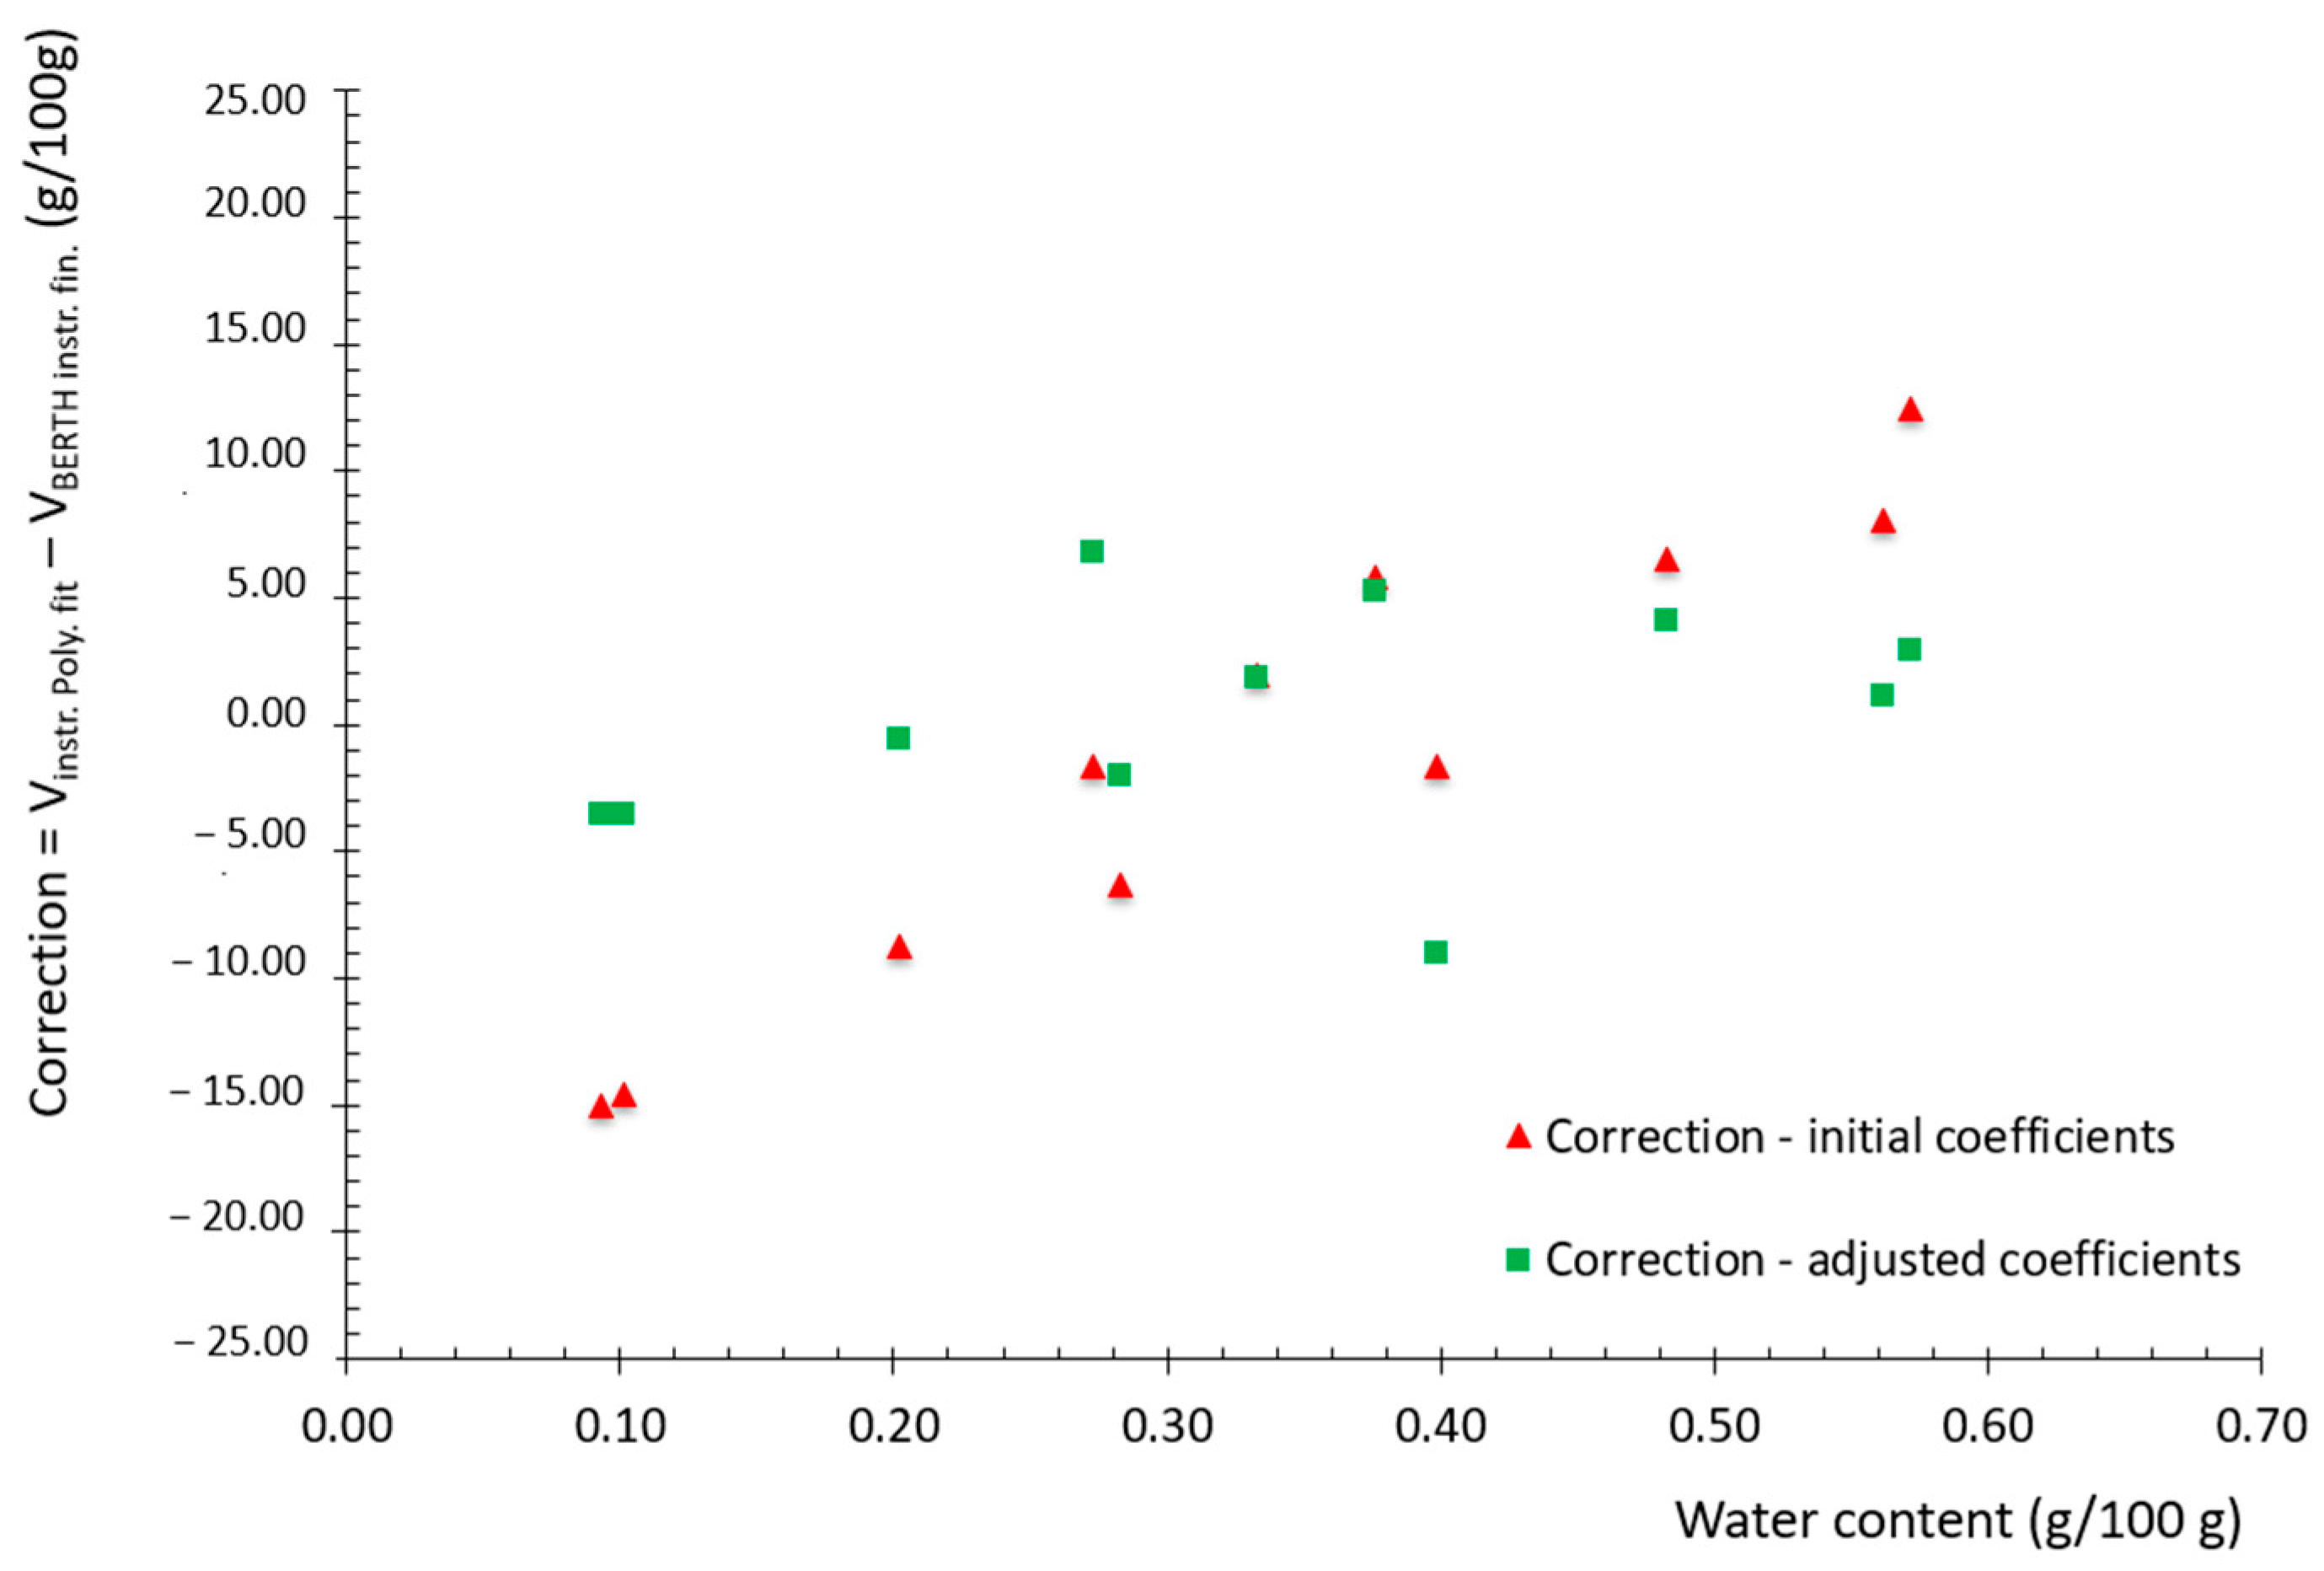
This adjustment allows for the calibration of the instrument, ensuring that its measurements are traceable based on the measurements provided by the transfer standard. This adjustment has been performed by using least mean squares leading to the result shown in
Figure 12.
The outputs of the measurement campaign strongly recommend adjusting the in-line instrument using this new set of coefficients. This adjustment is recommended to significantly improve its accuracy and to ensure traceability to the International System of Units (SI).
4.4. Reference Measurements
Reference values can be provided in two distinct ways, either using the primary reference or by means of the transfer standard. The advantage of using the primary reference is that the uncertainty of the measurements will be lower, as no extra level is brought into the calibration chain. However, measurements performed using a primary reference will generally take a long time, and therefore the calibration process will require a significant amount of time (about a month) before the result of the calibration is available. Furthermore, biofuels containing a significant amount of water (corresponding to a relatively large water activity) will typically be biologically active, and as a result, the water content may change, thus leading to increased uncertainty. The biological activity can be reduced by storing the test samples from measurements at the facility at cold temperatures (refrigerator or freezer) until the reference measurements can be carried out.
Alternatively, the transfer standard can be used. The advantage is that the measurements can be performed much faster, leading to a fast calibration result with fewer resources required. The disadvantage is that another level is introduced into the calibration chain, where the transfer standard itself must be calibrated against the primary standard, leading to added uncertainty in the result.
5. Uncertainty Analysis
An uncertainty analysis is performed as a required part of the calibration process for the in-line system. The uncertainty derives from the transfer standard and the additional uncertainty components, such as sample homogeneity and regression occurring between the reference and the in-line system.
5.1. Uncertainty of Transfer Standard
The measurement uncertainty of the transfer standard sets the lower limit for achieving a calibration uncertainty in the calibration chain.
The focus of the uncertainty analysis is primarily on the electromagnetic parameters related to measurements obtained using the vector network analyser (VNA), as well as contributions from coaxial lines and the resonant cavity. The methodology for this analysis largely follows the guidelines outlined in [
34]. Due to the extensive nature of this subject, it will be presented in a separate article. However, the overall uncertainty on the frequency shift measurement does not exceed the expanded relative uncertainty of 4% (relative to the frequency shift). By also taking account of the uncertainty related to the reference value provided by DTI, the experimental data can be presented as follows (
Table 5).
As previously mentioned, the empirical model was determined using the ordinary least squares method. By combining the uncertainties presented in
Table 5, the expanded uncertainty related to the calibration can be calculated. This calculation was performed using the M-CARE software [
28]. The culmination of this process, including the result of the expanded uncertainty, is presented in
Figure 13 and detailed in
Table 6.
Other Uncertainty Contributions
Homogeneity of the sample: The sample for the in-line system is 40 L, while the transfer standard uses much smaller samples. Consequently, any inhomogeneity in the 40 L used in the in-line system means repeatability will go down in the transfer standard. This inhomogeneity must be included as an uncertainty component in the combined uncertainty.
The magnitude of the homogeneity of the sample is found by taking multiple small samples from the 40 L used by the in-line system and performing LoD analysis on them. This reveals an average inhomogeneity of the sample of 0.26% water content.
Regression: Calibrating a system in multiple points allows us to perform a regression between the reference value and the value given by the in-line system, as explained in
Section 4.4. Analysing the residuals of the fit reveals a fitting uncertainty of 5.3%, which must be included in the uncertainty budget for the system.
5.2. Combined Uncertainty
Using the above three uncertainty components allows us to find a combined uncertainty for the in-line system. This is completed using the method described in GUM [
35] as
the text following an equation need not be a new paragraph. Please punctuate equations as regular text. The uncertainty budget is seen in
Table 7.
The uncertainty budget is a worst-case scenario as the uncertainty for the transfer standard is taken at 100% water content, where its expanded uncertainty is 4%: at, e.g., 50% water content, the expanded uncertainty for the transfer standard is only 2%, i.e., half. Furthermore, the regression uncertainty originates from the residuals of point measurements. When in use, the system will average the readings over several minutes, where residuals will be in either direction. As such, the average residual will be significantly smaller than the residual of a point measurement. In future calibrations, multiple measurements can be performed on material with the same water content. This will allow for the identification of the average measured value in that point, along with the uncertainty of the average value, which is significantly smaller than the uncertainty of a single point. If this is completed, the combined uncertainty will be able to neglect the randomness of the single measurement points, which is by far the biggest contributor.
Although the uncertainty might seem high, it should be compared to the uncalibrated system, where no traceability exists, and operators might trust results, which should have had a major correction before being presented to them. In
Table 3, it is seen that the uncalibrated system often gives errors higher than 10%, without the operator realising this.
6. Conclusions
In conclusion, this article has presented a complete traceability scheme for the calibration of an in-line water content measurement system at a combined heat and power (CHP) plant. The calibration provided reliability to the in-line measurement system, thereby helping to provide rapid, dependable data at the CHP plant for optimised boiler operation. The article demonstrates that traceability can be achieved using a primary reference method, either directly or through a transfer standard. We presented and compared two primary reference methods for measuring water content in solid biofuels, each based on distinct measurement techniques. The DTI reference method utilised a flow metering device, an oven, and a dew point hygrometer to extract and measure the water content: evolved water vapour dew point analysis. In contrast, the LNE-CETIAT reference method employs evolved water vapour coulometric analysis, selectively electrolysing water molecules from a solid matrix. The comparison measurements between these two methods confirmed their reliability and accuracy. A transfer standard, based on an electromagnetic resonant cavity, was used to calibrate the in-line microwave (MW) measurement system at a CHP plant. This standard provided traceability to a primary reference method standard. The calibration process involved comparing measurements performed on homogeneous test samples using the in-line MW system and a reference method. Careful consideration of sample selection and homogeneity was essential to reduce uncertainty in the calibration process, which was again crucial for obtaining optimal combustion efficiency and fair payment of biofuel. The presented traceability scheme and reference methods provide valuable tools for fast and reliable measurement of water content in solid biofuels, particularly solid biomass, wood pellets, and woodchips. With the increasing use of biomass and the focus on renewable energy sources, accurate measurement and characterisation of biofuels are essential. The traceability scheme ensures that measurements are linked to the SI system and meet metrological standards. This not only enables efficient utilisation of biofuels but also supports international trade and the achievement of sustainable development goals.
In the context of this study, which focuses on calibration techniques and uncertainty analysis for measuring water content in solid biofuels, a way forward might include the following.
Improving the accuracy and reliability of the in-line measurement systems used for determining moisture content. This may, e.g., include using the conveyor belt scale for load measurement, rather than the X-ray detector, which also would make it simple to optimise the calibration procedure.
Utilising more sophisticated data analysis tools and algorithms, possibly incorporating machine learning or artificial intelligence, to better interpret the measurement data and reduce uncertainties.
Investigating the limitations of the methodology used for calibration, e.g., with respect to sample material (variation in size and species in the sample material).
Overall, the research conducted in the EURAMET project 19ENG09 BIOFMET contributes to the advancement of traceable on-line/in-line measurements for water content in solid biofuels. By developing reliable measurement methods and transfer standards, the project aims to enhance the accuracy and reliability of in-line measurement systems, minimising process interruptions while ensuring traceability to the SI system.
Author Contributions
Conceptualisation, H.K., E.G., J.G.N., J.O.H., P.S. and H.S.; methodology, B.T., E.G., P.S., H.S. and H.K.; software, H.K., P.F.Ø. and B.T.; validation, P.F.Ø., H.K., H.S., J.N., J.O.H. and J.G.N.; formal analysis, H.K., H.S. and B.T.; investigation, B.T., H.K., P.S., E.G., J.N., J.G.N. and H.S.; resources, J.G.N., J.O.H. and H.S.; writing—original draft preparation, B.T., P.F.Ø., H.K., P.S. and E.G.; writing—review and editing, B.T., H.K., E.G., P.S. and J.N.; visualisation, B.T. and H.K.; supervision, E.G.; project administration, J.N., E.G. and H.K.; funding acquisition, J.N., E.G. and H.K. All authors have read and agreed to the published version of the manuscript.
Funding
This work is part of the 19ENG09 BIOFMET project. This project has received funding from the EMPIR program co-financed by the Participating States and from the European Union’s Horizon 2020 research and innovation program. We also acknowledge the French Metrology Network for its financial support.
Data Availability Statement
Conflicts of Interest
The authors declare no conflict of interest. The funders had no role in the design of the study; in the collection, analyses, or interpretation of data; in the writing of the manuscript, or in the decision to publish the results.
References
- European Commission. Sustainable and Optimal Use of Biomass for Energy in the EU beyond 2020; PricewaterhouseCoopers EU Services EESV’s Consortium: Sint-Stevens-Woluwe, Belgium, 2017. [Google Scholar]
- Council of the European Union. Communication from the Commission to the European Parliament, the Council, the European Economic and Social Committee and the Committee of the Regions; European Commission: Brussels, Belgium, 2014. Available online: https://eur-lex.europa.eu/legal-content/EN/TXT/?uri=COM:2014:15:FIN (accessed on 28 November 2023).
- Bobba, S.; Zinfollino, N.; Fissore, D. Model-based design of secondary drying using in-line near-infrared spectroscopy data. Dry. Technol. 2022, 15, 3186–3202. [Google Scholar] [CrossRef]
- Azmi, N.; Kamarudin, L.M.; Zakaria, A.; Ndzi, D.L.; Rahiman, M.H.F.; Zakaria, S.M.M.S.; Mohamed, L. RF-based moisture content determination in rice using machine learning techniques. Sensors 2021, 21, 1875. [Google Scholar] [CrossRef]
- Austin, J.; Rodriguez, S.; Sung, P.F.; Harris, M. Utilizing microwaves for the determination of moisture content independent of density. Powder Technol. 2013, 236, 17–23. [Google Scholar] [CrossRef]
- Julrat, S.; Trabelsi, S. In-line microwave reflection measurement technique for determining moisture content of biomass material. Biosyst. Eng. 2019, 188, 24–30. [Google Scholar] [CrossRef]
- ISO 18134-1:2022; Solid biofuels—Determination of moisture content—Part 1: Reference method. ISO: Geneva, Switzerland, 2022.
- ISO 18134-2:2015; Solid Biofuels—Determination of moisture content—Oven dry method—Part 1: Total moisture—Reference method. ISO: Geneva, Switzerland, 2015.
- Samuelsson, R.; Nilsson, C.; Burvall, J. Sampling and GC-MS as a method for analysis of volatile organic compounds (VOC) emitted during oven drying of biomass materials. Biomass Bioenergy 2006, 30, 923–928. [Google Scholar] [CrossRef]
- Samuelsson, R.; Burvall, J.; Jirjis, R. Comparison of different methods for the determination of moisture content in biomass. Biomass Bioenergy 2006, 30, 929–934. [Google Scholar] [CrossRef]
- Leito, I.; Jalukse, L. Literature Survey of the Factors Determining the Uncertainty of Coulometric Karl Fischer Titration Method. Available online: https://sisu.ut.ee/sites/default/files/measurement/files/coulometric_kf_titration_measurement_uncertainty_sources_survey.pdf (accessed on 28 November 2023).
- Fischer, K. Neues Verfahren zur maßanalytischen Bestimmung des Wassergehaltes von Flüssigkeiten und festen Körpern. Angew. Chem. 1935, 48, 394–396. [Google Scholar] [CrossRef]
- Østergaard, P.F.; Nielsen, J. SI-Traceable water content measurements in solids, bulks, and powders. Int. J. Thermophys. 2018, 39, 1–13. [Google Scholar] [CrossRef]
- Berghof. easyH2O System for Chemical-Free, Thermo-Coulometric Water Detection: User Manuel; Berghof: Eningen unter Achalm, Germany, 2004. [Google Scholar]
- Aro, R.; Ayoub, M.W.B.; Leito, I.; Georgin, É. Moisture in Solids: Comparison between Evolved Water Vapor and Vaporization Coulometric Karl Fischer Methods. Int. J. Thermophys. 2020, 41, 113. [Google Scholar] [CrossRef]
- Aro, R.; Ayoub, M.W.B.; Leito, I.; Georgin, É.; Savanier, B. Calibration and Uncertainty Estimation for Water Content Measurement in Solids. Int. J. Thermophys. 2020, 42, 42. [Google Scholar] [CrossRef]
- Bell, A.S.; Miao, P.; Carrol, A.P. Novel Calibration Technique for a Coulometric Evolved. Int. J. Thermophys. 2018, 39, 50. [Google Scholar] [CrossRef]
- Georgin, E.; Tallwai, B.; Kjeldsen, H.; Østergaard, P.F.; Strauss, H.; Nielsen, J.; Sabouroux, P.; Voldan, M.; Strnad, R.; Libor Husník, L. D4: Report on Traceable Methods for the Calibration of Moisture Transfer Standards and Reference Materials. 2023. Available online: https://www.biofmet.eu/ (accessed on 28 November 2023).
- Niederquell, A.; Dujovny, G.; Probst, S.E.; Kuentz, M. A Relative Permittivity Approach for Fast Drug Solubility Screening of Solvents and Excipients in Lipid-Based Delivery. J. Pharm. Sci. 2019, 108, 3457–3460. [Google Scholar] [CrossRef]
- Henry, F.; Gaudillat, M.; Costa, L.C.; Lakkis, F. Free and/or bound water by dielectric measurements. Food Chem. 2003, 82, 29–34. [Google Scholar] [CrossRef]
- Chao, H.W.; Hsu, H.C.; Chen, Y.R.; Chang, T.H. Characterizing the dielectric properties of carbon fiber at different processing stages. Sci. Rep. 2021, 11, 17475. [Google Scholar] [CrossRef]
- Lobato-Morales, H.; Corona-Chavez, A.; Murthy, D.V.B.; Olvera-Cervantes, J.L. Complex permittivity measurements using cavity perturbation technique with substrate integrated waveguide cavities. Rev. Sci. Instrum. 2010, 81, 064704. [Google Scholar] [CrossRef]
- Kilic, E.; Siart, U.; Wiedenmann, O.; Faz, U.; Ramakrishnan, R.; Saal, P.; Eibert, T.F. Cavity Resonator Measurement of Dielectric Materials Accounting for Wall Losses and a Filling Hole. IEEE Trans. Instrum. Meas. 2013, 62, 401–407. [Google Scholar] [CrossRef]
- Catalá-Civera, J.M.; Canos, A.J.; Plaza-Gonzalez, P.; Gutierrez, J.D.; Garcia-Banos, B.; Penaranda-Foix, F.L. Dynamic Measurement of Dielectric Properties of Materials at High Temperature During Microwave Heating in a Dual Mode Cylindrical Cavity. IEEE Trans. Microw. Theory Tech. 2015, 63, 2905–2914. [Google Scholar] [CrossRef]
- Kittiamornkul, N.; Chamnongthai, K.; Jirasereeamornkul, K.; Higuchi, K. A system of microwave cylindrical cavity resonator for granular material dielectric measurement using two waveguide transmitters. In Proceedings of the SICE Annual Conference 2010, Taipei, Taiwan, 18–21 August 2010; pp. 1888–1891. [Google Scholar]
- Pozar, D. Microwave Engineering; John Wiley & Sons: Hoboken, NJ, USA, 2012. [Google Scholar]
- Tallawi, B. Développement d’une infrastructure métrologique française pour assurer la traçabilité au SI des mesures d’humidité dans les solides. Ph.D. Thesis, Aix Marseille Université, Marseille, France, 2023. [Google Scholar]
- Meng, B.; Booske, J.; Cooper, R. Extended Cavity Perturbation Technique to Determine the Complex Permittivity of Dielectric Materials. IEEE Trans. Instrum. Meas. 1999, 48, 1031–1037. [Google Scholar]
- CETIAT; Mu, D.; TRESCAL. M-Care Modélisation des Résultats d’étalonnage. 2013. Available online: https://www.cfmetrologie.com/fr/modelisation-des-resultats-d-etalonnage (accessed on 28 November 2023).
- Berthold. Microwave Transmission Meassurement Systems from Berthold Technologies. Berthold Technologies GmbH & Co.KG. 2024. Available online: https://www.berthold.com/en/process-control/microwave-transmission-measurement/ (accessed on 8 January 2024).
- McKeown, M.S.; Trabelsi, S.; Tollner, E.W. Effect of temperature and material on sensing moisture content of pelleted biomass through dielectric properties. Biosyst. Eng. 2016, 149, 1–10. [Google Scholar] [CrossRef]
- McKeown, M.S.; Trabelsi, S.; Nelson, S.O.; Tollner, E.W. Microwave sensing of moisture in flowing biomass pellets. Biosyst. Eng. 2017, 155, 152–160. [Google Scholar] [CrossRef]
- Olkkonen, M.-K. Online Moisture Measurements of Biofuel at a Paper Mill Employing a Microwave Resonator. Sensors 2018, 18, 3844. [Google Scholar] [CrossRef]
- EURAMET. Guidelines on the Evaluation of Vector Network Analysers, EURAMET Calibration Guide No. 12, Version 3.0, 03/2018. Available online: https://www.euramet.org/publications-media-centre/calibration-guidelines (accessed on 28 November 2023).
- JCGM 100:2008; Evaluation of measurement data—Guide to the expression of uncertainty in measurement, JCGM. BIPM: Parc de Saint-Cloud, France, 2008. Available online: https://www.bipm.org/en/committees/jc/jcgm/publications (accessed on 28 November 2023).
Figure 1.
Reference setup at DTI. The dry nitrogen gas enters from the left. In the centre, water from the sample is evaporated and flows along with the nitrogen. Subsequently, the water content of the humidified air is measured on the right side.
Figure 1.
Reference setup at DTI. The dry nitrogen gas enters from the left. In the centre, water from the sample is evaporated and flows along with the nitrogen. Subsequently, the water content of the humidified air is measured on the right side.
Figure 2.
Faraday’s law and detail of the water-selective sensor with P
2O
5 coating. See also [
14].
Figure 2.
Faraday’s law and detail of the water-selective sensor with P
2O
5 coating. See also [
14].
Figure 3.
Schematic diagram and electrochemical reactions.
Figure 3.
Schematic diagram and electrochemical reactions.
Figure 4.
Different water bonding forms in clay. (Measurements at CETIAT).
Figure 4.
Different water bonding forms in clay. (Measurements at CETIAT).
Figure 5.
Distribution of uncertainty components as a proportion of the total uncertainty.
Figure 5.
Distribution of uncertainty components as a proportion of the total uncertainty.
Figure 6.
Results from comparison of reference methods from LNE-CETIAT and DTI.
Figure 6.
Results from comparison of reference methods from LNE-CETIAT and DTI.
Figure 7.
Measuring principle of the electromagnetic resonant cavity.
Figure 7.
Measuring principle of the electromagnetic resonant cavity.
Figure 8.
The electromagnetic resonant cavity.
Figure 8.
The electromagnetic resonant cavity.
Figure 9.
Calibration curve of the electromagnetic resonant cavity. Red triangles: reference points obtained from electromagnetic resonant cavity and reference water content obtained at DTI; green squares: unknown points obtained from electromagnetic resonant cavity frequency shift and associated with their assessment of water content according to the polynomial fit; solid red line: calibration curve based on a polynomial fit from reference points.
Figure 10.
The MW-based system for in-line measurements of the water content of woodchips. The system is installed at the conveyor belt feeding the boilers. In the photo, the belt is stopped for the calibration measurements.
Figure 10.
The MW-based system for in-line measurements of the water content of woodchips. The system is installed at the conveyor belt feeding the boilers. In the photo, the belt is stopped for the calibration measurements.
Figure 11.
The prepared test samples. The photo shows 10 of the 12 samples.
Figure 11.
The prepared test samples. The photo shows 10 of the 12 samples.
Figure 12.
Correction curves with initial coefficients and with final coefficients.
Figure 12.
Correction curves with initial coefficients and with final coefficients.
Figure 13.
Expanded uncertainty related to the calibration curve for the MW system at the CHP plant. The red lines display the polynomial fit and the dashed lines indicate the related uncertainty limits.
Figure 13.
Expanded uncertainty related to the calibration curve for the MW system at the CHP plant. The red lines display the polynomial fit and the dashed lines indicate the related uncertainty limits.
Table 1.
Uncertainty budget for EWV coulometric analysis.
Table 1.
Uncertainty budget for EWV coulometric analysis.
| Parameter | Value | Unit | | Sensitivity Coefficient | Contribution to Combined Uncertainty |
|---|
| Water mass sample | 1426.9089 | µg | 22.3027 | 0.0050 | 0.0554 |
| Tare | 55.7279 | µg | 18.2706 | −0.0050 | 0.0454 |
| Sample mass | 0.0200 | g | 0.0002 | −303.2762 | 0.0288 |
| Result | 7.12 | g/100 g | 0.14 | | |
Table 2.
Reference value obtained at DTI, frequency shift with resonant cavity and the modelled value obtained with the resonant cavity.
Table 2.
Reference value obtained at DTI, frequency shift with resonant cavity and the modelled value obtained with the resonant cavity.
| Box | Vref. (DTI) | Resonant Cavity (CETIAT) | Correction
Vref − Vinstr Poly. Fit
(g/100 g) |
|---|
| Water Content (g/100 g) | Δf
(GHz) | Water Content (Poly. Fit)
(g/100 g) | |
|---|
| 1 (unknown) | 48.53 | 0.18650 | 48.31 | 0.22 |
| 2 | 43.94 | 0.14019 | 39.86 | 4.08 |
| 3 | 34.09 | 0.12947 | 37.60 | −3.51 |
| 4 | 35.85 | 0.11027 | 33.26 | 2.59 |
| 5 | 28.8 | 0.09019 | 28.32 | 0.48 |
| 7 | 24.09 | 0.08614 | 27.28 | −3.19 |
| 8 (unknown) | 19.4 | 0.06013 | 20.17 | −0.77 |
| 9 | 9.53 | 0.02445 | 9.31 | 0.22 |
| 10 | 11.26 | 0.02705 | 10.14 | 1.12 |
| 11 | 56.97 | 0.25912 | 57.19 | −0.22 |
| 12 | 56.1 | 0.24792 | 56.16 | −0.06 |
Table 3.
Synthesis of the measurement campaign.
Table 3.
Synthesis of the measurement campaign.
| Box | BERTHOLD Instrument | Resonant Cavity (CETIAT) | Correction 4 |
|---|
| | Water Content Initial Coef. (g/100 g) 1 | Phase Shift | Atten. | Load | Water Content
final Coef. (g/100 g) 2 | Δf
(GHz) | Water Content (Poly. Fit)
(g/100 g) 3 | (g/100 g) |
|---|
| 1 * | 48.53 | 9.87 | 15.38 | 11.37 | 44.20 | 0.18650 | 48.31 | 4.11 |
| 2 | 41.53 | 119 | 15.52 | 11.62 | 48.83 | 0.14019 | 39.86 | -8.97 |
| 3 | 31.81 | 71.37 | 7.38 | 10.74 | 32.35 | 0.12947 | 37.60 | 5.26 |
| 4 | 31.28 | 76.1 | 7.78 | 11.94 | 31.40 | 0.11027 | 33.26 | 1.86 |
| 5 | 34.67 | −54.61 | 9.4 | 10.71 | 30.34 | 0.09019 | 28.32 | −2.02 |
| 7 | 28.92 | −71.06 | 4.93 | 10.19 | 20.49 | 0.08614 | 27.28 | 6.78 |
| 8 * | 28.92 | −73.31 | 5.15 | 10.41 | 20.70 | 0.06013 | 20.17 | −0.53 |
| 9 | 24.36 | −90.28 | 1.9 | 9.98 | 12.80 | 0.02445 | 9.31 | −3.49 |
| 10 | 24.70 | −86.13 | 2.21 | 10.36 | 13.70 | 0.02705 | 10.14 | −3.56 |
| 11 | 48.10 | 145.86 | 17.66 | 11.4 | 54.99 | 0.24792 | 56.16 | 1.17 |
| 12 | 44.73 | 22.95 | 20.4 | 11.51 | 54.22 | 0.25912 | 57.19 | 2.96 |
Table 4.
Initial and final coefficients of the calibrated instrument.
Table 4.
Initial and final coefficients of the calibrated instrument.
| Coefficient | Initial Value | Final Value |
|---|
| a | 0.146 | 0.535 |
| b | 13.180 | 22.452 |
| c | 22.950 | 13.364 |
Table 5.
Reference value obtained at DTI and associated uncertainty, frequency shift in the resonant cavity and the associated uncertainty.
Table 5.
Reference value obtained at DTI and associated uncertainty, frequency shift in the resonant cavity and the associated uncertainty.
| Box | Vref. (DTI) | Resonant Cavity (CETIAT) |
|---|
| | Water Content (g/100 g) | Uk=2
(g/100 g) | Δf
(GHz) | Uk=2
(g/100 g) |
|---|
| 1 * | 48.53 | 0.47 | 0.18650 | 0.0024 |
| 2 | 43.94 | 0.78 | 0.14019 | 0.0052 |
| 3 | 34.09 | 0.76 | 0.12947 | 0.0044 |
| 4 | 35.85 | 0.84 | 0.11027 | 0.0036 |
| 5 | 28.8 | 0.58 | 0.09019 | 0.0033 |
| 7 | 24.09 | 0.56 | 0.08614 | 0.0034 |
| 8 * | 19.4 | 1.22 | 0.06013 | 0.0099 |
| 9 | 9.53 | 0.25 | 0.02445 | 0.0010 |
| 10 | 11.26 | 0.28 | 0.02705 | 0.0011 |
| 11 | 56.1 | 1.14 | 0.24792 | 0.0104 |
| 12 | 56.97 | 0.97 | 0.25912 | 0.0056 |
Table 6.
Data for the water content of the test samples, including the reference value determined at DTI and the corresponding values measured using the resonant-cavity transfer standard at VERDO.
Table 6.
Data for the water content of the test samples, including the reference value determined at DTI and the corresponding values measured using the resonant-cavity transfer standard at VERDO.
| Box | Vref. (DTI) | Resonant Cavity (CETIAT) |
|---|
| | Water Content (g/100 g) | Uk=2
(g/100 g) | Water Content
(g/100 g) | Uk=2
(g/100 g) |
|---|
| 1 * | 48.53 | 0.47 | 48.31 | 5.9 |
| 2 | 43.94 | 0.78 | 39.86 | 5.8 |
| 3 | 34.09 | 0.76 | 37.60 | 5.8 |
| 4 | 35.85 | 0.84 | 33.26 | 5.8 |
| 5 | 28.8 | 0.58 | 28.32 | 5.8 |
| 7 | 24.09 | 0.56 | 27.28 | 5.8 |
| 8 * | 19.4 | 1.22 | 20.17 | 6.3 |
| 9 | 9.53 | 0.25 | 9.31 | 6.0 |
| 10 | 11.26 | 0.28 | 10.14 | 6.0 |
| 11 | 56.1 | 1.14 | 56.16 | 6.3 |
| 12 | 56.97 | 0.97 | 57.19 | 5.8 |
Table 7.
Uncertainty budget for the calibration of VERDO’s in-line MW system. Distrib. = distribution; Uncert. = uncertainty.
Table 7.
Uncertainty budget for the calibration of VERDO’s in-line MW system. Distrib. = distribution; Uncert. = uncertainty.
| Factor | Uncert. | Distrib. | Standard Uncert. | Sensitivity Coefficient | Contribution to Combined Uncertainty | Unit |
|---|
| Transfer standard | 0.0200 | Normal | 0.0200 | 1 | 0.0200 | g/100 g |
| Homogeneity | 0.0026 | Normal | 0.0026 | 1 | 0.0026 | g/100 g |
| Regression | 0.0530 | Normal | 0.0530 | 1 | 0.0530 | g/100 g |
| Combined Uncert. | | | 0.0560 | | | g/100 g |
| Expanded Uncert. (k = 2) | | | 0.11 | | | g/100 g |
| Disclaimer/Publisher’s Note: The statements, opinions and data contained in all publications are solely those of the individual author(s) and contributor(s) and not of MDPI and/or the editor(s). MDPI and/or the editor(s) disclaim responsibility for any injury to people or property resulting from any ideas, methods, instructions or products referred to in the content. |
© 2024 by the authors. Licensee MDPI, Basel, Switzerland. This article is an open access article distributed under the terms and conditions of the Creative Commons Attribution (CC BY) license (https://creativecommons.org/licenses/by/4.0/).

 ,
, 


