
A Fully Coupled Gas–Water–Solids Mathematical Model for Vertical Well Drainage of Coalbed Methane
1
PetroChina Coalbed Methane Company Limited, Beijing 100028, China
2
Engineering Technology Research Institute, PetroChina Coalbed Methane Company Limited, Xi’an 710082, China
3
College of Petroleum Engineering, China University of Petroleum (Beijing), Beijing 102249, China
4
PetroChina Huabei Oilfield Company Shanxi Coalbed Methane Exploration and Development Branch, Changzhi 046000, China
*
Author to whom correspondence should be addressed.
Energies 2024, 17(6), 1497; https://doi.org/10.3390/en17061497
Submission received: 29 January 2024
/
Revised: 9 March 2024
/
Accepted: 16 March 2024
/
Published: 21 March 2024
(This article belongs to the Special Issue Enhanced Oil Recovery for Unconventional Oil and Gas Reservoirs)
Abstract
:The coupling relationship between the deformation field, the diffusion field, and the seepage field is an important factor in fluid transport mechanisms in the long-term coalbed methane (CBM) exploitation process. A mathematical model of gas–water two-phase fluid–structure coupling in a double-porosity medium in coal reservoirs is established in this paper. Taking Hancheng Block, a typical production block in Qinshui Basin, as the geological background critical desorption pressure, reservoir permeability anisotropy is considered in the model. COMSOL Multiphysics (COMSOL_6.0) was used to create the model. The accuracy and rationality of the model were verified by comparing field production data with the results of the simulation. Using the simulation, the influence law of various reservoir geological characteristics parameters (Langmuir strain constant, ratio of critical desorption pressure to reservoir pressure of coal seam (CDPRP), elastic modulus, initial water saturation, Langmuir pressure, etc.) on CBM productivity, reservoir pressure, and permeability ratio was discussed, and a thorough analysis of the factors affecting productivity was obtained using the orthogonal test method. The findings of this study indicate that the change in permeability is the result of the superposition effect of many factors. Different stages of drainage have different primary regulating factors. Rock skeleton stress has a consequence on coal matrix permeability in the early drainage stage, and coal matrix shrinkage is primarily impacted in the later drainage stage. Besides the initial water saturation, other reservoir geological parameters (e.g., CDPRP, Langmuir volume, Langmuir strain constant, elastic modulus) have a strong relationship with productivity. When the value of coal geological parameters increases, the degree of productivity release is higher (as the initial water saturation increases, the production decreases correspondingly). Different coal and rock parameters have varying levels of impact on the drainage stage of CBM wells. The influences of the CDPRP, Langmuir volume, Langmuir strain constant, and elastic modulus on gas production are mainly concentrated in the initial and intermediate drainage stages and begin to fall off during the last drainage stage. Per the multi-factor analysis, the main coal–rock parameters affecting the productivity release are the Langmuir strain constant, followed by the CDPRP and other parameters. The analysis findings can offer theoretical guidance for CBM well selection and layer selection and enhance the block’s overall CBM development level. The improved productivity prediction model for CBM, which is based on fluid–structure coupling theory, can offer a new technical benchmark for CBM well productivity prediction.
1. Introduction
Given the growing worldwide need for energy, especially in developing countries where access to energy is expanding, it is crucial to locate and utilize energy resources that can meet this demand [1,2]. Emerging resources and exploration technologies are considering methane as a promising transitional fuel. Methane can be obtained from various sources, including conventional natural gas exploration, methane hydrates [3,4,5], hydrogen gas [6,7], and coalbed methane exploration [8,9]. With the continuous deepening of research in the field of coalbed methane (CBM) exploitation, the development depth gradually extends from the depth of 1000 m to 1500 m or even 2000 m [10,11]. The results of the fourth round of CBM resource evaluation in China show that the CBM resource with a reservoir depth below 2000 m is 7.26 × 10¹² m3, accounting for about a quarter of the total resources in China [12]. In addition, determining how to further improve the resource utilization degree of old blocks is also a difficult problem in CBM exploration and development at present [13,14]. Hancheng Block in Qinshui Basin has complex geological conditions for coal seams. It is hard to combine systematic theory and field practice, so in the early stages of development in the Hancheng Block in the Qinshui Basin, there was low single-well production, a short stable gas production time, and fast decay [15]. Therefore, Hancheng Block in Qinshui Basin is faced with many technical difficulties, especially in the judgment of the main controlling factors affecting productivity and the drainage system, which need to be further studied [16,17,18].
Academics both domestically and internationally utilize numerical simulation due to its short cycle, low cost, and high simulation accuracy [19]. Scholars use existing CBM simulation software (Eclipse2019) or numerical model solvers to solve the problem [20] so that they can study or guide field production and improve CBM recovery in old blocks [21,22]. Based on the actual situation of CBM drainage and production, Wei Z et al. [23] developed a three-hole double-permeability model, taking into account the effects of coal matrix shrinkage and coal seam pressure. Thararoop et al. [24,25,26] considered the impact of CBM exploitation on water phase and coal shrinkage and expansion effects, created a double-pore and double-permeability model, and confirmed its accuracy by comparing field production data with the double-pore and single-permeability models of commercial CBM software. Li S. et al. [27] established a fully coupled fluid–solid–thermal double-hole single permeability model by considering the changes in temperature field on the basis of gas-flow solid coupling. They proposed that the effects of water and temperature influences on gas production should not be ignored by comparing different coupling models. At the same time, they compared the constant diffusion coefficient simulation [28] with the model ignoring the water phase dynamic diffusion coefficient, showing that considering the dynamic diffusion coefficient model can successfully increase the predictability of CBM production. For the co-production of CBM and tight sandstone, Meng S et al. [29] developed a double-layer gas–water two-phase flow double-hole single-permeability model, in which the sandstone permeability model only took the effective stress effect into account, and they discussed the variation rule of productivity under different reservoir physical parameters. Yang R et al. [30] introduced the dynamic change characteristics of gas diffusivity to establish a fully coupled two-hole single-permeability model of gas–water two-phase flow and coal deformation.
At present, the productivity simulation methods of CBM well development mainly include the mathematical statistical method, the production decline curve method, the material balance method, and the numerical simulation method [31,32,33,34,35,36]. Among them, the numerical simulation method is commonly applied because it is intuitive and convenient and complies with the actual production [37,38]. The numerical simulation of CBM is a combination of the CBM flow and migration model and the coal reservoir geometry model [39]. By using the scientific analysis method of computer numerical solution, it can simulate the field CBM production dynamics and realize the simulation of drainage control diagnosis and well pattern optimization [40,41]. Based on the numerical simulation technology, different scholars have established different numerical models for the seepage model and productivity-influencing factors (the influence of temperature on the coal rock skeleton and reservoir permeability in the production process) in CBM exploitation [42,43,44]. Scholars applied them to production demand, providing theoretical guidance for CBM well exploration and development [45,46]. However, because many factors, including pore structure [47], permeability, coal deformation, and the formation of water, have an impact on the extraction of CBM [48,49], the transport of gas and water within coal seams is a highly intricate process [9,50]. Therefore, there is an urgent need for an adequate and reliable mathematical model of CBM exploitation, considering many factors. Based on such old blocks, the author establishes a CBM well production numerical simulation model that conforms to the features of reservoir heterogeneity in the field of study. The numerical simulation model of coalbed methane well production can precisely replicate the productivity of coalbed methane wells, encompassing factors such as output, pressure fluctuations, and the impact of horizontal wells [51]. The simulation model allows for the optimization of the development plan, enabling the determination of the most effective well pattern layout, well spacing, and mining parameters. This leads to an improvement in the production capacity and economic advantage of coalbed methane [21,52]. In addition, it has the capability to forecast the drop in productivity of coalbed methane wells, including the rate at which production decreases and the trend of pressure changes [37,53]. Furthermore, the evaluation of coalbed methane resources is conducted by modeling and assessing the heterogeneity characteristics of coalbed methane reservoirs. The findings of have significant implications for the exploration and development of coalbed methane [54,55]. They can assist decision-makers in formulating rational development strategies and investment plans [56]. The data from the on-site CBM production was used to confirm the model’s accuracy and logic. Additionally, the drainage system was optimized, and the influencing factors of CBM productivity were investigated and studied.
2. Model Establishment
2.1. Model Principles
Methane desorption, diffusion, and two-phase seepage are all complicated ways that methane moves during CBM production and drainage. This paper takes methane and water in the process of producing CBM as the research objects and makes the following basic principles:
- (1)
- (2)
- During the drainage process, the coal body will only produce small deformations.
- (3)
- CBM is primarily found in the matrix system, where it desorbs and diffuses. The fracture system is the seepage channel for gas and water.
- (4)
- (5)
- The coal reservoir gas is a single-phase methane gas [59].
- (6)
- CBM adsorption and desorption in the matrix system follow the Langmuir isothermal equation, while the diffusion process conforms to Fick’s law.
- (7)
- The seepage between CBM and water in the fissure conforms to Darcy law [59].
The fluid–solid interaction relationship between gas–water two phases in the coal bed can be illustrated in Figure 1.
2.2. Governing Equation of Coal Deformation
Depressor mining causes small deformation of the coal reservoir matrix skeleton during the extraction and drainage of CBM, with the coal body being viewed as an elastic medium that is continuous throughout the process. Song et al. [60] derived the equation governing coal deformation by considering the volumetric strain from methane and water, along with the contraction strain from methane desorption:
where G is the coal shear modulus, MPa; v is Poisson’s ratio; u is the skeleton displacement, m; K is the bulk modulus of coal, MPa; εs is the volumetric strain of coal matrix expansion/contraction. αm and αf, respectively, represent the Biot coefficients of the matrix and fracture of the coal body; pm and pf, respectively, represent the pore pressure in the matrix and the pore pressure in the fracture (MPa).
2.3. Governing Equation of Gas Diffusion in Coal Matrix
The gas present in the coal matrix system mainly includes adsorbed methane and free methane, so the total mass of methane in the coal matrix is as stated by [27]:
where mm is the mass of methane gas per unit volume in the matrix, kg/m3; Vsg is the adsorption gas per unit mass of coal, m3/t; ρga is the density of methane gas in standard conditions, kg/m3; ρc is the apparent density of coal, kg/m3; ϕ is the porosity of coal; ϕm is the porosity of the matrix; ρg is the methane gas density, kg/m3
where VL is the Langmuir volume, m3/kg; pL is the Langmuir pressure, MPa.
Methane is a compressible gas, considering its density change with pressure, using the real gas state equation:
where Mg is the molar mass of methane gas, set at 16.04 × 10⁻³ kg/mol; R is the gas constant, set at 8.314 J/(mol·K); Z is the compression factor, which is 1.07.
Before CBM exploitation, the methane gas pressure values of the matrix system and the fissure system were the same, indicating that there was no gas diffusion. During the process of gas production through drainage and pressure decline, the fracture’s methane gas pressure gradually drops; as a result, the matrix system’s gas pressure will be higher than that of the fissure systems. Homeostasis will throw off balance, causing methane gas to desorb outward from the matrix and diffuse into the fissure. In accordance with the principle of mass conservation, the methane diffusion equation is written as
where Qm is the methane mass exchange rate per unit volume of coal matrix and fracture system, kg/(m3·s); ϕf is the fracture porosity.
Based on Fick’s first law, the methane gas mass source can be expressed as [60]:
where τ is the adsorption time, that is, the time required for the desorption of 63.2% of the gas content in a coal seam, d; pfg is the methane gas pressure in the fissure, MPa.
Substituting Equations (2) and (5) into Equation (6), the governing equation of coal matrix gas diffusion is obtained
2.4. Gas in Coal Fissure—Governing Equation of Water Two-Phase Flow
In accordance with the principle of mass conservation, the continuous equation of CBM and water flow is expressed as [61]:
where, Sg and Sw, respectively, represent the gas saturation and water saturation in the fracture system.
Darcy law expresses the seepage process. Considering the L.J. Klinkenberg effect and the influence of gravity caused by methane gas when it passes through coal reservoir fractures, the motion equation of CBM and water can be stated as
where k represents the absolute permeability of the coal seam, mD; krg and krw, respectively represent the relative permeability of methane gas and water; g is the acceleration due to gravity, m/s2; h is the relative scale, μg and μw represent the dynamic viscosity coefficients of methane and water, Pa·s; bk stands for the Klinkenberg factor, MPa.
Substituting the motion equation into the fluid continuity equation yields the equations of methane gas and water flow in the fissure:
2.5. Coupled Models and Supplementary Equations
In this section, we introduce the critical desorption pressure as a key parameter node and improve the S-D model to represent the evolution of coal reservoir porosity and permeability. Fractures serve as the primary seepage channels for coal reservoir fluids, with the porosity of the matrix system assumed to be constant while changes in the fracture system’s porosity are taken into account. The model expresses the following:
where pcd is the critical desorption pressure, MPa; cf is the fracture compression coefficient, MPa−1; and ϕf0 is the initial fracture porosity.
Chen D. et al. [62] proposed an enhanced version of the S-D model by incorporating the Brooks–Corey model and considering the influence of porosity variation on coal relative permeability. To achieve this, they introduced a residual phase saturation model and a shape factor that was dependent on permeability. This approach reduced redundancy in their study by presenting a more sophisticated and accurate method for modeling coal’s behavior under varying porosity conditions. This is achieved by
where krg0 and krw0 are the relative permeability of gas phase and water phase end points, respectively; Sgr and Swr represent the residual gas and water phase saturation; η is the bending coefficient and is set at 0.3; λ is the aperture distribution index, set at 3.5; J is the correction factor, which is taken as 1.0; and ngr and nwr are the fitting parameters of residual gas and water phase saturation and porosity, respectively, which are set at 0.49.
In addition, the correlation between porosity and the bound water saturation of coal rocks in Hancheng Block is expressed as follows:
Due to the governing equation of two-phase flow of gas and water, two-phase flow contains many unknown variables. The following auxiliary equations need to be set to perfect the solution [63]:
where pc is the capillary pressure, MPa; pe is the inlet pressure, MPa.
3. Model Validation and Analysis
To assess the suitability of the existing model for both CBM and water production, the production data from the Hancheng Block located at the southeastern boundary of the Ordos Basin in China were employed for verification and comparative analysis. The production time was from November 2011 to September 2014. The average well spacing in the field is about 350 m. The plane size of the single-well model is 350 × 350 m. The thickness of the coal seam was determined to be 3 m based on empirical knowledge and field observations [64,65]. The wellbore is located in the model’s center; the wellbore radius is 0.1 m. The model’s deformation field boundary is considered to be the constant stress boundary, while the seepage field boundary is designated as the no-flow boundary, as shown in Figure 2a.
To simplify the solution while maintaining the accuracy of the calculation results, 1/4 was used to create a three-dimensional geometric model. The specific parameters of the model are shown in Table 1. In the simulation model, the roller axis boundary is defined as the symmetry plane boundary, the bottom boundary is fixed, and the remaining boundaries are set as stress boundaries. The position of the wellbore is then placed in the lower left corner of the model in Figure 2b [15]. To account for the production of CBM and water, a production model is employed on the boundary of the producing wells, which is expressed by the following calculation equation:
where qgwell and qwwell are, respectively, the production of CBM and water, m3; re and rw are the effective supply radius and wellbore radius, m; pwf is the bottomhole flow pressure, MPa; S is the wellbore skin coefficient.
The accuracy of the model was evaluated using the mean squared error (MSE) and root mean squared error (RMSE). The MSE of daily gas output is 179.58 and the RMSE is 0.35. The MSE of daily water volume is 0.3573 and the MSE is 0.375. Therefore, combined with Figure 3, the trends of gas production and water production are consistent between the historical production data and the simulation results, with a high degree of fit, indicating that the model is applicable to CBM exploitation in the Hancheng study block.
4. Analysis of Main Control Factors
4.1. Single Factor Sensitivity Analysis
In order to better reveal the primary influencing factors affecting the productivity of vertical CBM wells and understand the fluid migration law in the drainage process, we studied the impact of various factors on the current model. These factors include the water saturation (Sw0), CDPRP (pcd/p0), Langmuir volume (VL), Langmuir pressure (pL), Langmuir strain constant (εL), and elastic modulus (E) [66]. The team adopted a production mode with a constant bottomhole flow pressure of 0.1 MPa and a production period of 6000 days to ensure continuous and consistent CBM production. We input the model parameters according to the reservoir characteristic range of the study block and set the rest according to the sensitivity test parameters. The specific parameters of the model are shown in Table 2. Finally, we output and analyze the average pore pressure and permeability ratio of the reservoir at the observation points.
4.1.1. Effect of Initial Water Saturation
Water saturation (Sw) is a crucial parameter in gas–water two-phase flow, with its impact demonstrated in Figure 4 [67]. The curves in this figure show the relationship between gas and Sw with drainage time, given various initial water saturations of a coal reservoir. A lower initial water saturation (Sw0) leads to higher gas production and lower water production, with the opposite being true for a higher initial water saturation.
In Figure 4a,b, gas production is lowest when the Sw0 is 0.85. This is because at this saturation, the fracture system in the coal bed is mostly filled with water, leading to lower gas production (324 m3/d at t = 1 d) and higher water production (0.59 m3/d) in the initial stage of CBM drainage. As the Sw0 decreases, gas production increases while water production decreases.
Figure 4c shows that coal reservoir pressure decreases over time, with a greater drop range observed for lower Sw0. Figure 4d demonstrates the change in permeability ratio with time and Sw0. The overall trend suggests that the permeability ratio initially decreases and then increases with drainage time. The overall trend suggests that the permeability ratio initially decreases and then increases with drainage time. This is due to the opposing influences of effective stress and coal matrix shrinkage deformation on permeability [68]. Initially, the large amount of water produced in the seam fissure increases effective stress, leading to decreasing permeability. However, with continued drainage and gas production, adsorbed methane diffuses from the coal matrix, causing shrinkage deformation and increasing fracture channels in the coal bed, ultimately resulting in an increased permeability ratio [69,70]. The decrease in Sw0 leads to a faster decline in permeability, an earlier rebound time, and a faster rise in the later period.
In summary, the impact of Sw on gas–water two-phase flow in a coal reservoir is significant, with lower Sw0 leading to higher gas production and lower water production. Furthermore, the decrease in Sw0 accelerates the decline in permeability, resulting in an earlier rebound time, and a faster rise in the later period.
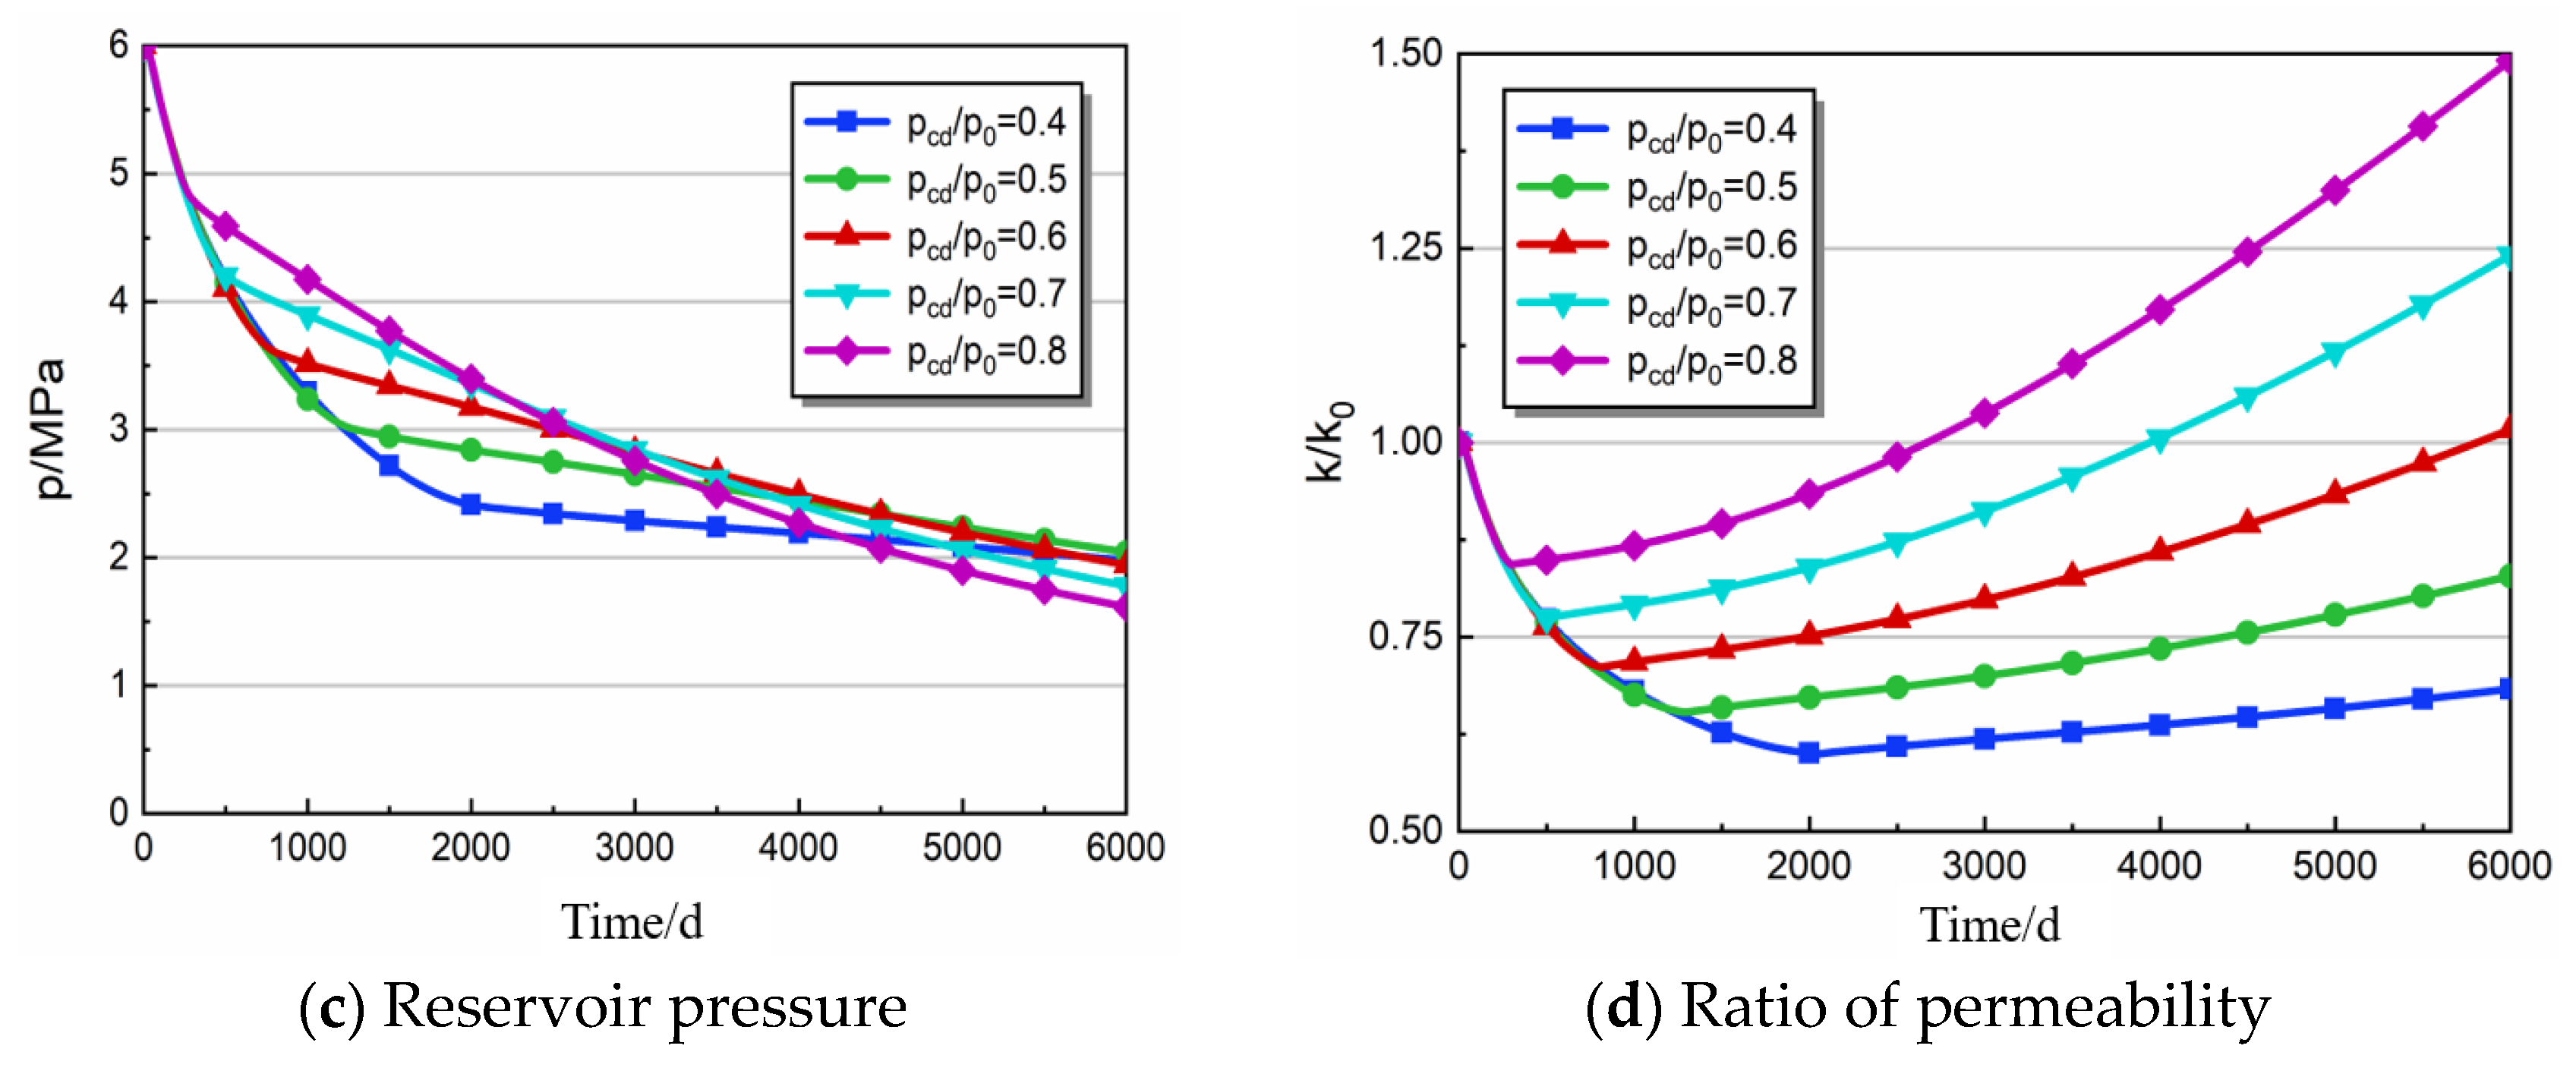
4.1.2. The Effect of CDPRP
The CDPRP plays a pivotal role in determining the effective desorption region of the coal bed, thereby having a significant impact on CBM production. Figure 5a–d depict the variations in the coal reservoir development characteristics at different CDPRP, ranging from 0.4 to 0.8. It is clear from Figure 5a that there is a positive correlation between gas production, cumulative gas production, and the CDPRP. A higher CDPRP corresponds to a higher gas yield. However, during the initial stages of drainage and production, the peak gas production displays minimal differences, whereas the subsequent decay in the gas production rate is highly variable, primarily due to the influence of the CDPRP. In particular, a higher CDPRP corresponds to a slower gas production decay rate. During the initial phase of drainage, the primary source of gas production is the free methane within the fissure. If the reservoir pressure does not decrease to the critical desorption pressure, the methane contained in the matrix fails to desorb and recharge, resulting in a rapid reduction in gas production. As time goes on, the desorption and diffusion of methane gas in the coal matrix start when the reservoir pressure gets close to or drops below the critical desorption pressure. This causes gas production to rise. From Figure 5a,b, it is apparent that the gas production rate and the cumulative gas production are positively correlated with the CDPRP, with higher CDPRP resulting in higher gas production. In the initial stage of CBM production, the peak production of methane is similar, but the decline rate varies due to the CDPRP. The primary source of early production is the free methane in the fractures of the coal seam [8]. The volume of free CBM in a coal seam is limited. High pressure in the reservoir and the inability of methane in the matrix to desorb lead to a rapid decline in methane production. When methane gas reaches the critical desorption pressure, it begins to desorb and diffuse, resulting in a subsequent recovery in gas production.
As seen from Figure 5c,d, early water production is directly proportional to the CDPRP, with higher ratios leading to faster declines in water production, exhibiting the opposite trend to the corresponding gas production. Figure 5c,d illustrate the changes in reservoir pore pressure and permeability for different CDPRPs. Reservoir pressure changes can be divided into two stages, with the critical desorption pressure as the inflection point. When the reservoir pressure is above the critical desorption pressure, it rapidly decreases. However, when the pressure is below the critical desorption pressure, the pressure decline rate slows down. Different CDPRP values result in shorter first-stage pressure decline times and faster second-stage pressure decline rates. When the reservoir pressure exceeds the critical desorption pressure, methane in the fractures rapidly flows towards the wellbore, while methane adsorbed in the matrix has not yet started to desorb and diffuse, leading to a rapid decrease in pressure in the coal seam fractures. When the reservoir pressure drops below the critical desorption pressure, a large amount of matrix methane desorbs and diffuses into the fracture system, causing the pressure decline rate to slow down. From Figure 5c, it can be observed that a larger CDPRP results in earlier permeability rebound recovery times and less effective stress damage. When pcd/p0 is 0.4, 0.5, 0.6, 0.7, and 0.8, the times at which permeability rebound is achieved are 2056, 1293, 812, 502, and 297 days, respectively, with effective stress damage values of 40.05%, 34.71%, 28.90%, 22.57%, and 15.68%, respectively.
4.1.3. The Effect of Langmuir Volume
Langmuir volume is an important parameter affecting methane gas adsorption [71]. Figure 6a,b illustrate the trends in gas and water production as a function of drainage time for coal reservoirs, with Langmuir volumes ranging from 10 to 30 m3/t. It is evident from Figure 6b that a larger Langmuir volume constant is associated with greater cumulative gas and water production. When VL = 10 m3/t, the peak production of CBM is 5602.70 m3/d, corresponding to water production of 3.59 m3/d. When VL = 15, 20, 25, and 30 m3/t, the peak gas production is 5982.78, 6441.65, 6544.84, and 6772.71 m3/d, respectively. The corresponding water yield is 3.39, 3.23, 3.16, and 3.06 m3/d, indicating that the higher the Langmuir volume constant is, the higher the peak gas production is, while the opposite is true for the water yield.
Based on the general trend of gas and water production, it is observed that as the volume constant increases, the decline in both gas and water production exhibits a smaller range. When the drainage time of CBM is 3000 days, the daily gas output of VL = 15, 20, 25, and 30 m3/t decreases by 33.73%, 26.57%, 23.67%, 19.7%, and 17.46% from the peak point, respectively. At 6000 days of drainage, the decreases in the amplitude of gas production corresponding to different Lancs volumes were further enlarged, by 63.49%, 50.83%, 43.65%, 36.61%, and 32.38%, respectively.
Figure 6c,d depict the impact of Langmuir volume on the pore pressure and permeability of the coal reservoir post-desorption. The Langmuir volume negligibly affects the change in pore pressure and permeability before desorption. During the drainage period of 3000 days, the Langmuir volume (VL) at 10, 15, 20, 25, and 30 m3/t corresponds to reservoir pressures of 1.97, 2.44, 2.76, 3.00, and 3.18 MPa, respectively, with the corresponding permeability ratios being 1.29, 1.12, 1.04, 0.99, and 0.96. It is evident that the reservoir pressure drop rate after desorption slows down with an increase in Langmuir volume, while the growth rate of permeability after rebound decreases. One can explain this phenomenon as follows: An increase in Langmuir volume leads to more adsorption of gas by the coal with the same mass, thus resulting in a stronger adsorption capacity. Consequently, when the pressure drop extends to the critical desorption pressure value, a higher Langmuir volume results in more rapid and abundant gas desorption at the same pressure drop, thereby enhancing the gas absorption effect in the fracture system and resulting in a smaller range of variation in reservoir pressure. Previous studies have observed that because of the large amount of adsorbed gas and the slow pressure drop rate, the shrinkage deformation of the coal matrix is minimal, resulting in a relatively smaller impact on permeability [72]. As a result, the growth rate of permeability after rebound is slower [72,73].
4.1.4. The Effect of Langmuir Pressure
The desorption of methane from the coal matrix is significantly influenced by Langmuir pressure, which is considered to be a crucial parameter [71,74]. Figure 7a–d show the variation curves of productivity and reservoir characteristics when the simulated Langmuir pressure is 1.2, 1.5, 2.1, 2.8, and 3.6 MPa, respectively. Figure 7a,b illustrate that gas production increases as Langmuir pressure increases, whereas water production exhibits the opposite trend. Overall, the trend in gas production suggests that when the Langmuir pressure is less than 2.1 MPa, there is a significant increase in gas production, with an increase in Langmuir pressure during the early and middle stages of drainage. Taking 1000 days of drainage as an example, when pL = 2.1, 2.8, and 3.6 MPa, the corresponding gas production is 4918.48, 5124.79, and 5159.50 m3/d, respectively, and the difference in gas production is small. When pL = 1.2 and 1.5 MPa, the gas production is 4111.67 and 4484.23 m3/d, respectively, and the gas production is significantly different. When pL = 1.2, 1.5, 2.1, 2.8, and 3.6 MPa, the gas production decreases by 43.81%, 42.54%, 43.07%, 46.61%, and 50.49% from the peak, respectively, indicating that the gas production decreases more significantly in the later stage of the drainage and production in reservoirs with higher Langmuir pressure.
Figure 7c,d illustrate the variations in coal reservoir pressure and permeability under different Langmuir pressures. It is evident that while Langmuir pressure has a negligible effect on the changes in reservoir pressure, it significantly influences the growth rate of permeability during rebound. According to the data, when pL = 1.2, 1.5, 2.1, 2.8, and 3.6 MPa at 3000 days of drainage, the permeability rebound growth rate is 12.23%, 17.17%, 23.89%, 26.95%, and 27.20%, respectively, and the permeability rebound effect is roughly proportional to the Langmuir pressure. When the drainage is 6000, the corresponding permeability rebound growth rate becomes 50.11%, 63.21%, 78.49%, 82.11%, and 77.83%. It can be seen that during later drainage and production, the permeability growth rate of higher Langmuir pressure slows down.
According to the general trend, when the pressure of the coal bed drops to the critical desorption pressure, gas desorption is easier with higher Langmuir pressure, so the permeability rebound rate is larger (Figure 7d). However, when pL ≥ 2.1 MPa, the difference in rebound effect is smaller. It has been found that the dynamic response of CBM development is more sensitive to lower Langmuir pressure.
4.1.5. The Influence of Langmuir Strain Constant
The Langmuir constant is the limit strain variable of coal adsorption or desorption [75]. The matrix shrinkage effect of coal is a critical factor in the CBM drainage and production process, which sets it apart from conventional gas reservoirs. This effect is also a vital parameter that contributes to changes in reservoir permeability. Figure 8a–d shows the change curves of coal reservoir development characteristics when the Langmuir strain constants are 0 (ignoring the coal deformation caused by adsorption and desorption), 0.002, 0.004, 0.008, and 0.012, respectively. As depicted in Figure 8a, it is evident that gas production and water production show a similar trend. It is evident that an increase in the Langmuir strain constant leads to a corresponding increase in gas production, resulting in a more pronounced peak gas production. After reaching its peak, gas production experiences a steep decline, whereas water production has a higher peak value and a faster decline rate.
Figure 8c,d reveal that when εL = 0.012, the gas pressure drop of the coal bed is faster, followed by 0.008, 0.004, 0.002, and 0, respectively. The analysis shows that the higher the Langmuir strain constant, the greater the shrinkage and deformation of the coal matrix is, and the gas can more easily migrate from the fracture to the bottom hole. Therefore, the reservoir pressure with a higher Langmuir strain constant is lower at the same drainage time. When εL ≥ 0.008, permeability rebound occurs, and the higher the Langmuir strain constant, the faster the permeability rebound rate and the earlier the recovery time. When εL < 0.008, over the course of time, there is a continuous and persistent decline in the permeability ratio of the coal bed. After 6000 days of drainage, when εL = 0, 0.002, 0.004, 0.004, and 0.012, the permeability ratios are 0.66, 0.72, 0.82, 1.49, and 8.19, respectively. These observed phenomena are intricately linked to the coal shrinkage resulting from desorption. The coal’s shrinkage and deformation abilities are weak, and the influence of effective stress becomes increasingly significant in restricting the change in permeability.
4.1.6. The Effect of Elastic Modulus
Figure 9a,b show the curves of gas production and water production with drainage time. When the elastic modulus of coal is 1.0, 1.5, 2.0, 2.5, and 3.0 GPa, respectively, there is a strong relationship between gas production and the elastic modulus in the whole production process, which is more obvious in the initial phase of gas production. When E = 1.0, 1.5, 2.0, 2.5, and 3.0 GPa, the peak gas production is 5220.50, 5367.71, 5735.47, 6441.65, and 7139.74 m3/d, respectively. When the drainage time is 3000 days, the gas production decreases by 47.88%, 40.09%, 31.99%, 23.67%, and 10.81% from the peak, respectively. It is evident that the higher the elastic modulus is, the slower the decrease is in the pre-and mid-drainage periods. At 6000 days, compared with 3000 days, the gas production decreased by 14.34%, 15.62%, 17.01%, 19.98%, and 28.93%, respectively.
As shown in Figure 9c,d, the reservoir pressure of different elastic moduli and permeability change differences is low at the start of the high rank (i.e., it did not reach the critical desorption pressure development phase) [76]. When the gas started the desorption process, the higher the elastic modulus, the greater the pressure drop, and the permeability under different elastic moduli showed a very big difference. In the whole production cycle, when E = 1.0 GPa, the permeability ratio is always in a downward trend, and permeability does not appear to be an obvious rebound phenomenon. When E = 1.5, 2.0, 2.5, and 3.0 GPa, permeability rebound occurs at 2107, 458, 297, and 269 d, respectively. The elastic modulus negatively correlates with permeability rebound time. The analysis shows that the smaller the E of the coal reservoir is, the larger the deformation will be under the same stress load, and the compressibility of coal and rock fractures is relatively larger. Therefore, this situation leads to a reduction in fracture channels for gas–water seepage and low permeability in the production process. When E = 1.0, 1.5, 2.0, 2.5, and 3.0 GPa, the permeability is about 0.77, 0.88, 1.08, 1.49, and 2.50 times the initial value after 6000 days of drainage production.
4.2. Comprehensive Factor Analysis
The sensitivity study in the previous section concluded that geological reservoir factors, including initial water saturation, CDPRP, Langmuir volume, Langmuir pressure, Langmuir strain constant, elastic modulus, and other parameters [77], mainly affect the productivity of CBM vertical wells. However, in the actual drainage process, the CBM production capacity has the synergistic influence of many factors [78]. Single-factor analysis cannot clearly identify the main controlling factors affecting production capacity, necessitating a comprehensive consideration of multiple factors. Because the number of comprehensive tests is too large, consuming a lot of time and calculation costs, the orthogonal test analysis method can effectively reduce the number of schemes [79,80].
The L18 (36) orthogonal table was selected, where 18 represents the total number of orthogonal experiments, 3 represents the level number of orthogonal experiments, and 6 represents the factor of orthogonal experiments. Based on the combination scheme of the orthogonal test table (Table 3), the average daily gas production of CBM in 10 years is calculated, and output is used as the standard to obtain the primary factors governing the productivity of vertical CBM wells by range analysis. The computation outcomes are presented in Table 3.
During the discharge and production of coalbed methane, multiple factors interact to influence its productivity. The analysis of individual factors alone does not clearly identify the main control factors that affect productivity. Therefore, it is essential to comprehensively consider all the individual factors. The orthogonal test analysis approach [80] can significantly reduce the number of schemes in the comprehensive test, which requires a substantial amount of time and calculation cost. It is evident from Table 4 that the main controlling factors [81,82] affecting the productivity of vertical CBM wells are the Langmuir strain constant, followed by the CDPRP of the coal seam, elastic modulus, initial water saturation, Langmuir pressure ratio, and Langmuir volume [67,83]. Therefore, the reservoirs with a high near reservoir ratio and low water saturation should be given priority in the initial stage of reservoir selection, followed by the reservoirs with a large Langmuir strain constant, elastic modulus, and Langmuir volume.
5. Conclusions
- (1)
- Researchers developed a mathematical model based on fluid–structure coupling theory that incorporates the features of CBM desorption, migration, and production to account for the characteristics of heterogeneous CBM reservoirs. We established the numerical model using COMSOL Multiphysics software (COMSOL_6.0). The production history fitting and long-term drainage analysis results show that the “deformation field-diffusion field-seepage field” numerical model can be used in a lot of situations.
- (2)
- Many factors affect the permeability of CBM Wells, and these factors (rock skeleton stress and coal matrix shrinkage) combine to cause changes in permeability. The main controlling factors vary depending on the drainage stage. In the early stage of CBM extraction, the permeability of the coal matrix will be affected by rock skeleton stress, and this influence will gradually reduce with the progress of mining. In the late stage of CBM extraction, the main influencing factor will be the shrinkage effect of the coal matrix. Reducing coalbed methane well in the initial stage of development is necessary to achieve slow pressure. On the one hand, it can expand the range of pressure drop; on the other hand, it can prevent the pressure drop speed from being too fast, which leads to the high stress of the coal rock skeleton and causes the permeability to decline in the near-wellbore area.
- (3)
- Variations in coal and rock geological parameters can cause the release of CBM wells through a single-factor sensitivity analysis of CBM wells. Moreover, the initial water saturation difference mainly affects the gas and water production of CBM during the early stages of drainage and production. Researchers observed that the initial water saturation inversely correlates with gas production and cumulative gas production and directly correlates with water production and cumulative water production during this early stage.
- (4)
- To varying degrees, and with different parameters, gas production and cumulative gas production strongly correlate with water production in the early stage and negatively in the later stage, as well as with the ratio of critical desorption pressure to reservoir pressure, Langmuir volume, Langmuir strain constant, and elastic modulus. The increase in coal and rock geological parameters can further improve. The CDPRP, Langmuir volume, Langmuir strain constant, and elastic modulus mainly concentrate their effects on gas production in the early and middle stages of drainage, with a gradual decrease in the late stages.
- (5)
- The comprehensive analysis of multi-factor influencing factors of CBM well productivity reveals that the main controlling factor of CBM well productivity is the Langmuir strain constant, followed by the CDPRP of the coal seam, the elastic modulus, the initial water saturation, Langmuir pressure, and Langmuir volume. Reservoir selection should prioritize reservoirs with a large Langmuir strain constant and high CDPRP in the initial stage, followed by those with an elastic modulus, water saturation, Langmuir pressure, and Langmuir volume.
- (6)
- This numerical model, which incorporates the coupling of gas, water, and solid phases, is not limited to its application in coalbed methane wells. It may be utilized in both research and production of gas wells, and it has the potential to be extended to gas wells of different scales. The model’s extensive application allows it to offer robust assistance in many geological contexts and mining situations, making it a potent instrument for promoting the sustainable growth of the coalbed methane industry. This numerical model not only applies to specific gas well scales but also has implications for numerical modeling of reservoir and basin scales in both established production and frontier exploration environments [84,85,86]. This indicates that the model not only assists in optimizing small-scale operations at a specific location, but also offers a detailed understanding of hydrocarbon and petroleum systems on a broader scale across a block basin [87,88]. The primary contributions are as follows: researchers can enhance their understanding and control of the drainage process in coalbed methane vertical wells by developing a mathematical model that incorporates the interaction between gas, water, and solid components. This is essential for effectively guiding block production, optimizing production efficiency, and improving oil recovery. It has the potential to optimize the efficiency of extracting coalbed methane. Furthermore, this numerical model can be applied not only to optimize production, but also to forecast and address potential issues that may arise during coalbed methane extraction, such as wellbore collapse and formation fractures. This contributes to mitigating the hazards associated with the mining process and enhancing the dependability of coalbed methane exploration and production.
Author Contributions
Conceptualization, H.Z.; Methodology, C.W.; Software, Z.L.; Validation, G.C.; Writing—review & editing, T.W. All authors have read and agreed to the published version of the manuscript.
Funding
This research received no external funding.
Data Availability Statement
The original contributions presented in the study are included in the article, further inquiries can be directed to the corresponding author.
Conflicts of Interest
Authors Chengwang Wang and Gaojie Chen were employed by the company PetroChina Coalbed Methane Company Limited. Author Zhan Liu was employed by the company PetroChina Huabei Oilfield Company Shanxi Coalbed Methane Exploration and Development Branch. The remaining authors declare that the research was conducted in the absence of any commercial or financial relationships that could be construed as a potential conflict of interest.
References
- Shove, E.; Walker, G. What is energy for? Social practice and energy demand. Theory Cult. Soc. 2014, 31, 41–58. [Google Scholar] [CrossRef]
- Wolfram, C.; Shelef, O.; Gertler, P. How will energy demand develop in the developing world? J. Econ. Perspect. 2012, 26, 119–138. [Google Scholar] [CrossRef]
- Burton, Z.; Kroeger, K.F.; Hosford Scheirer, A.; Seol, Y.; Burgreen-Chen, B.; Graham, S.A. Tectonic uplift destabilizes subsea gas hydrate: A model example from Hikurangi margin, New Zealand. Geophys. Res. Lett. 2020, 47, e2020GL087150. [Google Scholar] [CrossRef]
- Burton, Z.F.M.; Dafov, L.N. Testing the sediment organic contents required for biogenic gas hydrate formation: Insights from synthetic 3-D basin and hydrocarbon system modelling. Fuels 2022, 3, 555–562. [Google Scholar] [CrossRef]
- Burton, Z.F.M.; Dafor, L.N. Salt Diapir-Driven Recycling of Gas Hydrate. Geochem. Geophys. Geosyst. 2023, 24, e2022GC010704. [Google Scholar] [CrossRef]
- Abe, J.O.; Popoola, A.P.I.; Ajenifuja, E.; Popoola, O.M. Hydrogen energy, economy and storage: Review and recommendation. Int. J. Hydrogen Energy 2019, 44, 15072–15086. [Google Scholar] [CrossRef]
- Mazloomi, K.; Gomes, C. Hydrogen as an energy carrier: Prospects and challenges. Renew. Sustain. Energy Rev. 2012, 16, 3024–3033. [Google Scholar] [CrossRef]
- Flores, R.M. Coalbed methane: From hazard to resource. Int. J. Coal Geol. 1998, 35, 3–26. [Google Scholar] [CrossRef]
- Moore, T.A. Coalbed methane: A review. Int. J. Coal Geol. 2012, 101, 36–81. [Google Scholar] [CrossRef]
- Guo, X.; Hu, Z.; Li, S.; Zheng, L.; Zhu, D.; Liu, J.; Shen, B.; Du, W.; Yu, L.; Liu, Z.; et al. Research progress and prospect of deep-ultra-deep gas exploration. Bull. Pet. Sci. 2023, 8, 461–474. [Google Scholar]
- Clarkson, C.R.; Bustin, R.M. Coalbed methane: Current evaluation methods, future technical challenges. In Proceedings of the SPE Unconventional Resources Conference/Gas Technology Symposium, Pittsburgh, PA, USA, 23–25 February 2010; p. SPE-131791. [Google Scholar]
- Geng, M.; Chen, H.; Chen, Y.P.; Zeng, L.J.; Chen, S.S.; Jiang, X.C. Methods and results of the 4th round of CBM resource evaluation in China. Coal Sci. Technol. 2018, 46, 64–68. [Google Scholar]
- Altowilib, A.; AlSaihati, A.; Alhamood, H.; Alafnan, S.; Alarifi, S. Reserves estimation for coalbed methane reservoirs: A review. Sustainability 2020, 12, 10621. [Google Scholar] [CrossRef]
- Sun, Q.P.; Zhao, Q.; Jiang, X.C.; Mu, F.Y.; Kang, L.X.; Wang, M.Z.; Yang, Q.; Zhao, Y. Exploration and development prospects and countermeasures of coalbed methane in China under the new situation. J. China Coal Soc. 2021, 46, 65–76. [Google Scholar]
- Yang, R.Y.; Li, G.S.; Qin, X.Z.; Huang, Z.W.; Li, J.B.; Sheng, M.; Wang, B. Productivity enhancement in multilayered coalbed methane reservoirs by radial borehole fracturing. Pet. Sci. 2022, 19, 2844–2866. [Google Scholar] [CrossRef]
- Jiang, W.; Wu, C.; Wang, Q.; Xiao, Z.; Liu, Y. Interlayer interference mechanism of multi-seam drainage in a CBM well: An example from Zhucang syncline. Int. J. Min. Sci. Technol. 2016, 26, 1101–1108. [Google Scholar] [CrossRef]
- Pan, Z.; Connell, L.D.; Camilleri, M.; Connelly, L. Effects of matrix moisture on gas diffusion and flow in coal. Fuel 2010, 89, 3207–3217. [Google Scholar] [CrossRef]
- Xu, H.; Tang, D.; Zhao, J.; Li, S.; Tao, S. A new laboratory method for accurate measurement of the methane diffusion coefficient and its influencing factors in the coal matrix. Fuel 2015, 158, 239–247. [Google Scholar] [CrossRef]
- Kajishima, T.; Taira, K. Numerical Simulation of Fluid Flows. In Computational Fluid Dynamics; Springer: Cham, Switzerland, 2017. [Google Scholar]
- Guo, Z.; Zhao, J.; You, Z.; Li, Y.; Zhang, S.; Chen, Y. Prediction of coalbed methane production based on deep learning. Energy 2021, 230, 120847. [Google Scholar] [CrossRef]
- Danesh, N.N.; Zhao, Y.; Teng, T.; Masoudian, M.S. Prediction of interactive effects of CBM production, faulting stress regime, and fault in coal reservoir: Numerical simulation. J. Nat. Gas Sci. Eng. 2022, 99, 104419. [Google Scholar] [CrossRef]
- Sun, X.F.; Zhang, Y.Y.; Li, K.; Gai, Z.Y. A new mathematical simulation model for gas injection enhanced coalbed methane recovery. Fuel 2016, 183, 478–488. [Google Scholar] [CrossRef]
- Wei, Z.; Zhang, D. Coupled fluid-flow and geomechanics for triple-porosity / dual-permeability modeling of coalbed methane recovery. Int. J. Rock Mech. Min. Sci. 2010, 47, 1242–1253. [Google Scholar] [CrossRef]
- Thararoop, P.; Karpyn, Z.T.; Ertekin, T. Development of a coal shrinkage swelling model accounting for water content in the micropores. Int. J. Min. Miner. Eng. 2009, 1, 262–268. [Google Scholar] [CrossRef]
- Thararoop, P.; Karpyn, Z.T.; Ertekin, T. Development of a multi-mechanistic, dual-porosity, dual-permeability, numerical flow model for coalbed methane reservoirs. J. Nat. Gas Sci. Eng. 2012, 8, 121–131. [Google Scholar] [CrossRef]
- Thararoop, P.; Karpyn, Z.T.; Ertekin, T. Development of a material balance equation for coalbed methane reservoirs accounting for the presence of water in the coal matrix and coal shrinkage and swelling. J. Unconv. Oil Gas Resour. 2015, 9, 153–162. [Google Scholar] [CrossRef]
- Li, S.; Fan, C.; Han, J.; Luo, M.; Yang, Z.; Bi, H. A fully coupled thermal-hydraulic-mechanical model with two-phase flow for coalbed methane extraction. J. Nat. Gas Sci. Eng. 2016, 33, 324–336. [Google Scholar] [CrossRef]
- Liu, T.; Lin, B.; Yang, W.F.; Liu, T.; Kong, J.; Zhan, B.H.; Rui, W.; Zhao, Y. Dynamic diffusion-based multifield coupling model for gas drainage. J. Nat. Gas Sci. Eng. 2017, 44, 233–249. [Google Scholar] [CrossRef]
- Meng, S.; Li, Y.; Wang, L.; Wang, K.; Pan, Z. A mathematical model for gas and water production from overlapping fractured coalbed methane and tight gas reservoirs. J. Pet. Sci. Eng. 2018, 171, 959–973. [Google Scholar] [CrossRef]
- Yang, R.; Ma, T.; Xu, H.; Liu, W.; Hu, Y.; Sang, S. A model of fully coupled two-phase flow and coal deformation under dynamic diffusion for coalbed methane extraction. J. Nat. Gas Sci. Eng. 2019, 72, 103010. [Google Scholar] [CrossRef]
- Jang, H.; Kim, Y.; Park, J.; Lee, J. Prediction of production performance by comprehensive methodology for hydraulically fractured well in coalbed methane reservoirs. Int. J. Oil Gas Coal Technol. 2019, 20, 143–168. [Google Scholar] [CrossRef]
- Pillalamarry, M.; Harpalani, S.; Liu, S. Gas diffusion behavior of coal and its impact on production from coalbed methane reservoirs. Int. J. Coal Geol. 2011, 86, 342–348. [Google Scholar] [CrossRef]
- Sun, Z.; Shi, J.; Zhang, T.; Wu, K.; Miao, Y.; Feng, D.; Sun, F.; Han, S.; Wang, S.; Hou, C.; et al. The modified gas-water two phase version flowing material balance equation for low permeability CBM reservoirs. J. Pet. Sci. Eng. 2018, 165, 726–735. [Google Scholar] [CrossRef]
- Shi, J.T.; Jia, Y.R.; Zhang, L.L.; Ji, C.J.; Li, G.F.; Xiong, X.Y.; Zhang, S.A. The generalized method for estimating reserves of shale gas and coalbed methane reservoirs based on material balance equation. Pet. Sci. 2022, 19, 2867–2878. [Google Scholar] [CrossRef]
- Vishal, V.; Mahanta, B.; Pradhan, S.P.; Singh, T.N.; Ranjith, P.G. Simulation of CO2 enhanced coalbed methane recovery in Jharia coalfields, India. Energy 2018, 159, 1185–1194. [Google Scholar] [CrossRef]
- Zhang, X.M.; Chen, B.Y.Y.; Zheng, Z.Z.; Feng, Q.H.; Fan, B. New methods of coalbed methane production analysis based on the generalized gamma distribution and field applications. Appl. Energy 2023, 350, 121729. [Google Scholar] [CrossRef]
- Perera, M.S.A.; Ranjith, P.G.; Ranathunga, A.S.; Koay, A.Y.J.; Zhao, J.; Choi, S.K. Optimization of enhanced coal-bed methane recovery using numerical simulation. J. Geophys. Eng. 2015, 12, 90–107. [Google Scholar] [CrossRef]
- Wang, S.; Li, D.; Li, W. A Semi-Analytical Model for Production Prediction of Deep CBM Wells Considering Gas-Water Two-Phase Flow. Processes 2023, 11, 3022. [Google Scholar] [CrossRef]
- Aminian, K. 9—Modeling and simulation for CBM production. In Coal Bed Methane; Elsevier: Amsterdam, The Netherlands, 2020; pp. 169–174. ISBN 9780128159972. [Google Scholar]
- Stopa, J.; Mikołajczak, J. Empirical modeling of two-phase CBM production using analogy to nature. J. Pet. Sci. Eng. 2018, 171, 1487–1495. [Google Scholar] [CrossRef]
- Liu, Y.; Wang, F.; Tang, H.; Liang, S. Well type and pattern optimization method based on fine numerical simulation in coal-bed methane reservoir. Environ. Earth Sci. 2015, 73, 5877–5890. [Google Scholar] [CrossRef]
- Karimpouli, S.; Tahmasebi, P.; Ramandi, H.L. A review of experimental and numerical modeling of digital coalbed methane: Imaging, segmentation, fracture modeling and permeability prediction. Int. J. Coal Geol. 2020, 228, 103552. [Google Scholar] [CrossRef]
- Xie, J.L.; Zhao, Y.S. A Mathematical Model to Study the Coupling Effect of Deformation-Seepage-Heat Transfer on Coalbed Methane Transport and Its Simulative Application. Math. Probl. Eng. 2020, 2020, 1247240. [Google Scholar] [CrossRef]
- Zhu, W.; Wei, C.; Liu, J.; Qu, H.; Elsworth, D. A model of coal-gas interaction under variable temperatures. Int. J. Coal Geol. 2011, 86, 213–221. [Google Scholar] [CrossRef]
- Alafnan, S.; Awotunde, A.A.; Glatz, G.; Adjei, S.; Alrumaih, I.; Gowida, A. Langmuir adsorption isotherm in unconventional resources: Applicability and limitations. J. Pet. Sci. Eng. 2021, 207, 109172. [Google Scholar] [CrossRef]
- Alana, L.-D.; Mita, D.; Anshul, A.; Kaminsky, R.D. Modeling of Transport Phenomena and Multicomponent Sorption for Shale Gas and Coalbed Methane in an Unstructured Grid Simulator. In Proceedings of the SPE Annual Technical Conference and Exhibition 2011 (ATCE 2011), Denver, CO, USA, 30 October–2 November 2011. [Google Scholar]
- Cai, C.; Li, G.; Huang, Z.; Shen, Z.; Tian, S.; Wei, J.M. Experimental study of the effect of liquid nitrogen cooling on rock pore structure. J. Nat. Gas Sci. Eng. 2014, 21, 507–517. [Google Scholar] [CrossRef]
- Li, S.; Ni, G.; Wang, H.; Xun, M.; Xu, Y. Effects of acid solution of different components on the pore structure and mechanical properties of coal. Adv. Powder Technol. 2020, 31, 1736–1747. [Google Scholar] [CrossRef]
- Zhao, Y.; Hu, Y.; Zhao, B.; Yang, D. Nonlinear Coupled Mathematical Model for Solid Deformation and Gas Seepage in Fractured Media. Transp. Porous Media 2004, 55, 119–136. [Google Scholar] [CrossRef]
- Chu, P.; Liu, Q.; Wang, L.; Chen, E.; Liao, X.; Liu, Y.; Huang, W.; Cheng, Y. Effects of pore morphology and moisture on CBM-related sorption-induced coal deformation: An experimental investigation. Energy Sci. Eng. 2021, 9, 1180–1201. [Google Scholar] [CrossRef]
- Gentzis, T.; Bolen, D. The use of numerical simulation in predicting coalbed methane producibility from the Gates coals, Alberta Inner Foothills, Canada: Comparison with Mannville coal CBM production in the Alberta Syncline. Int. J. Coal Geol. 2008, 74, 215–236. [Google Scholar] [CrossRef]
- Shao, X.; Li, S.; Sun, Y.; Dong, X.; Xu, H.; Liu, Y. Productivity prediction model establishment and numerical simulation of coalbed methane wells. In Proceedings of the 30th Annual International Pittsburgh Coal Conference 2013 (PCC 2013), Beijing, China, 15–18 September 2013; Volume 5, pp. 4177–4188. [Google Scholar]
- Zhao, Y.; Sun, T.F.; Wang, M.Z.; Han, Y.S.; Mu, F.Y.; Li, L.; Jiang, B.; Zhang, J.D. Research on the Production Decline Law of Junlian Coalbed Methane Development Test Well. Chem. Technol. Fuels Oils 2020, 56, 638–645. [Google Scholar]
- Akhondzadeh, H.; Keshavarz, A.; Sayyafzadeh, M.; Kalantariasl, A. Investigating the relative impact of key reservoir parameters on performance of coalbed methane reservoirs by an efficient statistical approach. J. Nat. Gas Sci. Eng. 2018, 53, 416–428. [Google Scholar] [CrossRef]
- Kang, J.Q.; Fu, X.M.; Elsworth, E.; Liang, S. Vertical heterogeneity of permeability and gas content of ultra-high-thickness coalbed methane reservoirs in the southern margin of the Junggar Basin and its influence on gas production. J. Nat. Gas Sci. Eng. 2020, 81, 103455. [Google Scholar] [CrossRef]
- Lu, H.; Ma, X.; Azimi, M. US natural gas consumption prediction using an improved kernel-based nonlinear extension of the Arps decline model. Energy 2020, 194, 116905. [Google Scholar] [CrossRef]
- Hosking, L.J.; Chen, M.; Thomas, H.R. Numerical analysis of dual porosity coupled thermo-hydro-mechanical behaviour during CO2 sequestration in coal. Int. J. Rock Mech. Min. Sci. 2020, 135, 104473. [Google Scholar] [CrossRef]
- Xu, H.; Qin, Y.; Yang, D.; Wang, G.; Huang, Q.; Wu, F. Quantification of Gas Transport Behavior During Coalbed Methane Extraction in A Coal Seam Considering a Dual-Porosity/Single-Permeability Model. Nat. Resour. Res. 2024, 33, 321–345. [Google Scholar] [CrossRef]
- Kumar, H.; Elsworth, D.; Mathews, J.P.; Liu, J.; Pone, D. Effect of CO2 injection on heterogeneously permeable coalbed reservoirs. Fuel 2014, 135, 509–521. [Google Scholar] [CrossRef]
- Song, H.; Lin, B.; Zhong, Z.; Liu, T. Dynamic evolution of gas flow during coalbed methane recovery to reduce greenhouse gas emission: A case study. ACS Omega 2022, 7, 29211–29222. [Google Scholar] [CrossRef] [PubMed]
- Peng, Z.; Deng, Z.; Feng, H.; Liu, S.; Li, Y. Multiscale Lattice Boltzmann Simulation of the Kinetics Process of Methane Desorption-Diffusion in Coal. ACS Omega 2021, 6, 19789–19798. [Google Scholar] [CrossRef]
- Chen, D.; Pan, Z.; Liu, J.; Connell, L.D. An improved relative permeability model for coal reservoirs. Int. J. Coal Geol. 2013, 109, 45–57. [Google Scholar] [CrossRef]
- Ma, T.; Rutqvist, J.; Oldenburg, C.M.; Liu, W.; Junguo, C. Fully coupled two-phase flow and poromechanics modeling of coalbed methane recovery: Impact of geomechanics on production rate. J. Nat. Gas Sci. Eng. 2017, 45, 474–486. [Google Scholar] [CrossRef]
- Singh, A.K.; Singh, R.; Maiti, J.; Kumar, R.; Mandal, P.K. Assessment of mining induced stress development over coal pillars during depillaring. Int. J. Rock Mech. Min. Sci. 2011, 48, 805–818. [Google Scholar] [CrossRef]
- Zhao, Z.; Liu, D.M.; Chen, M.; Wang, B.; Sun, J.Y.; Yu, L.Z.; Cai, Y.D.; Zhao, B.; Sun, F.R. Gas and water performance from the full-cycle of coalbed methane enrichment-drainage-output: A case study of Daning-jixian area in the eastern margin of Ordos Basin. Energy Rep. 2023, 9, 3235–3247. [Google Scholar] [CrossRef]
- Manrique, J.F.; Poe, B.D., Jr.; England, K. Production optimization and practical reservoir management of coal bed methane reservoirs. In Proceedings of the SPE Oklahoma City Oil and Gas Symposium/Production and Operations Symposium, Oklahoma City, OK, USA, 24–27 March 2001; p. SPE-67315-MS. [Google Scholar]
- Chattaraj, S.; Upadhyay, R.; Mohanty, D.; Halder, G.; Kumar, T. Evaluating production behaviour of CBM wells from Raniganj Coalfield through reservoir characterization under constrained field data conditions. J. Nat. Gas Sci. Eng. 2021, 92, 103969. [Google Scholar] [CrossRef]
- Cui, X.; Bustin, R.M. Volumetric strain associated with methane desorption and its impact on coalbed gas production from deep coal seams. Aapg Bull. 2005, 89, 1181–1202. [Google Scholar] [CrossRef]
- Zhao, J.; Tang, D.; Lin, W.; Xu, H.; Li, Y.; Tao, S.; Lv, Y. Permeability dynamic variation under the action of stress in the medium and high rank coal reservoir. J. Nat. Gas Sci. Eng. 2015, 26, 1030–1041. [Google Scholar] [CrossRef]
- Zhao, J.; Tang, D.; Qin, Y.; Xu, H. Experimental study on structural models of coal macrolithotypes and its well logging responses in the Hancheng area, Ordos Basin, China. J. Pet. Sci. Eng. 2018, 166, 658–672. [Google Scholar] [CrossRef]
- Harpalani, S.; Prusty, B.K.; Dutta, P. Methane/CO2 sorption modeling for coalbed methane production and CO2 sequestration. Energy Fuels 2006, 20, 1591–1599. [Google Scholar] [CrossRef]
- Shi, J.Q.; Durucan, S. Drawdown Induced Changes in Permeability of Coalbeds: A New Interpretation of the Reservoir Response to Primary Recovery. Transp. Porous Media 2004, 56, 1–16. [Google Scholar] [CrossRef]
- Wang, J.; Hu, B.; Liu, H.J.; Han, Y.; Liu, J.D. Effects of “soft-hard” compaction and multiscale flow on the shale gas production from a multistage hydraulic fractured horizontal well. J. Pet. Sci. Eng. 2018, 170, 873–887. [Google Scholar] [CrossRef]
- Dutta, P.; Bhowmik, S.; Das, S. Methane and carbon dioxide sorption on a set of coals from India. Int. J. Coal Geol. 2011, 85, 289–299. [Google Scholar] [CrossRef]
- Robertson, E.P. Measurement and modeling of sorption-induced strain and permeability changes in coal. In 2000–2009-Mines Theses & Dissertations; ProQuest LLC: Ann Arbor, MI, USA, 2005. [Google Scholar]
- Danesh, N.N.; Chen, Z.; Connell, L.D.; Kizil, M.S.; Pan, Z.; Aminossadati, S.M. Characterisation of creep in coal and its impact on permeability: An experimental study. Int. J. Coal Geol. 2017, 173, 200–211. [Google Scholar] [CrossRef]
- Robertson, E.P.; Christiansen, R.L. A permeability model for coal and other fractured, sorptive-elastic media. Spe J. 2008, 13, 314–324. [Google Scholar] [CrossRef]
- Salmachi, A.; Rajabi, M.; Wainman, C.; Mackie, S.; McCabe, P.; Camac, B.; Clarkson, C. History, Geology, In Situ Stress Pattern, Gas Content and Permeability of Coal Seam Gas Basins in Australia: A Review. Energies 2021, 14, 2651. [Google Scholar] [CrossRef]
- Guo, C.C.; Yu, S.; Guo, K.W.; Shi, Y.F. Orthogonal Experimental on Influencing Factors of Surface Subsidence in Filling Mining. Beijing Surv. Mapp. 2021, 35, 543–547. [Google Scholar]
- Mukhopadhyay, A.; Dhawan, K. An L9 orthogonal design methodology to study the impact of operating parameters on particulate emission and related characteristics during pulse-jet filtration process. Powder Technol. 2009, 195, 128–134. [Google Scholar] [CrossRef]
- Zuber, M.D.; Olszewski, A.J. The Impact of Errors in Measurements of Coalbed Methane Reservoir Properties on Well Production Forecasts. In Proceedings of the SPE Annual Technical Conference and Exhibition, Washington, DC, USA, 4–7 October 1992. [Google Scholar]
- Zuber, M.D.; Olszewski, A.J. Coalbed methane production forecasting: Measurement accuracy required for key reservoir properties. In Proceedings of the 1993 International Coalbed Methane Symposium, Birmingham, AL, USA, 17–21 May 1993; p. 549. [Google Scholar]
- Agarwal, A.; Mandal, A.; Karmakar, B.; Ojha, K. Modeling and performance prediction for water production in CBM wells of an Eastern India coalfield. J. Pet. Sci. Eng. 2013, 103, 115–120. [Google Scholar] [CrossRef]
- Burton, Z.F.; Moldowan, J.M.; Sykes, R.; Graham, S.A. Unraveling petroleum degradation, maturity, and mixing and addressing impact on petroleum prospectivity: Insights from frontier exploration regions in New Zealand. Energy Fuels 2018, 32, 1287–1296. [Google Scholar] [CrossRef]
- Burton, Z.F.; Moldowan, J.M.; Magoon, L.B.; Sykes, R.; Graham, S.A. Interpretation of source rock depositional environment and age from seep oil, east coast of New Zealand. Int. J. Earth Sci. 2019, 108, 1079–1091. [Google Scholar] [CrossRef]
- Mohamed, T.; Mehana, M. Coalbed methane characterization and modeling: Review and outlook. Energy Sources Part A Recovery Util. Environ. Eff. 2020, 1–23. [Google Scholar] [CrossRef]
- Schepers, K.C.; Gonzalez, R.J.; Koperna, G.J.; Oudinot, A.Y. Reservoir modeling in support of shale gas exploration. In Proceedings of the SPE Latin America and Caribbean Petroleum Engineering Conference, Cartagena, Columbia, 31 May–3 June 2009; p. SPE-123057. [Google Scholar]
- Vishal, V.; Singh, L.; Pradhan, S.P.; Singh, T.N.; Ranjith, P.G. Numerical modeling of Gondwana coal seams in India as coalbed methane reservoirs substituted for carbon dioxide sequestration. Energy 2013, 49, 384–394. [Google Scholar] [CrossRef]
Figure 1.
The coupling relationship between the deformation field, diffusion field, and seepage field.
Figure 1.
The coupling relationship between the deformation field, diffusion field, and seepage field.

Figure 2.
Physical model of CBM vertical well production. (a) Physical Model of CBM Vertical Well Mining (The green arrow indicates axial stress in MPa). (b) Schematic of the geometric model for CBM extraction.
Figure 2.
Physical model of CBM vertical well production. (a) Physical Model of CBM Vertical Well Mining (The green arrow indicates axial stress in MPa). (b) Schematic of the geometric model for CBM extraction.

Figure 3.
Fitting curve of daily gas production and daily water production. (a) Daily gas production. (b) Daily water production.
Figure 3.
Fitting curve of daily gas production and daily water production. (a) Daily gas production. (b) Daily water production.


Figure 4.
Production characteristics with different initial water saturation parameters.

Figure 5.
Production characteristics of different ratio parameters.


Figure 6.
Production characteristics of different Langmuir volume parameters.

Figure 7.
Production characteristics of different Langmuir pressure parameters.

Figure 8.
Production characteristics of different Langmuir strain constant parameters.

Figure 9.
Production characteristics of different elastic modulus parameters.


Table 1.
Basic parameters for fitting field production data.
| Parameter Name | Parameters to Describe | Parameter Value | Unit |
|---|---|---|---|
| ϕf0 | Initial fracture porosity | 0.035 | |
| ϕm | Porosity of matrix | 0.01 | |
| kx0 | Initial equivalent permeability in x direction | 6.0 | mD |
| ky0 | Initial equivalent permeability in y direction | 3.2 | mD |
| kz0 | Vertical initial permeability | 0.6 | mD |
| bk | Klinkenberg factors | 0.5 | MPa |
| μg | Methane viscosity coefficient | 1.84 × 10⁻⁵ | Pa·s |
| μw | Water viscosity coefficient | 1.01 × 10⁻³ | Pa·s |
| pm0 | Initial methane pressure in the coal matrix | 4.70 | MPa |
| pfg0 | Initial methane pressure in the coal fracture | 4.70 | MPa |
| pcd | Critical desorption pressure | 3.67 | MPa |
| pL | Langmuir pressure | 2.19 | MPa |
| VL | Langmuir volume | 22.89 | m3·t−1 |
| ρc | Apparent density of the coal | 1480 | kg·m−3 |
| ρga | Methane density under standard conditions | 0.716 | kg·m−3 |
| ρw | Density of water under standard conditions | 1000 | kg·m−3 |
| τ | Adsorption time | 6.5 | d |
| v | Poisson’s ratio of the coal | 0.365 | |
| εL | Deformation of the ultimate adsorption | 0.012 | |
| E | Elastic modulus of the coal | 2.1 | GPa |
| Em | Elastic modulus of the coal matrix | 3.6 | GPa |
| cf | Fracture compression coefficient | 0.03 | MPa−1 |
| pe | Inlet pressure | 0.05 | MPa |
| krg0 | Relative permeability at the end of the gaseous phase | 0.7 | |
| krw0 | Relative permeability at the end of the aqueous phase | 0.9 | |
| Sgr0 | Initial residual gas saturation | 0.05 | |
| Sw0 | Initial water saturation | 0.926 |
Table 2.
Numerical model input parameters.
| Parameter Name | Parameters to Describe | Parameter Value | Unit |
|---|---|---|---|
| ϕf0 | Initial fracture porosity | 0.03 | |
| ϕm | Porosity of matrix | 0.01 | |
| k0 | Initial permeability | 15 | mD |
| kz0 | Vertical initial permeability | 0.6 | mD |
| pm0 | Initial methane pressure in the coal matrix | 6 | MPa |
| pfg0 | Initial methane pressure in the coal fracture | 6 | MPa |
| pcd | Critical desorption pressure | 4.8 | MPa |
| pL | Langmuir pressure | 2 | MPa |
| VL | Langmuir volume | 20 | m3·t−1 |
| τ | Adsorption time | 6.5 | d |
| v | Poisson’s ratio of the coal | 0.24 | |
| εL | Deformation of the ultimate adsorption | 0.012 | |
| E | Elastic modulus of the coal | 2.1 | GPa |
| Em | Elastic modulus of the coal matrix | 7.2 | GPa |
| cf | Fracture compression coefficient | 0.1 | MPa−1 |
| Sw0 | Initial water saturation | 0.9 |
Table 3.
Orthogonal experimental design and results.
| Plan | Sw0 | pcd/p0 | VL/m3·t−1 | pL/MPa | εL | E/GPa | Average Daily Gas Volume/m3 |
|---|---|---|---|---|---|---|---|
| 1 | 0.7 | 0.4 | 10 | 1.2 | 0.002 | 1 | 247.45 |
| 2 | 0.7 | 0.4 | 20 | 2.4 | 0.012 | 3 | 129.95 |
| 3 | 0.7 | 0.6 | 10 | 3.6 | 0.012 | 2 | 204.89 |
| 4 | 0.7 | 0.6 | 30 | 1.2 | 0.008 | 3 | 870.22 |
| 5 | 0.7 | 0.8 | 20 | 3.6 | 0.008 | 1 | 1273.74 |
| 6 | 0.7 | 0.8 | 30 | 2.4 | 0.002 | 2 | 1125.56 |
| 7 | 0.8 | 0.4 | 10 | 3.6 | 0.008 | 3 | 440.65 |
| 8 | 0.8 | 0.4 | 30 | 1.2 | 0.012 | 2 | 2180.40 |
| 9 | 0.8 | 0.6 | 20 | 2.4 | 0.008 | 2 | 1195.39 |
| 10 | 0.8 | 0.6 | 30 | 3.6 | 0.002 | 1 | 733.88 |
| 11 | 0.8 | 0.8 | 10 | 2.4 | 0.012 | 1 | 923.91 |
| 12 | 0.8 | 0.8 | 20 | 1.2 | 0.002 | 3 | 375.85 |
| 13 | 0.9 | 0.4 | 20 | 3.6 | 0.002 | 2 | 401.03 |
| 14 | 0.9 | 0.4 | 30 | 2.4 | 0.008 | 1 | 1047.10 |
| 15 | 0.9 | 0.6 | 10 | 2.4 | 0.002 | 3 | 1447.97 |
| 16 | 0.9 | 0.6 | 20 | 1.2 | 0.012 | 1 | 1803.88 |
| 17 | 0.9 | 0.8 | 10 | 1.2 | 0.008 | 2 | 823.20 |
| 18 | 0.9 | 0.8 | 30 | 3.6 | 0.012 | 3 | 667.39 |
Table 4.
Comprehensive average and range analysis of each level factor.
| Experimental Factor | Mean Horizontal Level k1 | Mean Horizontal Level k2 | Mean Horizontal Level k3 | Poor R | The Sorting |
|---|---|---|---|---|---|
| εL | 721.96 | 941.72 | 985.07 | 263.11 | 1 |
| pcd/p0 | 741.10 | 1042.71 | 864.94 | 301.61 | 2 |
| E | 1004.99 | 988.41 | 655.34 | 349.65 | 3 |
| Sw0 | 641.97 | 975.01 | 1031.76 | 389.79 | 4 |
| pL | 1050.17 | 978.31 | 620.26 | 429.91 | 5 |
| VL | 681.35 | 863.31 | 1436.72 | 755.37 | 6 |
Disclaimer/Publisher’s Note: The statements, opinions and data contained in all publications are solely those of the individual author(s) and contributor(s) and not of MDPI and/or the editor(s). MDPI and/or the editor(s) disclaim responsibility for any injury to people or property resulting from any ideas, methods, instructions or products referred to in the content. |
© 2024 by the authors. Licensee MDPI, Basel, Switzerland. This article is an open access article distributed under the terms and conditions of the Creative Commons Attribution (CC BY) license (https://creativecommons.org/licenses/by/4.0/).
Share and Cite
MDPI and ACS Style
Wang, C.; Zhao, H.; Liu, Z.; Wang, T.; Chen, G. A Fully Coupled Gas–Water–Solids Mathematical Model for Vertical Well Drainage of Coalbed Methane. Energies 2024, 17, 1497. https://doi.org/10.3390/en17061497
AMA Style
Wang C, Zhao H, Liu Z, Wang T, Chen G. A Fully Coupled Gas–Water–Solids Mathematical Model for Vertical Well Drainage of Coalbed Methane. Energies. 2024; 17(6):1497. https://doi.org/10.3390/en17061497
Chicago/Turabian StyleWang, Chengwang, Haifeng Zhao, Zhan Liu, Tengfei Wang, and Gaojie Chen. 2024. "A Fully Coupled Gas–Water–Solids Mathematical Model for Vertical Well Drainage of Coalbed Methane" Energies 17, no. 6: 1497. https://doi.org/10.3390/en17061497
Note that from the first issue of 2016, this journal uses article numbers instead of page numbers. See further details here.