
Assessment of Spent Nuclear Fuel in Ukrainian Storage System: Inventory and Performance

Department of Civil and Industrial Engineering, University of Pisa, Lg. L. Lazzarino, n. 1, 56126 Pisa, Italy
*
Author to whom correspondence should be addressed.
Energies 2024, 17(8), 1945; https://doi.org/10.3390/en17081945
Submission received: 26 March 2024
/
Revised: 12 April 2024
/
Accepted: 16 April 2024
/
Published: 19 April 2024
(This article belongs to the Section B4: Nuclear Energy)
Abstract
:It is of meaningful importance to evaluate the performance of all the nuclear facilities, and particularly those part of such buildings where spent nuclear fuel (SNF) is stored to assess what kinds of consequences are anomalous/abnormal or to determine what types of accident events may occur. In this preliminary study, the strategies adopted for the management of SNF, and the risk related to them are discussed. The aim of this study is to evaluate the total radioactivity inventory characterising Ukrainian nuclear facilities, including storage facilities. The dataset used to calculate the total activity associated with nuclear fuel is provided and discussed. For the evaluation, it is considered that a SNF pool in VVER-1000 is designed to store 687 fuel assemblies, and 670 are in VVER-440. When it is half full, which is the case for 15 Ukrainian units, it will store about 2200 tU containing up to 1·1019 Bq of 137Cs, 7·1018 Bq of 90Sr, and 1·1019 Bq of TUE. This study focuses particularly on the total activity of the SNF stored at the Zaporozhye plant, the biggest nuclear plant in Europe, and the risk posed by the potential loss that cooling the plant could incur because of pond water level variation. The results of the analysis of the Zaporozhye NPP behaviour suggest that the water flow rate which keeps the SNF pool temperature constant is about 200,000 m3·day−1. Therefore, the water level in the pond should not be lower than 1.5–2 m; otherwise, the plant will need an additional source of water of more than 200,000 m3 per day to guarantee safe storage of SNF.
1. Introduction
The inclusion of nuclear energy (as for the current EU taxonomy [1,2]) among environmentally sustainable energy sources effectively makes it one capable of tackling the dual challenge of guaranteeing the energy security, in terms of its reliability in energy supply, and of containing greenhouse gas emissions. Sustainability is certainly one of the most important aspects that influences the complex international energy scenario and its future forecasts. Predictions will require management strategies for spent nuclear fuel (SNF), currently stored wet or dry, which represents approximately 70% of the global spent fuel inventory.
The capacity of storage systems can vary depending on the strategies adopted, such as using the facility only for short-term storage before the SNF is transported to a disposal plant and the types of reactors, depending on the fuel cycle. Although the improved efficiency of nuclear systems and facilities has led to a reduction in spent fuel produced compared to the (net) energy produced, the need for a suitable SNF management and storage facility performance assessment, including security and safety aspects, remains. The latter is certainly not a secondary aspect or to be overlooked in consideration of the current war scenarios in which they are involved.
The possibility of human actions (inadvertent or not) has not normally been considered relevant to date for the purposes of the safety assessment of a storage facility. However, recent international events in Ukraine have highlighted the need to reconsider the risk associated, e.g., with the shelling of SFN storage facilities, and to improve their surveillance, monitoring, and maintenance. This study aims to analyse the Ukrainian storage facilities which, like the one located in the Chernobyl Exclusion Zone, are constantly subject to the risk of a severe accident occurring and to evaluate the volume of radioactivity stored within them.
It is worthy to remark, as an example, that Ukrainian SNF facilities have often suffered, since 2022, long-term and complete loss of offsite power because of the constant bombardment of electricity grids. This has occurred several times and Ukraine was forced to rely on emergency diesel generators to ensure the plant’s safety and security, such as reactor cooling. Spent nuclear fuel is the Achilles’ heel of nuclear power, as it requires constant cooling and ventilation for several years to decades. The failure of the power supply, and the cessation of cooling and ventilation of the spent fuel pool, leads to a nuclear reactor disaster, as happened, for example, in Fukushima.
2. Storage Strategies
SNF’s main characteristics relevant to the design of storage systems are thermal power and radiation characteristics. These are strongly dependent on the expected fuel type and geometry for storage, the initial enrichment (known as initial conditions), the residence time at the core, burnup conditions, the time since its last discharge from the core, etc. Such characteristics may be evaluated by performing either calculations based on historical records or on direct (burnup meters) or indirect measurements made at the time of interest [3,4]. Bergersol et al. [3] provides an assessment of the radiotoxicity and decay heat power of 1 ton of SNF discharged from a VVER-1000 reactor, calculating separately the contribution of actinides and fission products. The results showed that the fission products contribute to the decay heat power mainly in the short storage period (<50 years). As highlighted in [4], the accuracy of the results obtained from analytical and numerical calculations depends on the degree of the accuracy of available data and on the use of appropriate cross-section libraries [5,6,7]. At present, most of the calculations of spent fuel characteristics after in-service operation are performed by means of validated numerical codes such as ORIGEN (Oak Ridge Isotope Generation, developed at ORNL, Oak Ridge, TN, USA) or KORIGEN (FZK, Hannover, Germany). However, the behaviour out-of-reactor, at interim storage or final disposal, requires a detailed isotopic characterisation and radioactivity evaluation [6,7,8].
The storage of spent fuel requires paying particular attention to the design, performance, and durability of storage systems to verify that the safety requirements are guaranteed and met even in the long-term. Several factors like the occurrence of external hazards (natural and/or human-induced) can significantly affect the safety of the long-term storage systems. For this reason, the environment might also offer additional protective functions, such as, e.g., radionuclides sorption capacity in the case of leakage. Such aspects affect and condition the siting of a storage facility and the selection of a proper storage strategy.
The strategies for SNF storage consist mainly of using both a wet and dry storage method. These strategies are used both in Western and Eastern countries. In most cases, wet storage is followed (transition period of 3–10 years) by dry storage if the SNF back-end strategy includes dry interim storage. Moreover, storage conditions may vary significantly between wet and dry storage; as an example, the temperature of the concrete in storage systems can vary from 30 to 80 °C. This and many other parameters, such as foundation movement, structural overloading, damage from accidental impact and chemical/environmental conditions could impact the long-term durability requirements of storage facilities.
The wet storage is implemented both at the reactor (AR) and away from the reactor (AFR) [9,10]. The storage pools, made of thick reinforced concrete with steel liners, consist of one large pool or several smaller modular ones, connected to each other by transfer channels. Most of the wet storage designs are similar: rectangular prismatic structures, approximately 10 m deep, filled with water to prevent criticality as the SNF contains fissile isotopes. Figure 1 shows examples of arrangements of storage ponds for racked fuel assemblies [9].
The dry storage system is implemented by holding the SNF in a special container, termed cask, this way also facilitating its movement and storage or its eventual disposal. Whatever the cask design, the chosen material must be resistant to mechanical shocks and thermal effects and stable from both a chemical and radiological point of view.
The design requirements to be fulfilled are provided in the IAEA SSR-6 [11,12]. The cask typically constitutes of a steel cylinder body with either welded or bolted closure ends, providing containment and confinement of the spent fuel. The fuel basket contains fuel rod assemblies and holds them in fixed positions to prevent criticality or any accidents from occurring. To avoid pressurisation and corrosion during storage, all the casks are dried to attain and maintain the gaseous environment required to protect SNF integrity. Figure 2 shows a concrete cask [13]; it is the reinforced or high-density concrete that ensures its structural strength and radiological shielding. Whatever the storage strategy selected, it must
- (1)
- ensure the integrity of fuel cladding in all storage conditions,
- (2)
- provide adequate cooling in order not to exceed fuel temperature limits,
- (3)
- ensure radiological shielding, and
- (4)
- retrieve fuel anytime.
3. Nuclear Inventory Evaluation
In this section, the data used to calculate the total activity associated with nuclear fuel are provided. It is to be remarked that the nuclear fuel that is loaded into the reactor is low-level radioactive. Moreover, its radioactivity increases during the fission of heavy element nuclei and reaches its maximum value in 2–3 years. The SNF inventory is due to the decay of fission products (FPs), and actinides and activation products; even the contribution of the latter is lower than the others. The composition of plutonium and uranium changes with burnup and particularly that of the plutonium with cooling time. As for noble gas activity, it is considered less meaningful for longer interim storage periods.
For the proposed assessment, we have used the information sources on the development of nuclear power engineering [14,15] and SNF management [16,17] in Ukraine, construction of nuclear reactors and related SNF wet and dry facilities [18,19,20], and the chemical and radionuclide composition of spent nuclear fuel [21,22] (Table 1).
To calculate the activity of the actinides as a function of storage period, we used reference data on the SNF activity from VVER-440 and VVER-1000 reactors with enrichments of 3.6% and 4.4%, respectively [22].
To achieve our aim, the difference between the total specific activity of SNF and fission products was calculated separately, immediately after unloading and for a period up to 30 years. The fuel can then be reprocessed or transferred to a dry storage site according to the nuclear fuel cycle strategy Ukraine will adopt. The decay rate constant for the SNF actinide mixture was obtained by the iteration method. The obtained data obey a two-exponential dependence with high reliability (R2 = 0.99) and a confidence level of 95.0% (alpha = 0.050):
where k1 and k2 are decay rate constants for the mixture of short- and long-lived actinides, and a1 and a2 are natural logarithm of their specific activities, respectively. Within half a year after unloading, short-lived Transuranium elements (TUE) almost completely decay (Figure 3); the rate constant of decay of the mixture of long-lived actinides is (1.30–1.39)·10−3 year−1 which is in agreement with the results obtained from independent data (1.35·10−3 year−1) [24] (Table 2).
4. SNF Radioactivity Results and Discussion
The nuclear energy complex of Ukraine, shown in Figure 4 where the plants’ sites are indicated with progressive numbering from 1 to 5, includes five NPPs with four LWGR (RBMK-1000) reactors under permanent shutdown status (Chernobyl NPP, which is decommissioning), 13 PWR (VVER-1000: Zaporozhye (6), South Ukraine (3), Rivne (2), and Khmelnitski (2) NPPs), and VVER-440: Rivne (2). The total installed electrical net capacity is 13.107 GW(e) [14,15,17]. The permanent shutdown total net capacity (from [15]) is 3.515 GW(e) instead.
In what follows, a detailed analysis of the total activity of the SNF stored at the Chernobyl Exclusion Zone and Zaporozhye plant is provided. The effects caused by Tritium released from the SNF to the spent nuclear pool is not considered as it was discussed separately in [25].
The Chernobyl Exclusion Zone (ChEZ) covers an area of almost 2600 km2 and includes the industrial site of the Chernobyl NPP; the new safe confinement; the shelter over the emergency Unit 4; wet and dry SNF storage facilities for spent nuclear fuel unloaded from ChNPP Units 1, 2, and 3; the RAW processing and storage facility “Vector”; and the central SNF storage facility for VVER reactors.
The territory is contaminated with artificial radionuclides from accidental release, which is estimated at 3 to 5% of the irradiated nuclear fuel contained in the emergency Unit 4 that corresponds to 5.8–9.6 tU.
We estimated the radioactivity stocks distributed among contaminated ecosystems and radioactive waste disposal, excluding the emergency unit. Spent fuel storage facilities, as of 2023, at 9.2·1015 Bq of total activity, included 5.59·1015 137Cs, 3.26·1015 90Sr and 3.2·1014 long-lived actinides (Trans-uranium elements, TUE) (Table 3).
After the Chernobyl NPP was shut down on December 2000, 21,284 fuel assemblies (FAs) (over 2400 tU with total activity of 7.3·1019 Bq as of 2001, containing more than 6 t of 239Pu) were accumulated in an independent SNF pool located at the site remote from reactors. As of 2022, it contained 19,442 FAs.
Table 3 provides the total activity of the ChEZ in 1986 and 2023.
Currently, the SNF at ChNPP facilities contains 11 to 32 times more long-lived radionuclides than that accumulated in the accidental Unit 4 at the time of the Chernobyl accident. This amount exceeds by a factor of 50 for 137Cs, 250 for 90Sr, and more than 2000 for actinides released following this accident.
The Zaporozhye NPP is the biggest nuclear power plant in Europe, equipped with six VVER-1000 reactors with a total electrical capacity of 6 GWe. The reactors are equipped with spent fuel pools with a capacity of 704 assemblies each. Annually, 42 FAs are unloaded from each reactor into the spent fuel pool, which is about 21–23 tU.
Since 2001, after 3–5 years of storing, they have been transferred to the spent-fuel dry storage facility (SFDSF) at the site, which can accommodate 9120 FAs in 380 ventilated storage casks of 144 t each. The SFDSF facility was designed for a 50-year storage lifetime, which is a period defined on the basis of the degradation and integrity reduction processes that may affect the fuel which is subjected to high temperature and high tensile stresses, e.g., hydrogen-related effects, creep, fission gas release, and fuel swelling [26,27]. Beyond this period, it would be necessary to provide sufficient evidence that the spent fuel condition would not have deteriorated to an extent that any handling or retrieval would be prevented.
The annual unloaded SNF (having different weights as indicated in Table 1) was about 110 tU.
SNF radioactivity stock as of 2023 is provided in Table 4. The radioactivity evaluation was carried out by considering the half-filling of spent fuel pools with a 3-year SNF storage and 174 casks stored at the dry repository, corresponding to 2272 tU completely (see Table 4).
Considering the annual dynamics of SNF loading and decay, the SNF radioactivity inventory in dry and wet storage at the ZNPP site exceeds by a factor of 140 for 137Cs, 900 for 90Sr, and more than 6400 for actinides released as a result of the Chernobyl accident in 1986.
In consideration of that, the risk of a nuclear accident is high due to the durability of the materials that the storage facility is made of, particularly the concrete, which has low resistance under tension. Furthermore, the possible damage caused to the storage facility, i.e., following shelling or being out-of-service for emergency repairs or shutdown (via cyclic, dynamic, and thermo-mechanical loadings) can increase the risk of integrity loss and leakage of radionuclides. In particular, the latter could occur as a consequence of filtration compression caused by an increase in the hydrodynamic pressure of the water-saturated soils, which may adversely affect the cooling pond of the ZNPP.
The analysis of the impact of the emergency drainage of the Kakhovka Reservoir basin on the ZNPP has shown that the deterioration of the engineering and geological conditions for the operation of safety-relevant infrastructure is due to the decrease in groundwater levels, caused by
- a large area of lowered groundwater levels (up to 16,000 km2), which is almost eight times the area of flooding along the Dnipro River coastal zones, where long-term subsidence of flooded loess soils will occur, and
- subsidence and sinkhole processes in waterlogged and flooded massifs of forest rocks with deformations of the earth’s surface within cities, towns, the Zaporozhye NPP industrial site, as well as areas where critical infrastructure facilities (railways, water pipes, etc.) are located.
According to the Theis equation [28], the distance of change in hydraulic pressure (R) in groundwater flow with time (T) and the pressure redistribution coefficient (a) are related as follows: R2 = 2.225·a·T. The estimated time for the pressurized water level reduction (tRed) in the backwater zone of the Kakhovka reservoir at up to 25 km (Lbackup = 25,000 m) calculated by Equation (2) is 1389 days, approximately 4 years.
where ay is the piezoconductivity coefficient of pressure horizons in the zone of backwater and backwater influence of the Kakhovka reservoir; ay = 2·105 m2·day−1 corresponds to the pressure redistribution coefficient. Thus, the spatial and temporal development of exogenous geodynamic processes that are dangerous for critical infrastructure facilities (subsidence, landslides, karst-suffosion deformations, etc.) in the loess-rock overmoistured massif will have stochastic (disordered) dynamics and a long period of activation for the coastal zones of the Dnipro River and the Zaporozhye NPP industrial site.
In the condition of prolonged flooding of the area which impacted the Kakhovka HPP water management complex and disrupted water and heat transfer in the loess-rock massif, there was a significant deterioration in the engineering and seismic geological stability of the underground of critical infrastructure facilities and buildings of the Zaporozhye NPP located in the six-point earthquake zone (MSK-64 scale) [29,30].
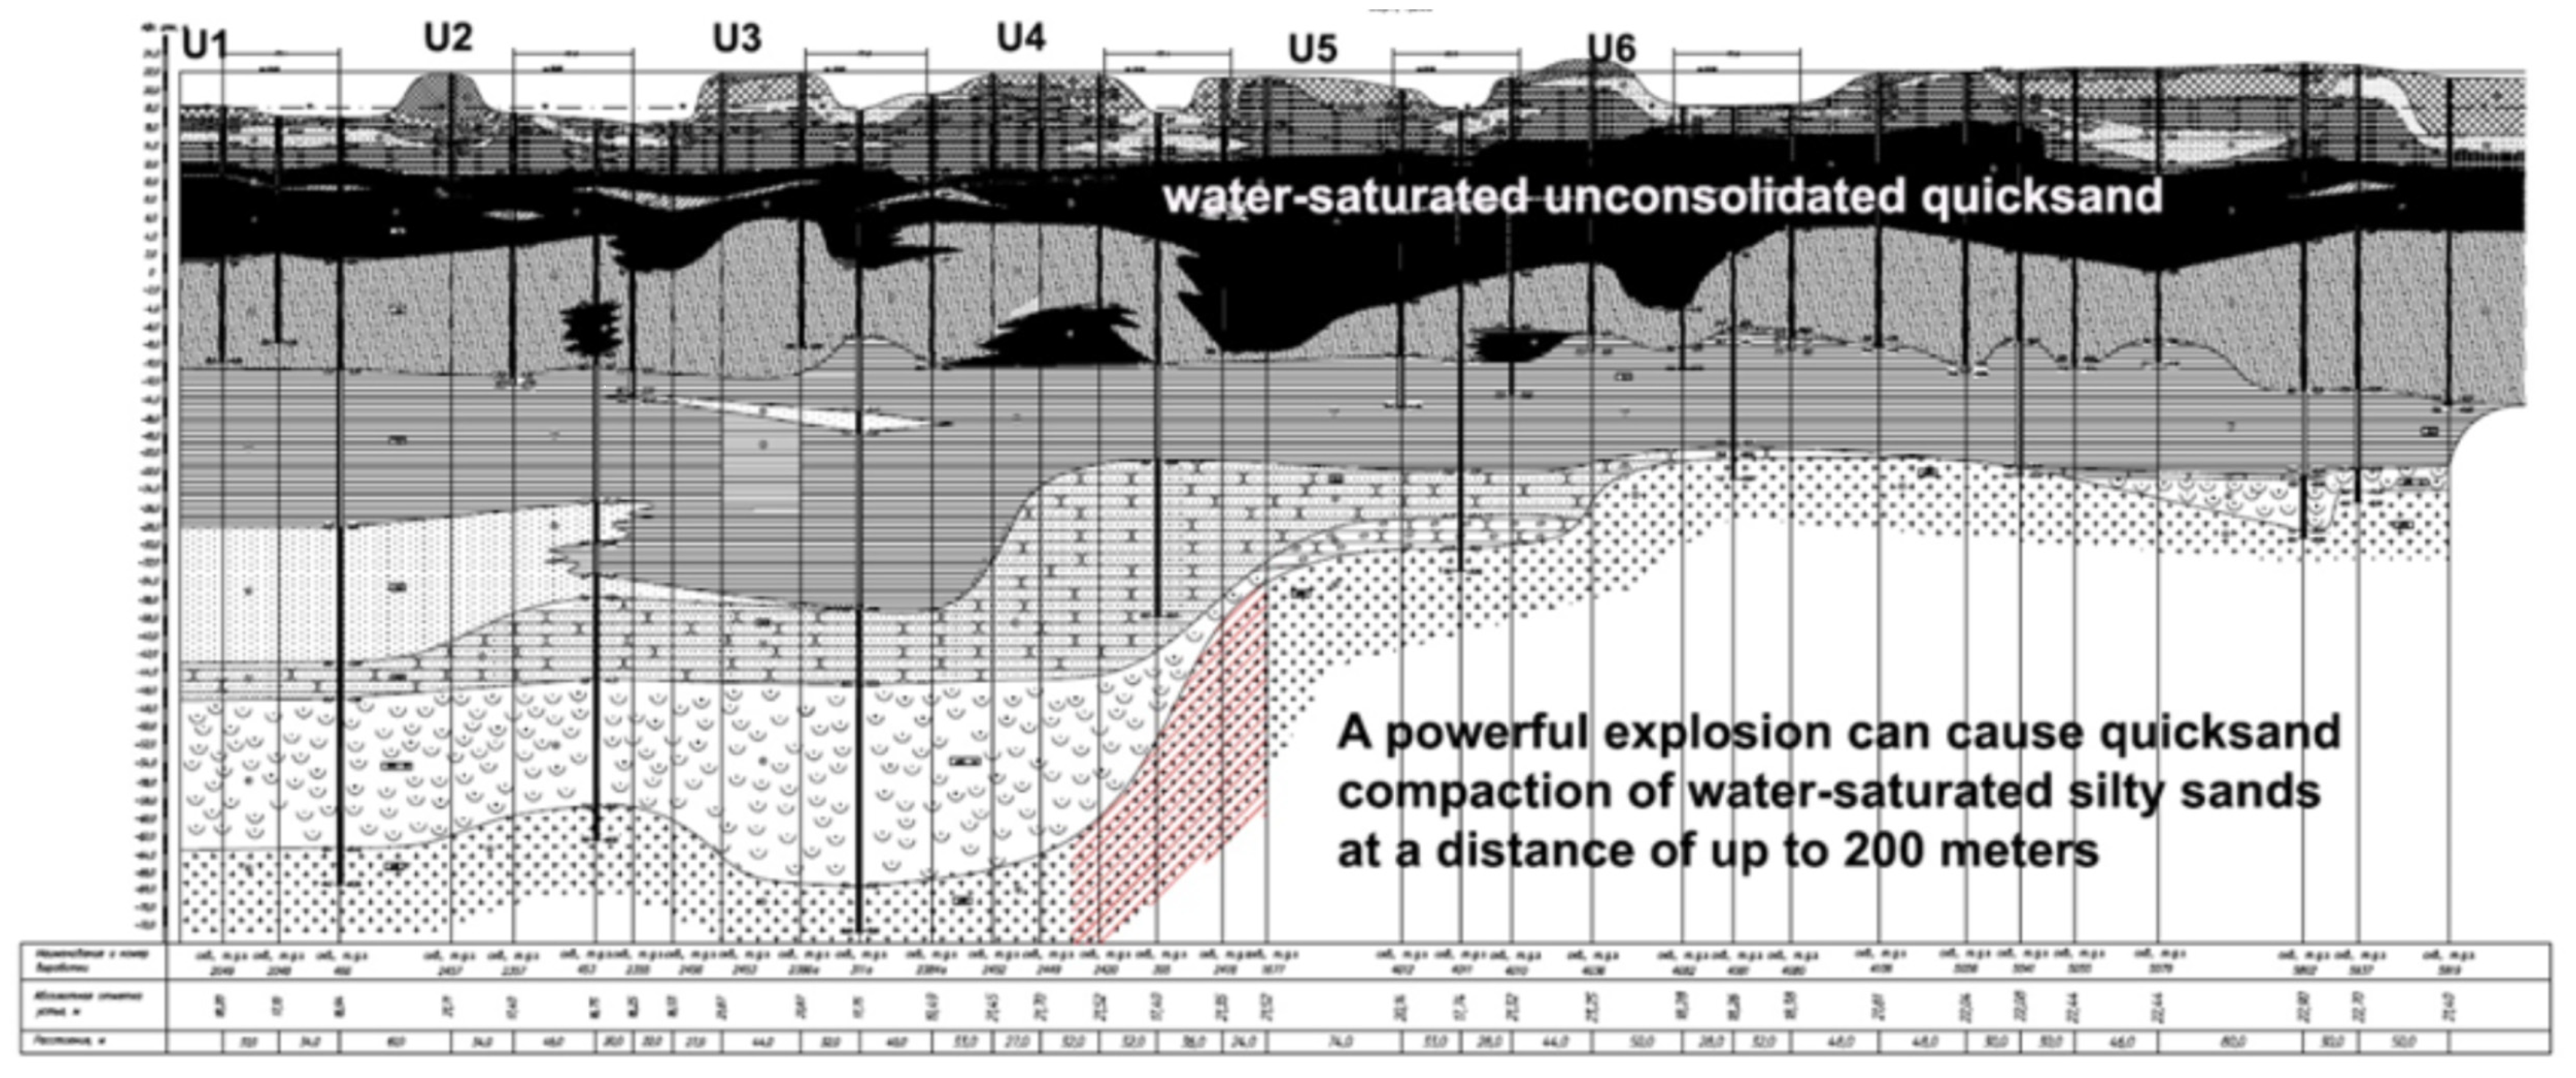
The low permeability of water-saturated floatable loess-loamy rocks (Figure 5) contributes to the long-term rise in pore pressure in the water-saturated zone and the accumulation of aftershocks. Dynamic stressors (loadings) could create a zone of quicksand compaction of water-saturated dusty sands at up to 200 m and damage the reactor cooling system of the SNF pools.
The time (t) of pore pressure reduction in weakly permeable rocks in the subsoil of a building (S = 80 × 80 m2) can be calculated as
In the above Equation (3), a is the water permeability of weakly permeable compressed rocks of the power unit subsoil foundation which corresponds to the pressure redistribution coefficient that is obtained as
k is the filtration coefficient of weakly permeable rocks (loams, loess, and sandy clay layers), k ≈ 1.0 mday−1, while h is the thickness of the subsoil horizon layer in contact with the bottom of the foundation, which is assumed equal to 20 m. μ (=0.1) is the water transfer coefficient. Substituting these parameters’ values into Equation (3), it follows that
Thus, a slow decrease in pore pressure in the subsoil of the foundation of the critical structures may be a factor in the long-term response to aftershocks, including anthropogenic vibrations (transport, construction work, explosions, etc.) and a decrease in the plant units’ stability due to the loosening of the subsoil.
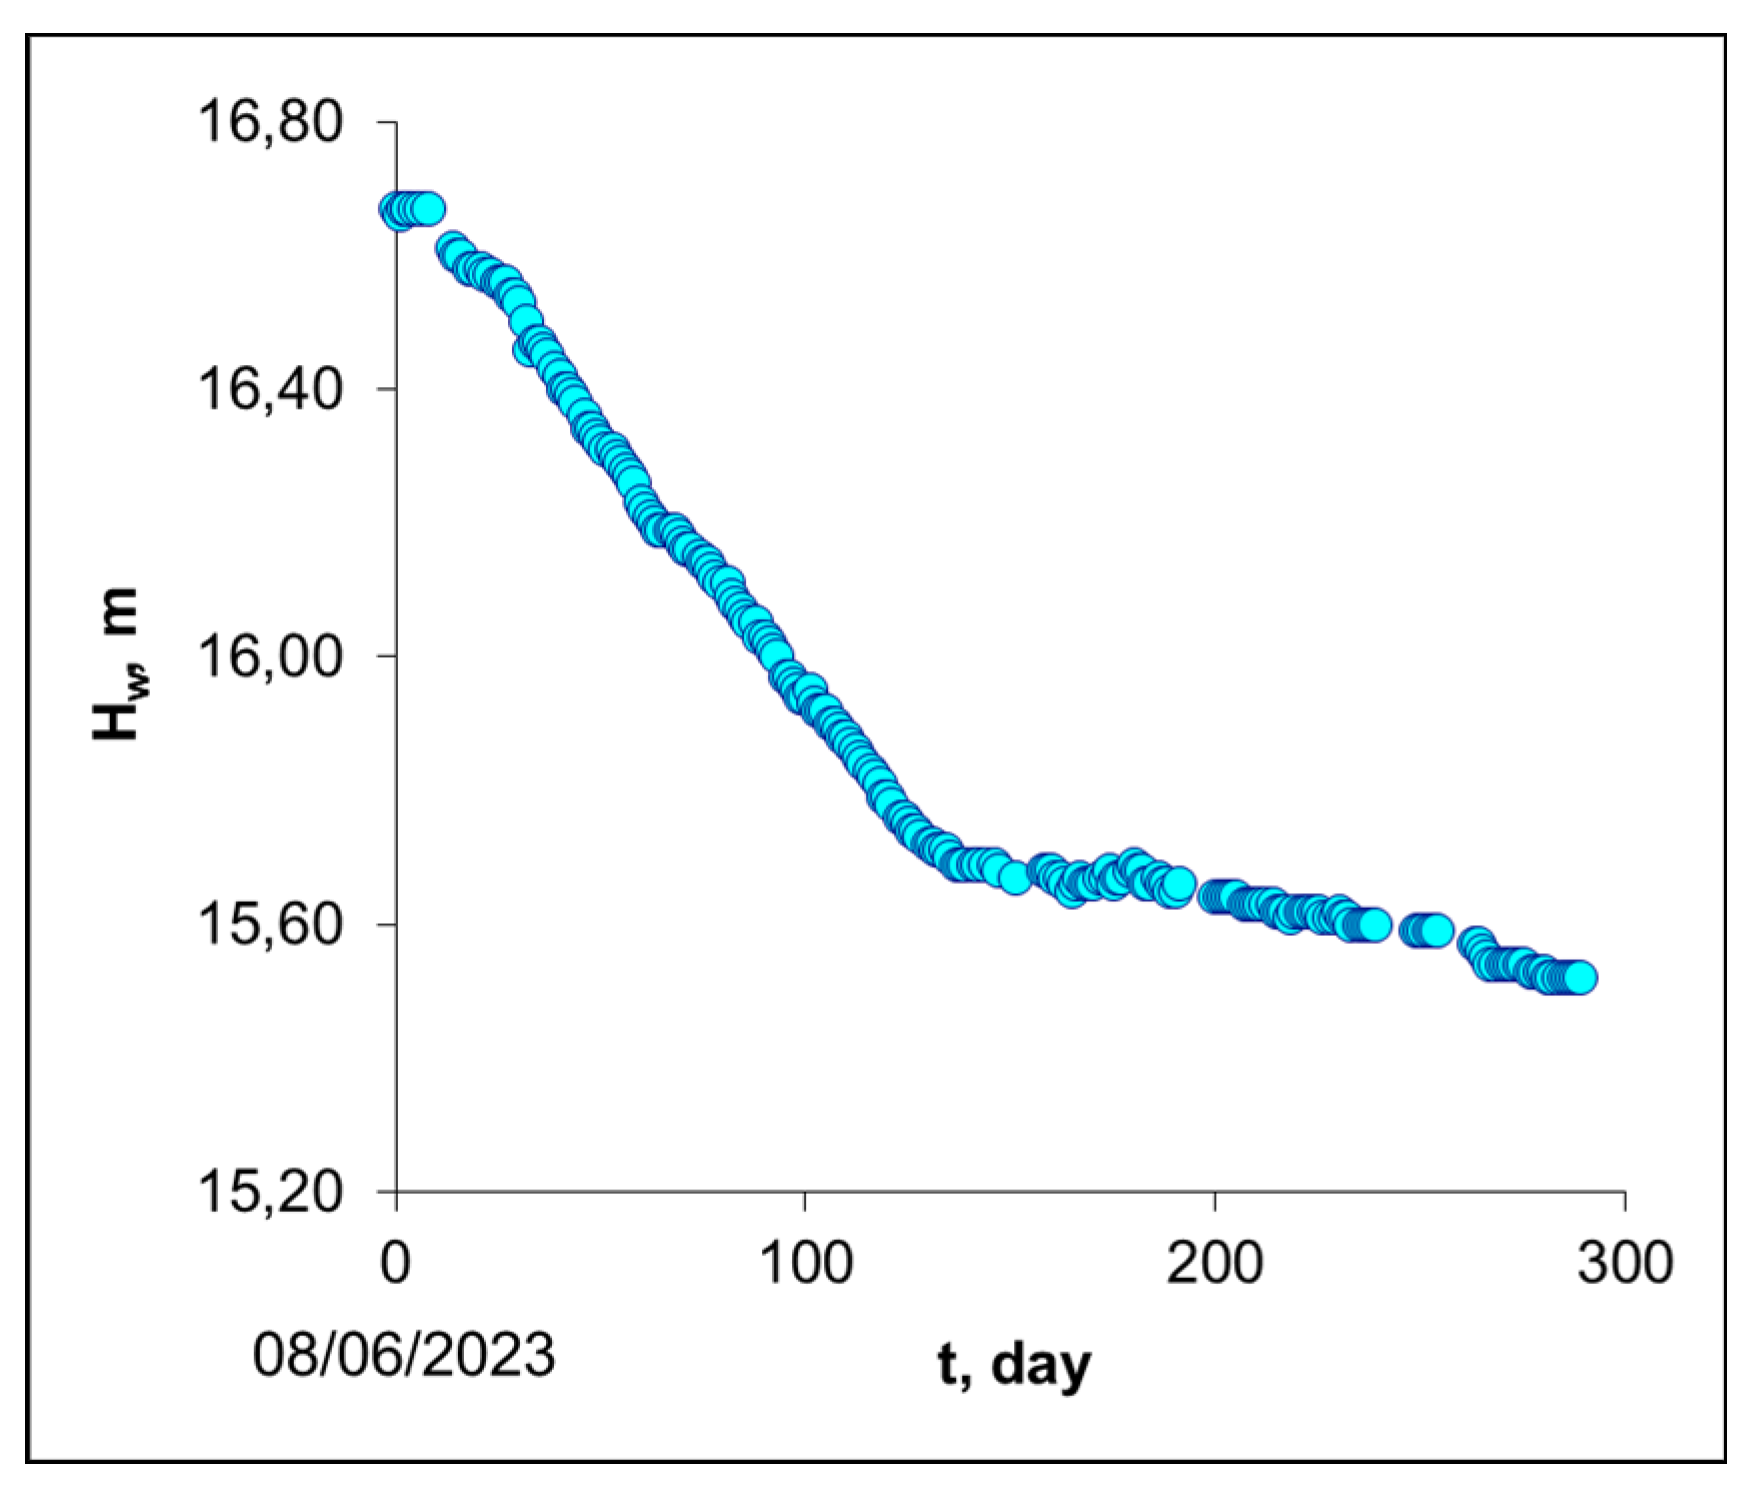
As for the cooling pond water level, it remained almost stable with an average daily decrease of approximately 0.004–0.006 m (Figure 6a). The initial 40-day dynamics of the water level (Hw [m]) decrease is described with high reliability (R2 = 0.98) by means of the following polynomial function of time (t [day]):
where the parameters a, b and c were found by iteration. They resulted in the following: a = −1·10−4 mday−2, b = −2.2·10−3 mday−1, and c (initial water level) = 16.67 m.
The complete exhaustion of the water in the cooling basin, with an average depth of approximately 5 m, was estimated to occur in approximately 200–250 days (Figure 6b). For stable operation of the pressure pumps, a water level of at least 2 m must be ensured to avoid adversely impacting the nuclear safety of the plant.
Owing to favorable climatic conditions from June 2023 to February 2024 (a decrease in temperature by almost 10 °C, precipitation of about 300 mm, and accumulation of groundwater and surface runoff), water losses from the pool were partially compensated for and the actual drop in the level was 1.15 m for 289 days that was not critical (Figure 7).
The water flow rate required to keep the SNF pool temperature constant is evaluated based on the amount of decay heat generated by the FA at any time after shutdown according to the Wey-Wigner formula [31]:
where Pd(t) is thermal power generation due to beta and gamma rays, t [s] is the time elapsed since the shutdown, P0 [Js−1] is thermal power before the shutdown, and t0 [s] is time of thermal power level before the shutdown. The amount of heat, Q [J], required to heat water is calculated as
where cH2O is the specific heat capacity of water (4183 [J/kg °C]); m [kg] is the mass of water; T2 [°C] is the final temperature of the water, whilst T1 [ °C] is the initial one. By dividing both the left and right terms of Equation (7) by time, we obtain a relationship between the mass flow rate of water (G) and the thermal power generation (Pd(t)):
Each of the six VVER-1000 reactors at Zaporozhye NPP has 164 FAs, together containing about 70 tons of uranium loaded into the core.
Annually, 54–55 spent fuel assemblies (about 25 tons of uranium) are unloaded. According to the Safety Guide developed by the reactor’s designers, Pd (t = 0.01 y) for 1 ton of SNF with 4.3% initial enrichment of average burning of 40 GW-day/tU is 1.52·105 Js−1 [32].
If we neglect heat loss to the atmosphere and consider the temperature of water in the spent fuel pools unchanged, then the requirement to maintain the temperature of consumed water at 70 °C, from an initial temperature of 20 °C, is:
Therefore, by accounting all the six VVER-1000, the required (total) mass flow rate of water is 10,000 m3·day−1.
The total value of Pd(t) from the active zone of six reactors in “cold shutdown” state is approximately 6000 kW (corresponding to 6·106 Js−1). Therefore, the water consumption for core cooling, as calculated with the Equation (8), results in about 30 kgs−1, or 2500 m3·day−1, that is only 25% of the amount required to cool the spent nuclear fuel.
The total water in the Zaporozhye NPP cooling pond was estimated to be 48,000,000 m3, an amount that, excluding consumption from evaporation and recharge from natural sources, is fully consistent with the water level calculated (see Figure 6 and Figure 7). For the abovementioned safety reasons related to the pumps’ operation, it is advisable that the water level in the pond is not lower than 1.5–2 m. In the case that it should occur, the ZNPP needs to be provided with an additional source of water of more than 12,500 m3 per day.
5. Conclusions
The radioactivity stocks accumulated in reactor pools and independent spent fuel storage facilities, which are at risk of being released into the environment, are altogether more than 7000 tU.
The analysis of the impact of the emergency drainage of the Kakhovka Reservoir basin on the ZNPP has shown that the deterioration of the engineering and geological conditions may impact the operation of SNF storage infrastructure relevant to safety with an increased risk of radioactive leakage. Moreover, the estimated time for the pressurized water level reduction in the backwater zone of the Kakhovka reservoir was about 4 years. Additionally, a prolonged disruption of water and heat transfer in the loess-rock massif may determine a significant deterioration in the engineering and seismic geological stability of the underground of critical infrastructure of the Zaporozhye.
Another aspect that emerged from this study is the possibility of complete exhaustion of the water in the cooling pond feeding the Zaporozhye NPP site. Considering that the pond has an average depth of approximately 5 m, complete exhaustion may occur in the coming years (see Figure 6 and Figure 7) and will strongly depend on precipitation and runoff. For stable operation of the pressure pumps, a water level of at least 2 m must thus be ensured to prevent the occurrence of severe accidents.
The water flow rate required to maintain the temperature of the SNF pool constant is evaluated based on the amount of decay heat generated by the FAs at any time after shutdown according to the Wey-Wigner formula. It was calculated that, for a pool storing 1650 FAs and containing about 900 tU in total, the water flow rate to keep the pool temperature constant is 10,000 m3·day−1.
The total water consumption for cooling the reactor core in “cold shutdown state” calculated was about 30 kg·s−1, or 2500 m3·day−1, which is only the 25% of the amount required to cool the spent nuclear fuel. The total water available from the pond for ensuring such cooling should be 48,000,000 m3. In the case it is unavailable, the plant needs to be provided with an additional source of water which supplies more than 12,500 m3 per day.
Author Contributions
Conceptualization, V.D. and R.L.F.; methodology, V.D.; software, S.A.C.; validation, V.D.; formal analysis, V.D.; investigation, V.D. and R.L.F.; resources, R.L.F.; data curation, V.D. and S.A.C.; writing—original draft preparation, V.D. and R.L.F.; writing—review and editing, S.A.C.; visualization, V.D. and S.A.C.; supervision, R.L.F.; project administration, R.L.F.; funding acquisition, R.L.F. All authors have read and agreed to the published version of the manuscript.
Funding
This project received funding through the MSCA4Ukraine project (ID n. grant no. 1232235) which is funded by the European Union.
Data Availability Statement
The data presented in this study are available on request from the corresponding author.
Acknowledgments
The authors acknowledge the contributions of Yevhen Yakovlev for providing quicksand from Zaporozhye and his foundation stability calculations.
Conflicts of Interest
The authors declare no conflicts of interest.
List of Acronyms
| AFR | Away from reactor |
| AT | At Reactor |
| ChEZ | Chernobyl Exclusion Zone |
| ChNPP | Chernobyl Nuclear Power Plant |
| FA | Fuel Assembly |
| FPs | Fission Products |
| HPP | Hydroelectric Power Plant |
| IAEA | International Atomic Energy Agency |
| LWGR | Light Water Graphite Reactor |
| MSK | Medvedev–Sponheuer–Karnik scale |
| NPP | Nuclear Power Plant |
| ORIGEN | Oak Ridge Isotope Generation |
| PWR | Pressurized Water Reactor |
| RAW | Radioactive Waste |
| RBMK | Light Water Graphite-Moderated Reactor |
| SFDSF | Spent-Fuel Dry Storage Facility |
| SNF | Spent Nuclear Fuel |
| TUE | Trans-Uranium Elements |
| VVER | Water–Water Energetic Reactor |
| ZNPP | Zaporozhye Nuclear Plant |
References
- European Commission. EU Taxonomy for Sustainable Activities. Available online: https://finance.ec.europa.eu/sustainable-finance/tools-and-standards/eu-taxonomy-sustainable-activities_en#legislation (accessed on 4 April 2024).
- Abousahl, S.; Carbol, P.; Farrar, B.; Gerbelova, H.; Konings, R.; Lubomirova, K.; Ramos, M.M.; Matuzas, V.; Nilsson, K.; Peerani, P. Technical Assessment of Nuclear Energy with Respect to the ‘Do no Significant Harm’ Criteria of Regulation (EU) 2020/852 (‘Taxonomy Regulation’), EUR 30777 EN; Publications Office of the European Union: Luxembourg, 2021; ISBN 978-92-76-40537-5. [CrossRef]
- Bergelson, B.R.; Gerasimov, A.S.; Tikhomirov, G.V. Radiotoxicity and decay heat power of spent nuclear fuel of VVER type reactors at long-term storage. Radiat. Prot. Dosim. 2005, 115, 445–447. [Google Scholar] [CrossRef] [PubMed]
- International Atomic Energy Agency. Spent Fuel Performance Assessment and Research; IAEA-TECDOC-1343; IAEA: Vienna, Austria, 2003. [Google Scholar]
- Shama, A.; Caruso, S.; Rochman, D. Analyses of the bias and uncertainty of SNF decay heat calculations using Polaris and ORIGEN. Front. Energy Res. 2023, 11, 1161076. [Google Scholar] [CrossRef]
- Čalič, D.; Kromar, M. Spent fuel characterization analysis using various nuclear data libraries. Nucl. Eng. Technol. 2022, 54, 3260–3271. [Google Scholar] [CrossRef]
- Oettingen, M. The Application of Radiochemical Measurements of PWR Spent Fuel for the Validation of Burnup Codes. Energies 2022, 15, 3041. [Google Scholar] [CrossRef]
- Oettingen, M. Assessment of the Radiotoxicity of Spent Nuclear Fuel from a Fleet of PWR Reactors. Energies 2021, 14, 3094. [Google Scholar] [CrossRef]
- International Atomic Energy Agency. Guidebook on Spent Fuel Storage, 2nd ed.; Technical Reports Series No. 240; IAEA: Vienna, Austria, 1991. [Google Scholar]
- Merino, A.G.; de la Peña, L.C.; González, A. Sources of uncertainty in the seismic design of submerged free-standing racks. Energy Procedia 2017, 127, 310–319. [Google Scholar] [CrossRef]
- International Atomic Energy Agency. Regulations for the Safe Transport of Radioactive Material; IAEA Safety Standards Series No. SSR-6 (Rev.1); IAEA: Vienna, Austria, 2018. [Google Scholar] [CrossRef]
- Pugliese, G.; Frano, R.L.; Forasassi, G. Spent fuel transport cask thermal evaluation under normal and accident conditions. Nucl. Eng. Des. 2010, 240, 1699–1706. [Google Scholar] [CrossRef]
- Hambley, D.; Laferrere, A.; Walters, W.S.; Hodgson, Z.; Wickham, S.; Richardson, P. Lessons learned from a review of international approaches to spent fuel management. EPJ Nucl. Sci. Technol. 2016, 2, 26. [Google Scholar] [CrossRef]
- World Nuclear Association. Available online: https://world-nuclear.org/ (accessed on 3 March 2024).
- IAEA. Power Reactor Information System. Available online: https://pris.iaea.org/ (accessed on 3 March 2024).
- Kilina, A.A.; Tregub, Y. Handling of Spent Nuclear Fuel in Ukraine. 2016. Available online: https://www.slideshare.net/SSTC_NRS/ss-60446285 (accessed on 3 March 2024). (In Russian).
- Godun, O. Developing of Conception of Spent Nuclear Fuel Management in Long-term Period. In Proceedings of the IAEA Technical Meeting on Advanced Fuel Cycles to Improve Sustainability of Nuclear Power through the Minimization of High Level Waste, Vienna, Austria, 17–19 October 2017. [Google Scholar]
- IAEA. Behaviour of Spent Power Reactor Fuel during Storage; IAEA-TECDOC-1862; IAEA TECDOC series; Available online: https://www-pub.iaea.org/MTCD/Publications/PDF/TE1862R_web.pdf (accessed on 3 March 2024).
- Andrushechko, S.A.; Afrov, A.M. NPP with a Reactor of the WWER-1000 Type. From the Physical Foundations of Exploitation to the Evolution of the Project; Logos: Moscow, Russia, 2010; p. 604. (In Russian) [Google Scholar]
- Kaprinayova, K.K.; Farkas, F.G.; Kristofova, K.K.; Hausner, H.P.; Slugen, S.V. Criticality safety parametric analyses of spent fuel storage pool for VVER-440. Izv. Wysshikh Uchebnykh Zawedeniy Yad. Energ. 2019, 2019, 109–117. (In Russian) [Google Scholar] [CrossRef]
- Jardine, L.J. Radiochemical Assays of Irradiated WWER-440 Fuel for Use in Spent Fuel Burnup Credit Activities; Technical Report; Lawrence Livermore National Laboratory: Livermorse, CA, USA, 2005; 456p. Available online: https://www.osti.gov/servlets/purl/15016256 (accessed on 3 March 2024).
- Kolobashkin, V.M.; Rubtsov, P.M.; Ruzhanskii, P.A.; Sidorenko, V.D. Radiation Characteristics of Irradiated Nuclear Fuel. A Handbook; Energoatomizdat: Moscow, Russia, 1983. [Google Scholar]
- Pavlov, S.V.; Sukhikh, A.V.; Sagalov, S.S. Fuels of High-Power Channel-type Boiling Reactors: Problems and Solutions; JSC “SSC RIAR”: Dimitrovgrad, Bulgaria, 2016; 185p. [Google Scholar]
- Spent Nuclear Fuel of NPP; Inform. Bull. of State Scientific Institution; The Joint Institute for Power and Nuclear Research-Sosny: Minsk, Belarus, 2010; pp. 13–14.
- Frano, R.L.; Dolin, V.; Cancemi, S.A. The influence of tritium behaviour on spent fuel pool concrete. Prog. Nucl. Energy 2024, 169, 105053. [Google Scholar] [CrossRef]
- Raynaud, P.A.; Einziger, R.E. Cladding stress during extended storage of high burnup spent nuclear fuel. J. Nucl. Mater. 2015, 464, 304–312. [Google Scholar] [CrossRef]
- Konarski, P.; Cozzo, C.; Khvostov, G.; Ferroukhi, H. Spent nuclear fuel in dry storage conditions—Current trends in fuel performance modeling. J. Nucl. Mater. 2021, 555, 153138. [Google Scholar] [CrossRef]
- Kruseman, G.P.; de Ridder, N.A.; Verweij, J.M. Analysis and Evaluation of Pumping Test Data, 2nd ed.; International Institute for Land Reclamation and Improvement: Wageningen, The Netherlands, 2000; 377p, ISBN 90 70754 207. [Google Scholar]
- Medvedev, S.V. Seismic Intensity Scale MSK-76. Publ. Inst. Geophys. Pol. Acad. Sc. A 1977, 6, 95–102. [Google Scholar]
- Kárník, V. On the up-dating of the MSK-64 scale—A commentary. Stud. Geophys. Geod. 1991, 35, 260–266. [Google Scholar] [CrossRef]
- Van Thuong, T.; Tashlykov, O.; Glukhov, S.; Shumkov, D.; Volchikhina, Y. Experimental and theoretical justification of passive heat removal system for irradiated fuel assemblies of the nuclear research reactor in a spent fuel pool. Nucl. Eng. Technol. 2023, 55, 2088–2095. [Google Scholar] [CrossRef]
- RB-093-14; Safety Guide for the Use of Atomic Energy. Radiation and Thermophysical Characteristics of Spent Nuclear Fuel from Water-Cooled Power Reactors and High-Power Channel Reactors. Scientific and Engineering Centre for Nuclear and Radiation Safety: Moscow, Russia, 2014.
Figure 1.
Scheme of wet storage facility: (a) water–water energetic reactors (VVER spent fuel pool at PAKS), (b) Sellafield (UK) nuclear fuel pond, and (c) Central Interim Storage Facility (SE).
Figure 1.
Scheme of wet storage facility: (a) water–water energetic reactors (VVER spent fuel pool at PAKS), (b) Sellafield (UK) nuclear fuel pond, and (c) Central Interim Storage Facility (SE).

Figure 2.
Scheme of SNF concrete casks (Courtesy of NAC International) [13].
Figure 2.
Scheme of SNF concrete casks (Courtesy of NAC International) [13].

Figure 3.
The specific activity (per tU) of actinides in the SNF of VVER-type reactors [22].
Figure 3.
The specific activity (per tU) of actinides in the SNF of VVER-type reactors [22].

Figure 4.
NPPs sites in Ukraine.

Figure 5.
Geotechnical conditions of the Zaporozhye NPP site: Units 1–6 are schematic locations of nuclear reactors: dark colour on the geological section corresponds to the distribution of unstable water-saturated sands and sandy loams.
Figure 5.
Geotechnical conditions of the Zaporozhye NPP site: Units 1–6 are schematic locations of nuclear reactors: dark colour on the geological section corresponds to the distribution of unstable water-saturated sands and sandy loams.

Figure 6.
Polynomial regression of water level (Hw) variations in the period of June–July 2023: (a) plot from 40 days observation (bars are representing the error evaluation) and (b) forecast trend for 200 days. Official ENERGOATOM data are shown with points in the two trends.
Figure 6.
Polynomial regression of water level (Hw) variations in the period of June–July 2023: (a) plot from 40 days observation (bars are representing the error evaluation) and (b) forecast trend for 200 days. Official ENERGOATOM data are shown with points in the two trends.

Figure 7.
Evolution of water level in cooling pond of Zaporizhzhia NPP. Official ENERGOATOM data are shown with points.
Figure 7.
Evolution of water level in cooling pond of Zaporizhzhia NPP. Official ENERGOATOM data are shown with points.


Table 1.
Technical and radiation characteristics of reactors and SNF.
| Characteristic | Unit | VVER-440 | VVER-1000 | RBMK-1000 | Ref. | Note |
|---|---|---|---|---|---|---|
| Number of units | 2 | 13 | 4 | [14,15] | ||
| Fuel Enrichment | % | 3.6 | 4.4 | 2.2 | [22] | |
| SNF unloading volume | tU·y−1 | 15.4 | 25 | 2414 | [18,23] | Completely uploaded from Units 1, 2, 3 |
| SNF unloading volume (total load) | FA·y−1 | 78 (380) | 42 (163) | 21,284 (1693) | [16,17] | Completely uploaded from Units 1, 2, 3 |
| SNF pool capacity | FA | 670 | 687 | 21,900 | [16,19,20] | located at the ChNPP site remote from reactors |
| Total SNF accumulation | tU·y−1 | 14.4 | 232 | N/A | [17] | |
| Mass of UO2 | tU·FA−1 | 0.126 | 0.495–0.545 | 0.113 | [17,22,23] | TVEL and Westinghouse production |
| Total activity (FPs + Actinides) | Bq·t−1 | 3.02·1016 | 4.14·1016 | 2.29·1016 | [22] | 3-year storage |
| 90Sr | Bq·t−1 | 2.40·1015 | 3.26·1015 | 1.86·1015 | [22] | 3-year storage |
| 137Cs | Bq·t−1 | 3.21·1015 | 4.45·1015 | 2.70·1015 | [22] | 3-year storage |
| Actinides | Bq·t−1 | 4.38·1015 | 5.35·1015 | 2.51·1015 | [22] | 3-year storage |
| 235U | kg·t−1 | 12.7 | 12.3 | 2.94 | [22] | 0.5-to-10-year storage |
| 236U | kg·t−1 | 4.28 | 5.73 | 2.61 | [22] | 0.5-to-10-year storage |
| 238U | kg·t−1 | 942 | 929 | 962 | [22] | 0.5-to-10-year storage |
| 238Pu | kg·t−1 | 0.0756 | 0.126 | 0.0686 | [22] | 0.5-year storage |
| 238Pu | kg·t−1 | 0.0741 | 0.122 | 0.0684 | [22] | 10-year storage |
| 239Pu | kg·t−1 | 5.49 | 5.53 | 2.63 | [22] | 0.5-to-10-year storage |
| 240Pu | kg·t−1 | 1.98 | 2.42 | 2.19 | [22] | 0.5-to-10-year storage |
| 241Pu | kg·t−1 | 1.25 | 1.47 | 0.713 | [22] | 0.5-year storage |
| 241Pu | kg·t−1 | 0.797 | 0.96 | 0.453 | [22] | 10-year storage |
| 242Pu | kg·t−1 | 0.37 | 0.582 | 0.508 | [22] | 0.5-to-10-year storage |
| 241Am | kg·t−1 | 0.0651 | 0.0716 | 0.0357 | [22] | 0.5-year storage |
| 241Am | kg·t−1 | 0.517 | 0.616 | 0.293 | [22] | 10-year storage |
Table 2.
Equation (1) parameters (* calculated from independent data).
| Reactor | a1 | k1 | a2 | k2 |
|---|---|---|---|---|
| VVER-440 | 5.26 ± 0.105 | 33.8 ± 2.55 | 36.2 ± 0.0876 | 0.00139 ± 0.000655 |
| VVER-1000 | 5.37 ± 0.0959 | 32.8 ± 2.31 | 36.4 ± 0.0768 | 0.00130 ± 0.000207 |
| VVER-1000 * | 38.4 ± 0.172 | 0.00135 ± 0.000090 |
Table 3.
Radioactivity stocks in ChEZ, [Bq].
| Accumulated in Emergency Unit 4 | Released from Emergency Unit 4 | ChEZ Territory | Storage in SNF Facilities | |||
|---|---|---|---|---|---|---|
| as of | 1986 | 2023 | 1986 | 2023 | 2023 | 2023 |
| 90Sr | 2.30·1017 | 9.44·1016 | 1.00·1016 | 4.10·1015 | 3.26·1015 | 2.57·1018 |
| 137Cs | 2.60·1017 | 1.11·1017 | 8.50·1016 | 3.64·1016 | 5.59·1015 | 3.83·1018 |
| 239Pu | 9.20·1014 | 9.19·1014 | 1.30·1013 | 1.30·1013 | 1.55·1012 | 1.43·1016 |
| 241Pu | 1.80·1017 | 3.03·1016 | 2.80·1015 | 4.72·1014 | 5.63·1013 | 1.99·1018 |
| 241Am | 1.60·1014 | 1.41·1017 | 4.80·1012 | 2.20·1015 | 2.62·1014 | 3.84·1018 |
| Actinides | 1.81·1017 | 1.72·1017 | 2.82·1015 | 2.68·1015 | 3.30·1014 | 5.85·1018 |
Table 4.
SNF radioactivity stock in Ukraine as of 2023: integrated estimation.
| NPPs | SNF Storage | FA | tU | Actinides [Bq] | 90Sr [Bq] | 137Cs [Bq] | 239Pu [t] |
|---|---|---|---|---|---|---|---|
| ChNPP | Independent wet and dry facilities | 21,284 | 2405 | 5.85·1018 | 2.57·1018 | 3.83·1018 | 6.325 |
| ChNPP | 4th Unit (RBMK-100) | Meltdown | 185 | 1.72·1017 | 9.44·1016 | 1.11·1017 | 0.480 |
| ZNPP | 6 VVER-1000 pool | 1649 | 874 | 4.72·1018 | 2.85·1018 | 3.83·1018 | 9.119 |
| ZNPP | Dry Repository | 4168 | 2272 | 1.23·1019 | 5.98·1018 | 8.12·1018 | 12.562 |
| RNPP | 2 VVER-440 pool | 940 | 118 | 5.19·1017 | 2.84·1017 | 3.80·1017 | 0.650 |
| RNPP | 2 VVER-1000 pool | 704 | 352 | 1.88·1018 | 1.15·1018 | 1.57·1018 | 1.947 |
| KhNPP | 2 VVER-1000 pool | 704 | 352 | 1.88·1018 | 1.15·1018 | 1.57·1018 | 1.947 |
| PUNPP | 3 VVER-1000 pool | 1056 | 528 | 2.82·1018 | 1.72·1018 | 2.35·1018 | 2.920 |
| Total | 3.02·1019 | 1.58·1019 | 2.18·1019 | 35.949 |
Disclaimer/Publisher’s Note: The statements, opinions and data contained in all publications are solely those of the individual author(s) and contributor(s) and not of MDPI and/or the editor(s). MDPI and/or the editor(s) disclaim responsibility for any injury to people or property resulting from any ideas, methods, instructions or products referred to in the content. |
© 2024 by the authors. Licensee MDPI, Basel, Switzerland. This article is an open access article distributed under the terms and conditions of the Creative Commons Attribution (CC BY) license (https://creativecommons.org/licenses/by/4.0/).
Share and Cite
MDPI and ACS Style
Dolin, V.; Lo Frano, R.; Cancemi, S.A. Assessment of Spent Nuclear Fuel in Ukrainian Storage System: Inventory and Performance. Energies 2024, 17, 1945. https://doi.org/10.3390/en17081945
AMA Style
Dolin V, Lo Frano R, Cancemi SA. Assessment of Spent Nuclear Fuel in Ukrainian Storage System: Inventory and Performance. Energies. 2024; 17(8):1945. https://doi.org/10.3390/en17081945
Chicago/Turabian StyleDolin, Viktor, Rosa Lo Frano, and Salvatore Angelo Cancemi. 2024. "Assessment of Spent Nuclear Fuel in Ukrainian Storage System: Inventory and Performance" Energies 17, no. 8: 1945. https://doi.org/10.3390/en17081945
Note that from the first issue of 2016, this journal uses article numbers instead of page numbers. See further details here.