Article

optimHome: A Shrinking Horizon Control Architecture for Bidirectional Smart Charging in Home Energy Management Systems

by
Corrado Maria Caminiti
1,*,
Marco Merlo
1,*,
Mohammad Ali Fotouhi Ghazvini
2 and
Jacob Edvinsson
2
1
Department of Energy, Politecnico di Milano, 20156 Milano, Italy
2
Volvo Car Corporation, 405 31 Göteborg, Sweden
*
Authors to whom correspondence should be addressed.
Energies 2024, 17(8), 1963; https://doi.org/10.3390/en17081963
Submission received: 26 March 2024 / Revised: 13 April 2024 / Accepted: 18 April 2024 / Published: 20 April 2024
(This article belongs to the Section K: State-of-the-Art Energy Related Technologies)

Abstract

:
This study aims to develop an adaptable home energy management system capable of integrating the bidirectional smart charging of electric vehicles. The final goal is to achieve a user-defined objectives such as cost minimization or maximizing renewable self-consumption. Industrialwise, the present work yields valuable outcomes in identifying operational frameworks and boundary conditions. Optimal scheduling benefits both users and the electric network, thus enhancing grid utilization and increasing renewable energy integration. By coordinating power interactions with dynamic time-of-use tariffs, the energy management system minimizes user costs and aids the grid by cutting peak hour energy consumption. Charging and discharging operations in electric vehicles comply with energy level constraints outlined by bidirectional charging protocols. The proposed approach ensures the scheduling of cycles that minimize detrimental effects on battery health when evaluating an economically ageing mechanism. Compared to uncontrolled charging, optimal scheduling resulted in a significant reduction in the total operational cost of the dwelling. Trade-off conditions between renewable integration and potential savings are identified and numerically evaluated by means of multiobjective optimization. In contrast to scheduling-based models, the proposed architecture possesses the ability to iteratively adapt decision variables in response to system changes, thus responding effectively to external stochastic uncertainty.

1. Introduction

Climate change is undoubtedly one of the most urgent issue of the current century. Its causes are deeply embedded in modern habits, comforts, and lifestyle. Emissions’ mitigation translates differently across sectors, thus imposing substantial changes. Transportation and energy sectors are among the most emitting nowadays in terms of Greenhouse Gas (GHG). They contribute, respectively, to 24% and 41% of the C O 2 released [1], and therein lies the reason for the structural changes they are undergoing. The first sector sees as an undisputed protagonist of its revolution the spread of Electric Vehicles (EVs) [2]. Low-duty electrification provides a valid alternative for a partial decarbonization of the sector and has been mainly catalyzed by a huge policy support, incentives, environmental concerns and technological improvements [2]. The EV’s market is expanding rapidly, thus tripling sales volumes in three years globally [2]. This trend is at the same time well received by industries that, with policies of accelerating electrification and increasing sales volume, were able to meet the demand while decreasing costs. The same speed and readiness for change is also required of the infrastructure for charging, transmitting, and dispatching of electricity. The large-scale integration of EVs into the grid will greatly increase both the total electricity consumption, by transferring part of the demand from fossil fuels to electricity, and the peak power, by posing significant stresses on the grid [3]. Although globally the trend is growing, regionally the situation is strongly fragmented. Limiting the scope to Europe, the second-largest market after China, there are countries with peak penetration in new sales of 88%, like Norway, and at the same time markets where the number of sales from the previous years is unchanged, such as Italy or Austria [2]. However, as a result of increasing policy pressure (e.g., the “Fit for 55” policy [4] in EU), economical advantages, and technical improvements, EV share is expected to keep increasing worldwide. In parallel, the energy sector is also profoundly changing its structure and the entities that are part of it. A historically centralized sector now conceives actors referred to as Distributed Energy Resources (DERs): small scale modular generation technology (e.g., wind, photovoltaic, fuel cells, gas turbines, batteries, and flywheels) that are generally located near the electricity use [5,6]. Renewable Energy Sources (RESs) are experiencing high growth rates worldwide due to rising interest in green energy and a decline in investment costs [7]. Limiting the discussion to the most popular sources of renewable generation [8], solar and wind, it is reasonable to point out that, disregarding the enormous benefits in terms of decarbonization, the large penetration of these intermittent resources may cause negative impacts on the power grid, including an increase in reactive power flows, voltage fluctuations, unbalances, and congestions [9].
Combining all the dynamics mentioned above, a particularly stressful condition for the entire transmission and dispatching system is outlined. This condition can realistically be a limiting factor to the ultimate large-scale deployment of a smarter and cleaner framework for electrification. The bright side of the coin is embedded in EV adoption: the potential availability of a massive and decentralized energy storage [8] that, if wisely operated, may contribute to decoupling the generation from the consumption profile, minimizing renewable curtailment, and potentially saving costs for the car’s owner. EV charging piles can be utilized to integrate PV output, thus enhancing PV generation penetration, reducing network losses, and simultaneously meeting travel needs [10]. Moreover, bidirectional energy exchange will contribute to the full exploitation of EVs’ batteries. Interest in this type of application is high: bidirectional home board chargers are a mature technology, and pilot projects are rapidly growing in popularity and interest. The present work is aimed at developing intelligent strategies to operate EVs bidirectionally. A Home Energy Management System (HEMS) is modeled; it is capable of managing multiple actors in a distributed, digitized, and sustainable framework. The optimization procedure is integrated into a Model Predictive Control (MPC)-based architecture, with the aim of enhancing its robustness against unexpected changes in external boundary conditions. This work is structured as follows: Section 2 provides an extensive overview of the relevant literature, including the key theoretical frameworks and relevant studies. Section 3 describes the methodology, thereby detailing the mathematical formulation of the optimization problems, constraints, and battery and degradation models. Section 4 provides the description of the case study and presents data sources to enable comparisons. Section 5 evaluates the case study and the results obtained from the numerical simulations performed. Finally, Section 6 gives some conclusions based on the study’s outcomes.

2. Literature Review

In this section, a deep bibliographical review is performed. In Section 2.1, a careful analysis is carried out concerning HEMS structure, specifically those conceiving EVs as controllable loads; in Section 2.2, a focus is provided on Model Predictive Control (MPC)-based EMS aimed to successfully handle uncertainty.

2.1. Electric Vehicle Integration in Energy Management System

EMS coupled with the presence of EV has been extensively investigated in the scientific literature. The relevance of those systems has been enabled by recent advances in communication techniques [11], the large-scale integration of EVs into the grid [1,3], smart sensing, and smart metering [12]. Energy management problems can include a wide variety of entities and sizes. The management operated by this type of model can affect small domestic systems, which are eventually provided with local generation units [3,13], systems with stationary storage, MGs with renewable penetration, diesel generators, and turbines [14] up to medium–large scale systems. From a user perspective, interests are wide-ranging but generally directed toward the economic optimization of the charging [8], managing the charging and discharging operation to minimize the total energy cost [1,3,11,13], maximizing the produced renewable energy utilization, and reducing the C O 2 emissions [15]. Clusters are variable in size, ranging from a single EV owner to multiple building scheduling [3] and large-scale distribution systems optimization [10]. Private users’ perspective is not the only possible approach: in [16], an optimal EV charging strategy was calculated for one charging station; in [17] optimal sizing and energy management strategy were conducted for a grid-connected EV workplace charging stations considering PV sources and flywheel energy storage system. Modelingwise, EMS archetypes can be mainly broken down into rule-based, optimization [1,8,11,12,13,14], and heuristics [3]. It is commonly agreed that optimization techniques can be used to solve scheduling problems in EMS and can provide accurate solutions; they are normally time-consuming, especially when solving complex optimization problems [15]. Moreover, real-time applications are limited mainly due to the dependency and uncertainty of future events. On the other hand, suboptimal control laws, especially in the presence of Dynamic Time of Use (DToU) tariffs, are resulting from the two remaining modeling techniques.
One of the fundamental challenges of these systems is certainly that of wisely managing the switching on of loads. In this framework, EVs, according to [18], belong to the group of controllable load, differing from critical loads, because of the possibility of reducing, shifting, and delaying the demand levels of power. Schedulable loads are able to provide flexibility to the demand and to reduce the peak-to-average ratio (PAR) of the load profile. Fotouhi et al. [13] addressed this issue with a two-stage real-time EMS with the final purpose of minimizing the total cost of operation. Hybridization of the thermal utility, which can be served either by natural gas or by machines driven by electricity, e.g., heat pumps, increases the complexity of the problem. The aforementioned two layers are necessary to handle two distinct and different issues: firstly, a deterministic problem is solved, aiming at minimizing the peak power. This is aimed at limiting the cost on the bill resulting by a fixed fee solely as a function of the peak power recorded in the pricing interval, e.g., one month. Keeping satisfied the demand of the building and assuming that it is possible to shift part of the load within a deterministic time span, the optimized demand peak is computed and provided to the second layer. This, structured as Mixed Integer Linear Programming (MILP), enables the possibility to operate EVs bidirectionally and shut down units with the inclusion of binary variables. MILP modeling, among the optimization-based models, resulted as the state of the art [3,7]. The objective function is the overall operational cost, given by the sum of the electricity and natural gas bills. The minimization problem is subject to the power and heat balances for each time interval. The EV battery, on the other hand, is characterized by a maximum capacity and a constant charge and discharge efficiency. A similar approach for the inclusion of a hybrid heating system in the EMS has been proposed by Mojtaba et al. in [11]. Although this study was also addressing unit commitment problem, the focus was on the role of the vehicle as the enabler for more efficient house management. The objective function was enriched by a term accounting for a fictitious battery cost. In fact, while increasing interactions with the vehicle, the battery deteriorated faster as the overall energy throughput increased. The relative weight of the described two terms in the overall cost was regulated by the coefficient λ in a multiobjective optimization function. Systemwise, the heat balance was substituted by the assumption of a complete electrified heating system and the consequent inclusion of a thermal dynamic model of the building. From the control point of view, the heat pump requested power can vary within a specific interval in order to meet user comfort conditions.
Pure economic optimization in [3,8,13,15,19] can be expanded, including additional merit parameters. In [1], Van Kriekinge et al. proposed a multiobjective function, including an additional term accounting for the absolute difference between the grid power at each time step and the average power requested to the grid. The purpose was to flatten the power grid curve and hence to reduce the peak power filling in the valleys. In line with the economic transposition of physical phenomena, as developed for the fictitious battery cost in [11], a penalizing cost for thermal discomfort was proposed in [12] for a large-scale application. This was calculated on the basis of the customer’s desired temperature and represented a term to minimize in the optimization function.
The integration of EVs in the HEMS requires the energetic and temporal characterization of the asset. The State of Charge (SoC) and arrival and departure time can be deterministic: these values can be inferred and considered as average value for a specific user type [3]. A similar approach was implemented in [15], where behavioral and seasonal differences between working days and holidays were modeled. The arrival SoC was calculated based on different ranges of km driven by the user though the use of a probability distribution of daily family travel distance in Shanghai and an energy efficiency coefficient. Complexity is added if the state and arrival’s conditions of the car are unknown. This is as in [16], where assuming to be known the departure and arrival time is highly unrealistic. These specifications indeed can vary stochastically on the basis of the user behaviours and lifestyle. A possible solution is the one proposed by Van Kriekinge et al. [1]: the state probability, arrival SoC, and other vehicle’s specification were inferred based on preprocessing recorded charging events in 2019 from a charging location inside the car park of a hospital located in Brussels. It consisted of six chargers containing two Type 2, hence, a maximum of 12 connectors, delivering up to 22 kW. A similar approach was developed in [11]; vehicle characterization was put in place through the definition of three parameters: plugged-in time, plugged-out time, and EV battery energy at plugged-in time. The trip time (the first two parameters in the previous list) was obtained using a Markov chain in order to capture the intrinsic stochasticity. Transient probabilities from the plugged-out and plugged-in states were extracted from a 3197-day data-set of the habits of ten university employees. For the last parameter, the authors underline that it can be affected by many factors, such as the plugged-out battery energy level, driving distance, driving styles, and traffic. In order to be able to include part of the aforementioned factors in the battery energy level at plug in, the conditional probability dependent on the plugged-out energy in the battery was used.

2.2. Model Predictive Control-Based Architectures for EMS

The consolidation of a decentralized paradigm induced by DERs’ proliferation raises the need for local management [20]. The latter includes both power management, which results in real-time operation stability control, and energy management, which operates the different units of the grid-connected system, thus generally optimizing operation from an economic point of view [21]. The optimal management of grid-connected MGs constitutes a difficult task, which is mainly due to the effective level of coordination to be achieved between the various distributed energy resources available, which are characterized by different technologies and operating constrains [14]. MPC represents a suitable approach for optimal dispatch in a power system when seen from the twofold capability of including real-time changes and accounting for uncertainties [22]. As reported in [18], it is based on future predictions and the behaviors of the system. This is particularly relevant due to the increasing share of renewable energy foreseen in domestic generation; robustness is provided by the feedback mechanism embedded in the receding horizon. This strategy is able to successfully handle deviation from forecasts, thus iteratively solving a constrained Optimal Control Problem (OCP). The control law is computed at every sampling time for a particular horizon on the basis of an updated forecast and measured state of the system; the validity of this technique has been proven extensively in the literature for the EMS in various contexts. In [7], an economic MPC was applied to schedule the EV charging scheduling. This specific solution is suitable for the system in object when seen from the ease in the integration of price and demand varying forecasts. Linear MPC minimizes electricity cost, thus generating at each interval an optimized scheduling. In [19], the operations of a grid-connected MG were managed through the implementation of a stochastic MPC (sMPC) algorithm. The system in the object included the presence of renewable production, while the consumption profile was the result of the sum of the effects of critical and controllable load. Continuous variables β k were introduced for each controllable appliance to modulate the percentage of the power curtailed at every instant of time. sMPC provides a probabilistic framework to the system and enables the integration of a probabilistic description of uncertainty. An MG power dispatch was successfully handled in [23], where a multienergy grid-connected MG consisting of a microhydropower plant, photovoltaic plant, diesel generator, and stationary storage was successfully operated to aim at optimal economic dispatch. The optimal control inputs for each step of the prediction horizon N P were calculated as a result of the optimization: the first was put in place, the system states were updated, and the horizon was shifted forward. An interesting approach for the same problem was proposed by Cominesi et al. in [14]. The authors proposed a two-layer sMPC based on two different timescales in order to deal with the uncertainty embedded in the load and the PV generation profiles. Firstly, the system was solved on a 15 min discretization step without considering uncertainty. The aim of this layer was to economically optimize the operation of the microgrid, thus fulfilling the load and operational constraints of the devices. Uncertainty was included at this point with a high granularity: the second layer, running at a higher frequency (1 min), is responsible for satisfying the power balances in the presence of unexpected events while trying at the same time to minimize the deviation from the expected path. Since the charging and discharging power from the storage is not inferiorly bounded, it may happen that a better solution is found in the second layer by inverting the operational mode of the battery. In view of this, two distinct problems with the two operational mode are solved in parallel, and the best solution in terms of deviation is kept. Another solution for the grid-connected Skagerak Energilab MG was discussed in [6]: while the sMPC exploited the probabilistic uncertainty descriptions in the form of a chance–constraint formulation, Robust MPC (RMPC), implemented in [6], relied on a bounded deterministic description of the uncertainties. The control input solution was therefore generated based on the variability of the uncertainty. Clearly, RMPC and a large set for the uncertainty can lead to conservative behavior resulting in nonoptimal control input, as well as an unfeasible solution. Reducing the scale of the system, a two-stage Rolling Horizon (RH)-based optimisation model was used to minimize the energy cost of a multifamily residential building of 29 flats. As with the majority of studies regarding HEMS, the time granularity was kept low in order to be able to enrich the model with typical peak patterns of the present appliances. In this case study, as expressed by the authors, the RH approach was included both for dealing with uncertainty and also to promptly react to changes in the users’ requirements. A similar procedure was presented in [24].
The computational time, which is typically a limiting factor for these models, can be partially mitigated using explicit MPC, where a map function of the uncertain parameters’ magnitude is produced offline, thereby enabling the evaluation of a function instead of an optimization procedure in online application. In [22], this technique was applied in a charging station scenario in the presence of renewable generation and stationary storage. The proposed solution includes the presence of uncertainty from five different sources: the PV power production, the energy price of the grid, the C O 2 emission level, the consumption, and the arrival SoC of the EV. The mapping strategy was effectively put in place by exploiting multiparametric programming in order to explicitly solve the MPC problem. Practically, once online, the magnitude of the uncertainty will define the system state, thus belonging to one of the modeled critical regions and the prescribed control action.

3. Materials and Methods

The main objective of this paper is to develop an EMS for a domestic application capable of exploiting the presence of an EV and PV system and optimizing the operations conceiving bidirectional interactions with the EV’s battery. The optimal control problem is then included in a predictive framework to account for uncertainty, with unexpected behaviors and changes in user input. The present work proposes a control-oriented architecture that combines an SH-MPC combined with an MILP to optimally dispatch power in a household.

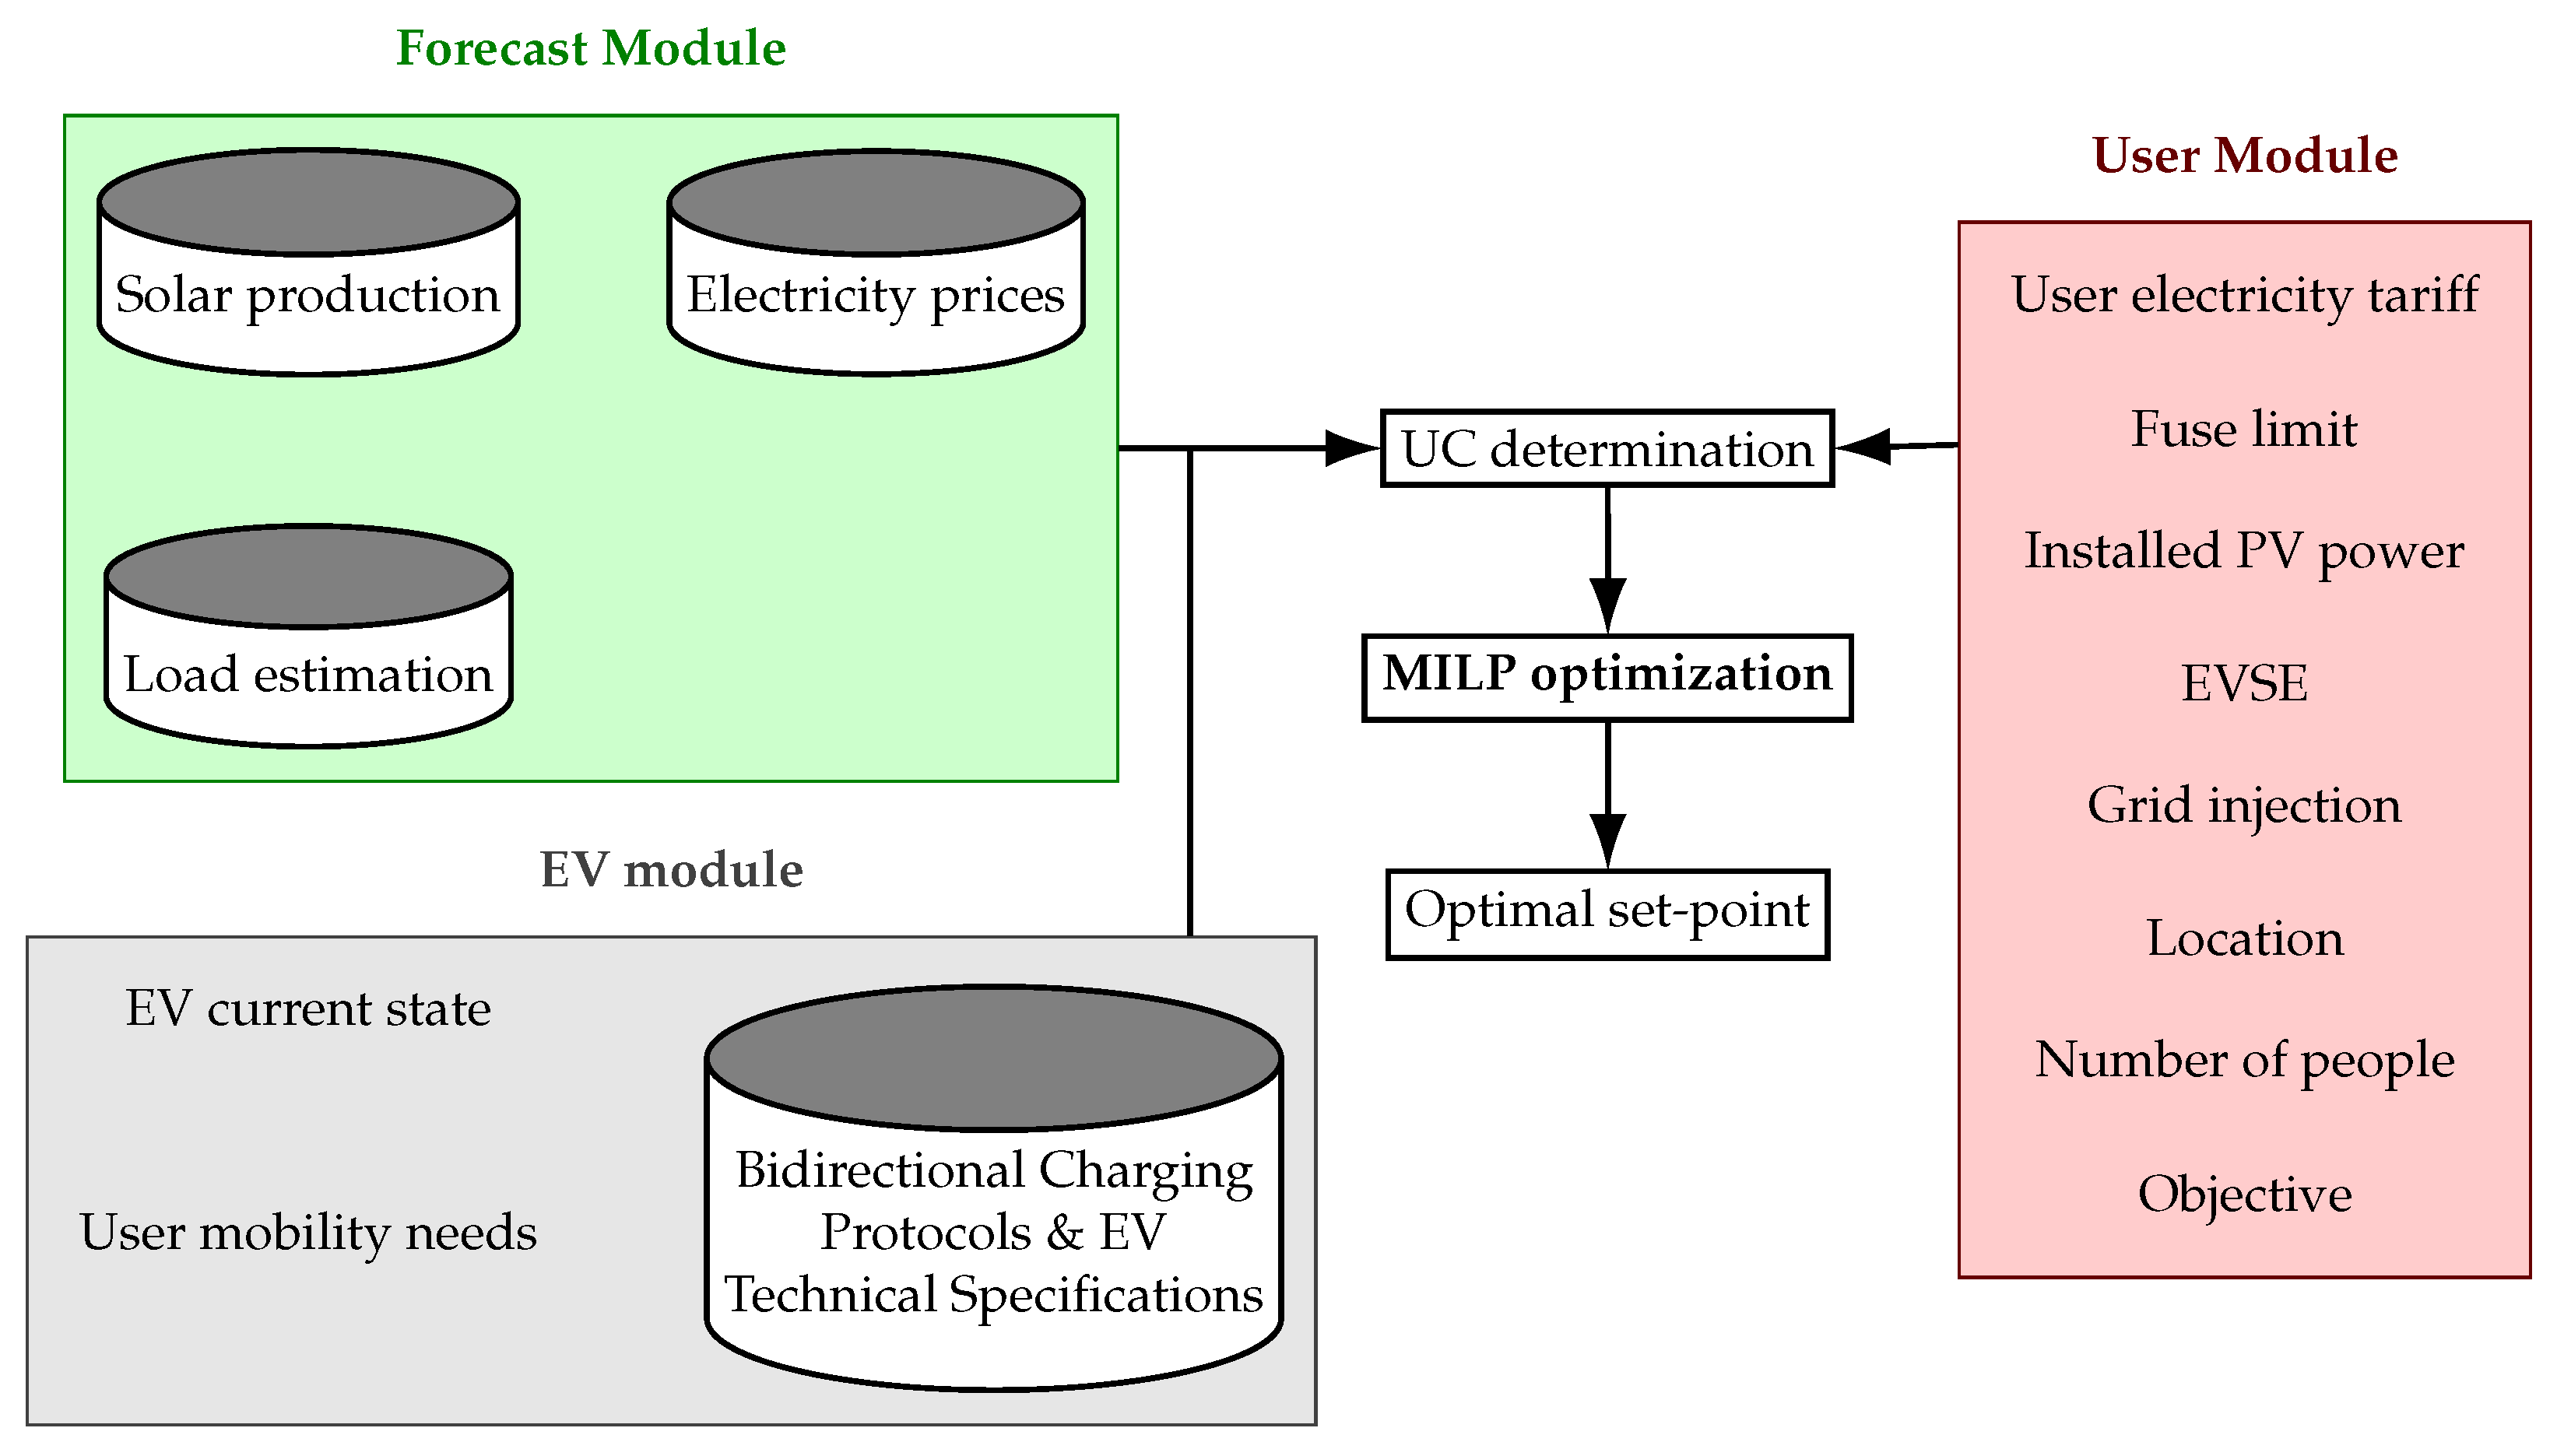
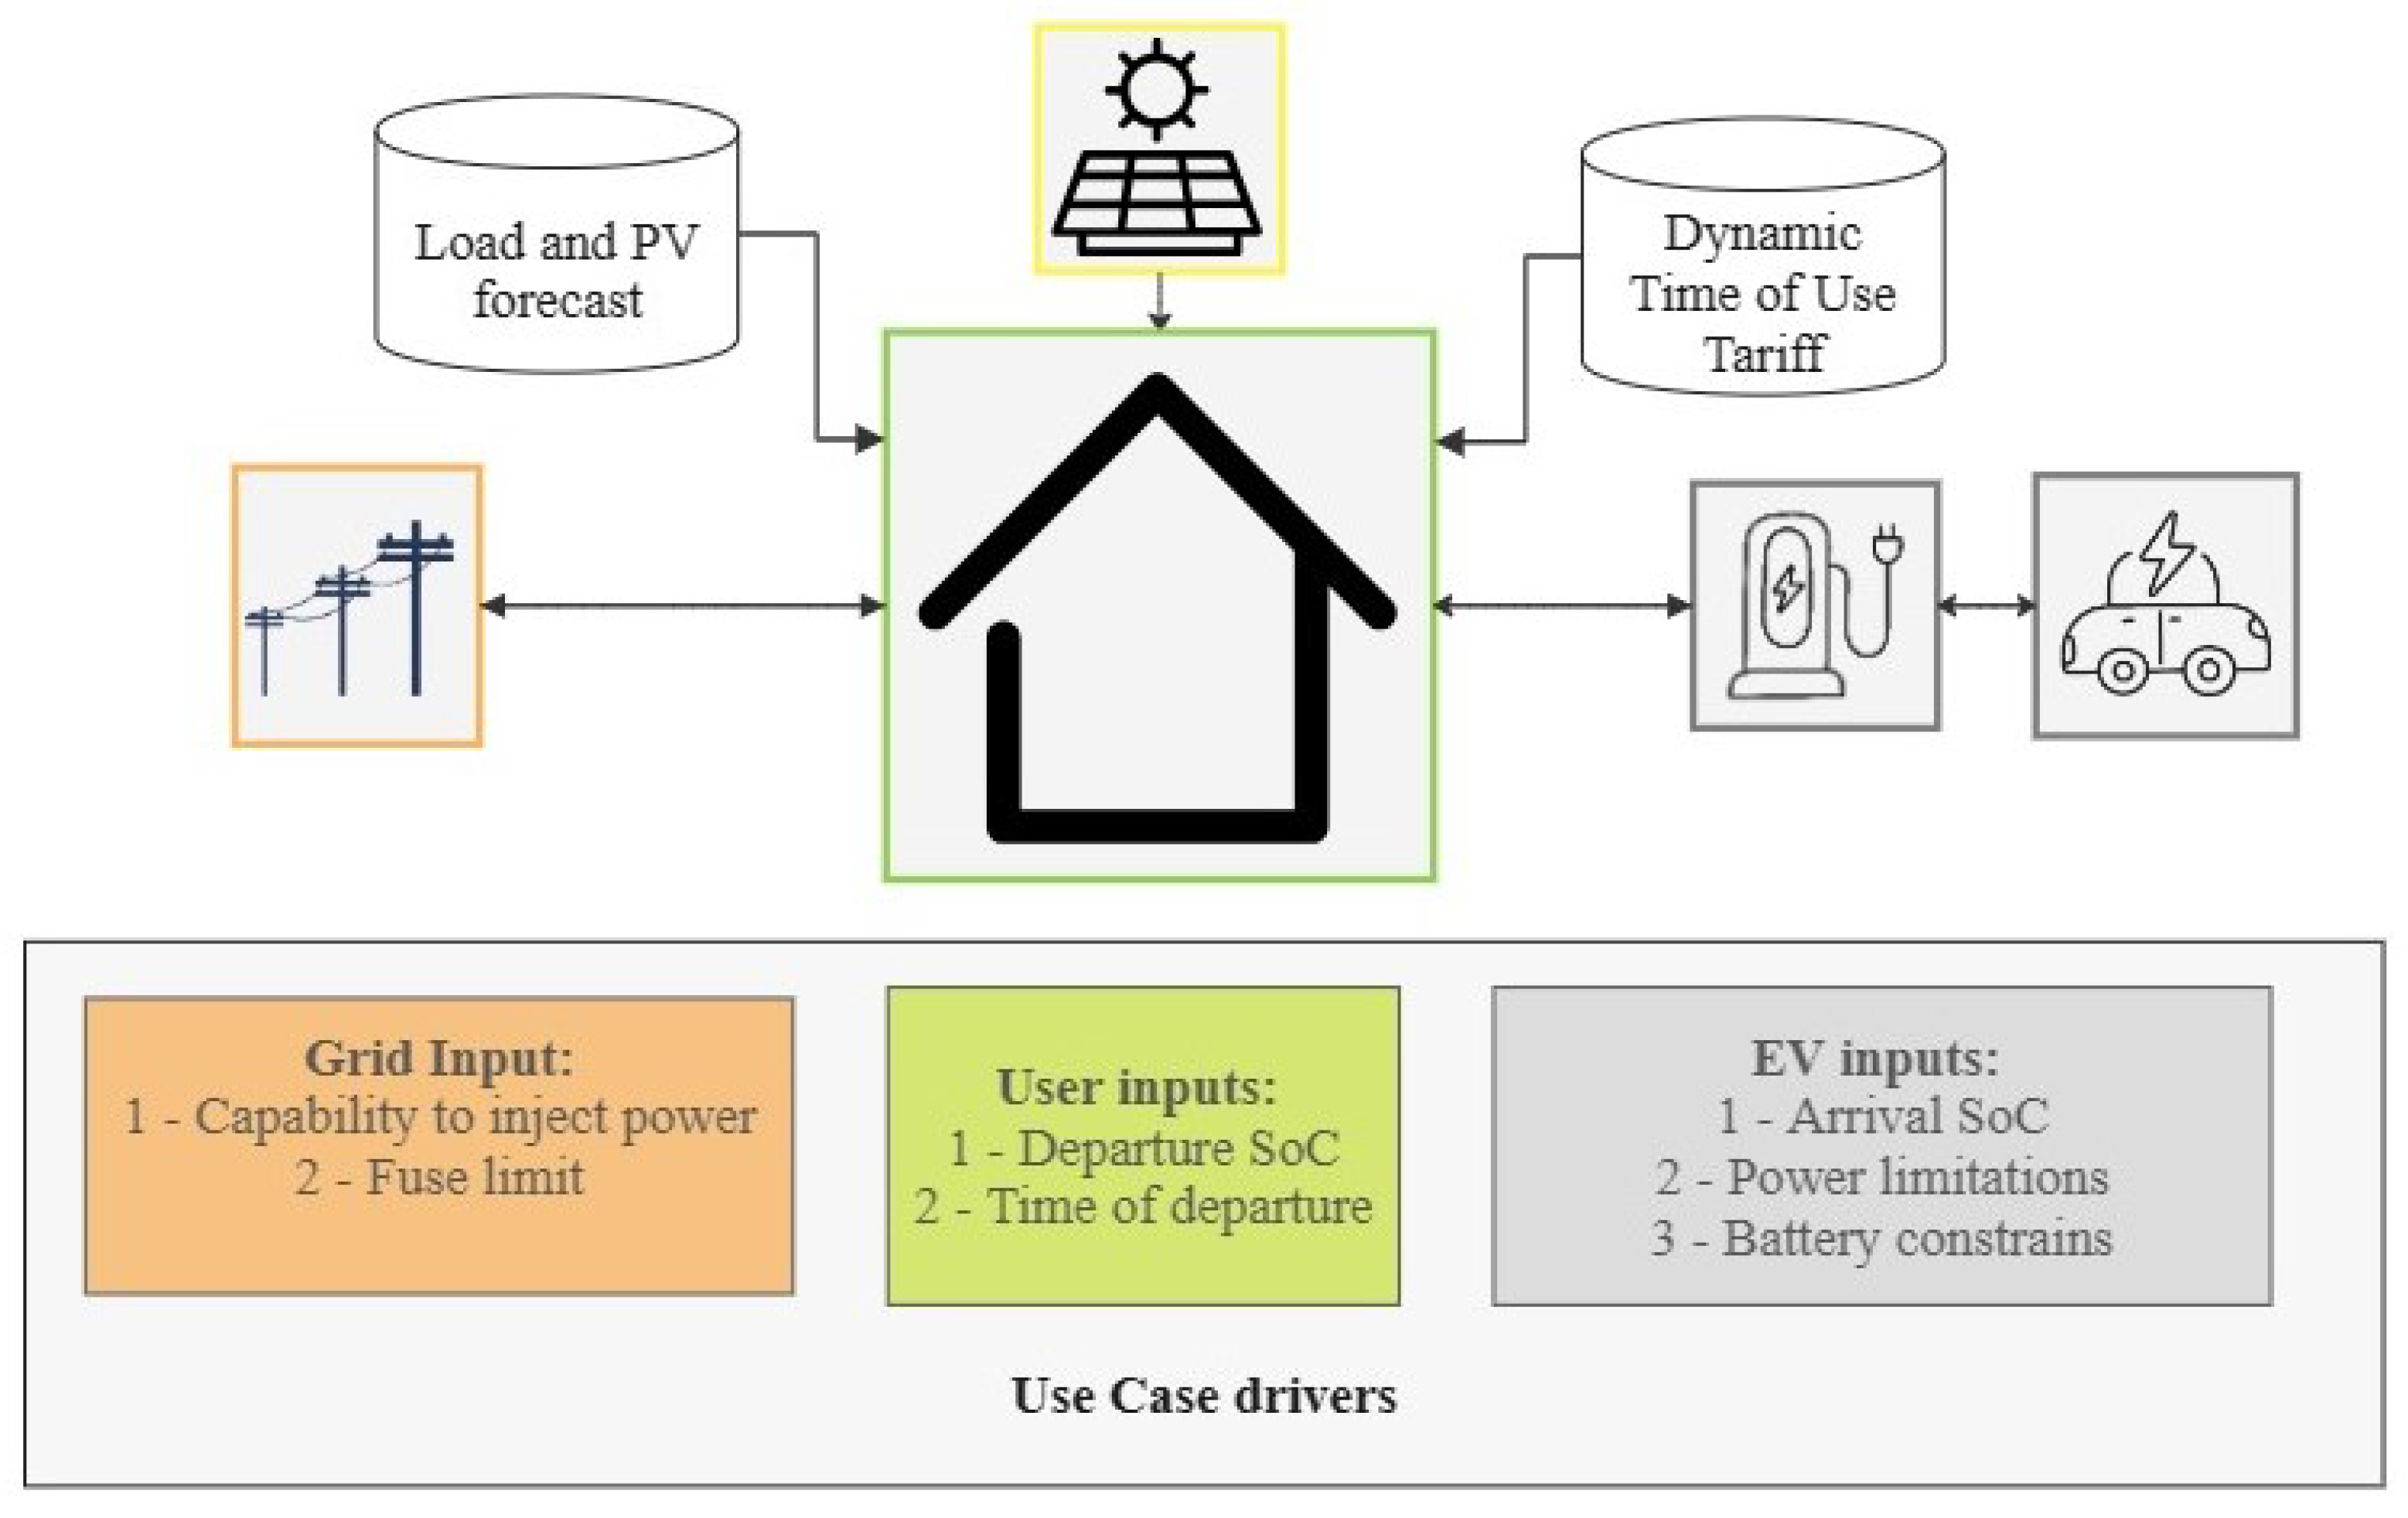
3.1. System Architecture and Use Cases

The work is tailored to a general domestic system equipped with a photovoltaic system, a domestic electric load demand, an EV, and an EVSE capable of handling bidirectional charging with a smart meter to monitor the power exchanged with the network.
Different boundary conditions will result in different scenarios. Computationally, different frameworks of operations will impose or relax limitations and possibly force changes in the objective function formulation. In the context of the HEMS, each different scenario falls under the name of the Use Case (UC). An optimal control sequence is therefore UC-dependant. Distinctions are made on the basis of the following aspects:
  • The capability for the user to inject power into the grid, thus shifting from a V2H to V2G paradigm. The latter includes many interactions with the grid, which are aimed at different objectives: the present work is focused on energy arbitrage to maximize user’s benefits;
  • The economic value of the energy possibly injected into the grid: optimHome offers the possibility to set the price of the power injected into the grid. As seen in Table 1, options can range from the retail price or any fixed Feed-In Tariff (FIT);
  • Operation purpose is not limited to economics: the scheduling can be aimed at maximizing renewable self-consumption on site.
A schematic summary of the UC numbers and their corresponding qualitative characteristics is proposed in Table 1.

3.2. One-Shot Optimal Scheduling

Given the car availability T in minutes and the duration of the discretization interval Δ t , it follows that the number of time steps N P to be considered within the problem is reported by Equation (1):
N P = T Δ t

3.2.1. Battery and Degradation Models

The EV battery model developed is formulated as a invariant discrete time state space model in order to fit in the MPC framework:
x t + 1 = A · x t + B · u t y t = C · x t x 0 given
where t T are the time intervals over which the model computes the resulting solution of the control input; the internal state x t quantifies the SoC of the vehicle at time step t; the output y t coincides with x t ; and x 0 is the state variable at initial time step. A, B, and C matrices are typically referred to as state, input, and output matrices. The dynamic is controlled by the control input vector u t :
u t = p t E V , c h p t E V , d h
where p t E V , c h and p t E V , d h , both 0 , are quantifying the charging and discharging power in a specific time step. u t quantifies power flows at the house–EV charger interface (refer to Figure 1). Changes will result based on the SoC, which is affected by the overall charging/discharging efficiency. The state space matrices in Equation (2) are here reported:
A = 1 B = Δ t C E V η c h , Δ t C E V · η d h C = 1
The primary purpose of a battery in automotive applications is to provide the energy needed for travel. However, cycling the battery for economic purposes can accelerate battery degradation, thus making it essential to accurately evaluate the associated benefits. BESS degradation can manifest as a loss of available capacity or an increase in the resistance, with both factors are nonlinearly linked to various chemistry-dependent factors [25]. Battery aging typically occurs through two main processes: calendar and cycle aging. The former is influenced by temperature and state of charge, while cycle aging is affected by current rates, charge/discharge cut-off voltages, and previous factors [26]. Deterioration due to battery aging can be seen as an indirect cost for the user, thereby arising from power interactions within the EV [11]. Therefore, it is crucial to incorporate physical degradation mechanisms into optimization procedures. Inspired by previous work [25], capacity loss is translated into an economic scale, thereby allowing for comparison with other terms in the objective function. The fictitious cost of battery degradation is quantified as the loss of available capacity resulting from cumulative throughput. Considering a formulation proposed in [27] and recognizing the differential methodologies when evaluating alternative charging strategies, we focus solely on cycle aging mechanisms in the objective function. Nevertheless, even under laboratory-controlled conditions, isolating temperature correlation proves to be complex, thus leading to a unique dependence of the aging mechanism on the current rate [28]. Percentage capacity loss is estimated as follows:
q = B 1 · exp ( B 2 · I C ) · t = 0 T ( p t E V , c h + p t E V , d h ) · Δ t
where the pre-exponential factor B 1 and the exponential B 2 are derived from the experimental campaign outlined in [27]; I C is the current rate, and it is multiplied by the energy throughput.
To preserve linearity within the problem, I C is conceptualized as a parameter, thus reflecting the average C rate throughout the entire charging session and aligning with the methodologies observed in comparable studies [25]. This assumption is UC-sensitive: in UC 1 and 2, the average C rate is determined by considering the average forecasted load demand over the charging period. Since C cannot discharge more than the current demand, this value represents a fair estimation of the average discharged power.
P l o a d ¯ = t = 0 N P P t l o a d N P P a v g , I C = P l o a d ¯
On the other hand, without the limitation in discharge and the capability to perform V2G connection, typical discharge power is generally close to the infrastructure maximum capacity in UC 3 and 4. Consequently, the average discharge power assumed corresponds to
P a v g , I C = min ( ( P g r i d , m a x P l o a d ¯ ) , ( P l i m , 1 P l o a d ¯ ) )
To be comparable with the potential revenues deriving from the bidirectional operations of the battery, the measure of capacity loss must be expressed as a homogeneous unit of measure with respect to the cost of the supplied energy. This is achieved by considering the specific cost coefficient C B , 0 ^ , battery size C E V , and the remaining battery capacity at the end of life of the car φ . Explicit formulation of coefficient D, expressed in [€/kW], is finally derived as follows:
C d e g r a d a t i o n = C B ^ · C E V 100 φ · B 1 · exp ( B 2 · P a v g , I C C E V ) · t = 0 T ( p t E V , c h + p t E V , d h ) D = C B ^ · C E V 100 φ · B 1 · exp ( B 2 · P a v g , I C C E V )

3.2.2. Conventional Constraints

Assuming negligible power losses within the control volume, the most comprehensive real power balance constraint on the system in Figure 1 is enforced as follows:
P t l o a d P t P V = p t g r i d , b u y + p t E V , d h p t E V , c h p t g r i d , s e l l
The above-mentioned formulation simplifies to Equation (10) for UC 1 and 2:
P t l o a d P t P V + p t e x c e s s = p t g r i d , b u y + p t E V , d h p t E V , c h
Note that the decision variables p t e x c e s s , p t g r i d , g , and p t E V , b are implemented as a continuous positive-defined variable. Specifically, p t e x c e s s is configured as an auxiliary variable capable of monitoring only excess generation from the renewable. It assumes values greater than zero only in the presence of overproduction and is defined for the sole purpose of including, within the optimization criteria, the ability to maximize self-consumption.
Binary variables, reported in Table 2 and coupled with the continuous power flow variable, are introduced. For each single formulation, M and m can be assumed by considering the capacity limitation of the manipulated variables. These are mathematically enforced by means of the following formulation [29,30]:
f : R n R and x t i { 0 , 1 } with i B , G f ( t ) 0 x t i = 1 is true if f ( t ) M · ( 1 x t i ) f ( t ) ϵ + ( m ϵ ) · x t i with M = max ( f ( t ) ) m = min ( f ( t ) ) ϵ 0
Real power operating limits on the variables p t g r i d , g and p t E V , b must be enforced. For UC 3 and 4, symmetrical capacity limitation is enforced on p t g r i d , s e l l by Equation (13) while battery charging is bounded by Equation (14):
0 · x t g r i d , b u y p t g r i d , b u y P g r i d , m a x · x t g r i d , b u y
0 · x t g r i d , s e l l p t g r i d , s e l l P g r i d , m a x · x t g r i d , s e l l
P c h , m i n · x t E V , c h p t E V , c h P c h , m a x · x t E V , c h
The parameter P c h , m a x embeds additional complexity: in Li-ion batteries, affirmed chemistry for EVs, maximum admitted charging power is not constant. P c h , m a x is indeed the result of the dependence of the C rate of the specific charging process and the actual SoC. Battery management system regulates this limitation in order to prevent degradation and ensure safety. However, the general trend is that batteries are able to charge with high power up to a certain level of SoC, above which maximum power decreases. In this work, P c h , m a x presents a dependency with the actual SoC of the vehicle. In accordance with the methodology used in [1], the maximum power decreases linearly when a deterministic SoC limit is exceeded. Specifically, as reported in Equation (16), S o C h i g h P represents the limit after which the battery management system must reduce the charging power to maintain the voltage constant without exceeding the maximum imposed value. This linear decrease ranges between the maximum charging power P l i m , 1 and P c h , m i n . The maximum charging power at low SoC, P l i m , 1 , is instead the result of capacity limits of the charging infrastructure and the battery itself. The discussed conditions can be enforced through the following:
P l i m , 1 = min ( P E V , m a x , P E V S E , m a x )
P l i m , 2 = P l i m , 1 ( 1 S o C h i g h P ) 1 ( s o c t S o C h i g h P ) ( P l i m , 1 P c h , m i n )
P c h , m a x = min ( P l i m , 1 , P l i m , 2 )
Concerning the discharge power from the battery, the limits are UC-dependent: for UC 1 and 2, being a V2H application, the upper limit is a fixed net electric demand of the dwelling while for the remaining UCs, higher power rates for the discharging are admitted:
0 · x t E V , d h p t E V , d h P t n e t · x t E V , d h for b = discharge
0 · x t E V , d h p t E V , d h P c h , m a x · x t E V , d h for b = discharge
The maximum exchange related to the grid is limited by the fuse limit of the dwelling. In parallel, the infrastructure also limits the interaction with the battery: here, the superior limit is imposed by the capacity limit of the maximum admitted current by EVSE and EV (Equation (16)), while the lower limit represents a technoeconomic trade-off condition imposed by worsening performances of components at low powers. Lower bound in discharge is instead neglected.
Exploiting the binary variables given in Table 2, it is possible to prevent simultaneous operations for the same unit (battery and power grid) in the same time interval t. This consideration is enforceable on the system by means of Equation (20) in UC 1 and 2 and by Equation (21) in UC 3 and 4.
x t E V , d h + x t E V , c h 1
x t g r i d , s e l l + x t g r i d , b u y 1
The model’s strong adherence to the industrial development frontier recurs: unlike other studies where the S o C t a r g e t is typically calculated on the user’s driving habits, the present work is focused on the single charging session optimization. S o C t a r g e t is thus a deterministic input of each simulation. Ideally, the user, once arrived at home, is only in charge to plug in the vehicle and input when and at what SoC the EV will be needed in the future. The inclusion of this condition is introduced into the model by means of Equation (22). Note that this equality constraint is enforced only on the last instant of the optimization: t = N P .
s o c t = N P = S o C t a r g e t

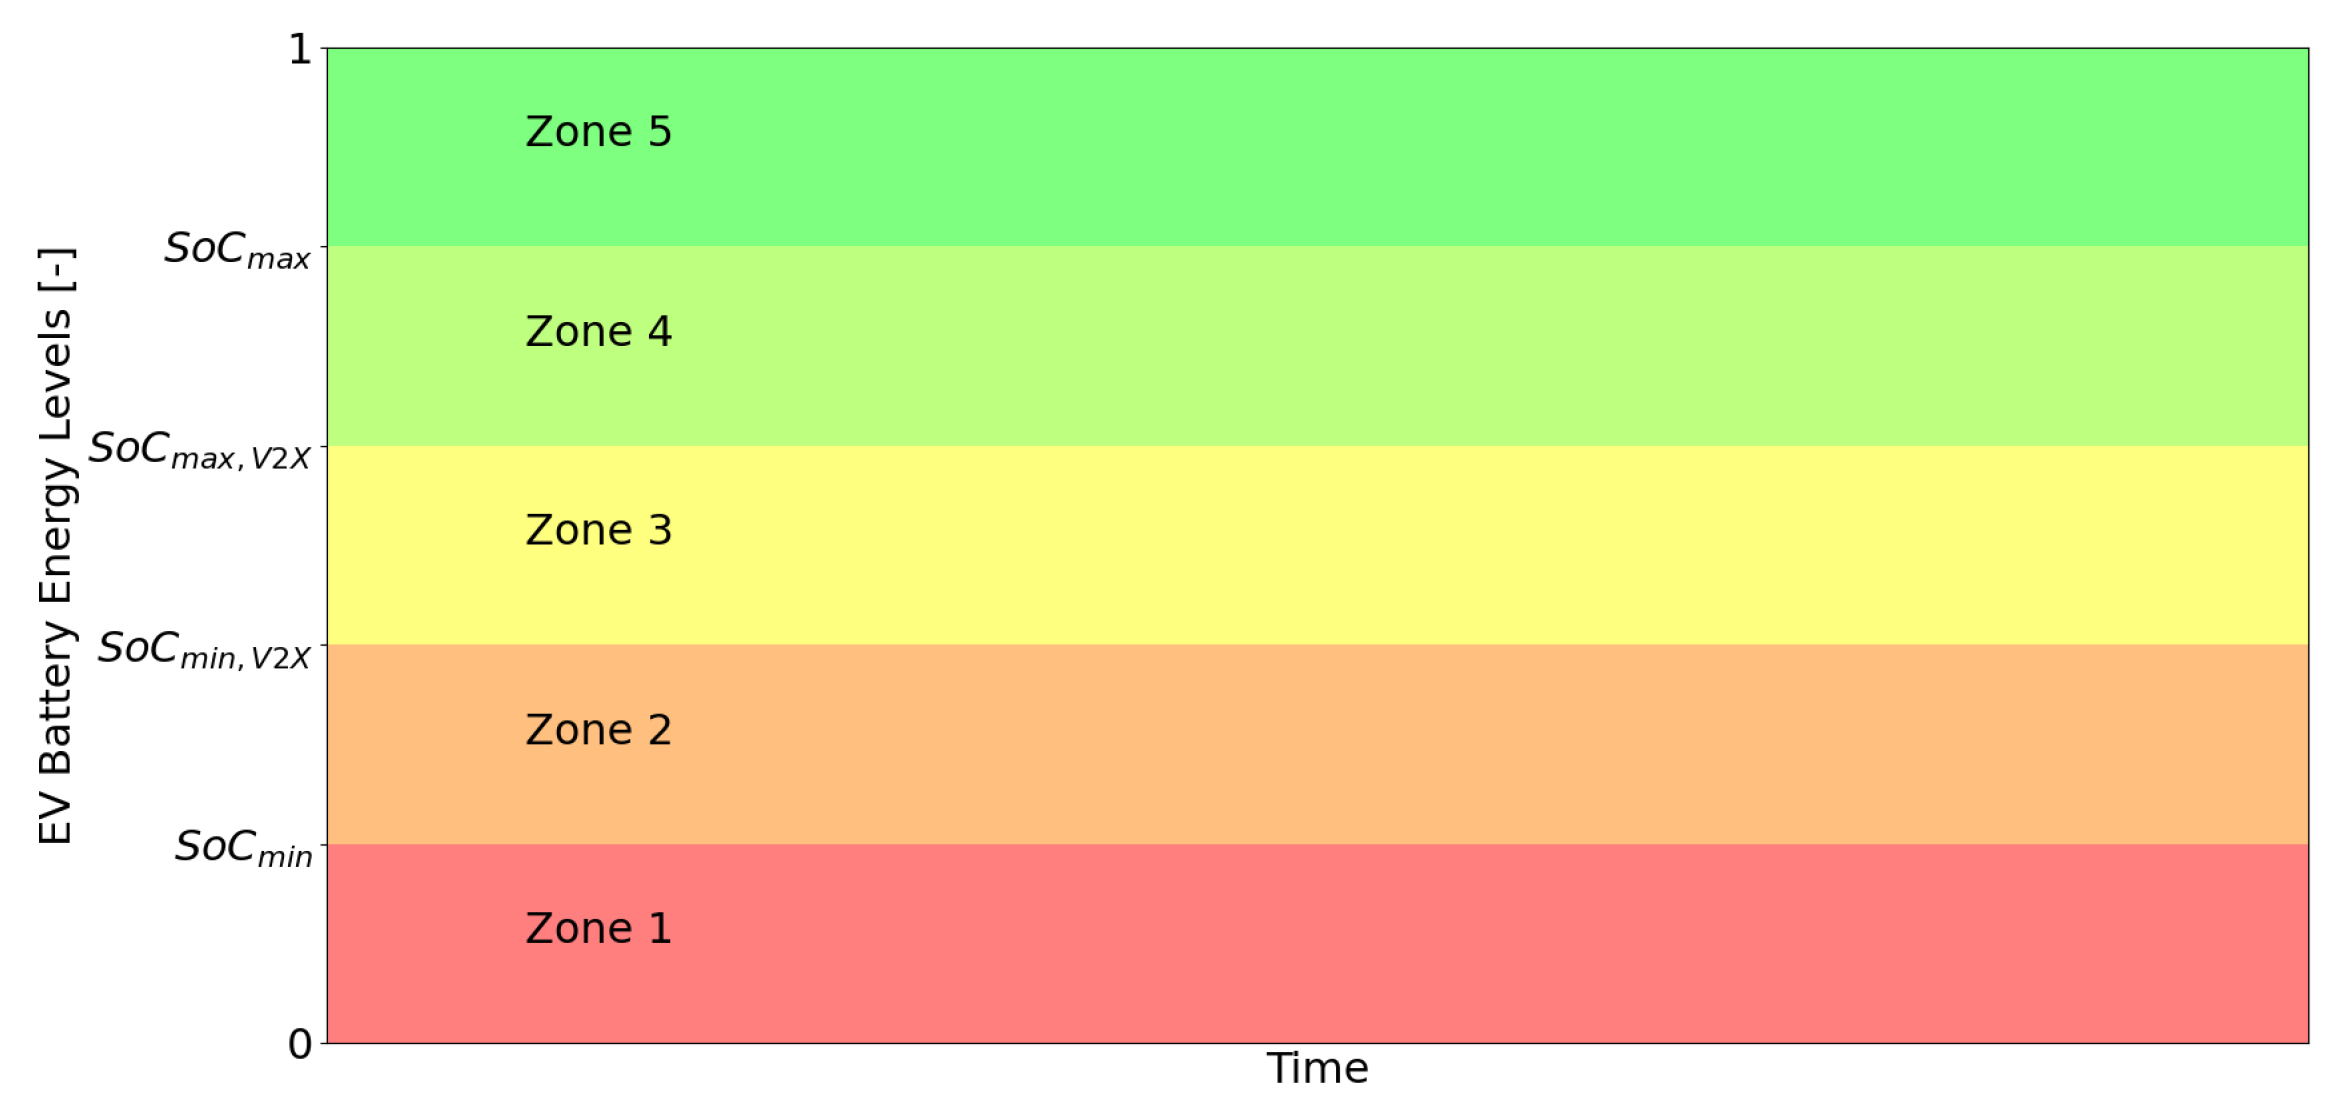
3.2.3. Condition Constraints

The growing attentiveness of large-scale implementation of bidirectional operations is also evidenced by the increasing regulatory attention: ISO15118-20 [31] defines the communication messages and sequence requirements for bidirectional power transfer. Specifically, it prescribes the definition of four different static energy levels to include a vehicle within a regulated bidirectional energy exchange (Figure 2). Motivation is twofold: firstly, a minimum mileage of the EV must be always assured, thus mitigating user range anxiety, and secondly, excessive deterioration of the battery’s health status must be assured.
Practically, four static thresholds, S o C m i n , S o C V 2 X , m i n , S o C V 2 X , m a x , and S o C m a x , resulting in 5 SoC subregions were defined:
  • Zone 1 represents a nonoptimized region in which cycling is not allowed. Practically, this region can be entered only at the beginning of the charging process if the arrival SoC is very low. If this is the case, the actual optimized scheduling will not start until the safety value S o C m i n i m u m is reached. Operations in this region are governed by a rule-based control algorithm:
    P t a v = P g r i d , m a x P t n e t
    p t E V , c h = 0 if P t a v < P c h , m i n P t a v otherwise .
  • Zone 2 is an intermediate region in which cycling is still not permitted, but the charging power can be the result of the optimization. In other words, the charging can be postponed by waiting for a more convenient moment, but discharging is not permitted even in the presence of a very convenient price. To enforce the condition, a binary decision variable x t z o n e 2 must be designed to be true when s o c t belongs to Zone 2 (refer to formulation in Equation (11)). Subsequently, direct implication is enforced by means of Equation (25):
    x t z o n e 2 { 0 , 1 } and x t E V , d h { 0 , 1 } x t z o n e 2 = 1 x t E V , d h = 0 is true if x t z o n e 2 ( 1 x t E V , d h ) 0
  • The core of optimization is represented by the operations in Zone 3, where cycling aimed at maximizing objective function is admitted;
  • Zone 4 covers the states between the upper level for cycling S o C V 2 X , m a x and S o C m a x i m u m . Zone 5, consequently, represents the remaining region between the size of the battery and EV Maximum energy level. The protocol prescribes that in Zone 5, only discharging is admitted, while you can only enter Zone 4 to reach the departure SoC target. Specifically, in Zone 4, discharging is permitted to enter the cycling zone just once. In other words, no cycling is admitted between Zone 3 and Zone 4. In real-life applications, the arrival SoC is far from being comparable with the above-mentioned levels. As a result of these considerations, Zone 5 has no interest in being defined, as this scenario only occurs with extremely high SoC arrivals. For the purpose of this work, Zone 4 and 5 can be condensed into a single zone, within which only charging is allowed. Clearly, this simplifies what is described in the protocol, which, however, by its nature and given its purposes, must include as many case scenarios as possible by establishing constraints and conditions valid for even the most extreme circumstances. Similarly to Zone 2, the condition is enforced by introducing a new binary variable, x t z o n e 4 , thus referring to Equations (11) and (25).

3.2.4. Objective Functions

The UCs, reported in Table 1, may differ explicitly for their final purpose or for the enabled operations. In both cases, differences directly impact on the analytical formulation of the objective function:
  • The objective function of this first UC purely quantifies the cost of operations within the control volume (Equation (26)). Total cost is given by the sum of two distinct addends and is homogeneous in terms of unit of measurement: Firstly, the cost for electricity is given by the scalar product between the variable that quantifies the power bought from the grid and the parameter that collects the electricity tariff for each considered time step. Secondly, in accordance with other related studies [11], battery deterioration can be related to an economic cost and thus included in the objective function to counterbalance discharge operations. It was chosen to assess degradation under a differential perspective: charging the vehicle up to a target SoC represents a benchmark, which is an inevitable deterioration of battery performance induced by simple car use, and therefore, it should not affect the optimal scheduling. For this reason, the optimal charging control sequence is affected, thus accounting for two times the discharged energy considered as the deviation from the reference unidirectional charging process.
    min p t = 0 N P p t g r i d , b u y · C t e l · Δ t Cost for electricity + 2 · D · t = 0 N P p t E V , d h · Δ t Cost for battery degradation
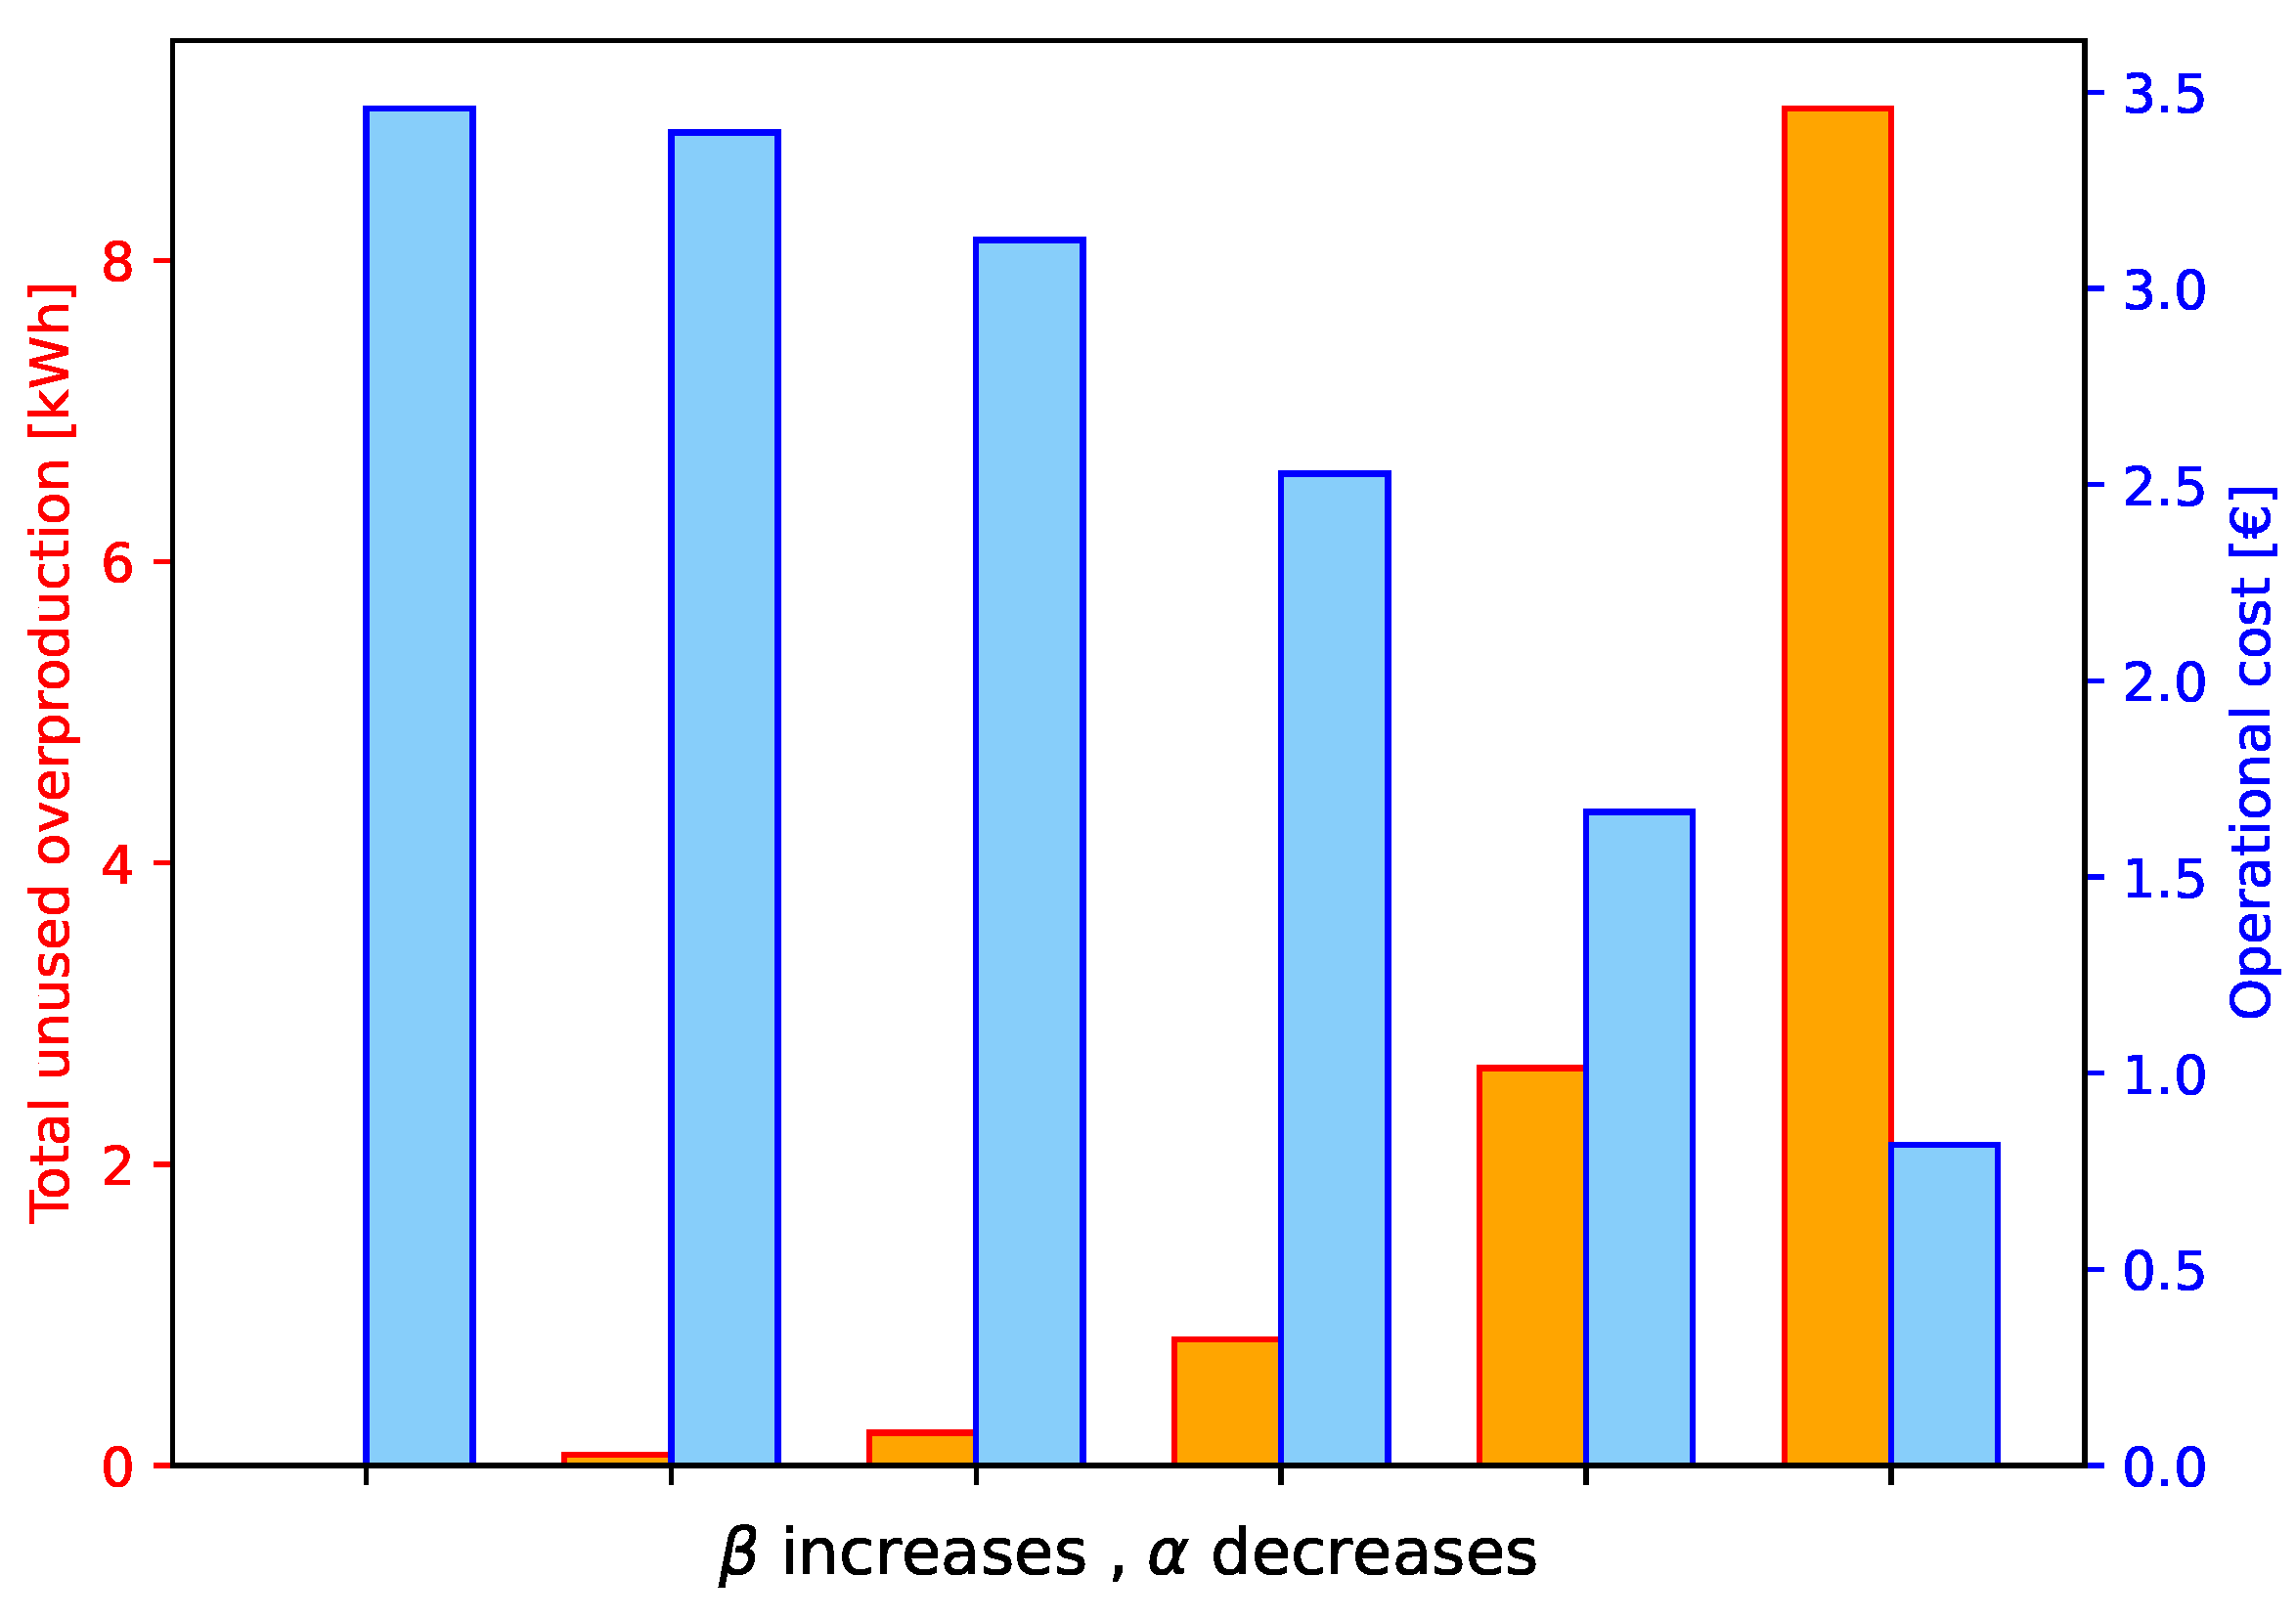
  • A multiobjective function to maximize self-consumption is employed in UC 2 to deal with heterogeneous terms. The quantification of renewable overproduction from PV is the additional term to the total cost of operation already discussed for UC 1. p t e x c e s s is an auxiliary variable that quantifies the excess of renewable energy.
    min p α · ( t = 0 N P p t g r i d , b u y · C t e l · Δ t + 2 · D · t = 0 N P p t E V , d h · Δ t ) Total cost of operation + β · t = 0 N P p t e x c e s s Renewable surplus
  • V2G operations enabled at retail price in UC 3 or FIT in UC 4. Objective functions for the last two UCs are as reported in Equations (28) and (29). The only difference lies in the economic valorization of energy injected into the grid.
    min p t = 0 N P p t g r i d , b u y · C t e l · Δ t Cost for grid supplied energy + 2 D · t = 0 N P p t E V , d h · Δ t t = 0 N P p t g r i d , s e l l · C t e l · Δ t Revenues injected energy
    min p · t = 0 N P p t g r i d , b u y · C t e l · Δ t Cost for grid supplied energy + 2 D · t = 0 N P p t E V , d h · Δ t t = 0 N P p t g r i d , s e l l · F I T · Δ t Revenues injected energy

3.3. Receding Horizon Optimization

The deterministic scheduling detailed above is incorporated in an iterative and predictive framework of operations. The frequency with which the optimal sequence of commands is calculated represents a parameter, Δ t s , chosen a priori based on the dynamics of the system, the degree of accuracy required, and the computing power.
N S = T Δ t S
At each sampling instant, k is the optimal sequence of control action and is calculated over the entire prediction time step. Note that the concept of prediction time step, introduced in Equation (1), is enlarged: as sampling time progresses, the prediction window N k P is reduced (Equation (31)).
N k P = T k · Δ t S Δ t
Consequently, acquisitions are also time-dependent with respect to the variable k. P t | k P V is then defined as the PV forecast obtained at the sampling time k for the time step t of the prediction window N k P . The same mathematical formulation will be applied to all the time-dependent inputs and most importantly to each of the decision variables. As shown in Figure 3, at each sampling time, the optimal control problem is solved only for the subsequent time slots, thus keeping fixed the final limit. Consequently, the number of decision variables decreases as a result of the reducing time intervals considered for the optimization, thus positively impacting the computational time. This peculiar iterative control technique falls under the name of Shrinking Horizon MPC (SH-MPC).

4. Case Study

A domestic household was considered as the main object of the investigation. The grid-connected dwelling is provided with a wall-box and an EV, which are both capable of managing bidirectional operations. The house is equipped with solar panels on the roof (Figure 1). As anticipated, the inherent stochasticity in the S o C a r r i v a l and the arrival time has been disregarded in the developed framework, which focuses solely on optimizing individual charging processes. In line with practical scenarios, these aforementioned values can be treated as deterministic once the car is at home. The testing conditions have been designed based on typical routines and situations for an employed household user, such as arriving home in the late afternoon with a low to medium SoC. In Table 3, numerical assumptions for the parameters introduced in Section 3 are reported.

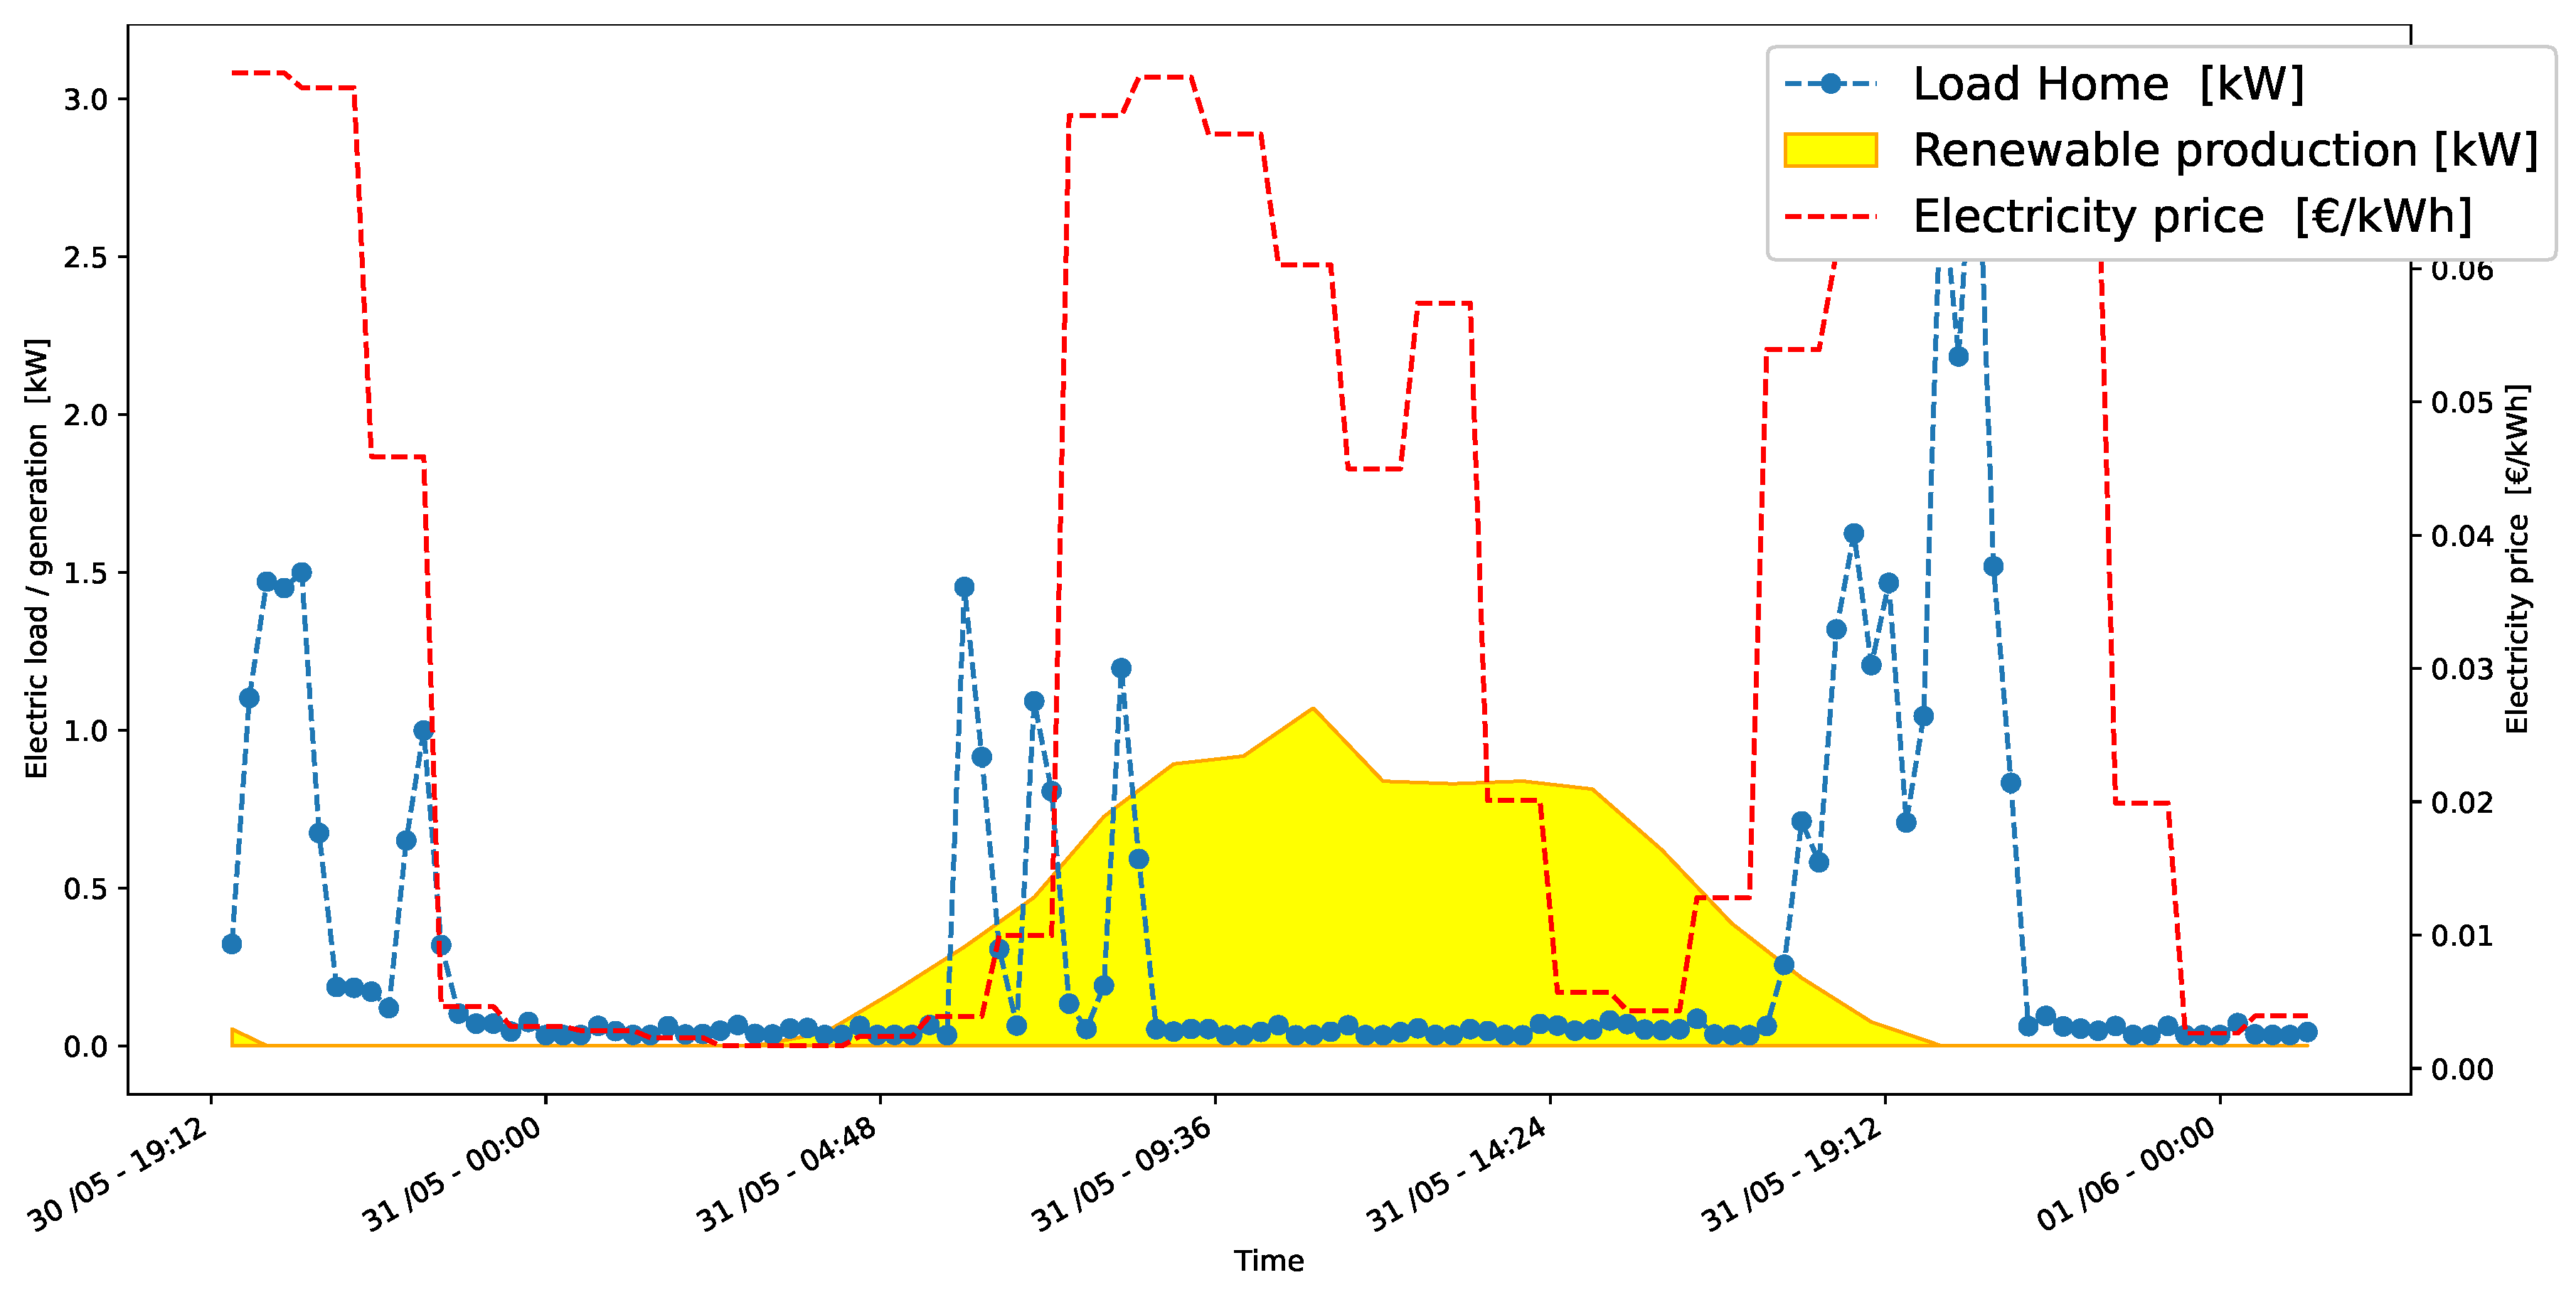
4.1. Electric Load and PV Production Estimation

The creation of an electric load profile within this work relies on LoadProfileGenerator [35]. This tool provides an accurate, realistic, and well-discretized residential load trends. Profiles are generated using a behavior-based load generator that simulates the actions and the connected electric consumption of each member of the considered household. The 1 min discretized total load profile for a family with one child and with both midage working parents, referred to as CHR03 in [35], was chosen. Clearly, this profile does not account for the charging consumption of the EV. The solution’s robustness is reinforced by the embedded seasonal and weekly characteristics, which continually evolve even within corresponding times of the day.
Similarly, the yearly, hourly discretized renewable generation estimation, associated with a solar array of 3 kW, south-oriented located in Gothenburg, relies on the commercial software PVsyst 7.4 [36]. The software output consists of the net generation, thereby accounting for losses associated with the inverters and perfectly aligning with the parameter P t P V present in Equations (9) and (10), as well as the convention in Figure 1.

4.2. Electricity Tariff

The end users’ tariff is the assumed time variable: an hourly dToU was chosen in order to enhance the optimization and highlight hidden potentials of this application. Nevertheless, on- and off-peak power pricing, typical of sToU tariffs, still enable the possibility for optimization, with a lower margin for the savings, and could easily be considered in this simulation tool. In line with the methodology proposed in [13], numerical values were taken from the Nordpool [37] day-ahead market price. Nordpool is a regional energy market operator and power exchange that facilitates the trading of electricity in the Nordic and Baltic countries. It provides a platform for buyers and sellers to trade electricity, thus allowing market participants to engage in spot trading, futures contracts, and other financial instruments related to energy. It is relevant to state that all prices are wholesale and exclude any fees, charges, or taxes applied at a national level or by DSOs. The resulting absolute charging cost may therefore differ from the real one paid by the final user. This difference will not affect future considerations, as economic advantages are discussed and derived in terms of percentage changes with respect to a benchmark. A comprehensive illustration of the three introduced time series is provided in Figure 4.

5. Results and Discussion

Optimal set points were calculated on a single charging process: the car returning home is incorporated as a dynamic load within the more complex context of home power flows, and an optimal charging schedule is computed. The user, subject to a dToU tariff in terms of electricity pricing, can input the number of hours for which the vehicle will remain connected and an indication of the desired departure SoC. Bearing this in mind, optimization is performed iteratively over the remaining time windows, and the final output is represented by the control action in terms of power supply to meet the demand at each time step.
In Figure 5, a flowchart illustrating the architecture is depicted. It is relevant to underline that forecasting algorithms were beyond the scope of this work, and for this reason, the load and renewable production estimation were not progressively updated at each iteration. In the present section, the forecast module is treated as deterministic, thereby utilizing one-year static records. Referring to the flowchart, the EV and User Module input are chosen a priori. The combination of the chosen boundary conditions leads to the automatic selection of a UC (Table 1) and the consequent determination of the optimal charging set points for the car. As reported by Mazzola et al. [33], this represents the most optimistic solution in economic terms, which is a valid reference benchmark frequently referred to assess systems’ performances.

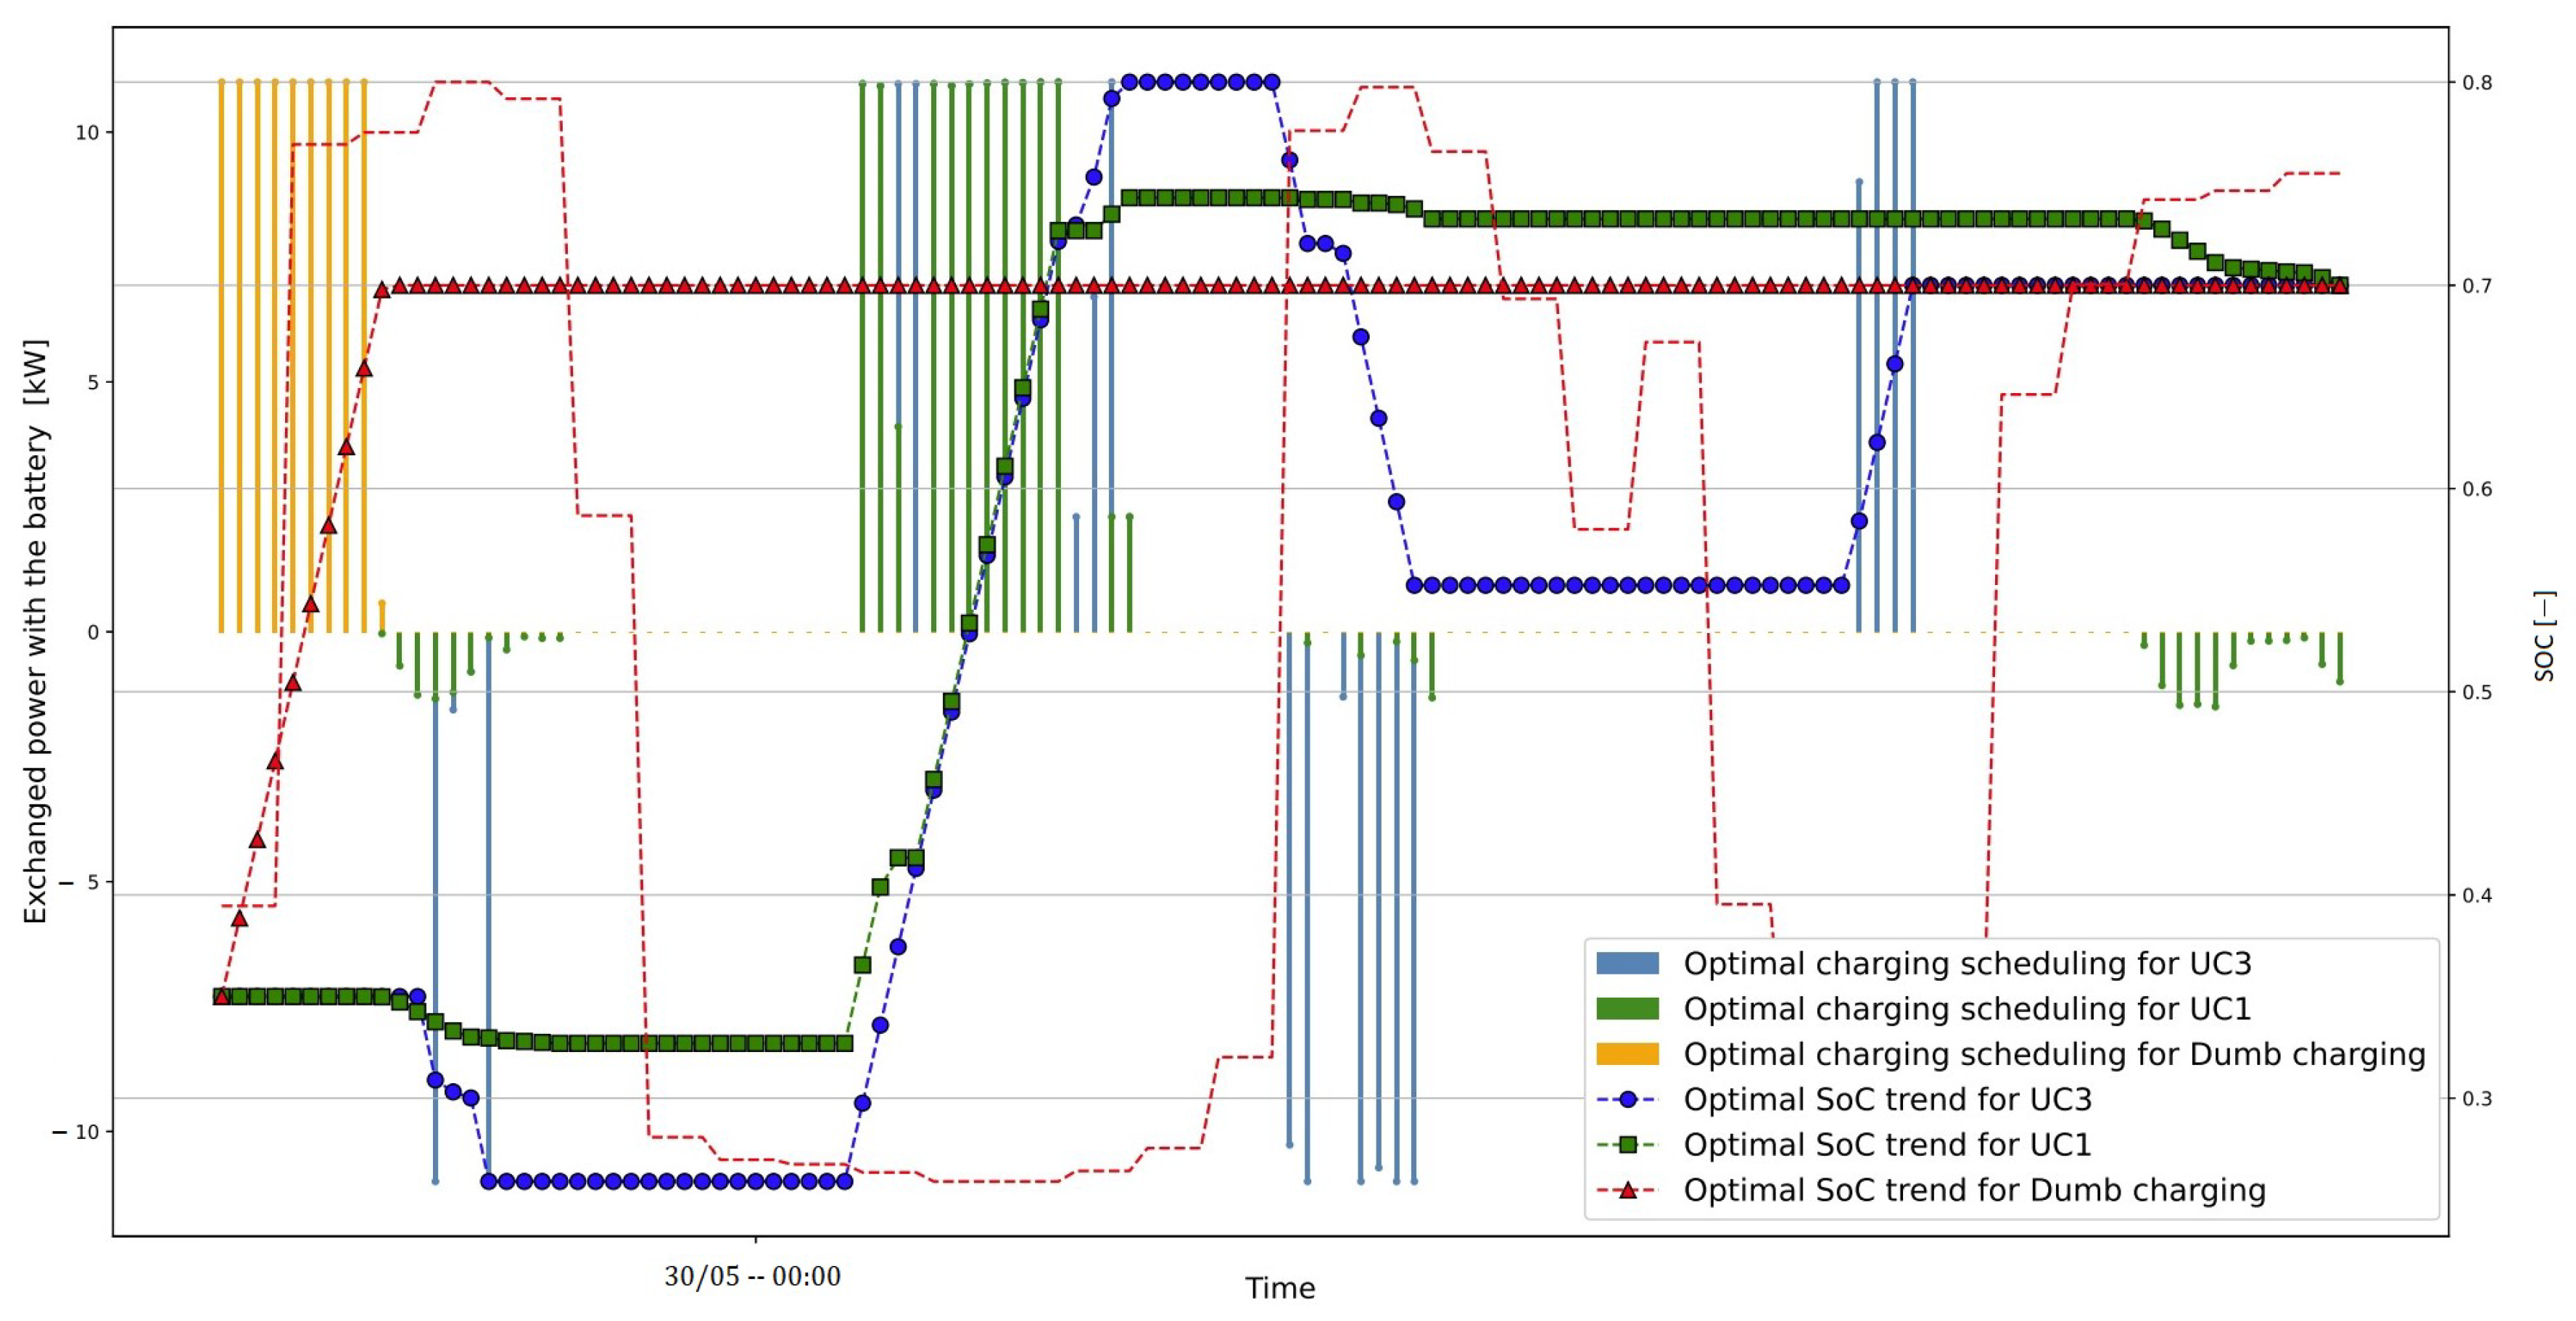
5.1. Economic Profitability in Bidirectional Smart Charging

Bidirectional optimized charging offers potential economic savings for car owners. By quantifying the monetary profitability, EV owners can assess the financial viability and benefits of adopting such systems. In this study, UC 1 and UC 3, with respect to the definition provided in Table 1, were compared to a selected benchmark representing typical plug-and-charge (or “dumb charging”) processes. Assumptions in Table 4 were added to Table 3. The SoC trends for each charging logic are compared in Figure 6. Notably, UC 1 and UC 3, both being price-optimized charging strategies, tended to operate charging and discharging within the same time intervals. Conversely, plug-and-charge methods impose greater stress on grid infrastructure in terms of peak demand and offer no economic advantage for the user.
Economically speaking, with respect to dumb charging, optimized scheduling ensures relevant savings for the users (Table 5). The benchmark is identified by the time of plugging in the car, and the results mentioned earlier represent a worst-case scenario where charging is done during a peak period. Nevertheless, the simulation was conducted to evaluate a typical weekday situation where car users typically arrive home after work (around 17:00/18:00), which often coincides with peak pricing.
Wrapping up, the economic benefits of bidirectional operations are unquestionable, and their magnitude depends on the user’s previous charging habits.
Economic profitability significantly improves when constraints on the grid power injection are relaxed, particularly between UC 1 and UC 3. In UC 1, the optimal economic benefit from bidirectional operation requires a peak in price to coincide with substantial load demand. Conversely, in UC 3, the presence of peak prices alone is enough to initiate power discharge from EVs to the grid. This capability to discharge at higher rates allows for full exploitation of the cycling region prescribed by the protocol. UC 3 fully utilizes the State of Charge (SoC) boundaries outlined by the charging protocol, thus reaching both lower and upper bounds during optimal charging. However, this increased energy throughput can lead to higher stresses and performance degradation for battery capacity, which is a concern that is growing in importance due to customer demand for reliable maximum range over time. In essence, greater savings are directly correlated with increased battery energy throughput and energy drawn from the grid.
The presented analysis thus far establishes a benchmark condition in which operations are primarily constrained by economic factors encompassing the overall cost of the charging process, thereby accounting for battery degradation effects. However, additional limitations can also be imposed from the vehicle’s side to mitigate wear and tear. Extensive limitation of the total energy discharged per each charging process, U d h , can be consequently imposed as an incremental constraint:
t = 0 T ( p t E V , d h ) · Δ t U d h
The impact of this additional constraint on the solution is not linear: a nonintensive solution in terms of battery cycling will not be impacted (UC 1), while a limitation on the savings is imposed on UC 3. Only the most convenient price fluctuation will be exploited (Figure 7).

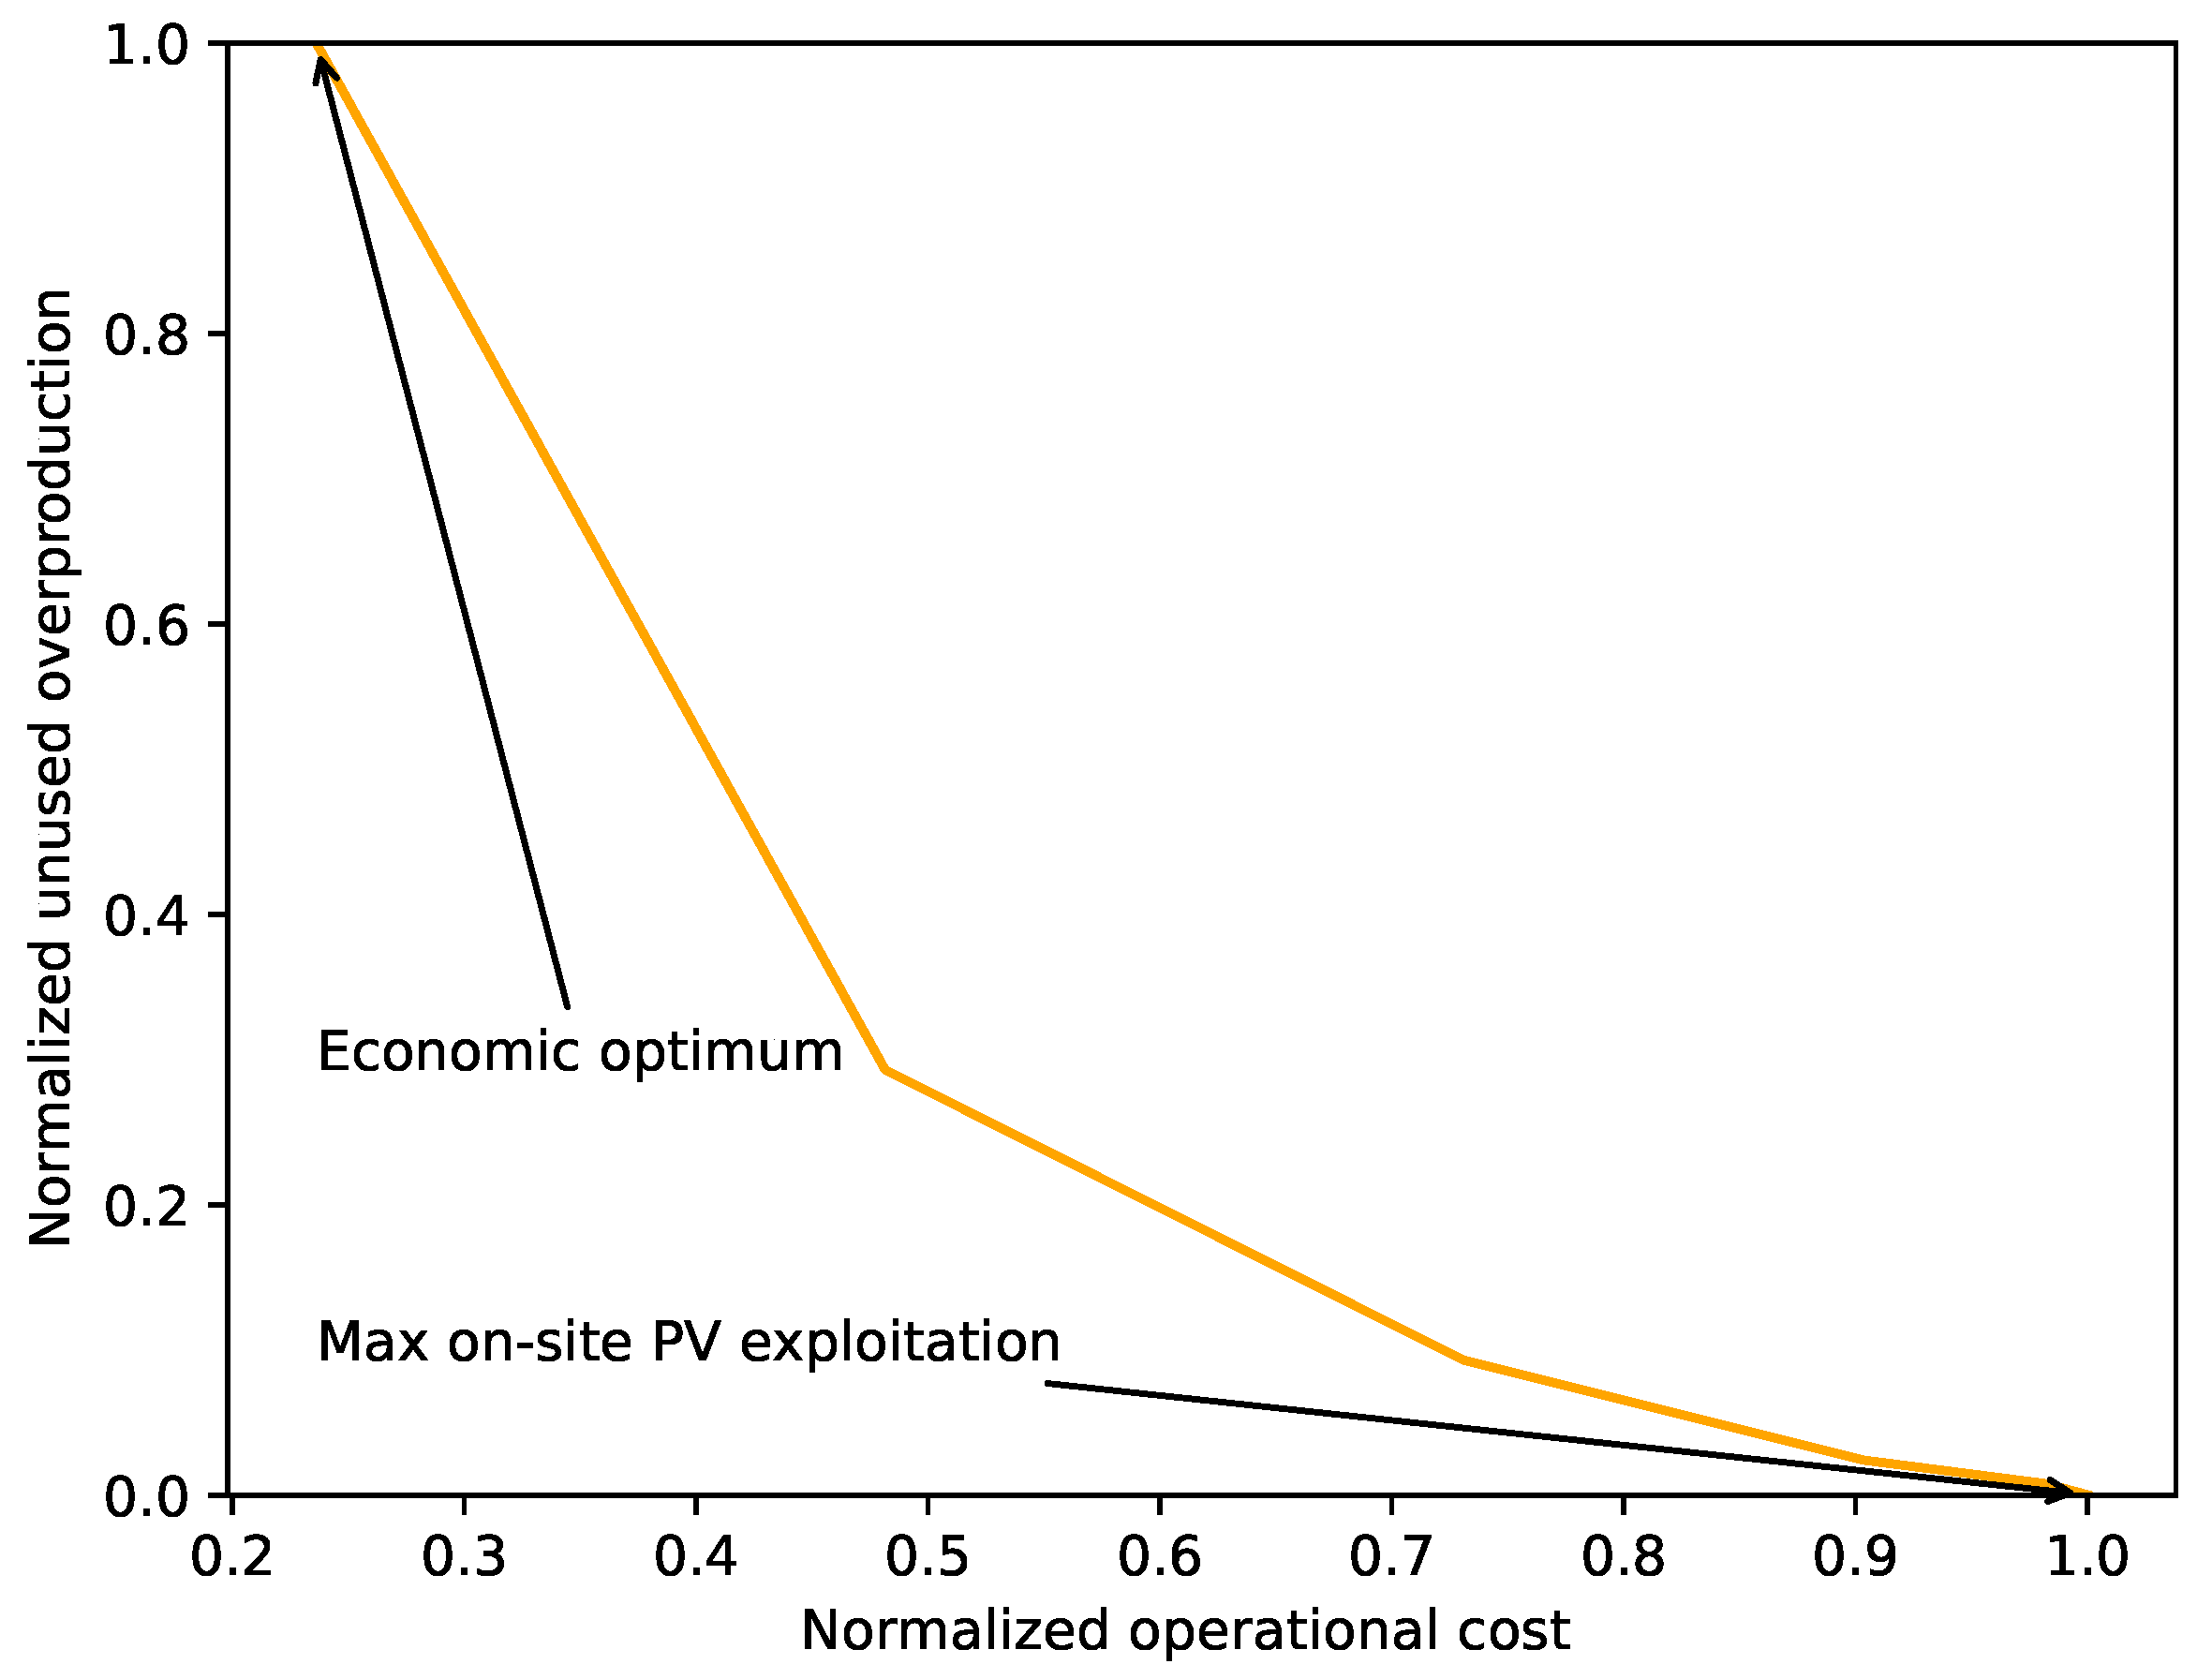
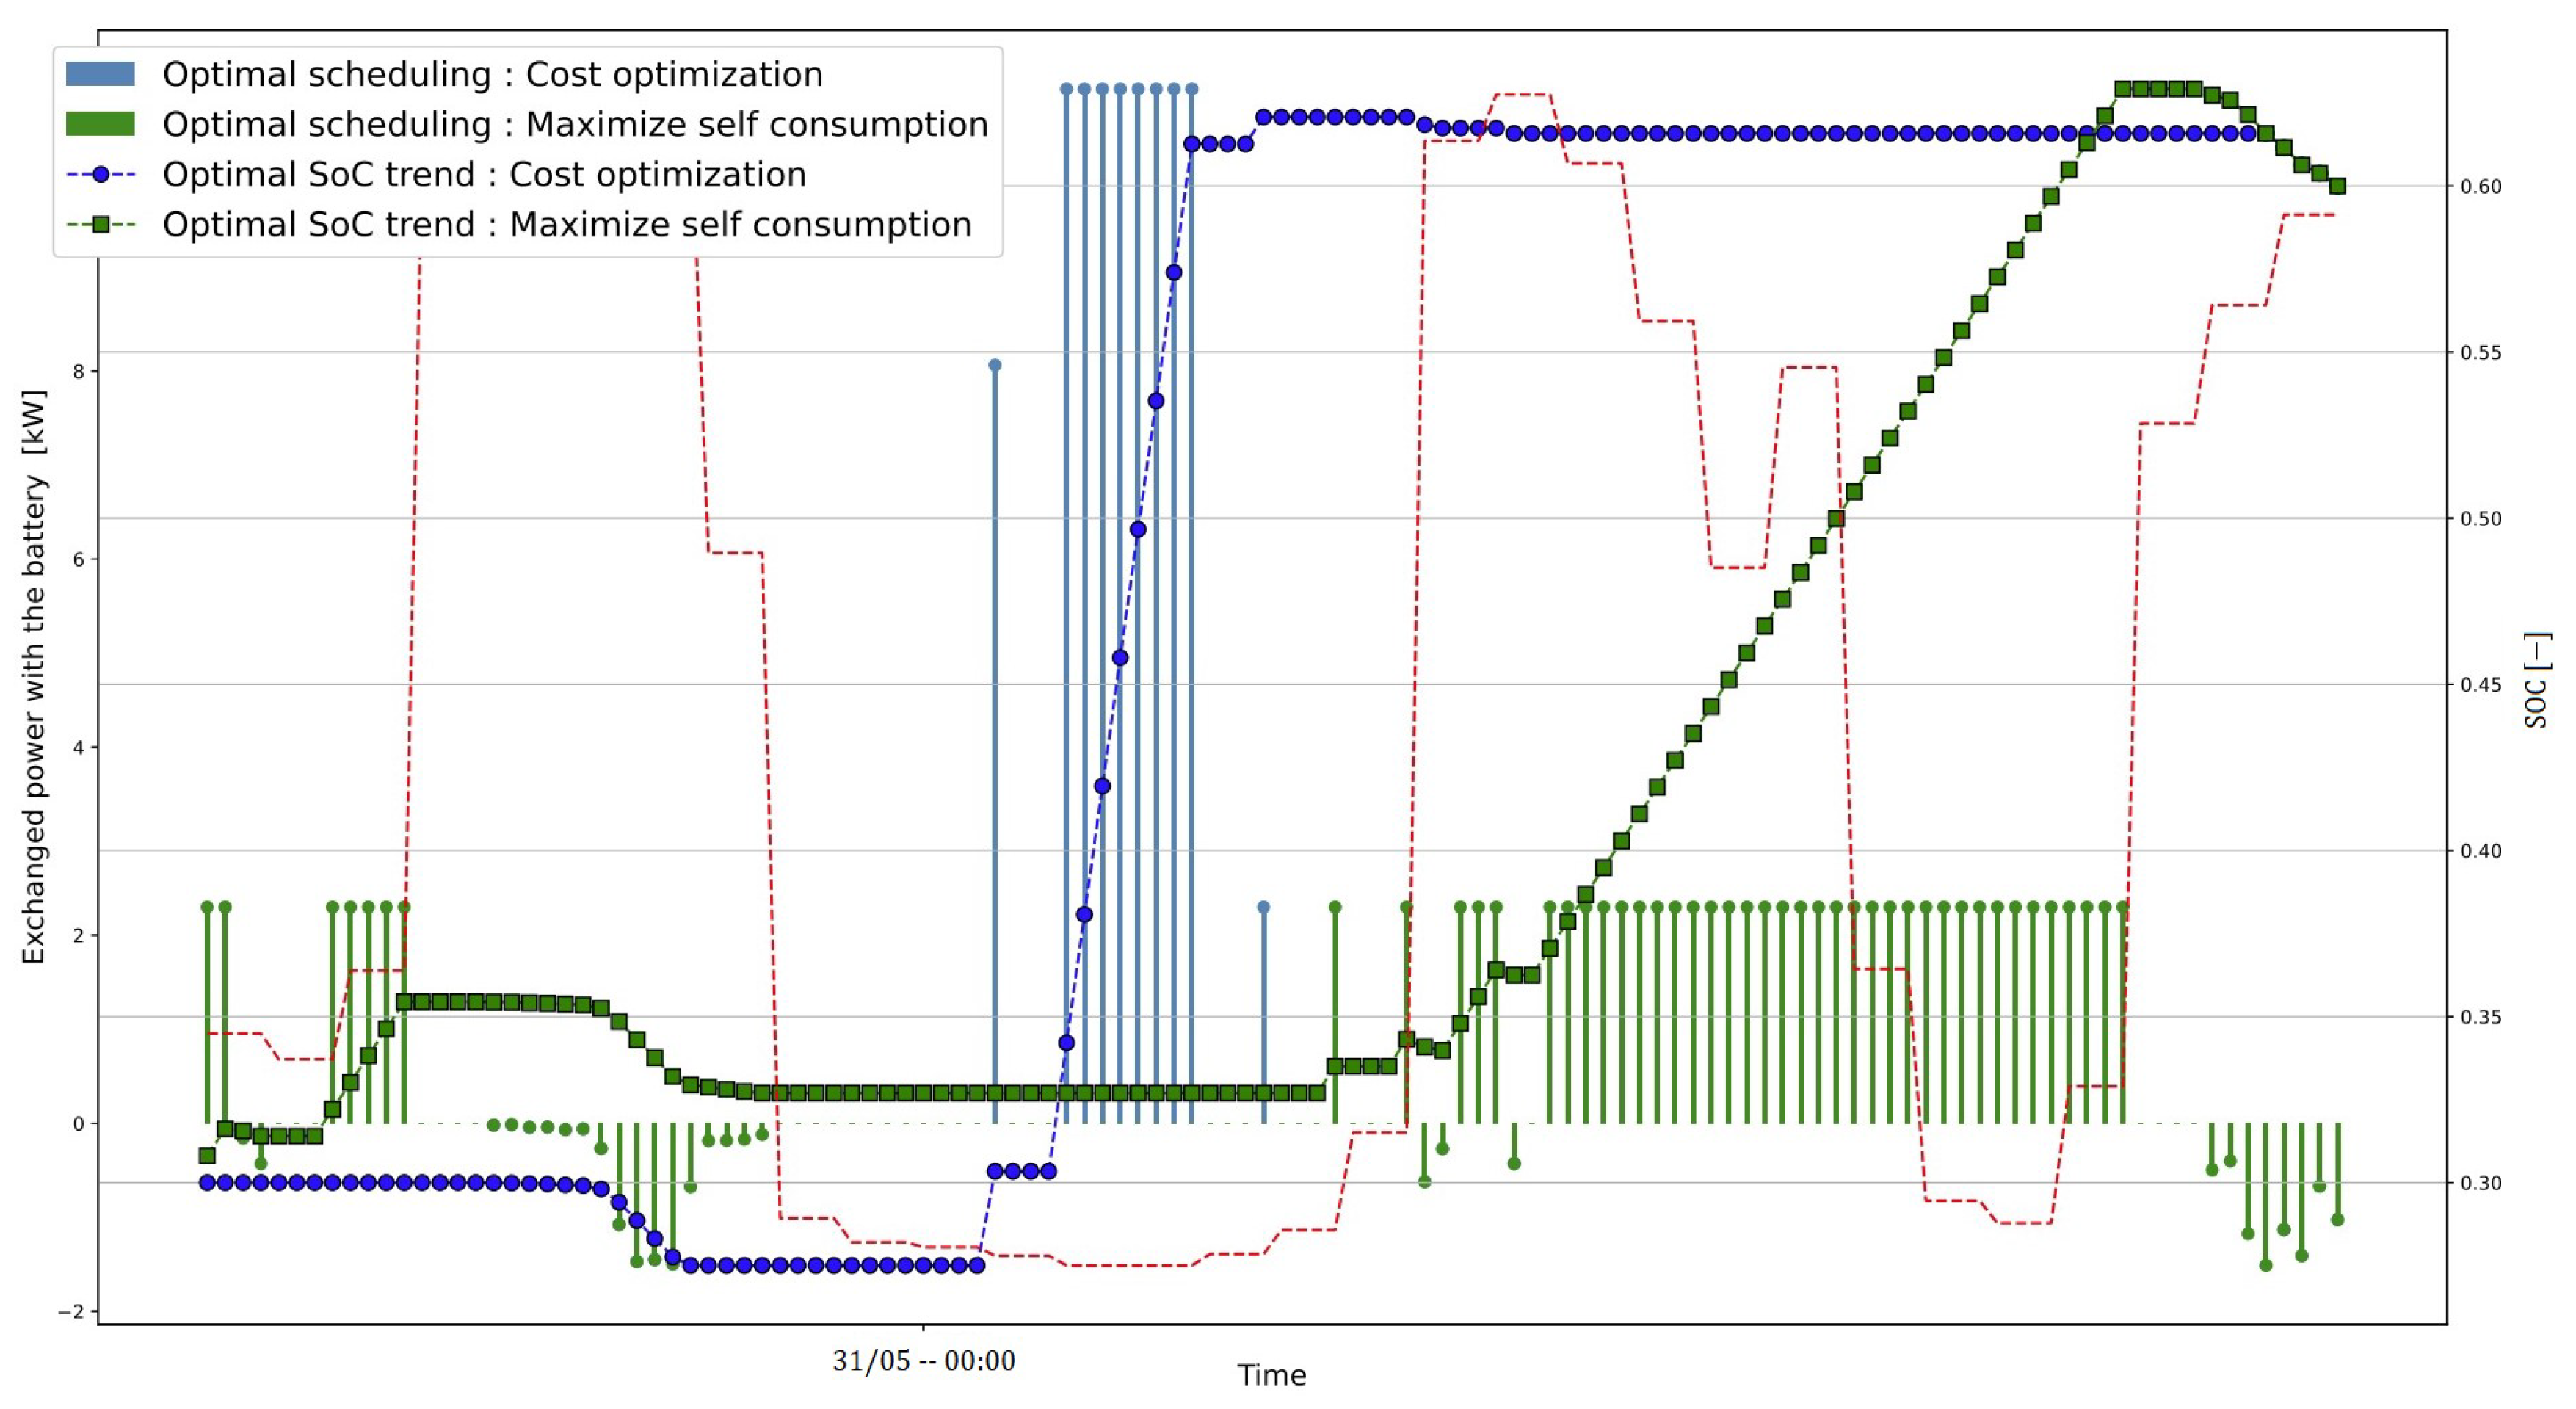
5.2. Maximization of PV Self-Consumption

Cost optimization is not the sole focus to which the optimal charging scheduling should aim. The concept of self-consumption has emerged as a valuable objective to facilitate small-scale nondispatchable RES penetration, thereby reducing at the same time the impact on the grid and mitigating peak issues from a DSO’s perspective. Furthermore, smart shifting of the load as a function of the forecasted local renewable energy represents a key enabler for a sustainable future and a resilient renewable integration. A comparison between UC 1 and UC 2 (Table 1) is here proposed.
Boundary conditions are common for the two and equal to those reported in Table 4, with the only exception of S o C t a r g e t = 0.6 . This difference is in order to shed light on the two different optimal charging trajectories without constraining too strictly the charging schedules. In the presence of high overgeneration, a user may desire to take advantage of this surplus power for charging rather than injecting it into the grid, which is generally done at a fixed price. EVs, with their controllable load capacity, play a central role in fulfilling this objective. The two alternative charging schedules and grid power trends are reported in Figure 8.
Bearing in mind that most of the overproduction is located temporally in the middle of the day, as shown in Figure 4, the charging session is shifted from the blue high-power cost-optimized solution occurring in the middle of the day in correspondence of price minimum to the green scheduling occuring at a minimum charging power over a longer time interval in to accommodate all the solar excess. To accommodate the surplus energy that cannot be dispatched elsewhere, the offset between P c h , m i n and the effective overproduction must still be supplied by the grid in the presence of a nonoptimized price. Essentially, the inclusion of an additional driver for optimal scheduling results as a deviation from the purely economic optimum: recalling the analytical formulation of Equation (27), weight α and β require being tuned according to the user awareness to sustainability and economics. The Pareto front, representing the set of optimal solutions in a multiobjective optimization problem, is reported in Figure 9. Nondominated solutions are reported, thus evolving towards the lower right corner as β decreases: the two extreme solutions, highlighted by arrows, correspond to the charging profile of Figure 8.
A trade-off condition is evident in Figure 9: as β increases, the relative weight of the operational cost in the charging scheduling calculation becomes more central to the expenses of the on-site renewable consumption. With respect to the Pareto optimal front, a user may tune the coefficients informatively, thus understanding the potential savings of more extreme choices. Hybrid decisions are therefore possible and can model the intention of a user interested in including most of his local generation without foregoing financial benefits. It is worth pointing out that while the normalized unused production ranges from 0 to 1, meaning that optimal solutions are able to fully abate the unused renewable share, the cost associated with the solution corresponding to β = 1 (upper left corner) correspond to 23.5% of the maximum cost. The solution reported in Figure 8, corresponding to the lower right corner, was obtained for α = 0.5. The sensitivity analysis performed on the weights is explicitly reported in Figure 10 up to β = 0.7. No explicit changes were taking place in the optimal control actions.

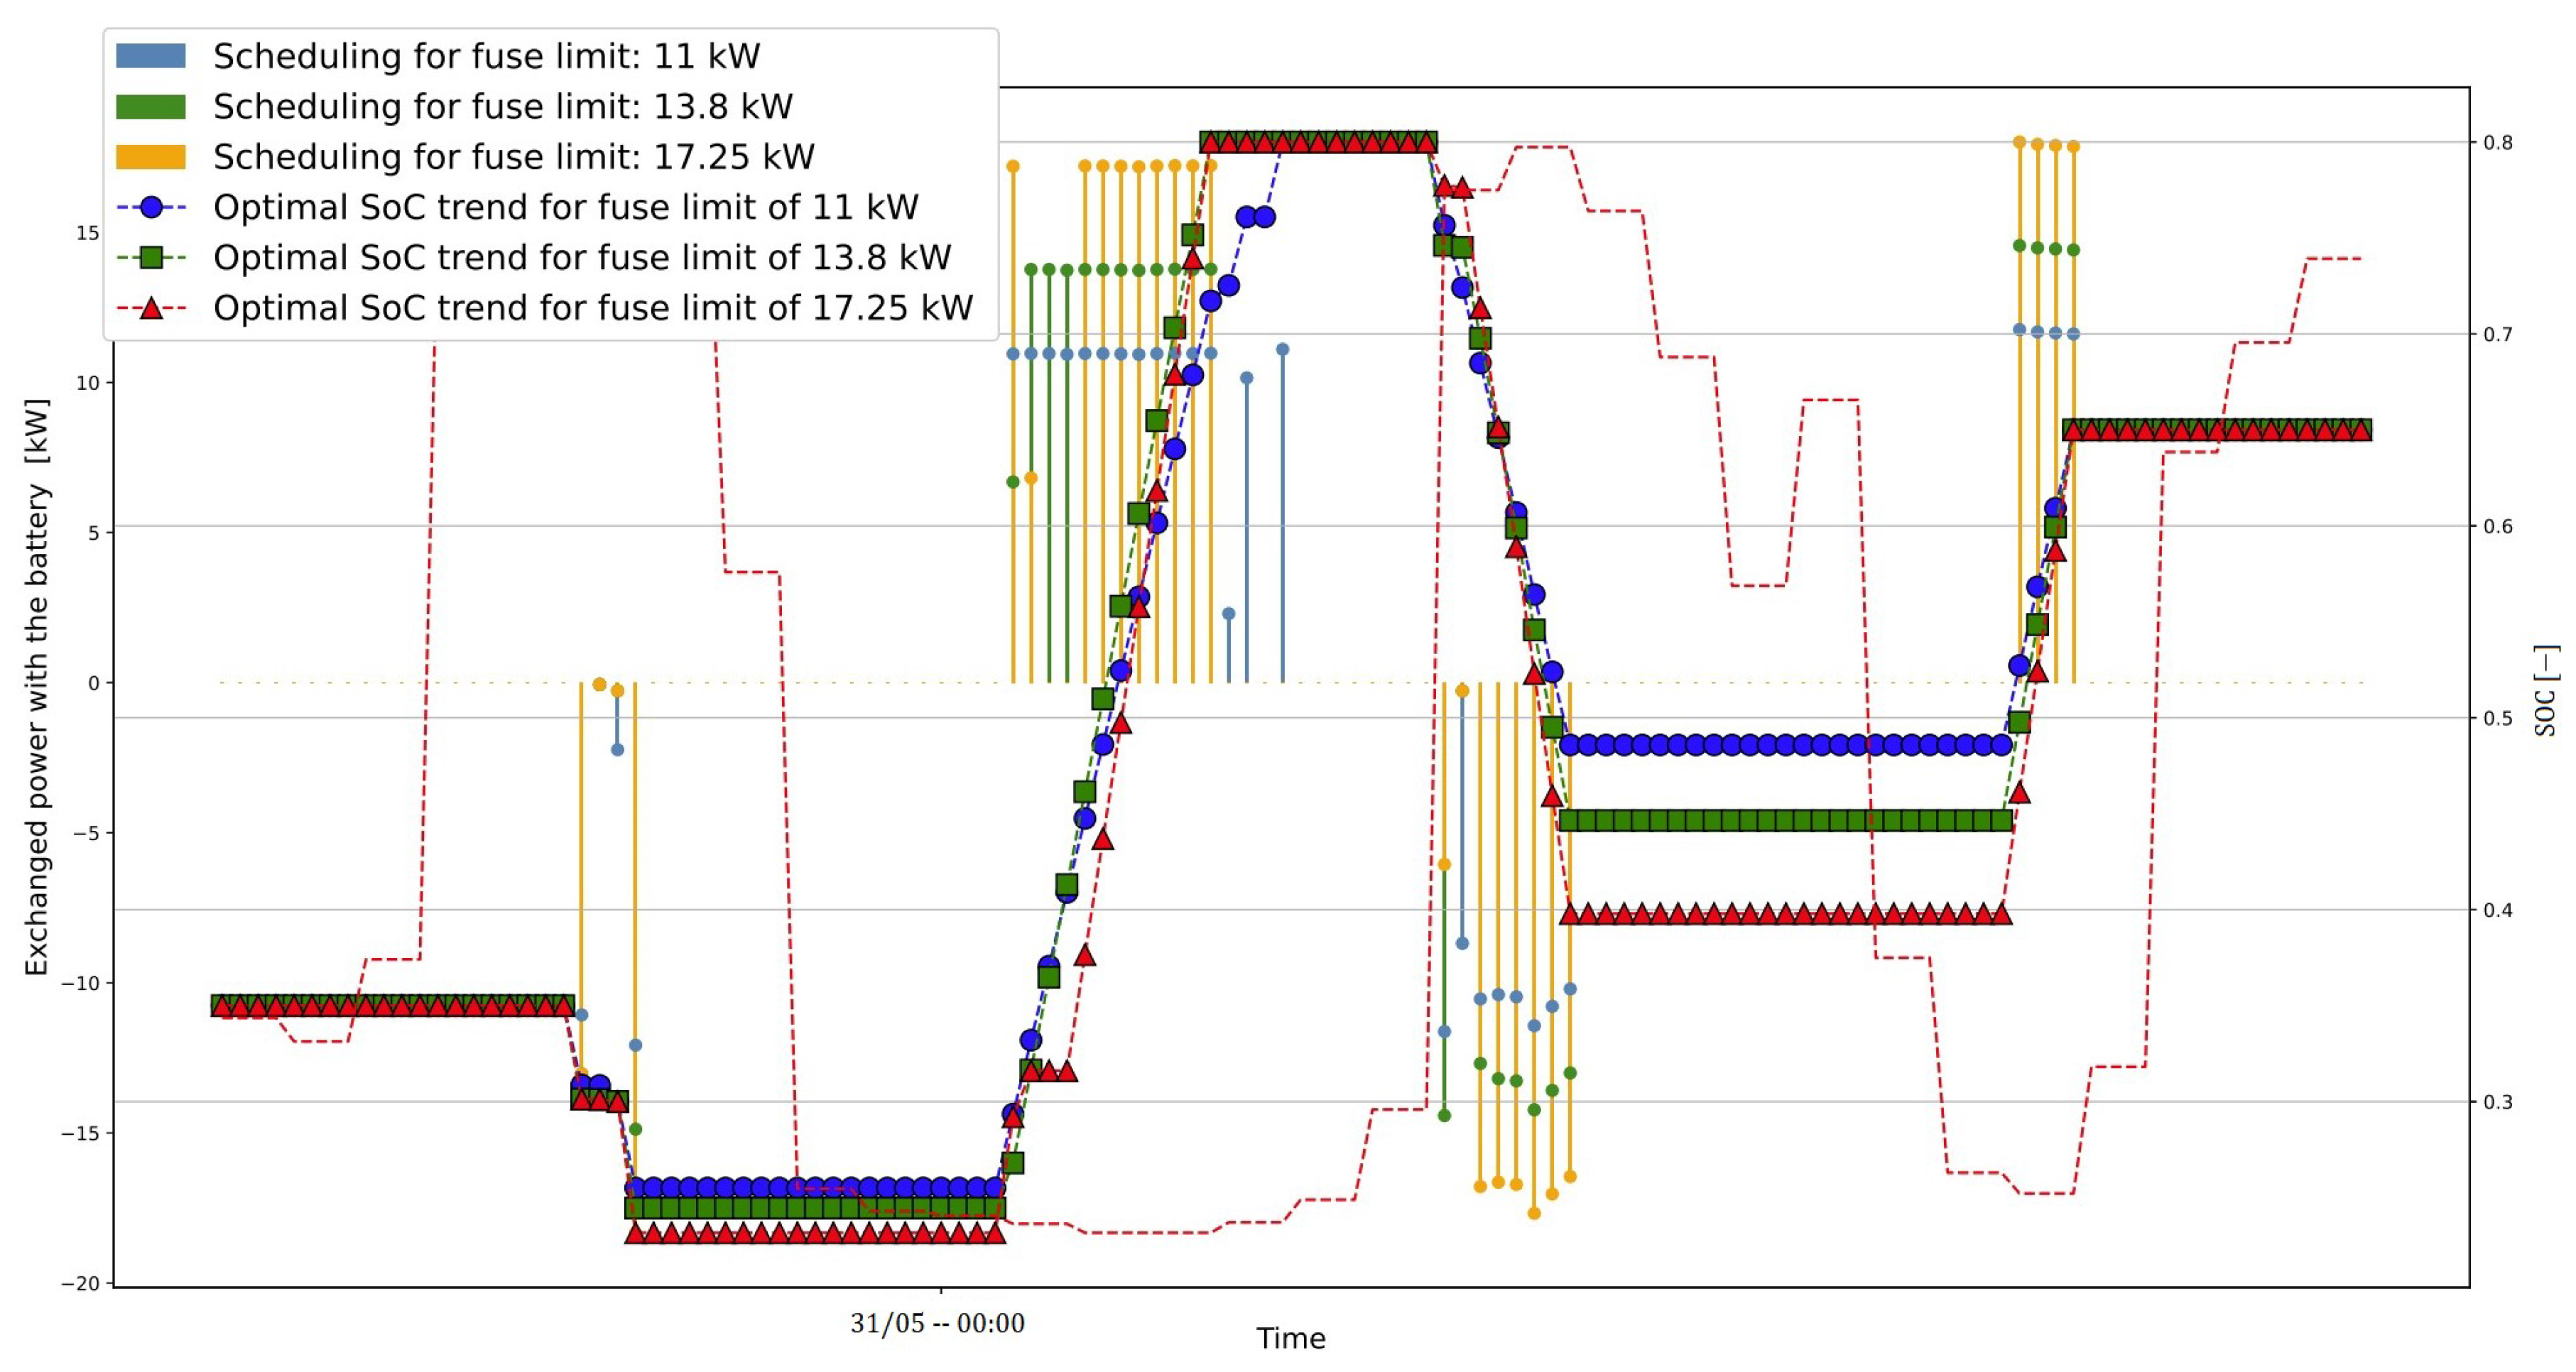
5.3. Fuse Limit Sensitivity

In the proposed study case, fuse limits are a limiting factor with respect to the potential economic savings. Once the most convenient period to perform charging is identified, we have that the higher the upper bound for power exchange with the grid, the faster and cheaper are the operations that will result. Assuming a household as a three-phase system, with each subject to a fuse limit, the correspondent power limitations are reported in Table 6.
A further assumption with respect to the previous paragraph concerns the capacity of the charging infrastructure: P l i m , 1 was increased to 22 kW. The analysis does not include the differential cost of the EVSE for two main reasons: Firstly, it constitutes a fixed investment covered by the owner at the outset and does not entail significant differential operational costs over the years. Secondly, this approach was chosen to explore the full potential of harnessing greater fuse limit capabilities. In essence, this section aims to serve primarily as a benchmark of the potential performance achievable with higher fuse limits. The results for simulations conducted on UC 3 over 30 h with a S o C a r r i v a l and S o C d e p a r t u r e of 0.3 and 0.65, respectively, are reported in Figure 11.
The fuse limit represents a further enabler for a greater exploitation of the admitted region for V2X: wider cycling operations are possible given the faster interactions with the battery. The total cost of operations varied non-negligibly (±10%) according to the overview reported in [38] and imposed a trade-off condition between decreasing operational costs and the additional fixed costs in bills imposed on the user for benefiting a higher power availability. A parallel analysis was conducted for UC 1: by increasing the maximum available grid power, the charging sessions were exactly located in the optimal time periods, but the discharging operations were not impacted, as discharging capability is limited by the grid limit to inject. The economic benefits do not allow for an open trade-off condition as the one discussed above.

5.4. Validation

The testing and validation phase revealed the enormous potential embedded in bidirectional smart operations of EVs in a domestic framework. The results are in line with the major findings within the related literature. In [39], the proposed economic MPC was tested on a household in Denmark in the presence of the day-ahead electricity spot price. The savings, with respect to dumb charging, stood at 60%. Halvgaard et al. evaluated performance metrics over a one-year period. The slight difference in savings arises from our approach, where we compared a single optimized charging process with uncontrolled charging during peak price periods. However, over a year, these trends are averaged, and charging during peak price periods may not always be the norm. On certain days, the prices of the two strategies may be comparable, particularly when charging occurs at lower prices. These factors contribute to a lower percentage of savings. A comparison with a non optimized-based controller has been investigated in [11] with comparable economic performances.

6. Conclusions

Shrinking horizon-based control architecture has been introduced as a method for integrating the EV charging in household energy management in the presence of a time of use tariff. The flexibility of domestic entities will represent a crucial enabler for the definitive establishment and proliferation of a smart interconnected distribution network. The optimization-based approach has been found to be effective in the optimal scheduling of operations within the household. An EV, considered as a controllable and bidirectional load, has been successfully operated while aiming at minimizing user-defined objectives. Moreover, the MPC-based technique has been proven valid when dealing with uncertainty and user input variations over time. A simulation environment has been developed to numerically assess the performances of complex interconnected systems in the presence of different boundary conditions. The EV’s arrival SoC, charging limitations, departure time, and desired SoC, included as deterministic parameters, have been identified as the most relevant parameters to be communicated to perform the optimization. On the domestic side, the current and forecasted net consumption represent the main input. optimHome conceives different UCs deriving from different boundary conditions on the problem. The present work has made relevant contributions in the formalization of a user-centric-based HEMS, thus leading to the explicit derivation of various optimization problems that incorporate architecture and protocol limitations as constraints. The study was conducted quantitatively; trade-off conditions were identified, discussed, and addressed through numerical analysis. Moreover, the relevance of the work has also been proven using commercial products launched on the market based on similar optimization structure and principles [40,41].
Future work may address the inherent stochastic character of the net load demand, thereby assessing performances that vary the exactness of the forecast. A parallel stream will interest the inclusion of heat pumps as an additional controllable load and thermal model of the household in the optimization procedure.

Author Contributions

Conceptualization, C.M.C., M.M. and M.A.F.G.; methodology, C.M.C. and M.A.F.G.; validation, C.M.C., M.M. and M.A.F.G.; resources, C.M.C., M.M. and M.A.F.G.; data curation, C.M.C.; writing—original draft preparation, C.M.C. and M.M.; writing—review and editing, C.M.C., M.M. and M.A.F.G.; visualization, C.M.C.; supervision, M.M., M.A.F.G. and J.E.; project administration, M.M., M.A.F.G. and J.E. All authors have read and agreed to the published version of the manuscript.

Funding

This research received no external funding.

Data Availability Statement

The data are contained within the article.

Acknowledgments

The authors thank Volvo Cars R&D centre in Göteborg, particularly the External Energy Systems team for their constant support and industrial-oriented specific knowledge.

Conflicts of Interest

Authors Mohammad Ali Fotouhi Ghazvini and Jacob Edvinsson were employed by the company Volvo Cars Corporation. The remaining authors declare that the research was conducted in the absence of any commercial or financial relationships that could be construed as a potential conflict of interest.

Abbreviations

The following abbreviations are used in this manuscript:
EVElectric Vehicle
HEMS               Home Energy Management System
EMSEnergy Management System
EVSEElectric Vehicle Supply Equipment
DERsDistributed Energy Resources
DSODistribution System Operator
dToUDynamic Time of Use
FITFeed-In Tariff
KPIKey Performance Indicator
OCPOptimal Control Problem
MILPMixed Integer Linear Programming
MGMicrogrid
LPLinear Programming
RHRolling Horizon
RESRenewable Energy Sources
RMPCRobust Model Predictive Control
SoCState Of Charge
sMPCStochastic Model Predictive Control
SH-MPCShrinking Horizon MPC
sToUStatic Time of Use
TSOTrasmission System Operator
UCUse Case
V2HVehicle to Home
V2XVehicle to Everything
V2GVehicle to Grid

Nomenclature

         The following nomenclature is employed in this manuscript:  
Sets:
T /tSet and index for time steps
G /gGrid modes buy or sell
B /bBattery mode charge or discharge
Variables:
p t g r i d , b u y Power drawn from the grid [kW]
p t g r i d , s e l l Power injected into the grid [kW]
p t E V , c h Charging power [kW]
p t E V , d h Discharging power [kW]
p t e x c e s s Renewable overproduction [kW]
x t g r i d , b u y Binary for power drawn
x t g r i d , s e l l Binary for power injected
x t E V , c h Binary for charging
x t E V , d h Binary for discharging
x t z o n e 2 Binary for Zone 2
x t z o n e 4 Binary for Zone 4
s o c t State of charge [−]
Parameters:
P t P V PV production [kW]
P t l o a d Load demand [kW]
P t n e t Net demand [kW]
P g r i d , m a x Upper bound of the grid [kW]
P E V , m a x EV maximum charging power [kW]
P E V S E , m a x EVSE maximum charging power
P c h , m i n Minimum charging power [kW]
P t a v Available power [kW]
SoC h i g h P High SoC threshold [−]
SoC a r r i v a l Arrival SoC [−]
SoC t a r g e t Target/Departure SoC [−]
SoC m i n i m u m Minimum SoC [−]
SoC V 2 X , m i n Minimum SoC for V2X [−]
SoC V 2 X , m a x Maximum SoC for V2X [−]
SoC m a x i m u m Maximum SoC [−]
C E V EV battery capacity [kWh]
C t e l Electricity price [€/kWh]
FITFeed-In Tariff [€/kWh]
Δ t Discretization time step [min]
N P Prediction time steps [−]
TTime for V2X [min]
α , β Weight coefficient [−]
DDegradation coefficient [€/kWh]
qPercentage capacity loss [%]
C B ^ Specific cost of battery [€/kWh]
φ Remaining capacity at end life [−]
C d e g r a d a t i o n Degradation cost [€]

References

  1. Van Kriekinge, G.; De Cauwer, C.; Sapountzoglou, N.; Coosemans, T.; Messagie, M. Peak shaving and cost minimization using model predictive control for uni- and bi-directional charging of electric vehicles. Energy Rep. 2021, 7, 8760–8771. [Google Scholar] [CrossRef]
  2. IEA. Global EV Outlook 2023. Available online: https://www.iea.org/reports/global-ev-outlook-2023 (accessed on 10 March 2024).
  3. Weiss, X.; Xu, Q.; Nordström, L. Energy Management of Smart Homes with Electric Vehicles Using Deep Reinforcement Learning. In Proceedings of the 2022 24th European Conference on Power Electronics and Applications (EPE’22 ECCE Europe), Hannover, Germany, 5–9 September 2022; pp. 1–9. [Google Scholar]
  4. Fit for 55 Policy, European Green Deal. Available online: https://www.consilium.europa.eu/en/policies/green-deal/ (accessed on 3 May 2023).
  5. Hatziargyriou, N.; Sakis Meliopoulos, A. Distributed energy sources: Technical challenges. In Proceedings of the 2002 IEEE Power Engineering Society Winter Meeting, Conference Proceedings (Cat. No.02CH37309), New York, NY, USA, 27–31 January 2002; Volume 2, pp. 1017–1022. [Google Scholar] [CrossRef]
  6. Maree, J.P.; Gros, S.; Lakshmanan, V. Low-complexity Risk-averse MPC for EMS. In Proceedings of the 2021 IEEE International Conference on Communications, Control, and Computing Technologies for Smart Grids (SmartGridComm), Aachen, Germany, 25–28 October 2021; pp. 358–363. [Google Scholar] [CrossRef]
  7. Kanwar, A.; Hidalgo Rodriguez, D.; Von Appen, J.; Braun, M. A Comparative Study of Optimization-and Rule-Based Control for Microgrid Operation; Power and Energy Student Summit (PESS): Dubai, United Arab Emirates, 2015; Volume 1. [Google Scholar]
  8. Ben Slama, S. Design and implementation of home energy management system using vehicle to home (H2V) approach. J. Clean. Prod. 2021, 312, 127792. [Google Scholar] [CrossRef]
  9. Daccò, E.; Falabretti, D.; Ilea, V.; Merlo, M.; Nebuloni, R.; Spiller, M. Decentralised Voltage Regulation through Optimal Reactive Power Flow in Distribution Networks with Dispersed Generation. Electricity 2024, 5, 134–153. [Google Scholar] [CrossRef]
  10. Li, Z.; Su, S.; Jin, X.; Xia, M.; Chen, Q.; Yamashita, K. Stochastic and Distributed Optimal Energy Management of Active Distribution Networks Within Integrated Office Buildings. CSEE J. Power Energy Syst. 2024, 10, 504–517. [Google Scholar] [CrossRef]
  11. Yousefi, M.; Hajizadeh, A.; Soltani, M.N.; Hredzak, B. Predictive Home Energy Management System with Photovoltaic Array, Heat Pump, and Plug-In Electric Vehicle. IEEE Trans. Ind. Inform. 2021, 17, 430–440. [Google Scholar] [CrossRef]
  12. Wu, H.; Pratt, A.; Munankarmi, P.; Lunacek, M.; Balamurugan, S.P.; Liu, X.; Spitsen, P. Impact of model predictive control-enabled home energy management on large-scale distribution systems with photovoltaics. Adv. Appl. Energy 2022, 6, 100094. [Google Scholar] [CrossRef]
  13. Ghazvini, M.A.F.; Antoniadou-Plytaria, K.; Steen, D.; Le, T. Two-stage demand-side management in energy flexible residential buildings. J. Eng. 2024, 2024, e12372. [Google Scholar] [CrossRef]
  14. Cominesi, S.; La Bella, A.; Farina, M.; Scattolini, R. A multi-layer control scheme for microgrid energy management. IFAC Pap. 2016, 49, 256–261. [Google Scholar] [CrossRef]
  15. Chen, J.; Zhang, Y.; Li, X.; Sun, B.; Liao, Q.; Tao, Y.; Wang, Z. Strategic integration of vehicle-to-home system with home distributed photovoltaic power generation in Shanghai. Appl. Energy 2020, 263, 114603. [Google Scholar] [CrossRef]
  16. Cao, Y.; Wang, H.; Li, D.; Zhang, G. Smart Online Charging Algorithm for Electric Vehicles via Customized Actor–Critic Learning. IEEE Internet Things J. 2022, 9, 684–694. [Google Scholar] [CrossRef]
  17. Amry, Y.; Elbouchikhi, E.; Le Gall, F.; Ghogho, M.; El Hani, S. Optimal sizing and energy management strategy for EV workplace charging station considering PV and flywheel energy storage system. J. Energy Storage 2023, 62, 106937. [Google Scholar] [CrossRef]
  18. Parisio, A.; Rikos, E.; Glielmo, L. A Model Predictive Control Approach to Microgrid Operation Optimization. IEEE Trans. Control Syst. Technol. 2014, 22, 1813–1827. [Google Scholar] [CrossRef]
  19. Parisio, A.; Rikos, E.; Glielmo, L. Stochastic Model Predictive Control for Economic/Environmental Operation Management of Microgrids: An Experimental Case Study. J. Process Control 2016, 43, 24–37. [Google Scholar] [CrossRef]
  20. Raveendran Nair, U.; Costa-Castelló, R. A Model Predictive Control-Based Energy Management Scheme for Hybrid Storage System in Islanded Microgrids. IEEE Access 2020, 8, 97809–97822. [Google Scholar] [CrossRef]
  21. Guerrero, J.M.; Vasquez, J.C.; Matas, J.; de Vicuna, L.G.; Castilla, M. Hierarchical Control of Droop-Controlled AC and DC Microgrids—A General Approach toward Standardization. IEEE Trans. Ind. Electron. 2011, 58, 158–172. [Google Scholar] [CrossRef]
  22. Cabrera-Tobar, A.; Pavan, A.M.; Blasuttigh, N.; Petrone, G.; Spagnuolo, G. Real time Energy Management System of a photovoltaic based e-vehicle charging station using Explicit Model Predictive Control accounting for uncertainties. Sustain. Energy Grids Netw. 2022, 31, 100769. [Google Scholar] [CrossRef]
  23. Panapongpakorn, T.; Banjerdpongchai, D. Model Predictive Control of Energy Management System for Economic Dispatch with Application to MHS Microgrid in Normal Operation. In Proceedings of the 2019 19th International Conference on Control, Automation and Systems (ICCAS), Jeju, Republic of Korea, 15–18 October 2019; pp. 1281–1286. [Google Scholar] [CrossRef]
  24. Esmaeel Nezhad, A.; Rahimnejad, A.; Nardelli, P.; Gadsden, S.; Sahoo, S.; Ghanavati, F. A Shrinking Horizon Model Predictive Controller for Daily Scheduling of Home Energy Management Systems. IEEE Access 2022, 10, 29716–29730. [Google Scholar] [CrossRef]
  25. Antoniadou-Plytaria, K.; Steen, D.; Tuan, L.A.; Carlson, O.; Fotouhi Ghazvini, M.A. Market-Based Energy Management Model of a Building Microgrid Considering Battery Degradation. IEEE Trans. Smart Grid 2021, 12, 1794–1804. [Google Scholar] [CrossRef]
  26. Birkl, C.R.; Roberts, M.R.; McTurk, E.; Bruce, P.G.; Howey, D.A. Degradation diagnostics for lithium ion cells. J. Power Sources 2017, 341, 373–386. [Google Scholar] [CrossRef]
  27. Wang, J.; Purewal, J.; Liu, P.; Hicks-Garner, J.; Soukazian, S.; Sherman, E.; Sorenson, A.; Vu, L.; Tataria, H.; Verbrugge, M.W. Degradation of lithium ion batteries employing graphite negatives and nickel–cobalt–manganese oxide + spinel manganese oxide positives: Part 1, aging mechanisms and life estimation. J. Power Sources 2014, 269, 937–948. [Google Scholar] [CrossRef]
  28. Barcellona, S.; Piegari, L. Effect of current on cycle aging of lithium ion batteries. J. Energy Storage 2020, 29, 101310. [Google Scholar] [CrossRef]
  29. Bemporad, A.; Morari, M. Control of systems integrating logic, dynamics, and constraints. Automatica 1999, 35, 407–427. [Google Scholar] [CrossRef]
  30. Bisschop, J. AIMMS Optimization Modeling; Paragon Decision Technology: Kirkland, WA, USA, 1993. [Google Scholar]
  31. ISO 15118-20 Road Vehicles to Grid Communication Interface. Available online: https://www.iso.org/standard/77845.html (accessed on 5 May 2023).
  32. Electric Vehicle Outlook 2022 Bloomberg NEF. Available online: https://about.bnef.com/electric-vehicle-outlook/ (accessed on 29 May 2023).
  33. Mazzola, S.; Vergara, C.; Astolfi, M.; Li, V.; Perez-Arriaga, I.; Macchi, E. Assessing the value of forecast-based dispatch in the operation of off-grid rural microgrids. Renew. Energy 2017, 108, 116–125. [Google Scholar] [CrossRef]
  34. Volvo XC 40. Available online: https://www.volvocars.com/uk/cars/xc40/ (accessed on 5 March 2024).
  35. LoadProfileGenerator Website. Available online: https://www.loadprofilegenerator.de/ (accessed on 25 May 2023).
  36. PVsyst Website. Available online: https://www.pvsyst.com/ (accessed on 26 May 2023).
  37. Nordpool Day-Ahead Prices Website. Available online: https://www.nordpoolgroup.com/en/Market-data1/Dayahead/Area-Prices/ALL1/Hourly/?view=chart (accessed on 26 May 2023).
  38. Abdi, M.S. Residential Electricity Network Tariffs in Sweden—A Survey and Commentary; KTH Royal Institute of Technology: Stockholm, Sweden, 2020. [Google Scholar]
  39. Halvgaard, R.; Poulsen, N.; Madsen, H.; Jørgensen, J.; Marra, F.; Bondy, D.E.M. Electric vehicle charge planning using Economic Model Predictive Control. In Proceedings of the 2012 IEEE International Electric Vehicle Conference, IEVC 2012, Greenville, SC, USA, 4–8 March 2012. [Google Scholar] [CrossRef]
  40. Dcbel: Home Energy Station Website. Available online: https://www.dcbel.energy/uk/?lang=en (accessed on 19 June 2023).
  41. Tibber Website. Available online: https://tibber.com/en (accessed on 19 June 2023).
Figure 1. System architecture.
Energies 17 01963 g001
Figure 2. Energy threshold and SoC subregions as prescribed by the bidirectional charging protocol.
Energies 17 01963 g002
Figure 3. SH-based MILP optimization flowchart.
Energies 17 01963 g003
Figure 4. Forecasted time series for 30 h time window.
Energies 17 01963 g004
Figure 5. Simulation procedure flowchart.
Energies 17 01963 g005
Figure 6. Optimal charging schedule for a SoC evolution for 30 h time window.
Energies 17 01963 g006
Figure 7. Comparison of percentage variations with the added limitation in discharge for UC 3.
Energies 17 01963 g007
Figure 8. Comparative charging schedules for UC 1 and UC 2.
Energies 17 01963 g008
Figure 9. Normalized nondominated solution representations.
Energies 17 01963 g009
Figure 10. Operational cost and overproduced energy for 6 different weights ( β = 0.6, 0.7, 0.8, 0.9, 0.95, 1).
Energies 17 01963 g010
Figure 11. Comparative SoC trends and charging schedules for different fuse limits.
Energies 17 01963 g011
Table 1. UCs summary.
UCModeObjectiveFormulationSold Electricity PriceBidirectional Capability
1V2HCost minimizationSingle Obj-EV
2V2HSelf-consumptionMulti-Obj-EV
3V2GCost minimizationSingle ObjRetail priceEV + GRID
4V2GCost minimizationSingle ObjFITEV + GRID
Table 2. Correspondence between binary and continuous variables in optimization problem formulation.
Set f ( t ) x t i Use Cases
B p t E V , c h x t E V , c h All
p t E V , d h x t E V , d h All
G p t g r i d , b u y x t g r i d , b u y 3/4
p t g r i d , s e l l x t g r i d , s e l l 3/4
Table 3. Relevant numerical assumptions.
Relevant Parameters
S o c m i n [−]0.2 1 S o c V 2 X , m i n [−]0.25 1 S o c V 2 X , m a x [−]0.8 1
S o c m a x [−]0.97 1 C B ^ [€/kWh]100 2 C E V [KWh]69 4
P l i m , 1 [kW]11 P c h , m i n [kW]2.3 S o c V 2 X , m i n [−]0.8
η c h [−]0.97 η d h [−]0.97 Δ t [min]15 3
References: 1 [31]; 2 [2,32]; 3 [1,13,33]; 4 [34].
Table 4. Common input parameters for simulations.
Input Parameters
Time window [hours]30 P g r i d , m a x 11
Arrival SoC [−]0.35Departure SoC [−]0.7
Table 5. Percentage variation of relevant aggregated performance indicators with respect to dumb charging.
KPI Variation [%]UC 3UC 1Benchmark
Operational cost−205.3−89.98.7 €
Total grid power demand109.125.226.9 kWh
BESS energy throughput193.137.224.2 kWh
Table 6. Simulated current and resulting power limit.
Fuse Limits
Current Limit [A]Power Limit [kW]
1611
2013.8
2517.25
Disclaimer/Publisher’s Note: The statements, opinions and data contained in all publications are solely those of the individual author(s) and contributor(s) and not of MDPI and/or the editor(s). MDPI and/or the editor(s) disclaim responsibility for any injury to people or property resulting from any ideas, methods, instructions or products referred to in the content.

