

Mitigating Missing Rate and Early Cyberattack Discrimination Using Optimal Statistical Approach with Machine Learning Techniques in a Smart Grid

 ,
,  ,
,  ,
,  and
and
Abstract
:1. Introduction
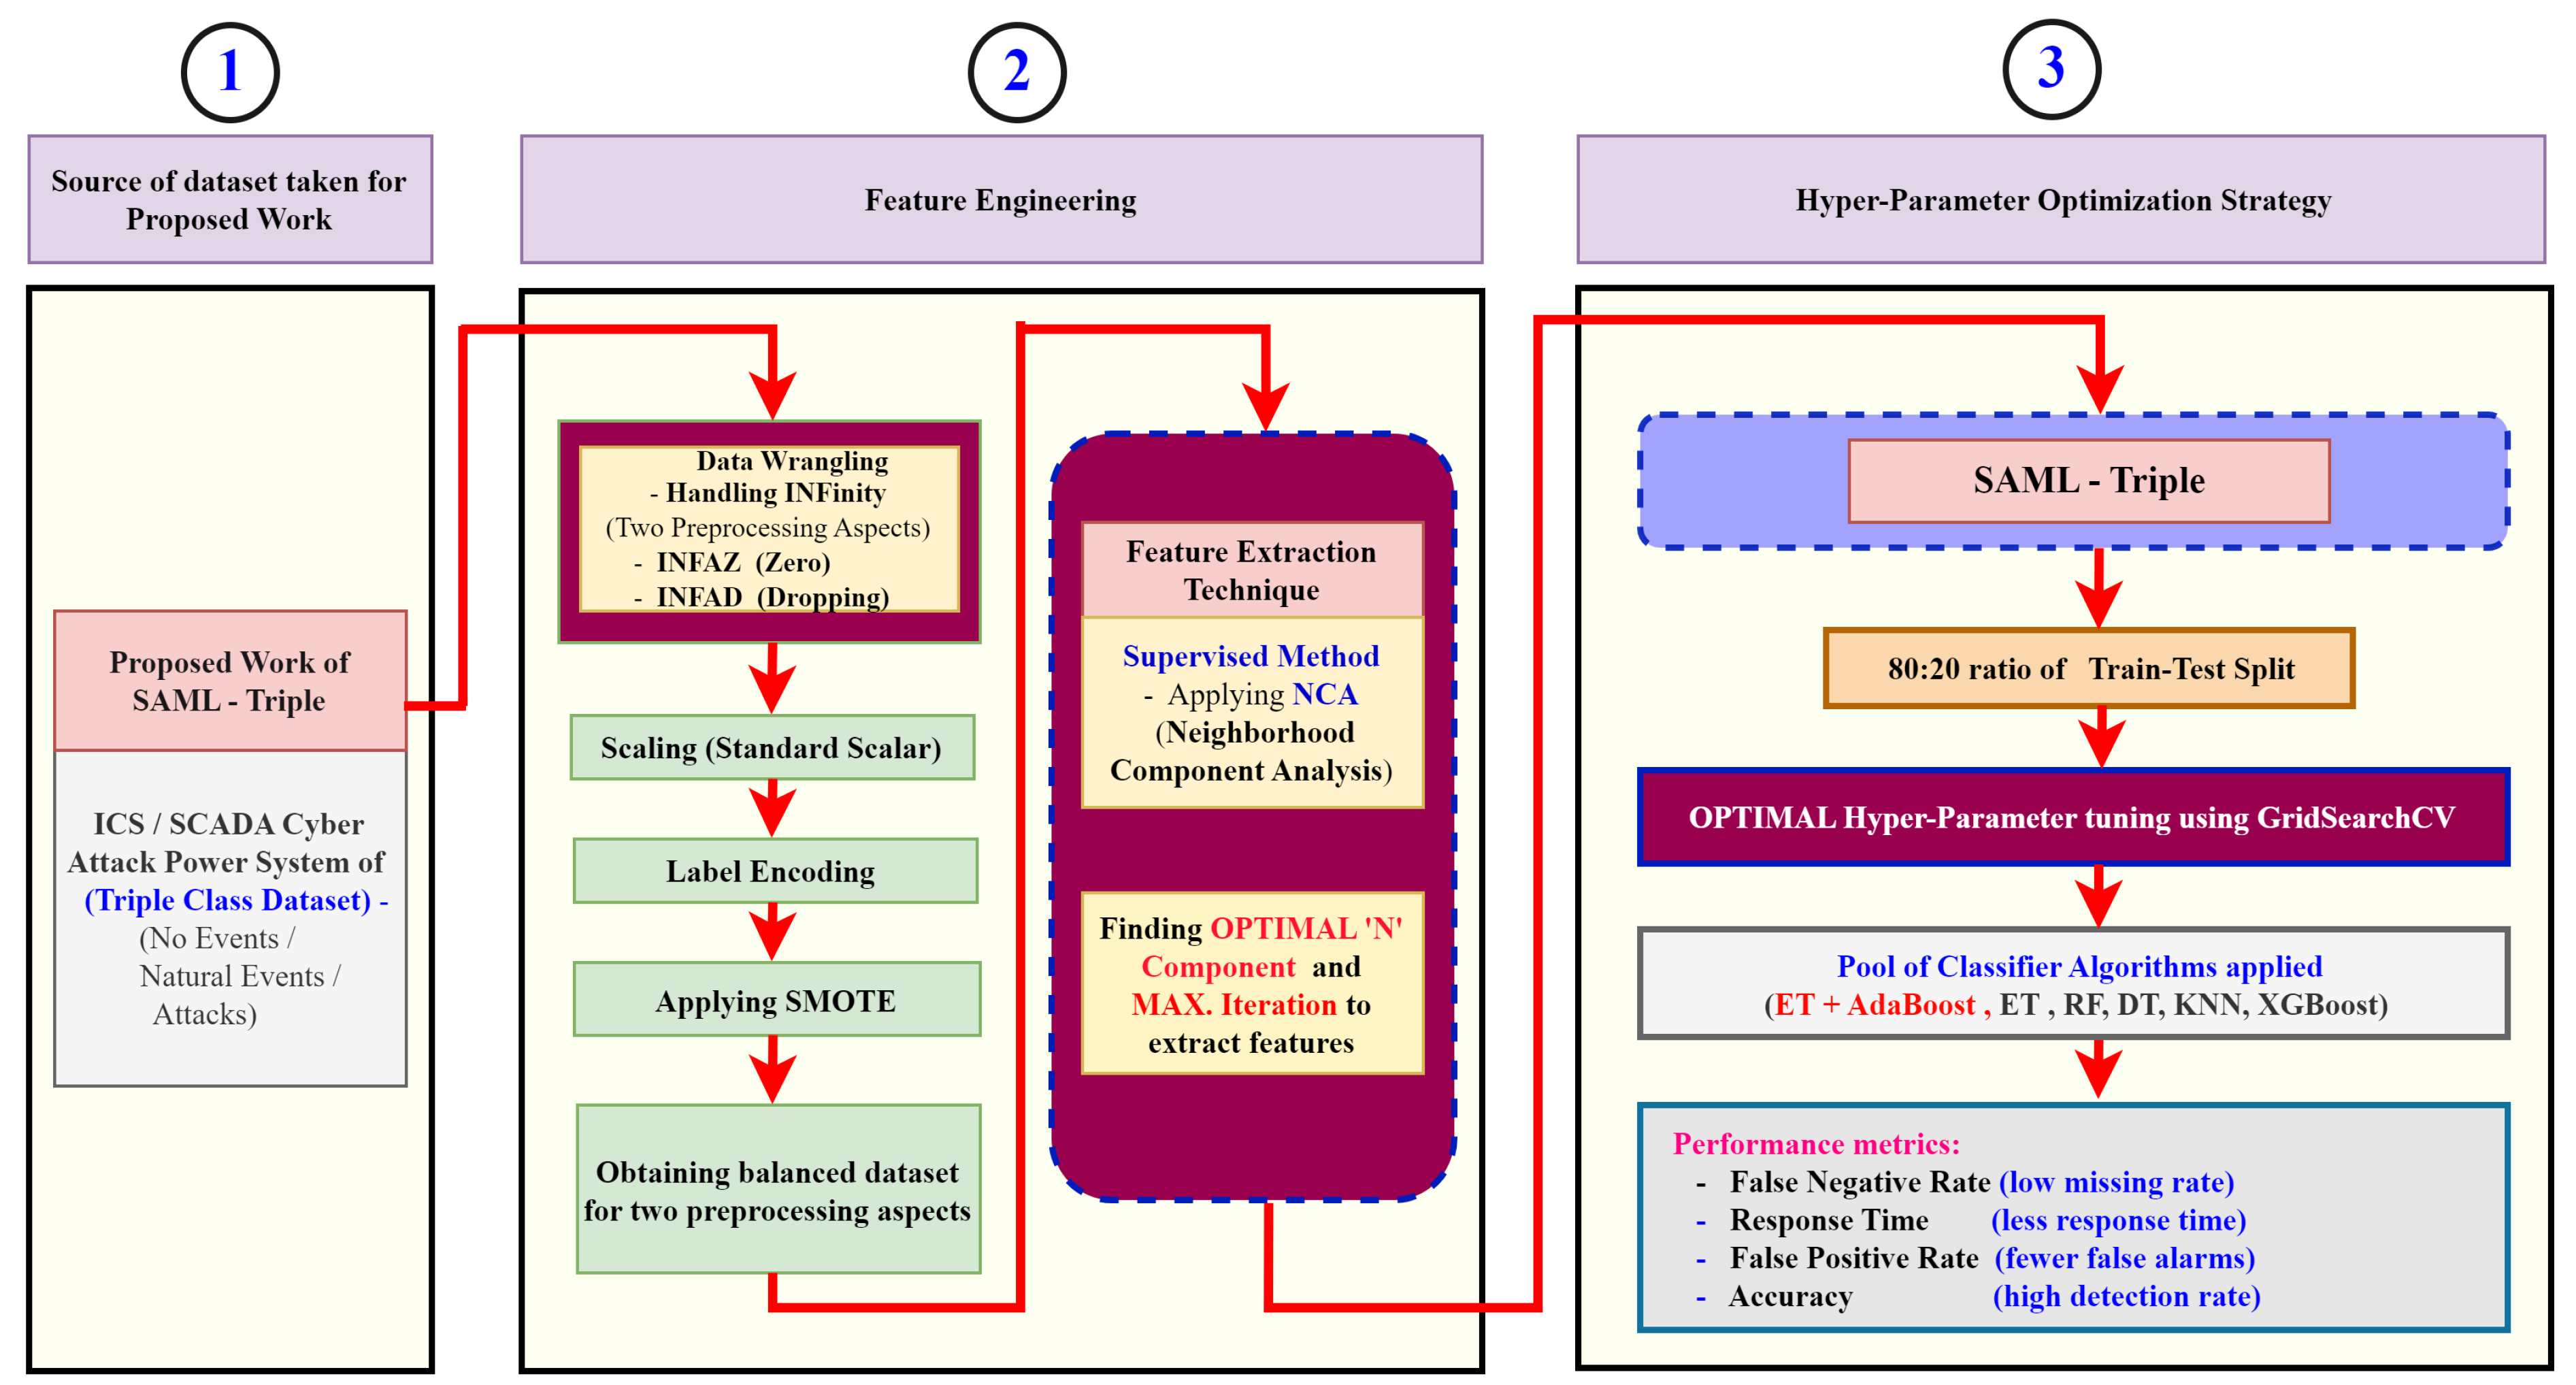
- The novel mechanism of a Statistical Approach with a Machine Learning (SAML) classifier based on Neighborhood Component Analysis (NCA), ExtraTrees, and AdaBoost for feature extraction, bagging, and boosting, respectively, is proposed with optimal hyperparameter tuning for the early discrimination of cyberattacks in a smart grid with the three-bus/two-line transmission system of triple-class datasets (No Events/Natural Events/Attack Events);
- The proposed model is evaluated for generalization and scalability with IEEE 14-bus and 57-bus system datasets of False Data Injection (FDI) attacks to prove the robustness;
- The missing rate is handled in this paper through INFinity Attack Records as Zero (INFAZ) to avoid blackouts and cascading failures and INFinity Attack Records by Dropping (INFAD) to improve the accuracy;
- The early response time is set to less than 8.3 ms on 120 samples/a second system to detect the attack before the system collapses.
2. Related Works
2.1. Drawbacks and Challenges of the Existing Approaches
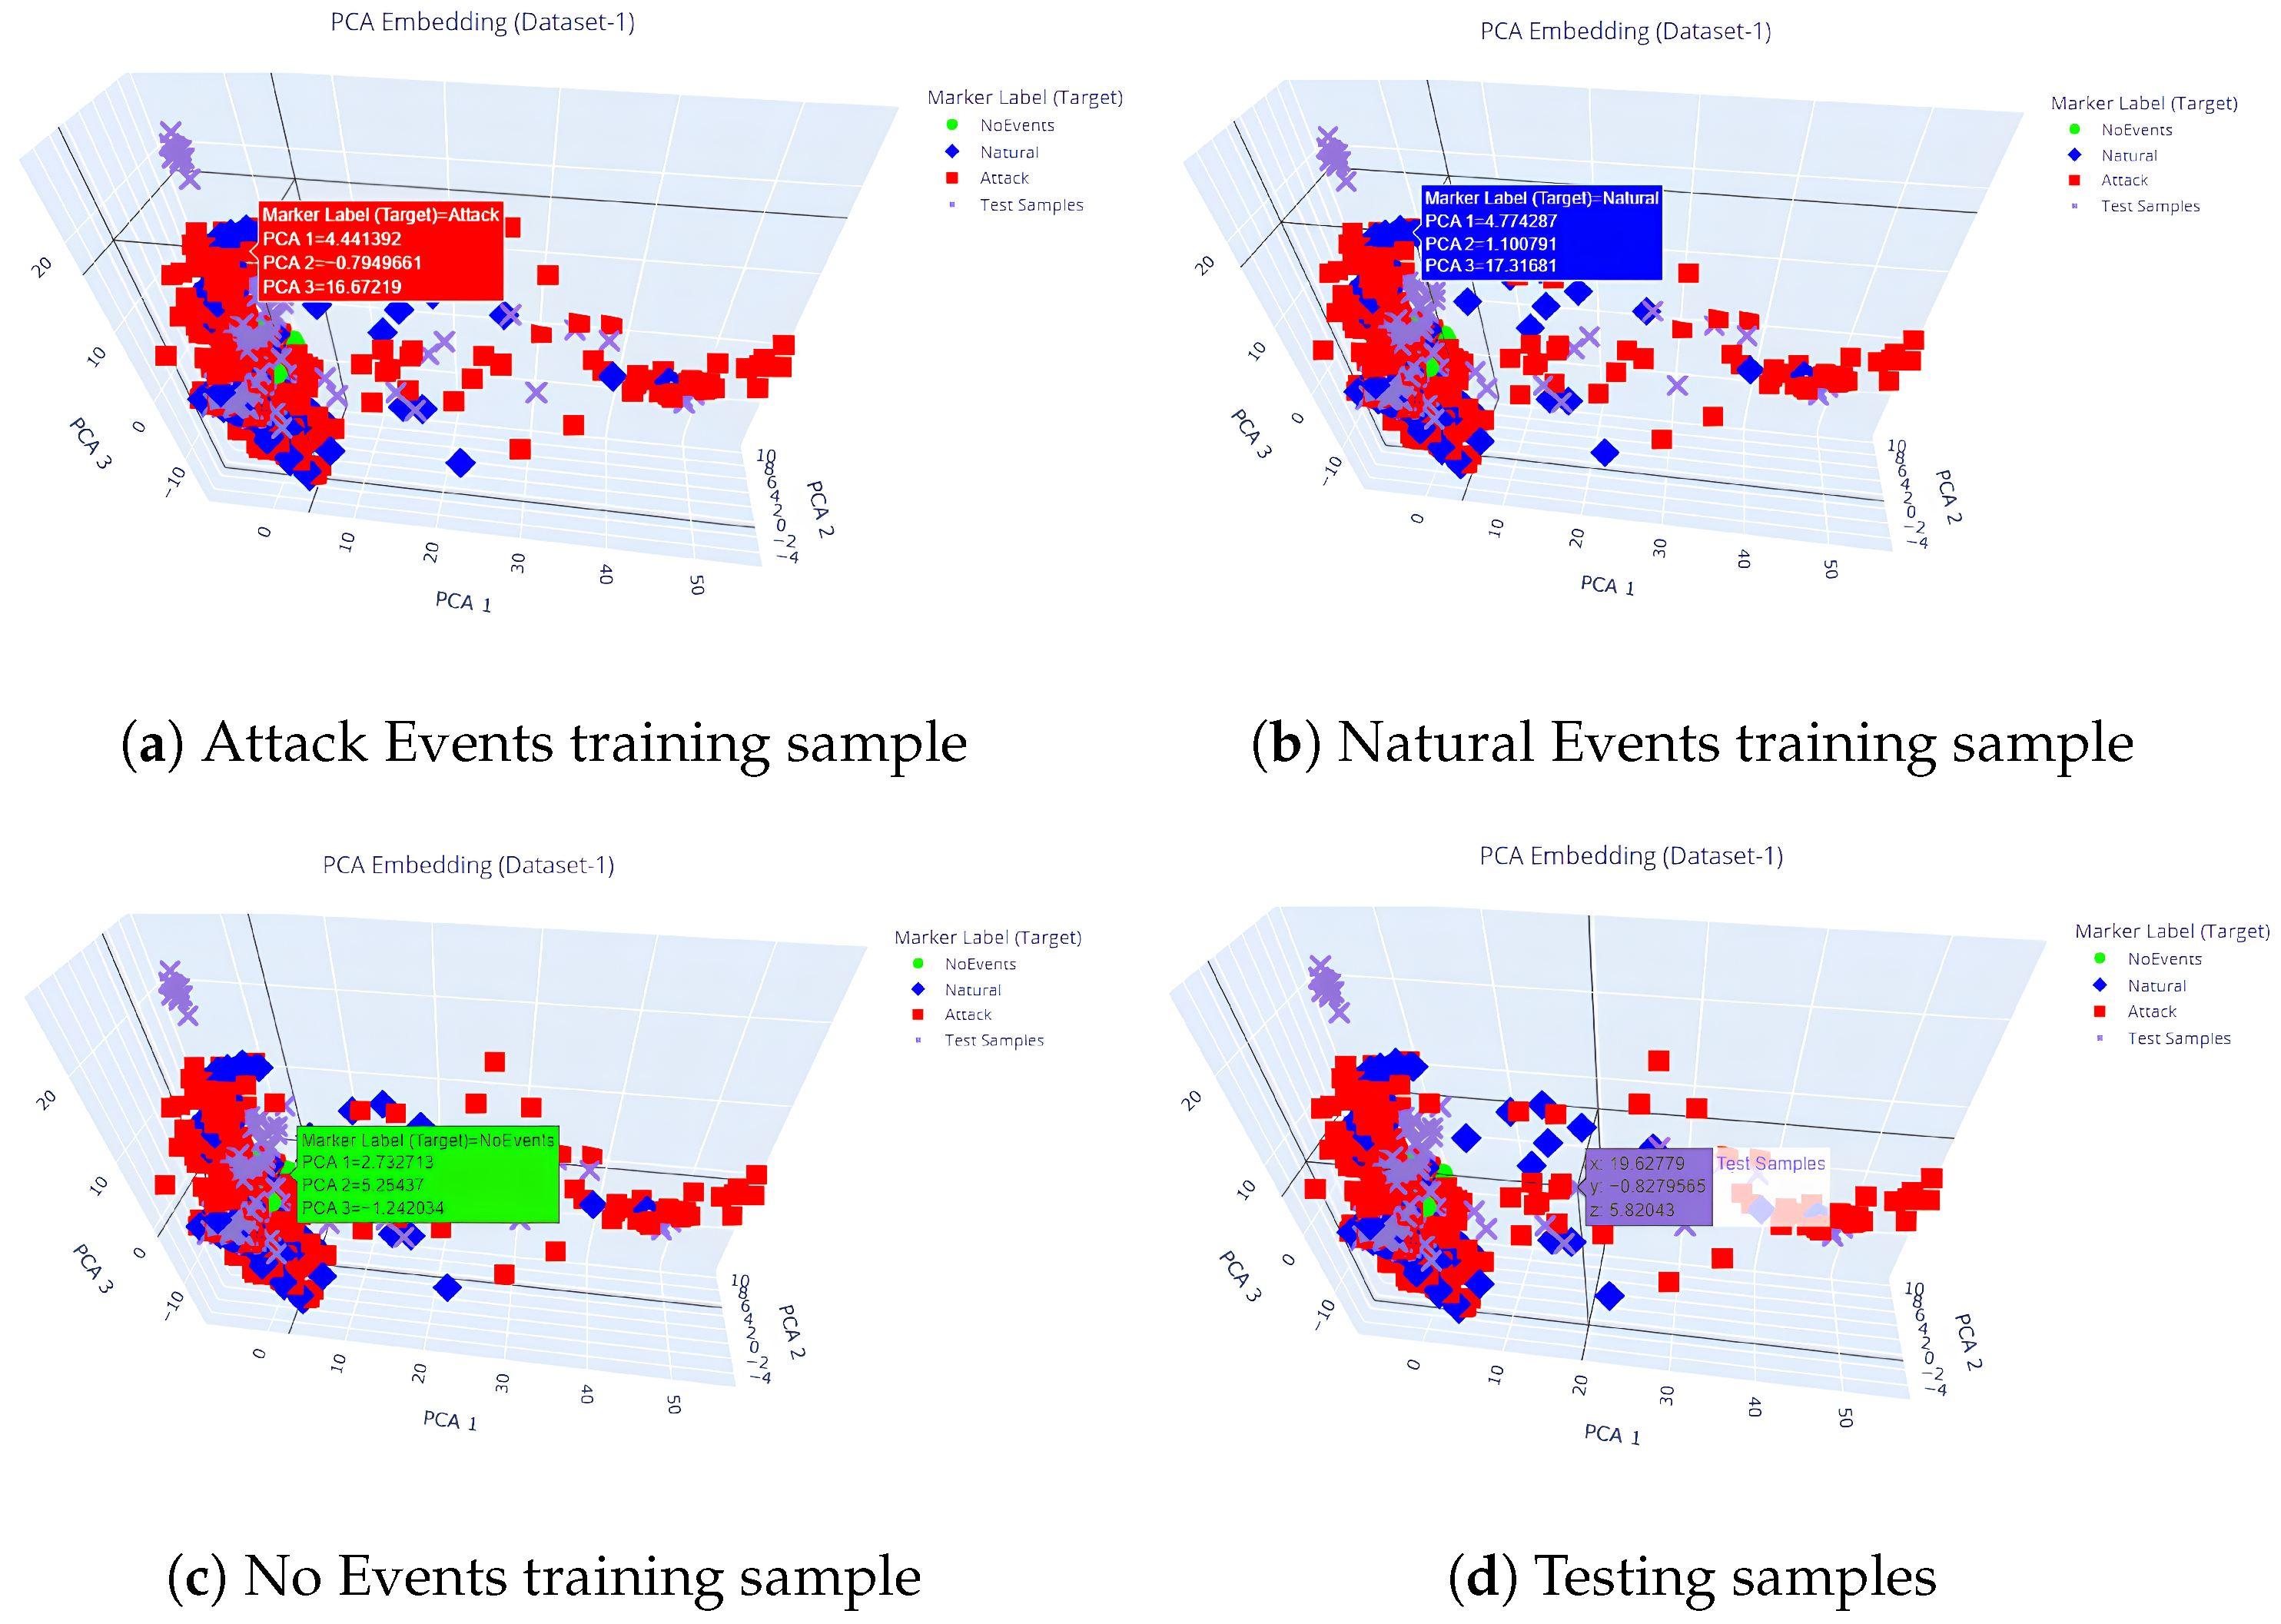
- The drawbacks and challenges faced by most of the researchers are that they tried to discriminate the No Events/Natural Events/Attack Events of triple-class datasets with different feature selection numbers varying from eight to sixty features with their adopted feature selection techniques [22,23,26,28,29,31] to improve the detection accuracy. The feature importance scores obtained from the suboptimal feature selection of the existing methods indicate poor choices of features, leading to potential bias in feature selection and a lack of model performance when discriminating against attacks. The authors [24,25,27] used Autoencoders as dimensionality reduction techniques of feature extraction to reduce the features using unsupervised techniques. The feature extraction using deep learning methods lacks the optimal combination of extracting the features due to several hyperparameter factors. Moreover, dimensionality reduction techniques (feature extraction) using PCA [27] fail to capture the local structure or relationships within the data, which might result in misclassification between the three classes.
- The other major drawback is that dropping the feature column of “PA: Z” (Apparent Impedance for Four Relays) or removing the “INFinity” Attack Events records rows seems to be quite contradictory as those researchers attempted to avoid the attack scenarios, which might lead to increases in the missing rate or false negative rate. If left unprocessed, it may have a massive impact on the SCADA systems, making them inoperable. It might result in fatal consequences regarding the power system’s stability and reliability. We have addressed this problem in our proposed SAML-Triple approach by considering it zero (INFAZ).
2.2. Research Gap Identified
2.3. Addressing the Challenges through the Proposed Approach
- To avoid ambiguity regarding the different number of feature selections, we utilized the NCA as a supervised feature extraction method for dimensionality reduction. This method does not rely on feature importance scores; instead, it converts high-dimensional data into lower-dimensional data in a new transformation space suitable for complex and highly correlated data. It preserves both the global and the local neighborhood structure relationship between the data records in the dataset. The proposed SAML-Triple adopts NCA as a feature extraction technique by optimal parameter/hyperparameter tuning with the (ET + AdB) ML classifier in discriminating cyberattacks from natural faults and man-made events.
- We addressed the “INFinity” Attack Events records in the feature column of “PA:Z” (Apparent Impedance for Four Relays) by replacing them with “Zero” (INFAZ). In the context of the power domain, the “PA:Z” – INFinity value can be processed either as “Zero” or the range of value above its limit to avoid the missing rate [21]. Here, two preprocessing aspects of INFAZ (Zero) and INFAD (Dropping) in the SAML-Triple work were performed to compare the results with those of other existing works.
3. Proposed Approach
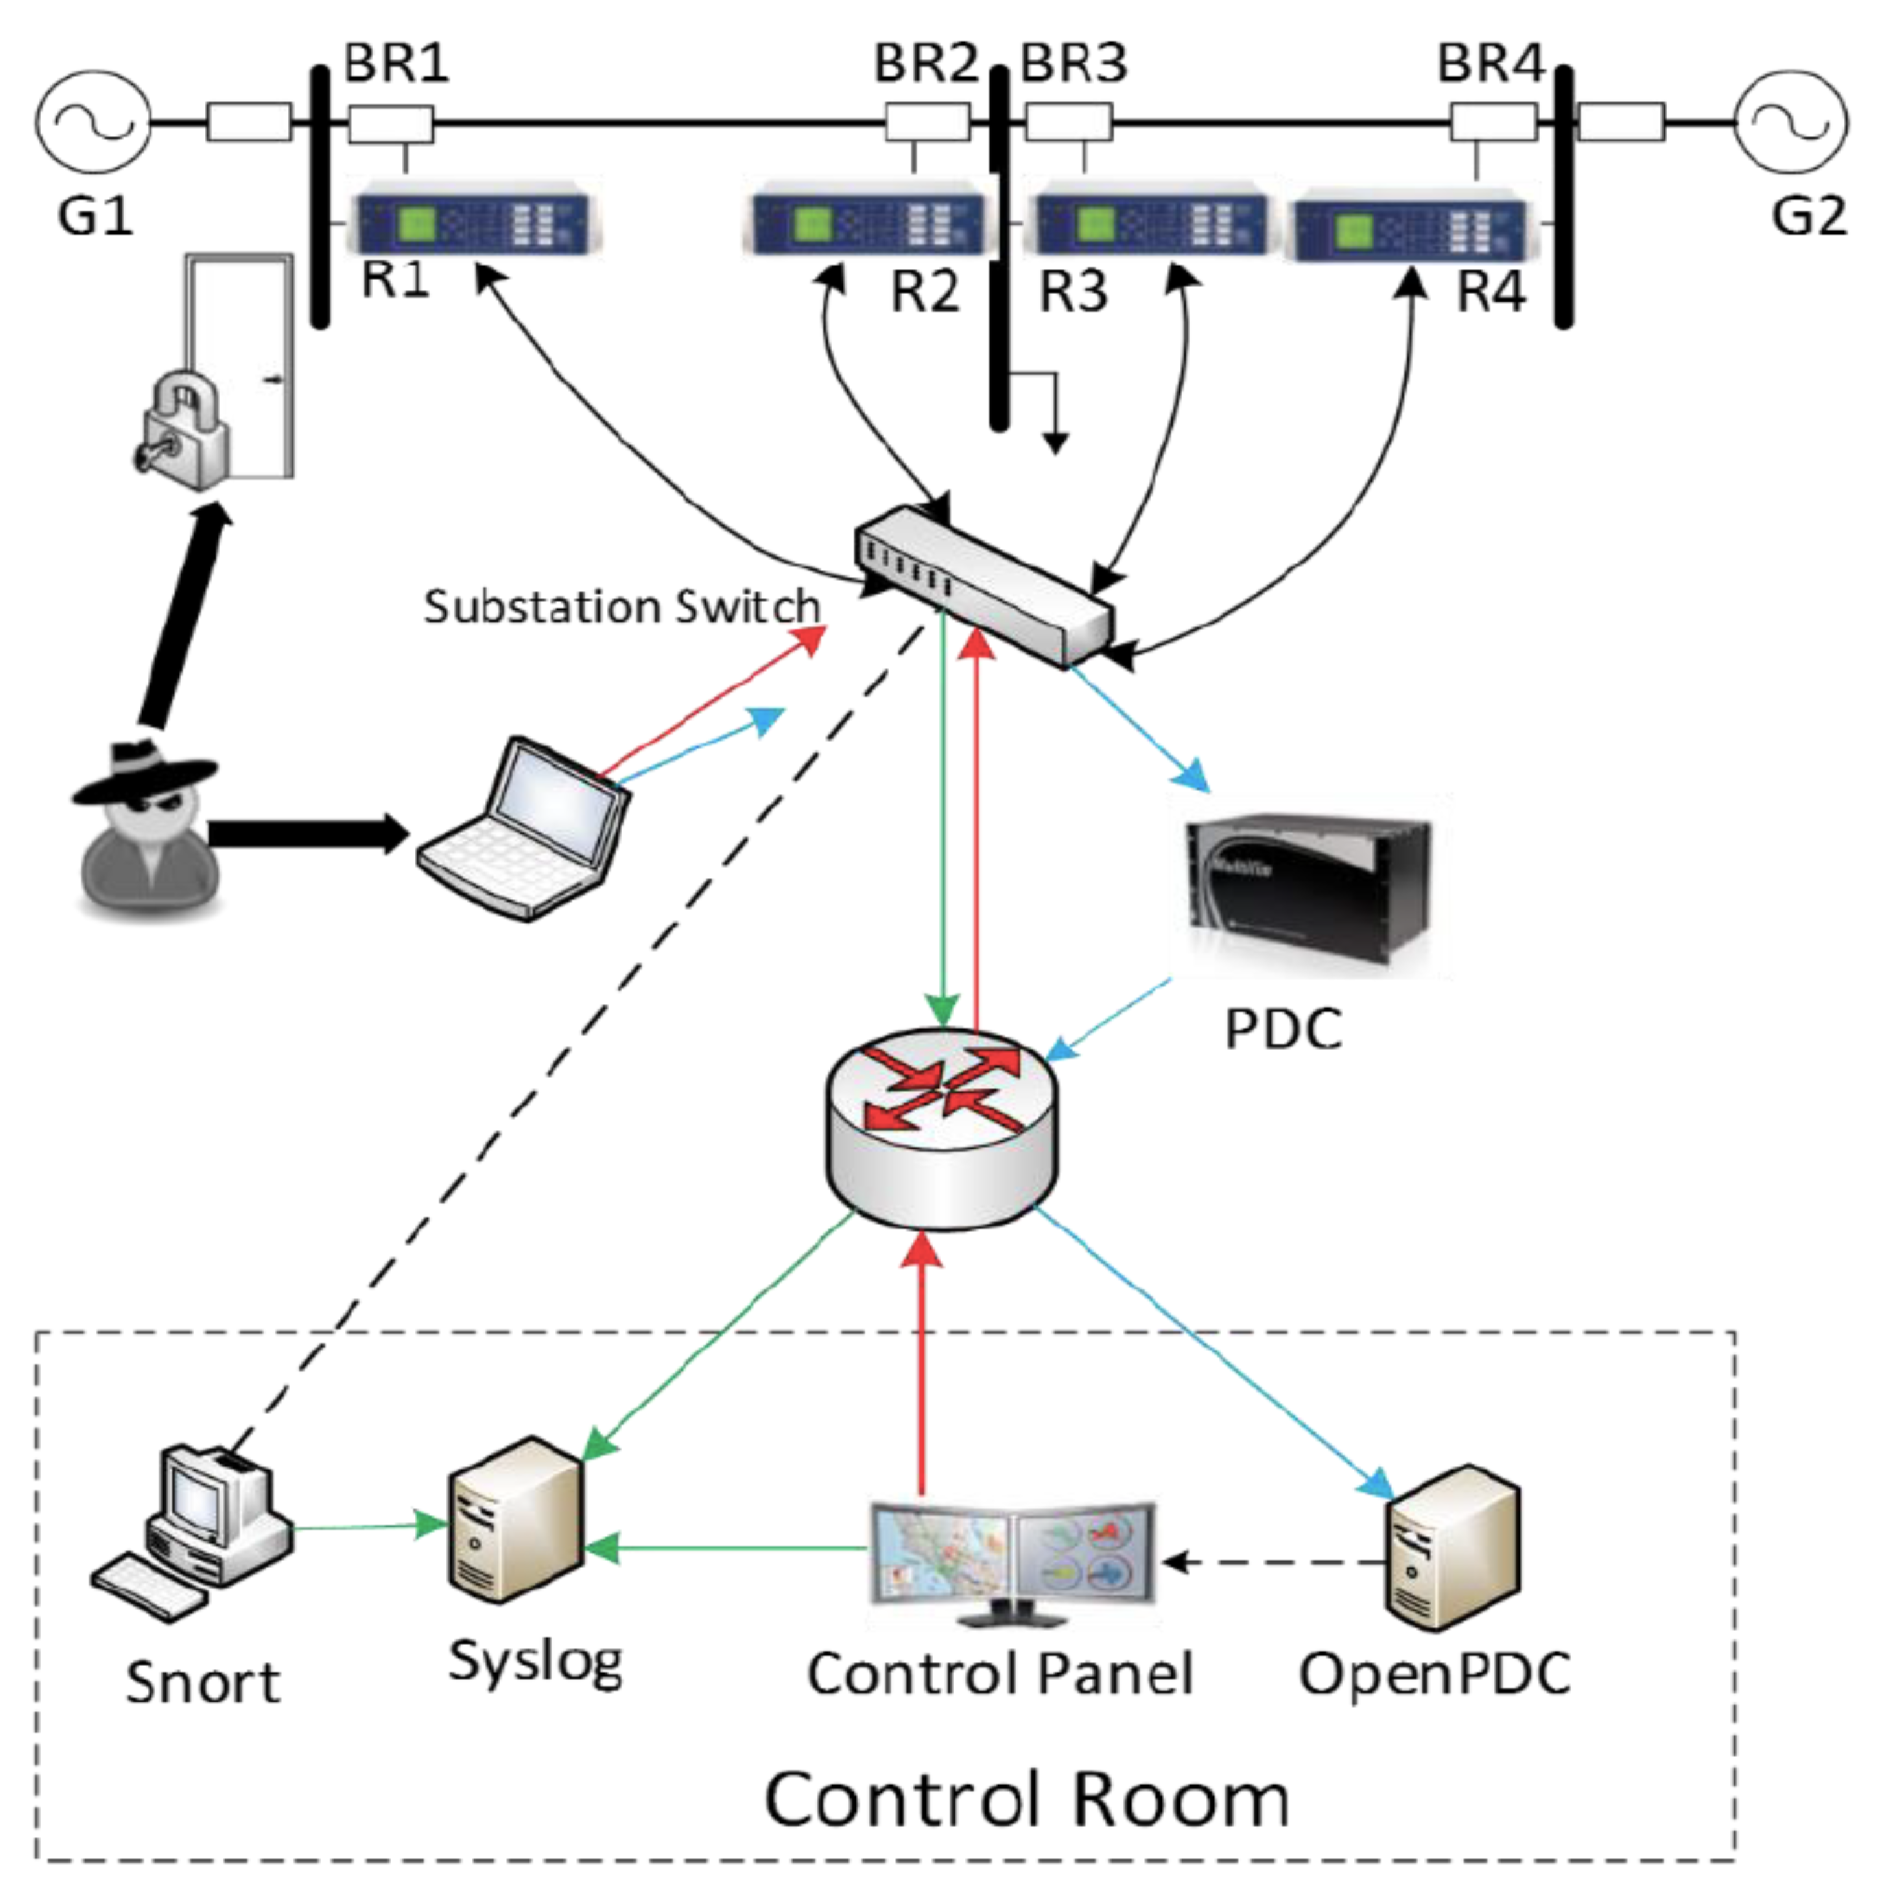
3.1. Industrial Control Systems (ICS) Cyber Attack Power System Dataset Testbed Description
- No Events—stands for the normal system operation with changes in loads.
- Natural Events—stands for the system with Single Line-to-Ground (SLG) with various percentages of fault location in L1 and L2 with the addition of Line Maintenance (L1 and L2).
- Attack Events—stands for the data injection attack (SLG fault replay), remote tripping command injection attack, and relay setting change attack with various percentages of fault location.

| Feature | Description |
|---|---|
| PA1:VH – PA3:VH | Phase A – C Voltage Phase Angle |
| PM1:V – PM3:V | Phase A – C Voltage Phase Magnitude |
| PA4:IH – PA6:IH | Phase A – C Current Phase Angle |
| PM4:I – PM6:I | Phase A – C Current Phase Magnitude |
| PA7:VH – PA9:VH | Pos. – Neg. – Zero Voltage Phase Angle |
| PM7:V – PM9:V | Pos. – Neg. – Zero Voltage Phase Magnitude |
| PA10:IH – PA12:IH | Pos. – Neg. – Zero Current Phase Agle |
| PM10:I – PM12:V | Pos. – Neg. – Zero Current Phase Magnitude |
| F | Frequency for relays |
| DF | Frequency Delta (df/dt) for relays |
| PA:Z | Apparent Impedance for relays |
| PA:ZH | Apparent Impedance Angle for relays |
| S | Status Flag for relays |
| Control Panel Log | Control Panel for Remote Tripe Status |
| Relay Log | Relay Status (R1 – R4) |
| Snort Log | Snort Alert Status (R1 – R4) |
| Marker | Target Column with Label (Triple Class) |
| Dataset Used | 3-Bus/2-Line Transmission System [34] | ||
|---|---|---|---|
| Types of Scenarios | Multiclass Labels | Binary Class | Triple Class |
| Normal Operation | 41 | Normal | No Events |
| Single Line-to-Ground Fault | 1 to 6 | Natural Events | |
| Line Maintenance | 13, 14 | ||
| False Data Injection Attack | 7 to 12 | Attack | Attack Events |
| Remote Tripping | 15 to 20 | ||
| Command Injection Attack | |||
| Relay Setting | 21 to 30, | ||
| Change Attack | 35 to 40 | ||
3.2. Various Types of Operational Scenarios
- SLG or Short-circuit fault. A short circuit in the power line can occur anywhere along the line; the percentage range specifies the fault location.
- Line maintenance. This event category is performed when one or more relays are disabled on a specific line so maintenance can be completed for that line.
- FDI Attack. Here, the intruder imitates a valid fault by changing values of parameters such as current, voltage, sequence components, etc. The intruders mimic the valid SLG fault by synchronizing with the phasor measurements, followed by sending an illicit trip command to relays at the ends of the transmission line. This attack involves altering the parameters of current, voltage, phase angles, sequence components, and so on to blind the operator without raising the alarm and inducing a blackout. This attack imposes a physical or large-scale load loss and substantial economic loss. Similar to SLG faults, faults can occur at any location in the transmission line with various percentage ranges (10–19%, 20–79%, and 80–90%).
- Remote tripping command Injection attack. This attack type arises when an intruder’s system on the communications network sends unauthorized relay trip commands to relays at the terminals of a transmission line. The command injection attacks are performed against a single relay (R1 to R4) or two relays (R1 and R2 or R3 and R4).
- Relay setting change attack. The intruders alter the relay settings in a distance protection scheme to cause a malfunction in the relay operation. This type of attack fails to recognize valid faults or commands. The faults can occur in any location on the transmission line with R1/R2/R3/R4 disabled and faults.
4. Methodology
4.1. Comparison of Feature Extraction Techniques
- Both NCA and PCA are linearly transformed to lower dimensionality.
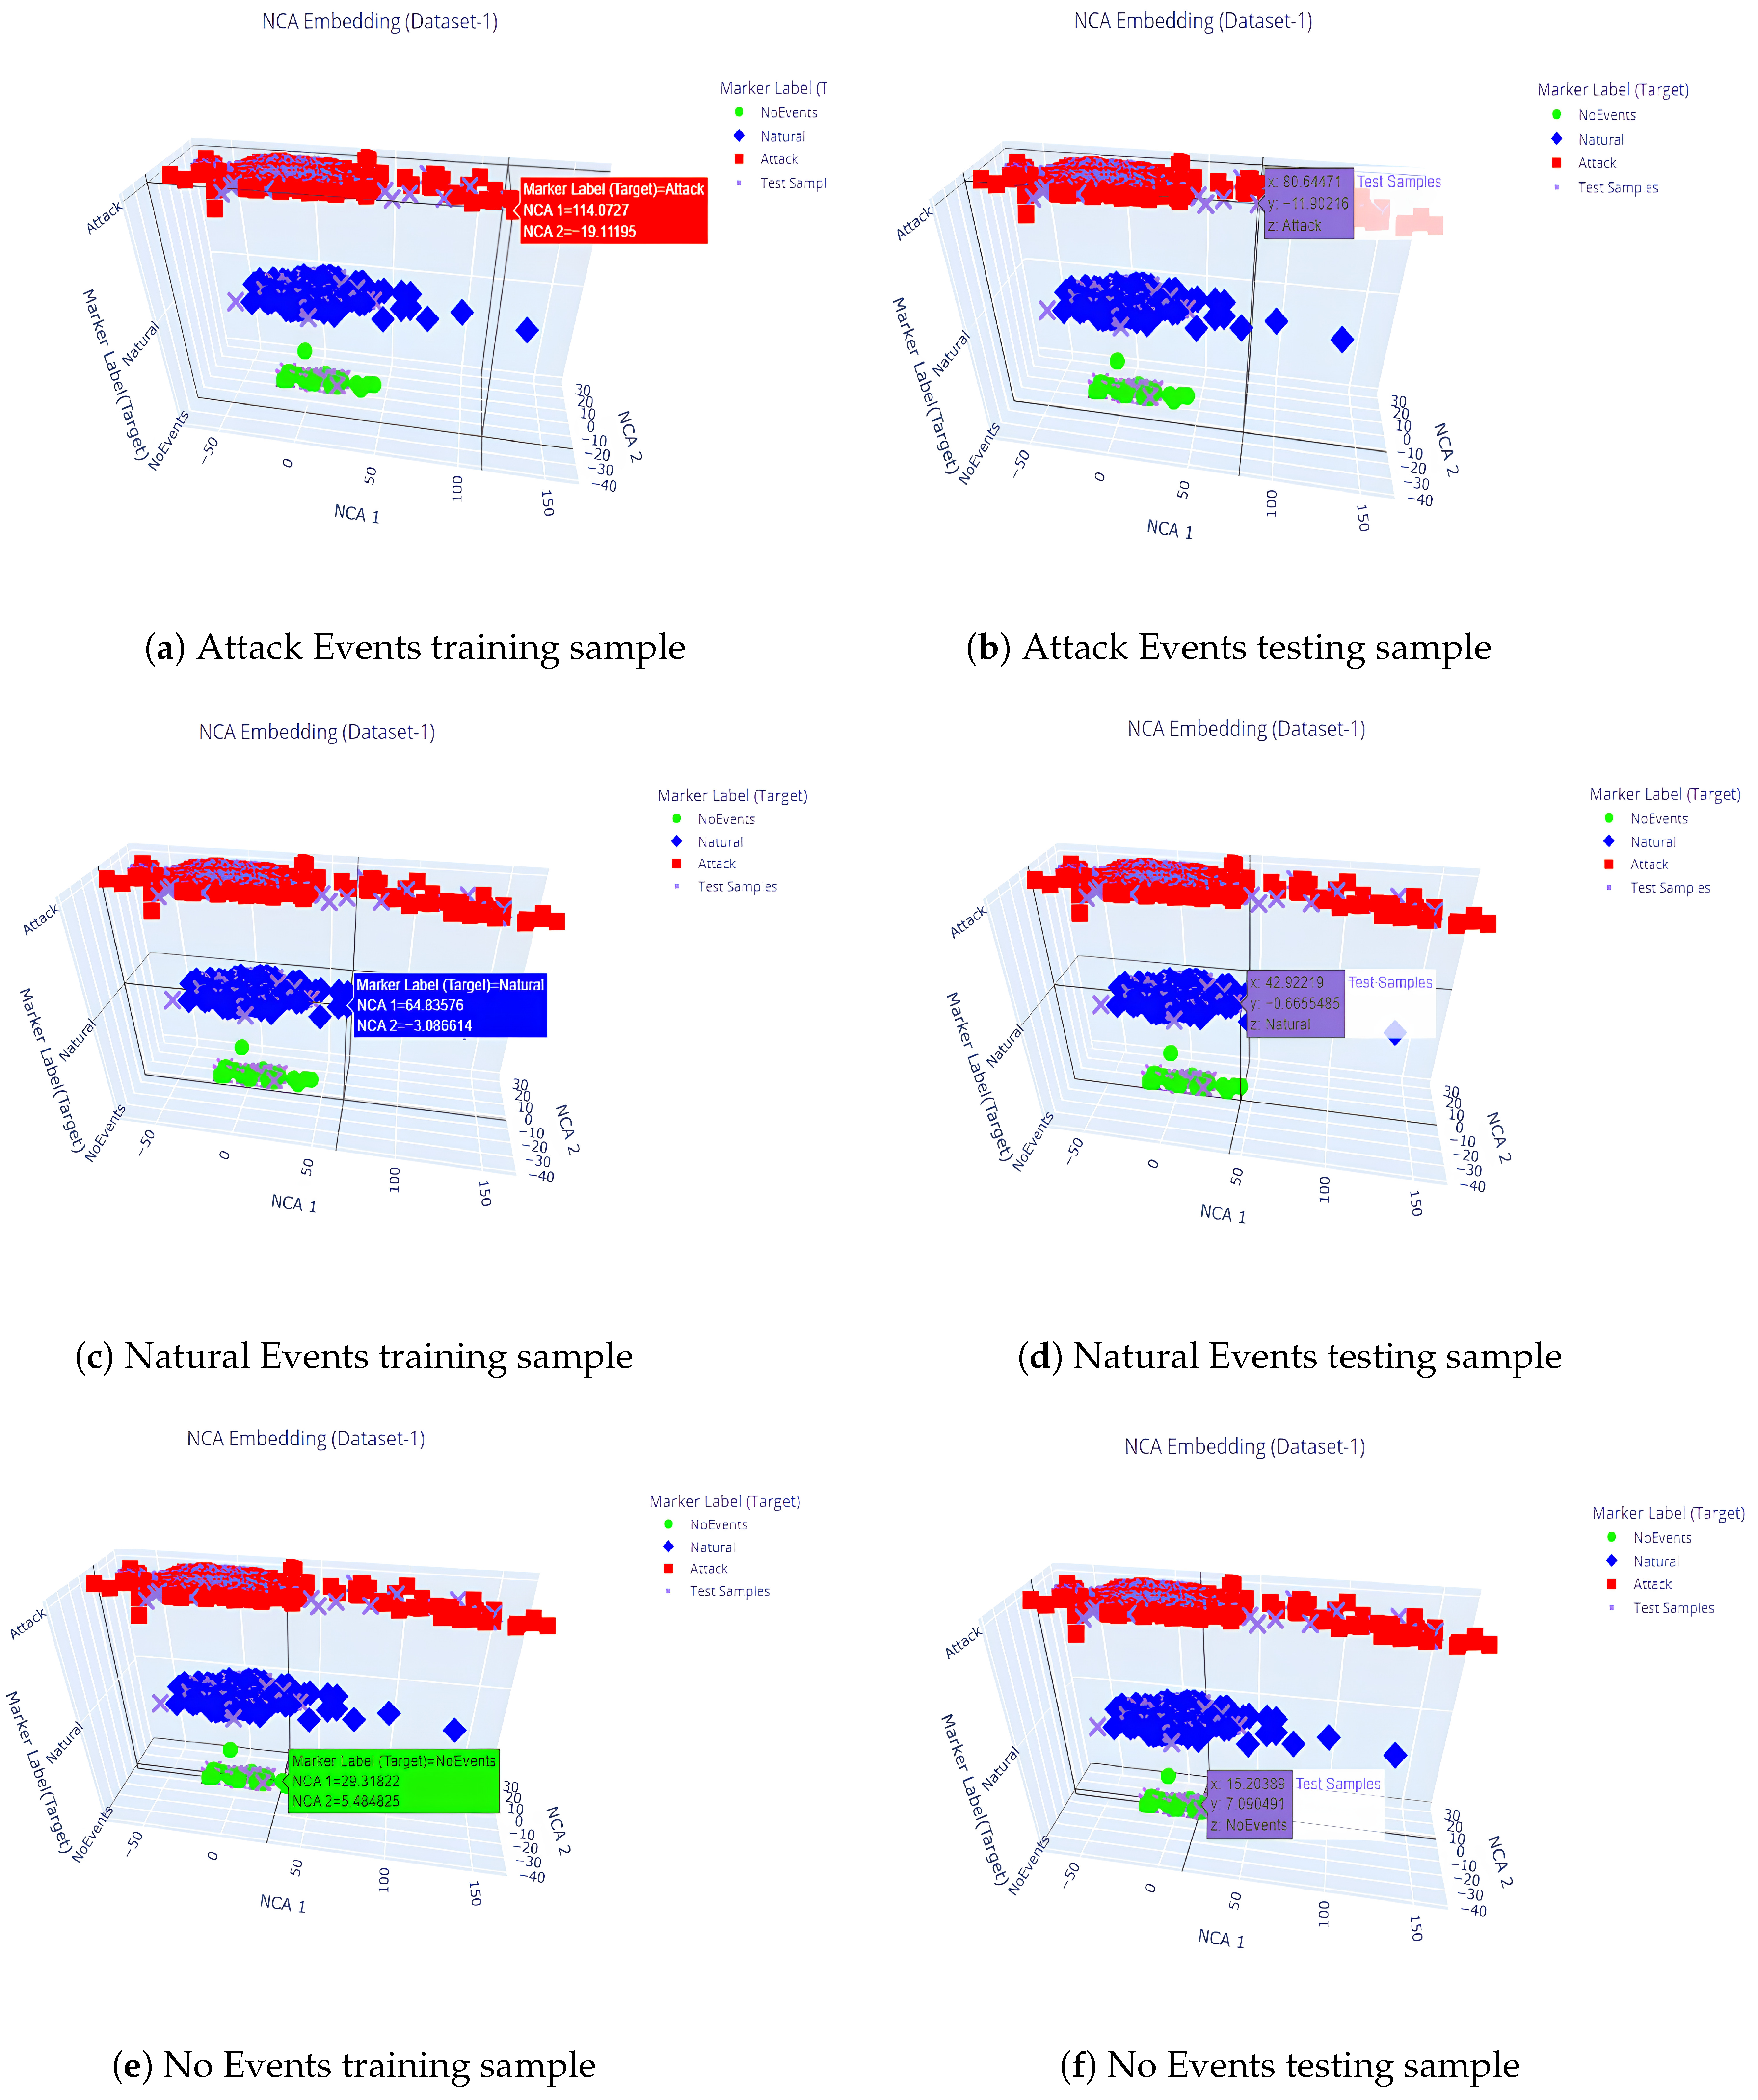
- NCA [37] (Supervised Learning) of the statistical approach is a feature extraction technique that employs a method similar to k-Nearest Neighbor in which the neighborhoods of records with the same labels are packed together more densely than those with different labels.
- PCA [27] (Unsupervised Learning) of the statistical approach is a feature extraction technique that projects the matrix into a linear space of lower dimensionality. It transforms a set of correlated variables into a new set of uncorrelated variables called principal components. These principal components are sorted in descending order of variance, capturing the maximum amount of information from the original data in the first few components.
- NCA takes this further by clustering data based on the matrix’s dimensionality reduction results with the label.
- Overall, NCA aims to optimize the selection of local neighborhood relationships for maximum classification accuracy, whereas PCA focuses on capturing global variance without optimization.
4.2. Neighborhood Components Analysis in the Context of Power Domain
- represents the gradient of the objective function with respect to the elements of the transformation matrix ‘A’.
- n is the total number of samples.
- is the probability associated with sample i.
- is the probability that sample i belongs to class k.
- represents the feature vector of sample i.
- is the j-th element of the feature vector of sample i.
- is the class label of sample i.
- y represents the output of the transformation .
4.3. Comparison of Computation Complexity
4.4. Proposed Algorithm-SAML
| Algorithm 1 Pseudocode for Data Preprocessing and NCA Transformation |
|
| Algorithm 2 Pseudocode for Optimal Hyperparameter tuning to find the ‘N’Component and Iteration ‘I’ of NCA with the best parameters for each () classifier applied |
|
5. Implementation Details
Tools for Implementation and Evaluation Metrics
6. Results Analysis and Discussion
6.1. SAML-Triple: Triple-Class Datasets (No Events/Natural Events/Attack Events)—Test Results
6.2. SAML-Triple: Generalization and Scalability for IEEE ’N’ Bus System
6.3. Overall Summary of the Proposed Work
7. Conclusions and Future Works
Author Contributions
Funding
Data Availability Statement
Acknowledgments
Conflicts of Interest
Abbreviations
| SAML | Statistical Approach with Machine Learning |
| NCA | Neighborhood Components Analysis |
| PCA | Principal Component Analysis |
| INFAZ | INFinity—Attack Events Records as Zero |
| INFAD | INFinity—Attack Events Records by Dropping |
| SMOTE | Synthetic Minority Oversampling Technique |
| ET + AdB | ExtraTrees with AdaBoost classifier |
| FNR | False Negative Rate |
| FPR | False Positive Rate |
| SCADA | Supervisory Control and Data Acquisition |
| PMU | Phasor Measurement Unit |
| WAMS | Wide Area Measurement Systems |
| CPPS | Cyber–Physical Power Systems |
| ICS | Industrial Control Systems |
| SLG | Single Line-to-Ground Fault |
| IDS | Intrusion Detection System |
| FDI | False Data Injection Attack |
References
- Yohanandhan, R.V.; Elavarasan, R.M.; Manoharan, P.; Mihet-Popa, L. Cyber-Physical Power System (CPPS): A Review on Modeling, Simulation, and Analysis with Cyber Security Applications. IEEE Access 2020, 8, 151019–151064. [Google Scholar] [CrossRef]
- Gunduz, M.Z.; Das, R. Cyber-Security on Smart Grid: Threats and Potential Solutions. Comput. Netw. 2020, 169, 107094. [Google Scholar] [CrossRef]
- Kimani, K.; Oduol, V.; Langat, K. Cyber Security Challenges for IoT-Based Smart Grid Networks. Int. J. Crit. Infrastruct. Prot. 2019, 25, 36–49. [Google Scholar] [CrossRef]
- Hemsley, K.E.; Fisher, E. History of Industrial Control System Cyber Incidents. 2018. Available online: https://www.osti.gov/biblio/1505628/ (accessed on 10 February 2023).
- Gupta, P.K.; Narayanan Babu, S.S.; Mohandas Sheeladevi, A.; Pampana, V. Why Dealing with Electrical Faults for Smart Microgrid is not Enough? In Proceedings of the Science and Technologies for Smart Cities, Virtual, 2–4 December 2021; pp. 55–74. [Google Scholar]
- Zhang, C.; Lu, Z.; Zhu, Z.; Shi, Z.; Xu, X.; Yan, Z. Demonstration Project and State Estimation Application in PMU-Based Distribution Network. In Proceedings of the 2020 IEEE 4th Conference on Energy Internet and Energy System Integration (EI2), Wuhan, China, 30 October–1 November 2020; pp. 1000–1004. [Google Scholar]
- Zhang, J.E.; Wu, D.; Boulet, B. Time Series Anomaly Detection for Smart Grids: A Survey. In Proceedings of the 2021 IEEE Electrical Power and Energy Conference (EPEC), Toronto, ON, Canada, 22–31 October 2021; pp. 125–130. [Google Scholar]
- Capgemini Worldwide. Reinventing Cybersecurity with Artificial Intelligence: The New Frontier in Digital Security. 2020. Available online: https://www.capgemini.com/wp-content/uploads/2019/07/AI-in-Cybersecurity_Report_20190711_V06.pdf (accessed on 10 February 2023).
- Chawla, A.; Panigrahi, B.K.; Bhalja, B.R. Deep-Learning-Based Denial-of-Service Resilient Framework for Wide Area Situational Awareness of Power Systems. IEEE Trans. Ind. Inform. 2023, 19, 9204–9216. [Google Scholar] [CrossRef]
- Singh, V.K.; Govindarasu, M. A Cyber-Physical Anomaly Detection for Wide-Area Protection Using Machine Learning. IEEE Trans. Smart Grid 2021, 12, 3514–3526. [Google Scholar] [CrossRef]
- Amin, B.M.R.; Hossain, M.J.; Anwar, A.; Zaman, S. Cyber Attacks and Faults Discrimination in Intelligent Electronic Device-Based Energy Management Systems. Electronics 2021, 10, 650. [Google Scholar] [CrossRef]
- Kumar, A.; Saxena, N.; Jung, S.; Choi, B.J. Improving Detection of False Data Injection Attacks Using Machine Learning with Feature Selection and Oversampling. Energies 2021, 15, 212. [Google Scholar] [CrossRef]
- Sakhnini, J.; Karimipour, H.; Dehghantanha, A. Smart Grid Cyber Attacks Detection Using Supervised Learning and Heuristic Feature Selection. In Proceedings of the 2019 IEEE 7th International Conference on Smart Energy Grid Engineering (SEGE), Oshawa, ON, Canada, 12–14 August 2019; pp. 108–112. [Google Scholar]
- Faramondi, L.; Flammini, F.; Guarino, S.; Setola, R. Evaluating Machine Learning Approaches for Cyber and Physical Anomalies in SCADA Systems. In Proceedings of the 2023 IEEE International Conference on Cyber Security and Resilience (CSR), Venice, Italy, 31 July–2 August 2023; pp. 412–417. [Google Scholar]
- Li, X.J.; Ma, M.; Sun, Y. An Adaptive Deep Learning Neural Network Model to Enhance Machine-Learning-Based Classifiers for Intrusion Detection in Smart Grids. Algorithms 2023, 16, 288. [Google Scholar] [CrossRef]
- AlHaddad, U.; Basuhail, A.; Khemakhem, M.; Eassa, F.E.; Jambi, K. Ensemble Model Based on Hybrid Deep Learning for Intrusion Detection in Smart Grid Networks. Sensors 2023, 23, 7464. [Google Scholar] [CrossRef]
- Unsal, D.B.; Ustun, T.S.; Hussain, S.M.S.; Onen, A. Enhancing Cybersecurity in Smart Grids: False Data Injection and Its Mitigation. Energies 2021, 14, 2657. [Google Scholar] [CrossRef]
- Radoglou-Grammatikis, P.I.; Sarigiannidis, P.G. Securing the Smart Grid: A Comprehensive Compilation of Intrusion Detection and Prevention Systems. IEEE Access 2019, 7, 46595–46620. [Google Scholar] [CrossRef]
- Ozkan-Okay, M.; Samet, R.; Aslan, O.; Gupta, D. A Comprehensive Systematic Literature Review on Intrusion Detection Systems. IEEE Access 2021, 9, 157727–157760. [Google Scholar] [CrossRef]
- Pan, S.; Morris, T.; Adhikari, U. Developing a Hybrid Intrusion Detection System Using Data Mining for Power Systems. IEEE Trans. Smart Grid 2015, 6, 3104–3113. [Google Scholar] [CrossRef]
- Chawla, A.; Singh, A.; Agrawal, P.; Panigrahi, B.K.; Bhalja, B.R.; Paul, K. Denial-of-Service Attacks Pre-Emptive and Detection Framework for Synchrophasor Based Wide Area Protection Applications. IEEE Syst. J. 2022, 16, 1570–1581. [Google Scholar] [CrossRef]
- Upadhyay, D.; Manero, J.; Zaman, M.; Sampalli, S. Gradient Boosting Feature Selection with Machine Learning Classifiers for Intrusion Detection on Power Grids. IEEE Trans. Netw. Serv. Manag. 2021, 18, 1104–1116. [Google Scholar] [CrossRef]
- Upadhyay, D.; Manero, J.; Zaman, M.; Sampalli, S. Intrusion Detection in SCADA Based Power Grids: Recursive Feature Elimination Model with Majority Vote Ensemble Algorithm. IEEE Trans. Netw. Sci. Eng. 2021, 8, 2559–2574. [Google Scholar] [CrossRef]
- Hu, C.; Yan, J.; Wang, C. Robust Feature Extraction and Ensemble Classification Against Cyber-Physical Attacks in the Smart Grid. In Proceedings of the 2019 IEEE Electrical Power and Energy Conference (EPEC), Montreal, QC, Canada, 16–18 October 2019; pp. 1–6. [Google Scholar]
- Hu, C.; Yan, J.; Liu, X. Adaptive Feature Boosting of Multi-Sourced Deep Autoencoders for Smart Grid Intrusion Detection. In Proceedings of the 2020 IEEE Power & Energy Society General Meeting (PESGM), Montreal, QC, Canada, 2–6 August 2020; pp. 1–5. [Google Scholar]
- Gumaei, A.; Hassan, M.M.; Huda, S.; Hassan, Md.R.; Camacho, D.; Del Ser, J.; Fortino, G. A Robust Cyberattack Detection Approach Using Optimal Features of SCADA Power Systems in Smart Grids. Appl. Soft Comput. 2020, 96, 106658. [Google Scholar] [CrossRef]
- Ankitdeshpandey; Karthi, R. Development of Intrusion Detection System Using Deep Learning for Classifying Attacks in Power Systems. In Proceedings of the Soft Computing: Theories and Applications, Singapore, 30 June 2020; pp. 755–766. [Google Scholar]
- Hink, R.C.B.; Beaver, J.M.; Buckner, M.A.; Morris, T.; Adhikari, U.; Pan, S. Machine learning for power system disturbance and cyber-attack discrimination. In Proceedings of the 2014 7th International Symposium on Resilient Control Systems (ISRCS), Denver, CO, USA, 9–21 August 2014; pp. 1–8. [Google Scholar]
- Agrawal, A.; Sazos, M.; Al Durra, A.; Maniatakos, M. Towards Robust Power Grid Attack Protection using LightGBM with Concept Drift Detection and Retraining. In Proceedings of the 2020 Joint Workshop on CPS & IoT Security and Privacy, Virtual Event, 9 November 2020; pp. 31–36. [Google Scholar]
- Sunku Mohan, V.; Sankaran, S. Intelligent Approach for Analysis and Diagnosis of Attack, Fault and Load Variation in SCADA Systems: A Power System Application. In Proceedings of the Intelligent Data Analytics for Power and Energy Systems, Singapore, 17 February 2022; pp. 1–28. [Google Scholar]
- Bitirgen, K.; Filik, Ü.B. A Hybrid Deep Learning Model for Discrimination of Physical Disturbance and Cyber-Attack Detection in Smart Grid. Int. J. Crit. Infrastruct. Prot. 2023, 40, 100582. [Google Scholar] [CrossRef]
- Yang, C.; Xia, Y. Interval Pareto Front-Based Multi-Objective Robust Optimization for Sensor Placement in Structural Modal Identification. Reliab. Eng. Syst. Saf. 2024, 242, 109703. [Google Scholar] [CrossRef]
- Gao, J.; Chai, S.; Zhang, B.; Xia, Y. Research on Network Intrusion Detection Based on Incremental Extreme Learning Machine and Adaptive Principal Component Analysis. Energies 2019, 12, 1223. [Google Scholar] [CrossRef]
- Hink, R.C.B.; Beaver, J.M.; Buckner, M.A.; Morris, T.; Adhikari, U.; Pan, S. Industrial Control System (ICS) Cyber Attack Datasets Used in the Experimentation. 2014. Available online: https://sites.google.com/a/uah.edu/tommy-morris-uah/ics-data-sets (accessed on 10 February 2023).
- Balan, A.; Srujan, T.L.; Manitha, P.V.; Deepa, K. Detection and Analysis of Faults in Transformer using Machine Learning. In Proceedings of the 2023 International Conference on Intelligent Data Communication Technologies and Internet of Things (IDCIoT), Bengaluru, India, 5–7 January 2023; pp. 477–482. [Google Scholar]
- Pan, S.; Morris, T.; Adhikari, U. Classification of Disturbances and Cyber-Attacks in Power Systems Using Heterogeneous Time-Synchronized Data. IEEE Trans. Ind. Inform. 2015, 11, 650–662. [Google Scholar] [CrossRef]
- Goldberger, J.; Hinton, G.E.; Roweis, S.; Salakhutdinov, R.R. Neighbourhood components analysis. In Proceedings of the 17th International Conference on Advances in Neural Information Processing Systems (NIPS 2004), Vancouver, BC, Canada, 13–18 December 2004; pp. 513–520. [Google Scholar]
- Sakhnini, J. HeuristicFS. 2020. Available online: https://github.com/jsakhnin/HeuristicFS (accessed on 11 December 2023).


| ML Classifiers | Parameter Specifications | INFAZ (On Average) | INFAD (On Average) |
|---|---|---|---|
| ExtraTrees with AdaBoost Classifier (ET + AdB) | learn. rate = {0.001,0.01,0.1,1}, Base classifier = ExtraTrees, N-Estimator = {50 to 100}, GridSerachCV = 10, Random State = 3 | N-Comp = 31 Iterations = 7 learn. rate = 0.001 N-Estimator = 95 | N-Comp = 29 Iterations = 6 learn. rate = 0.001 N-Estimator = 95 |
| ExtraTrees (ET) | N-Estimator = {50 to 100}, Criterion = ‘entropy’, GridSerachCV= 10, Random State = 3 | N-Comp = 26 Iterations = 5 N-Estimator = 85 | N-Comp = 29 Iterations = 6 N-Estimator = 81 |
| Random Forest (RF) | N-Estimator = {50 to 100}, Criterion = ‘entropy’, GridSerachCV= 10, Random State = 3 | N-Comp = 27 Iterations = 7 N-Estimator = 81 | N-Comp = 28 Iterations = 6 N-Estimator = 86 |
| Decision Tree (DT) | Max Depth = {50 to 100}, Criterion= ‘entropy’, GridSerachCV=10, Random State = 3 | N-Comp = 26 Iterations = 6 Max Depth = 95 | N-Comp = 28 Iterations = 8 Max Depth = 95 |
| K-Nearest Neighbor (KNN) | K Neighbors = {15 to 70}, GridSearchCV = 10, Random State = 3 | N-Comp = 28 Iterations = 8 K Neighbors = 15 | N-Comp = 28 Iterations = 9 K Neighbors = 15 |
| Extreme Gradient Boosting (XGB) | learn. rate = {0.001,0.01,0.1}, N-Estimator = {50 to 100}, GridSerachCV = 10, Random State =3 | N-Comp = 33 Iterations = 6 learn. rate = 0.1 N-Estimator = 100 | N-Comp = 34 Iterations = 7 learn. rate = 0.1 N-Estimator = 100 |
| Dataset Used | 3-Bus/2-Line Transmission System [34] | |||||||||||
|---|---|---|---|---|---|---|---|---|---|---|---|---|
| Feature Engineering | Without SMOTE (Original Dataset, Imbalanced) | With SMOTE (Balanced Dataset) | ||||||||||
| Event Types/ Datasets | No Events Records | Natural Events Records | Attack Events Records | Total Records (1+2) (100%) | Training Sample (1) (80%) | Testing Sample (2) (20%) | No Events Records | Natural Events Records | Attack Events Records | Total Records (1+2) (100%) | Training Sample (1) (80%) | Testing Sample (2) (20%) |
| Dataset 1 | 173 | 927 | 3866 | 4966 | 3972 | 994 | 3866 | 3866 | 3866 | 11,598 | 9278 | 2320 |
| Dataset 2 | 322 | 1222 | 3525 | 5069 | 4055 | 1014 | 3525 | 3525 | 3525 | 10,575 | 8460 | 2115 |
| Dataset 3 | 354 | 1250 | 3811 | 5415 | 4332 | 1083 | 3811 | 3811 | 3811 | 11,433 | 9146 | 2287 |
| Dataset 4 | 403 | 1397 | 3402 | 5202 | 4161 | 1041 | 3402 | 3402 | 3402 | 10,206 | 8164 | 2042 |
| Dataset 5 | 270 | 1211 | 3680 | 5161 | 4128 | 1033 | 3680 | 3680 | 3680 | 11,040 | 8832 | 2208 |
| Dataset 6 | 190 | 1287 | 3490 | 4967 | 3973 | 994 | 3490 | 3490 | 3490 | 10,470 | 8376 | 2094 |
| Dataset 7 | 208 | 1118 | 3910 | 5236 | 4188 | 1048 | 3910 | 3910 | 3910 | 11,730 | 9384 | 2346 |
| Dataset 8 | 356 | 1188 | 3771 | 5315 | 4252 | 1063 | 3771 | 3771 | 3771 | 11,313 | 9050 | 2263 |
| Dataset 9 | 478 | 1292 | 3570 | 5340 | 4272 | 1068 | 3570 | 3570 | 3570 | 10,710 | 8568 | 2142 |
| Dataset 10 | 326 | 1322 | 3921 | 5569 | 4455 | 1114 | 3921 | 3921 | 3921 | 11,763 | 9410 | 2353 |
| Dataset 11 | 145 | 1137 | 3969 | 5251 | 4200 | 1051 | 3969 | 3969 | 3969 | 11,907 | 9525 | 2382 |
| Dataset 12 | 384 | 1387 | 3453 | 5224 | 4179 | 1045 | 3453 | 3453 | 3453 | 10,359 | 8287 | 2072 |
| Dataset 13 | 203 | 950 | 4118 | 5271 | 4216 | 1055 | 4118 | 4118 | 4118 | 12,354 | 9883 | 2471 |
| Dataset 14 | 79 | 1274 | 3762 | 5115 | 4092 | 1023 | 3762 | 3762 | 3762 | 11,286 | 9028 | 2258 |
| Dataset 15 | 514 | 1347 | 3415 | 5276 | 4220 | 1056 | 3415 | 3415 | 3415 | 10,245 | 8196 | 2049 |
| Total | 4405 | 18,309 | 55,663 | 78,377 | 62,695 | 15,682 | 55,663 | 55,663 | 55,663 | 166,989 | 133,587 | 33,402 |
| Dataset Used | 3-Bus/2-Line Transmission System [34] | ||||||||
|---|---|---|---|---|---|---|---|---|---|
| Preprocessing Aspects | INFAZ | INFAD | |||||||
| Applying SMOTE on each of the 15 Datasets Separately (e.g., Dataset-1) | Applying SMOTE on Each of the 15 Datasets Separately (e.g., Dataset-1) | ||||||||
| Train–Test Split | 80:20 ratio | ||||||||
| Event Types | No Events records | Natural Events records | Attack Events records | Total Records | No Events records | Natural Events records | Attack Events records | Total Records | |
| Before SMOTE | 173 | 927 | 3866 | 4966 | 173 | 835 | 3610 | 4618 | |
| After SMOTE | Training Samples | 3093 | 3093 | 3092 | 9278 | 2888 | 2888 | 2888 | 8664 |
| Testing Samples | 774 | 773 | 773 | 2320 | 722 | 722 | 722 | 2166 | |
| No. of records | 3866 | 3866 | 3866 | 11,598 | 3610 | 3610 | 3610 | 10,830 | |
| Name of the Parameter | Meaning |
|---|---|
| N-Estimator | Number of trees in the forest |
| Criterion | The quality measure of the split |
| Cross-validation | Stratified K-Fold Cross-validation |
| Random State | Controls the randomness of the estimator |
| Max Depth | The maximum depth of the tree. |
| classifier | Base classifier to be specified |
| learning_rate | Weight is applied to each classifier at each boosting iteration. |
| K | Number of nearest neighbors |
| Dataset Used | 3-Bus/2-Line Transmission System [34] Individual 15 Datasets |
|---|---|
| Feature Extraction Technique of NCA | NCA components list = [20,25,30,35] Max iterations = [2,4,6,8,10] |
| DS | Preprocessing as INFAZ | Preprocessing as INFAD | ||||||||||||||
|---|---|---|---|---|---|---|---|---|---|---|---|---|---|---|---|---|
| N-Comp | Iter. | Learning Rate | N-Esti. | Prec. | Recall | F1-Score | Acc. | N-Comp | Iter. | Learning Rate | N-Esti. | Prec. | Recall | F1-Score | Acc. | |
| 1 | 35 | 6 | 0.001 | 95 | 98.84 | 98.84 | 98.84 | 98.84 | 30 | 4 | 0.001 | 95 | 98.48 | 98.48 | 98.48 | 98.48 |
| 2 | 20 | 8 | 0.001 | 95 | 97.26 | 97.26 | 97.26 | 97.26 | 30 | 10 | 0.001 | 95 | 97.97 | 97.97 | 97.97 | 97.97 |
| 3 | 35 | 8 | 0.001 | 95 | 97.86 | 97.86 | 97.86 | 97.86 | 35 | 2 | 0.001 | 95 | 98.72 | 98.72 | 98.72 | 98.72 |
| 4 | 35 | 6 | 0.001 | 95 | 97.16 | 97.16 | 97.16 | 97.16 | 20 | 10 | 0.001 | 95 | 98.40 | 98.40 | 98.40 | 98.40 |
| 5 | 35 | 8 | 0.001 | 95 | 97.61 | 97.60 | 97.60 | 97.60 | 35 | 2 | 0.001 | 95 | 98.13 | 98.13 | 98.13 | 98.13 |
| 6 | 30 | 8 | 0.001 | 95 | 96.94 | 96.94 | 96.94 | 96.94 | 20 | 6 | 0.001 | 95 | 97.39 | 97.37 | 97.37 | 97.37 |
| 7 | 35 | 8 | 0.001 | 95 | 97.66 | 97.66 | 97.66 | 97.66 | 25 | 4 | 0.001 | 95 | 97.93 | 97.93 | 97.93 | 97.93 |
| 8 | 25 | 4 | 0.001 | 95 | 97.17 | 97.17 | 97.17 | 97.17 | 30 | 6 | 0.001 | 95 | 99.10 | 99.10 | 99.10 | 99.10 |
| 9 | 25 | 8 | 0.001 | 95 | 96.60 | 96.59 | 96.60 | 96.59 | 30 | 6 | 0.001 | 95 | 97.88 | 97.88 | 97.88 | 97.88 |
| 10 | 35 | 4 | 0.001 | 95 | 97.64 | 97.62 | 97.62 | 97.62 | 30 | 2 | 0.001 | 95 | 98.33 | 98.33 | 98.33 | 98.33 |
| 11 | 30 | 4 | 0.001 | 95 | 97.86 | 97.86 | 97.86 | 97.86 | 35 | 6 | 0.001 | 95 | 98.10 | 98.10 | 98.10 | 98.10 |
| 12 | 25 | 8 | 0.001 | 95 | 96.52 | 96.48 | 96.49 | 96.48 | 35 | 10 | 0.001 | 95 | 98.20 | 98.20 | 98.20 | 98.20 |
| 13 | 35 | 8 | 0.001 | 95 | 98.63 | 98.62 | 98.63 | 98.62 | 35 | 4 | 0.001 | 95 | 99.22 | 99.21 | 99.21 | 99.21 |
| 14 | 35 | 10 | 0.001 | 95 | 97.79 | 97.79 | 97.79 | 97.79 | 30 | 10 | 0.001 | 95 | 98.58 | 98.57 | 98.57 | 98.57 |
| 15 | 35 | 4 | 0.001 | 95 | 97.23 | 97.22 | 97.22 | 97.22 | 20 | 10 | 0.001 | 95 | 97.38 | 97.35 | 97.36 | 97.35 |
| Avg. | 31 | 7 | 0.001 | 95 | 97.52 | 97.51 | 97.51 | 97.51 | 29 | 6 | 0.001 | 95 | 98.25 | 98.25 | 98.25 | 98.25 |
| Test Cases | Case 1 | Case 2 | Case 3 | Case 4 | Case 5 | Case 6 | Case 7 |
|---|---|---|---|---|---|---|---|
| Labels | 0, 1, and 2 | 0 | 1 and 2 | 1 | 0 and 2 | 2 | 0 and 1 |
| Types of Scenarios | Attack Events vs. Natural Events vs. No Events | Attack Events | Natural Events vs. No Events | Natural Events | Attack Events vs. No Events | No Events | Attack Events vs. Natural Events |
| Feature Extraction Techniques with ML Classifier | SAML-NCA with (ET + AdB) Classifier (Without SMOTE) | SAML-NCA with (ET + AdB) Classifier (With SMOTE) |
|---|---|---|
| Datasets | Acc. (%) | Acc. (%) |
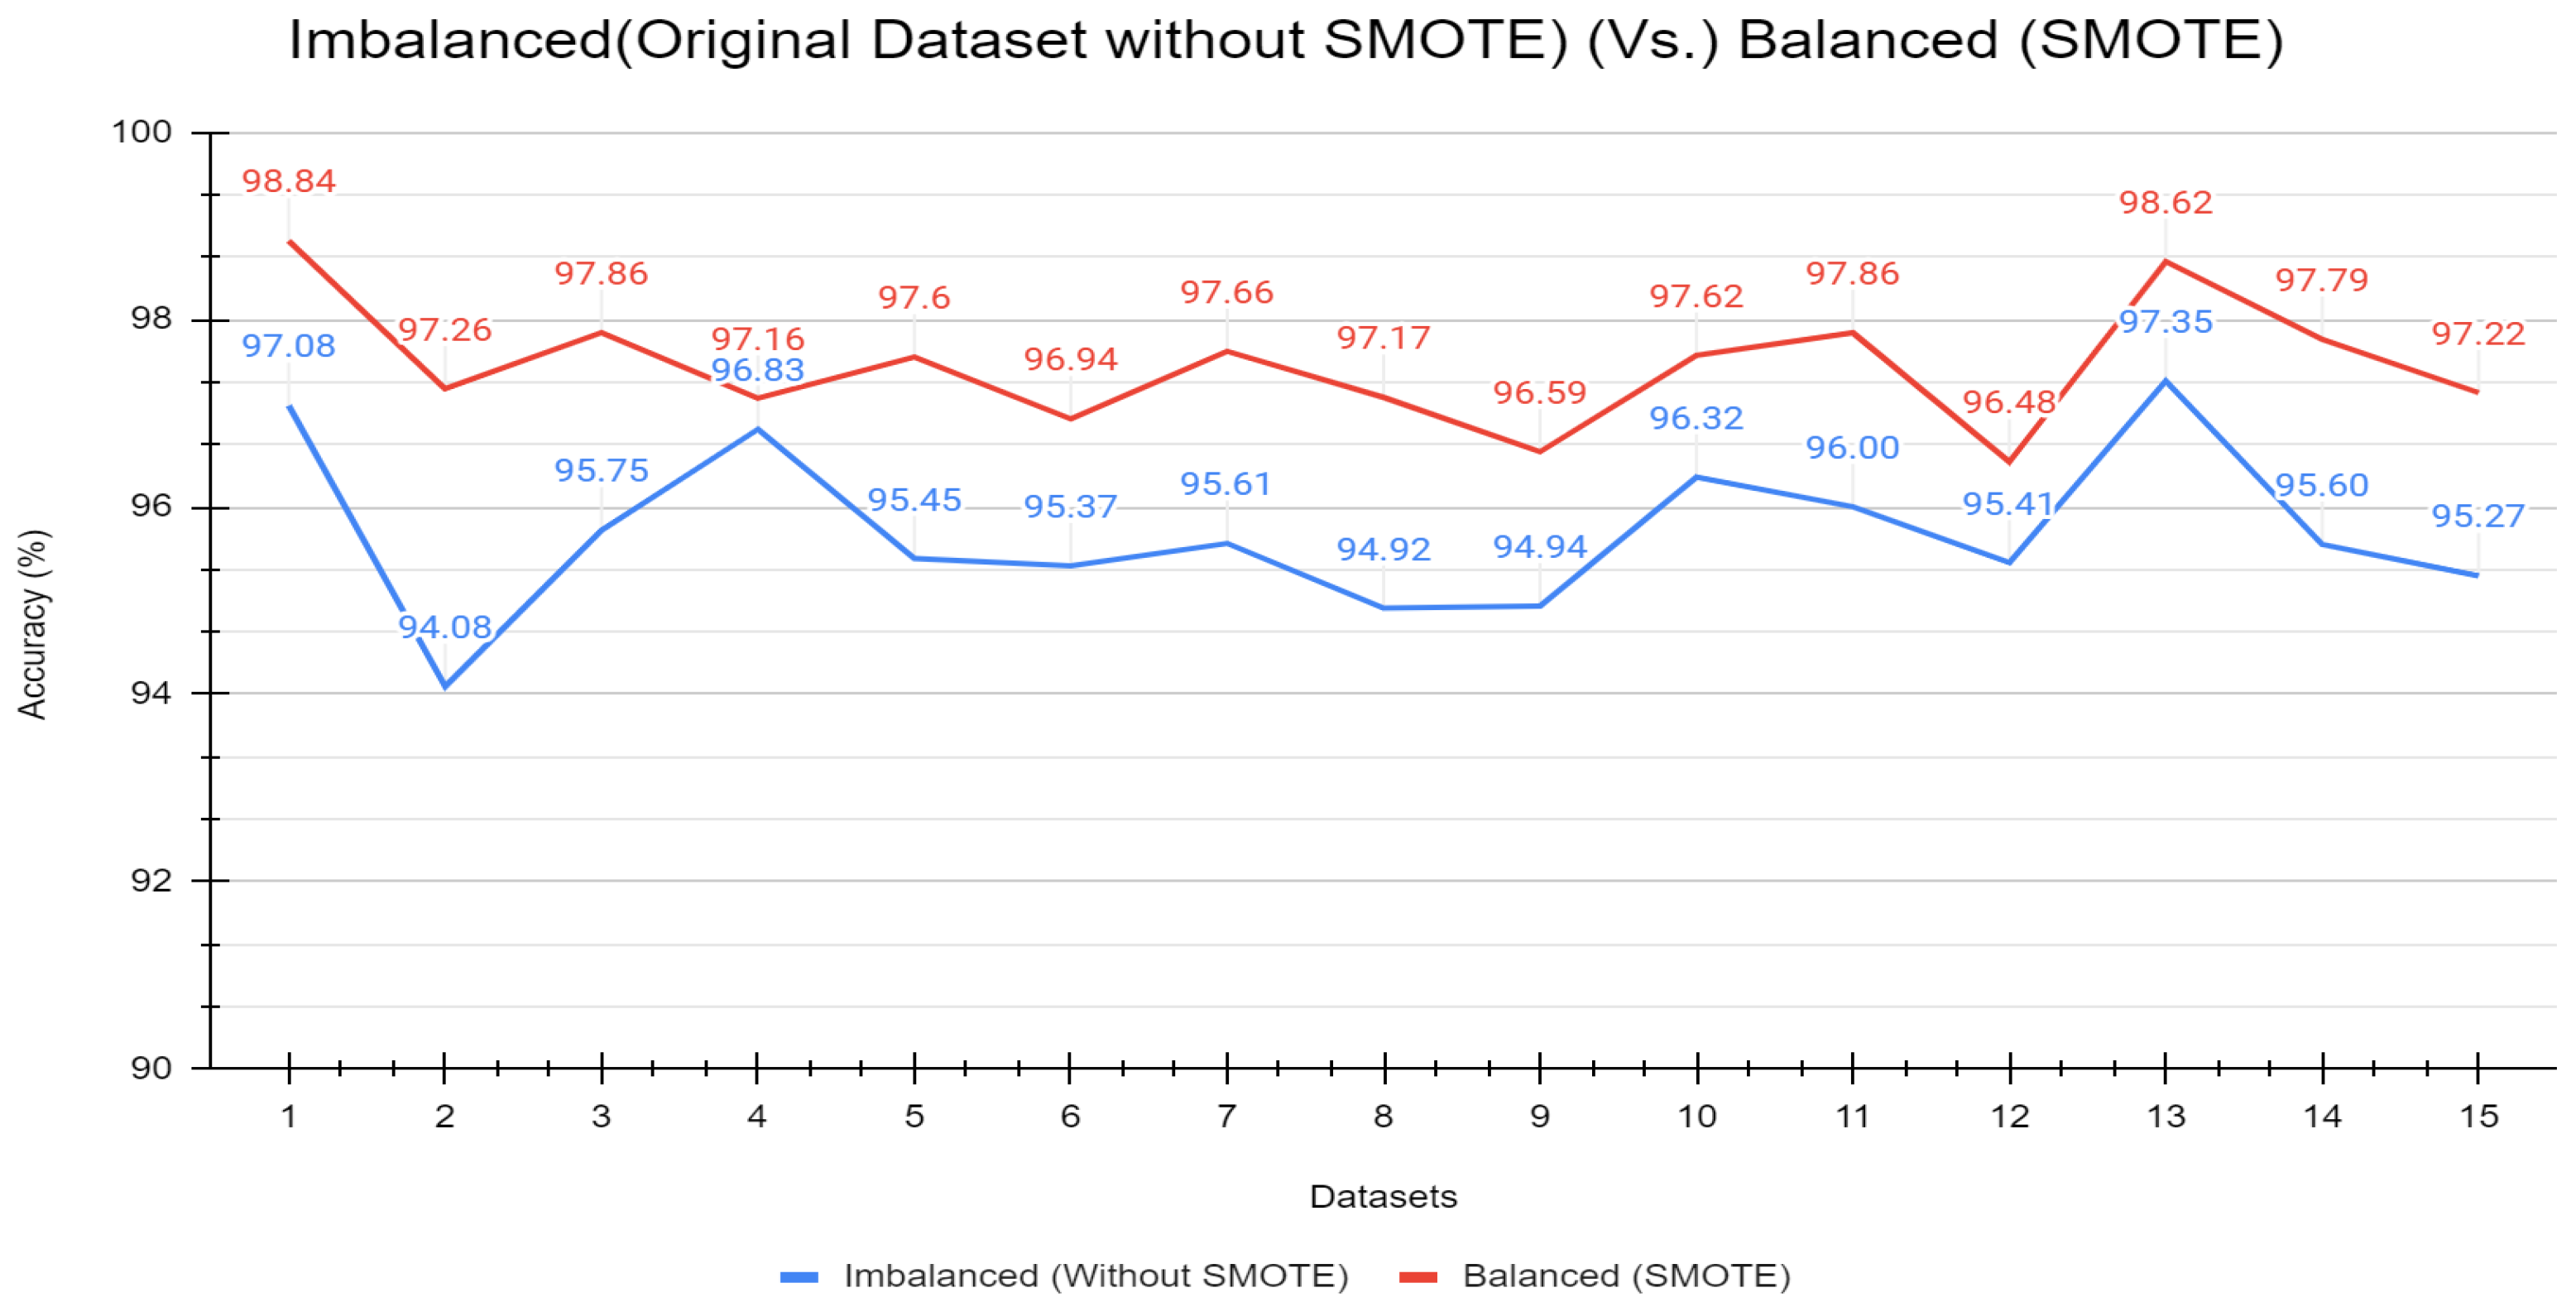
| 1 | 97.08 | 98.84 |
| 2 | 94.08 | 97.26 |
| 3 | 95.75 | 97.86 |
| 4 | 96.83 | 97.16 |
| 5 | 95.45 | 97.60 |
| 6 | 95.37 | 96.94 |
| 7 | 95.61 | 97.66 |
| 8 | 94.92 | 97.17 |
| 9 | 94.94 | 96.59 |
| 10 | 96.32 | 97.62 |
| 11 | 96.00 | 97.86 |
| 12 | 95.41 | 96.48 |
| 13 | 97.35 | 98.62 |
| 14 | 95.60 | 97.79 |
| 15 | 95.27 | 97.22 |
| Avg. | 95.73 | 97.51 |
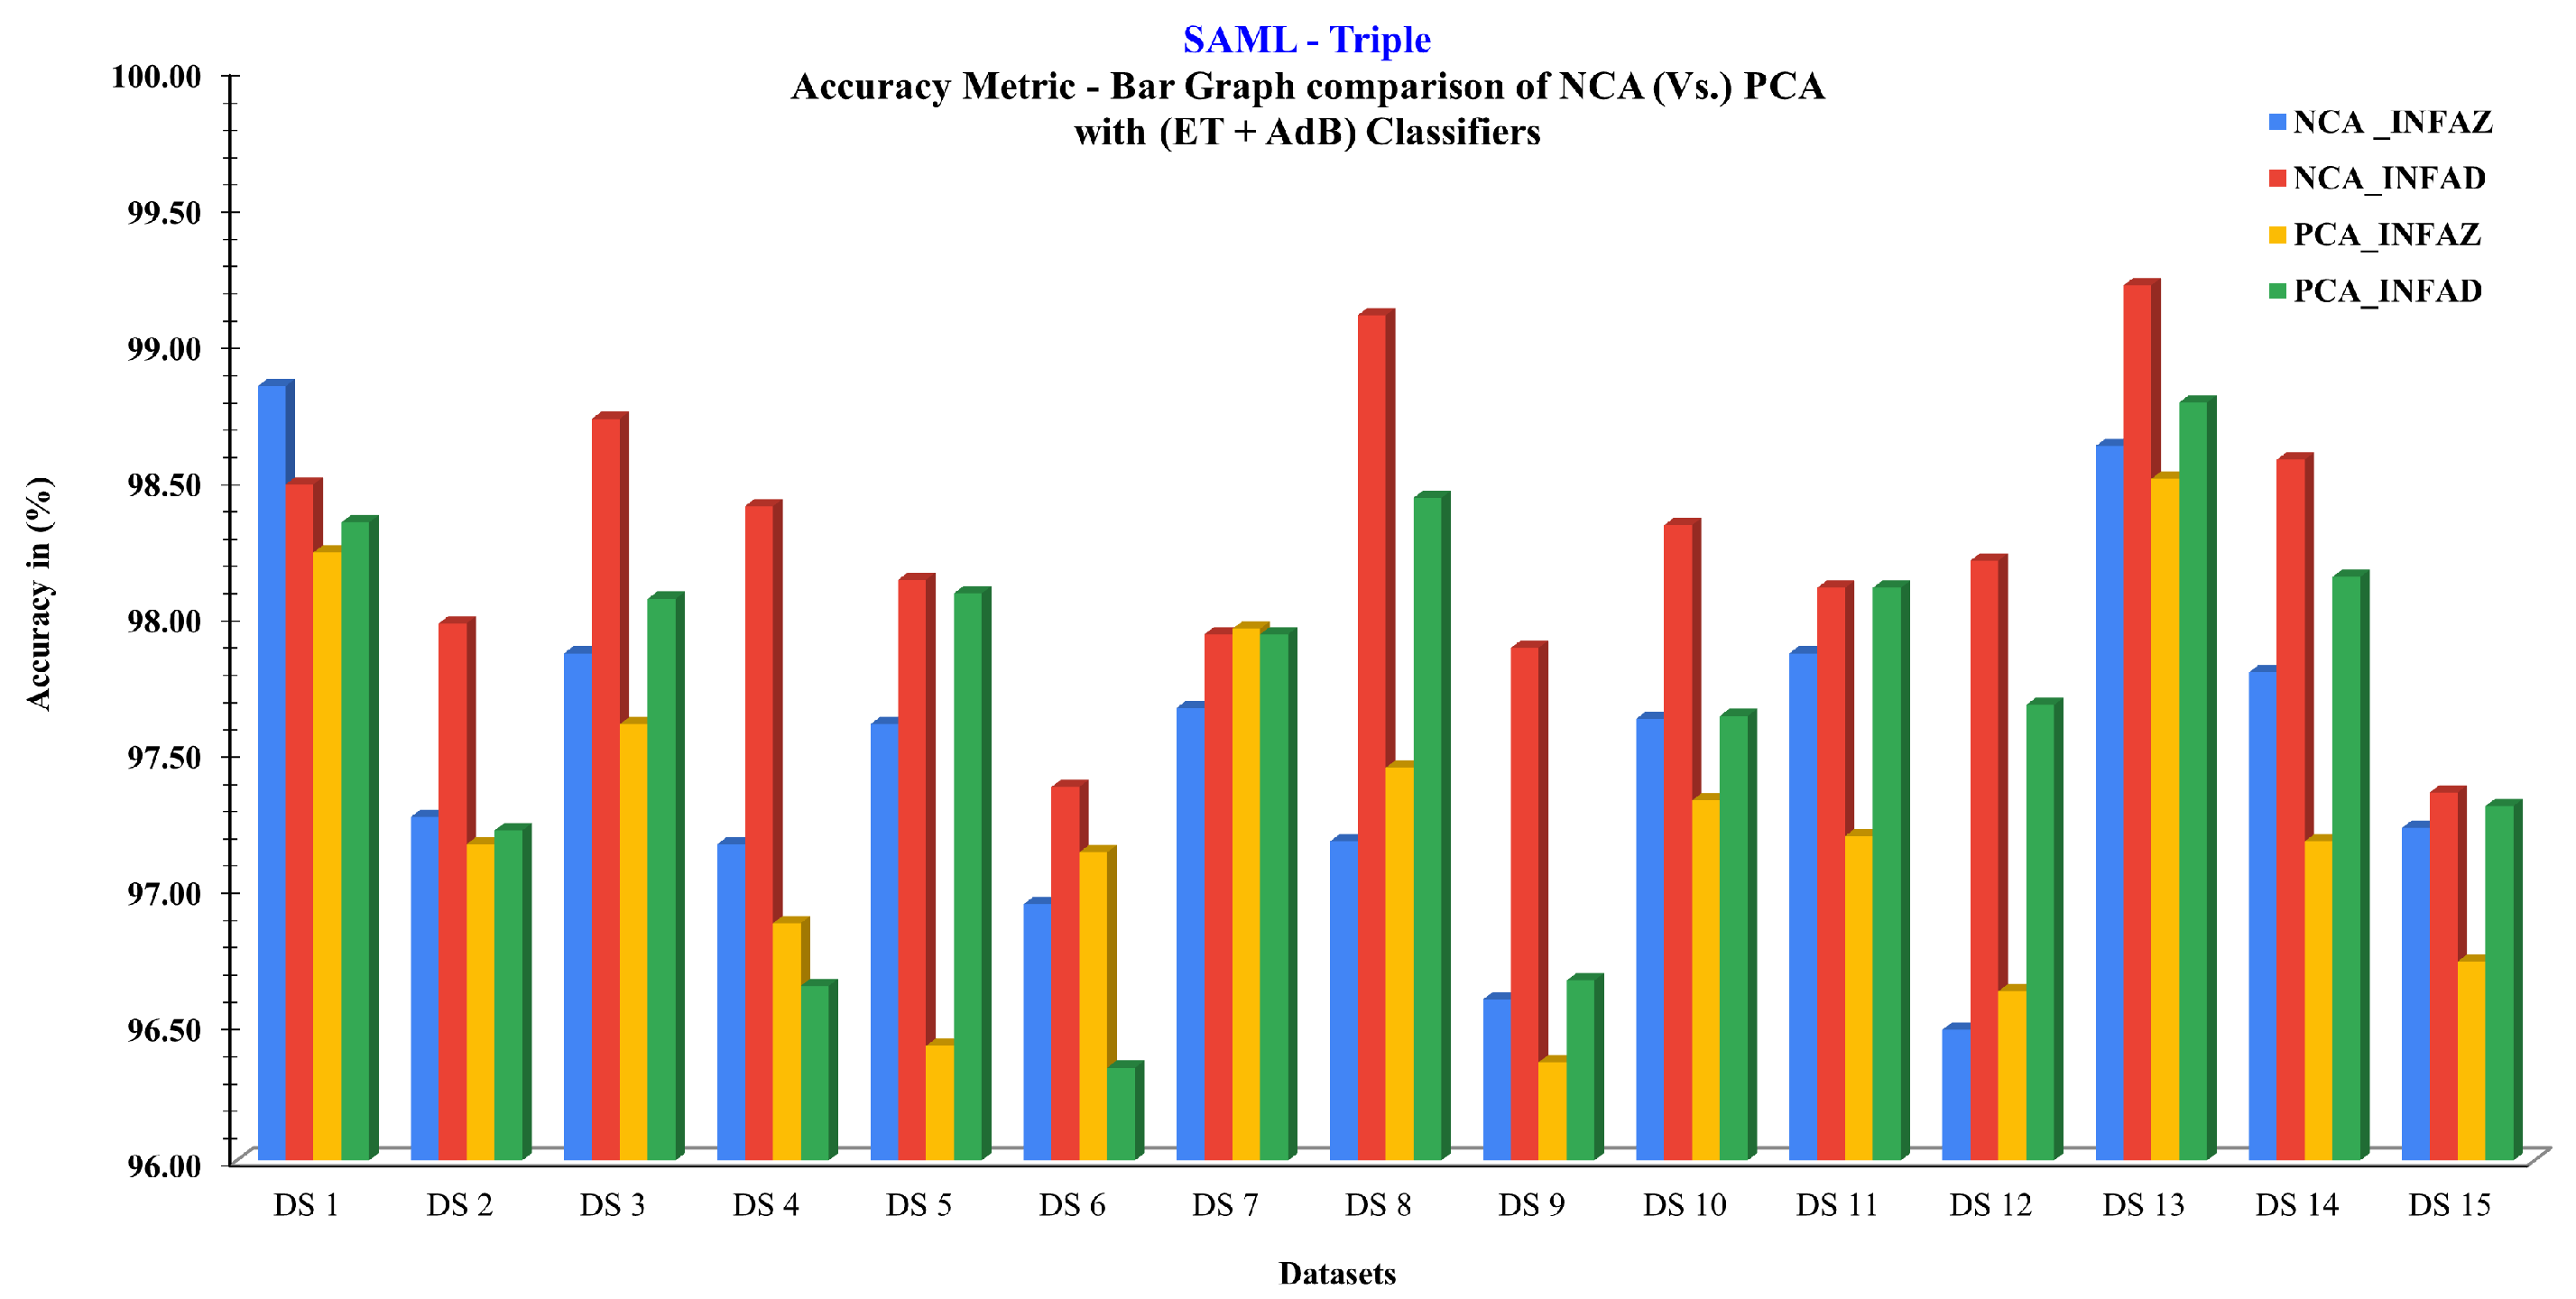
| Feature Extraction Techniques with ML Classifier | PCA [27] with (ET + AdB) Classifier | SAML-NCA with (ET + AdB) Classifier | ||
|---|---|---|---|---|
| Preprocessing Aspects | INFAZ | INFAD | INFAZ | INFAD |
| Datasets | Acc. (%) | Acc. (%) | Acc. (%) | Acc. (%) |
| 1 | 98.23 | 98.34 | 98.84 | 98.48 |
| 2 | 97.16 | 97.21 | 97.26 | 97.97 |
| 3 | 97.60 | 98.06 | 97.86 | 98.72 |
| 4 | 96.87 | 96.64 | 97.16 | 98.40 |
| 5 | 96.42 | 98.08 | 97.60 | 98.13 |
| 6 | 97.13 | 96.34 | 96.94 | 97.37 |
| 7 | 97.95 | 97.93 | 97.66 | 97.93 |
| 8 | 97.44 | 98.43 | 97.17 | 99.10 |
| 9 | 96.36 | 96.66 | 96.59 | 97.88 |
| 10 | 97.32 | 97.63 | 97.62 | 98.33 |
| 11 | 97.19 | 98.10 | 97.86 | 98.10 |
| 12 | 96.62 | 97.67 | 96.48 | 98.20 |
| 13 | 98.50 | 98.78 | 98.62 | 99.21 |
| 14 | 97.17 | 98.14 | 97.79 | 98.57 |
| 15 | 96.73 | 97.30 | 97.22 | 97.35 |
| Avg. | 97.25 | 97.69 | 97.51 | 98.25 |
| Test Case Scenarios of 15 Datasets | Case 1 | Case 2 | Case 3 | Case 4 | Case 5 | Case 6 | Case 7 | |||||||
|---|---|---|---|---|---|---|---|---|---|---|---|---|---|---|
| Attack Events vs. Natural Events vs. No Events | Attack Events | Natural Events vs. No Events | Natural Events | Attack Events vs. No Events | No Events | Attack Events vs. Natural Events | ||||||||
| Average of 15 Datasets Accuracy (%) | INFAZ | INFAD | INFAZ | INFAD | INFAZ | INFAD | INFAZ | INFAD | INFAZ | INFAD | INFAZ | INFAD | INFAZ | INFAD |
| 97.51 | 98.25 | 96.66 | 97.82 | 97.94 | 98.46 | 96.40 | 97.21 | 98.07 | 98.77 | 99.48 | 99.71 | 96.53 | 97.52 | |
| Proposed Work vs. Other ML Alg. | Precision (%) | Recall (%) | F1-score (%) | Accuracy (%) | FPR (%) | FNR (%) | ||||||
|---|---|---|---|---|---|---|---|---|---|---|---|---|
| INFAZ | INFAD | INFAZ | INFAD | INFAZ | INFAD | INFAZ | INFAD | INFAZ | INFAD | INFAZ | INFAD | |
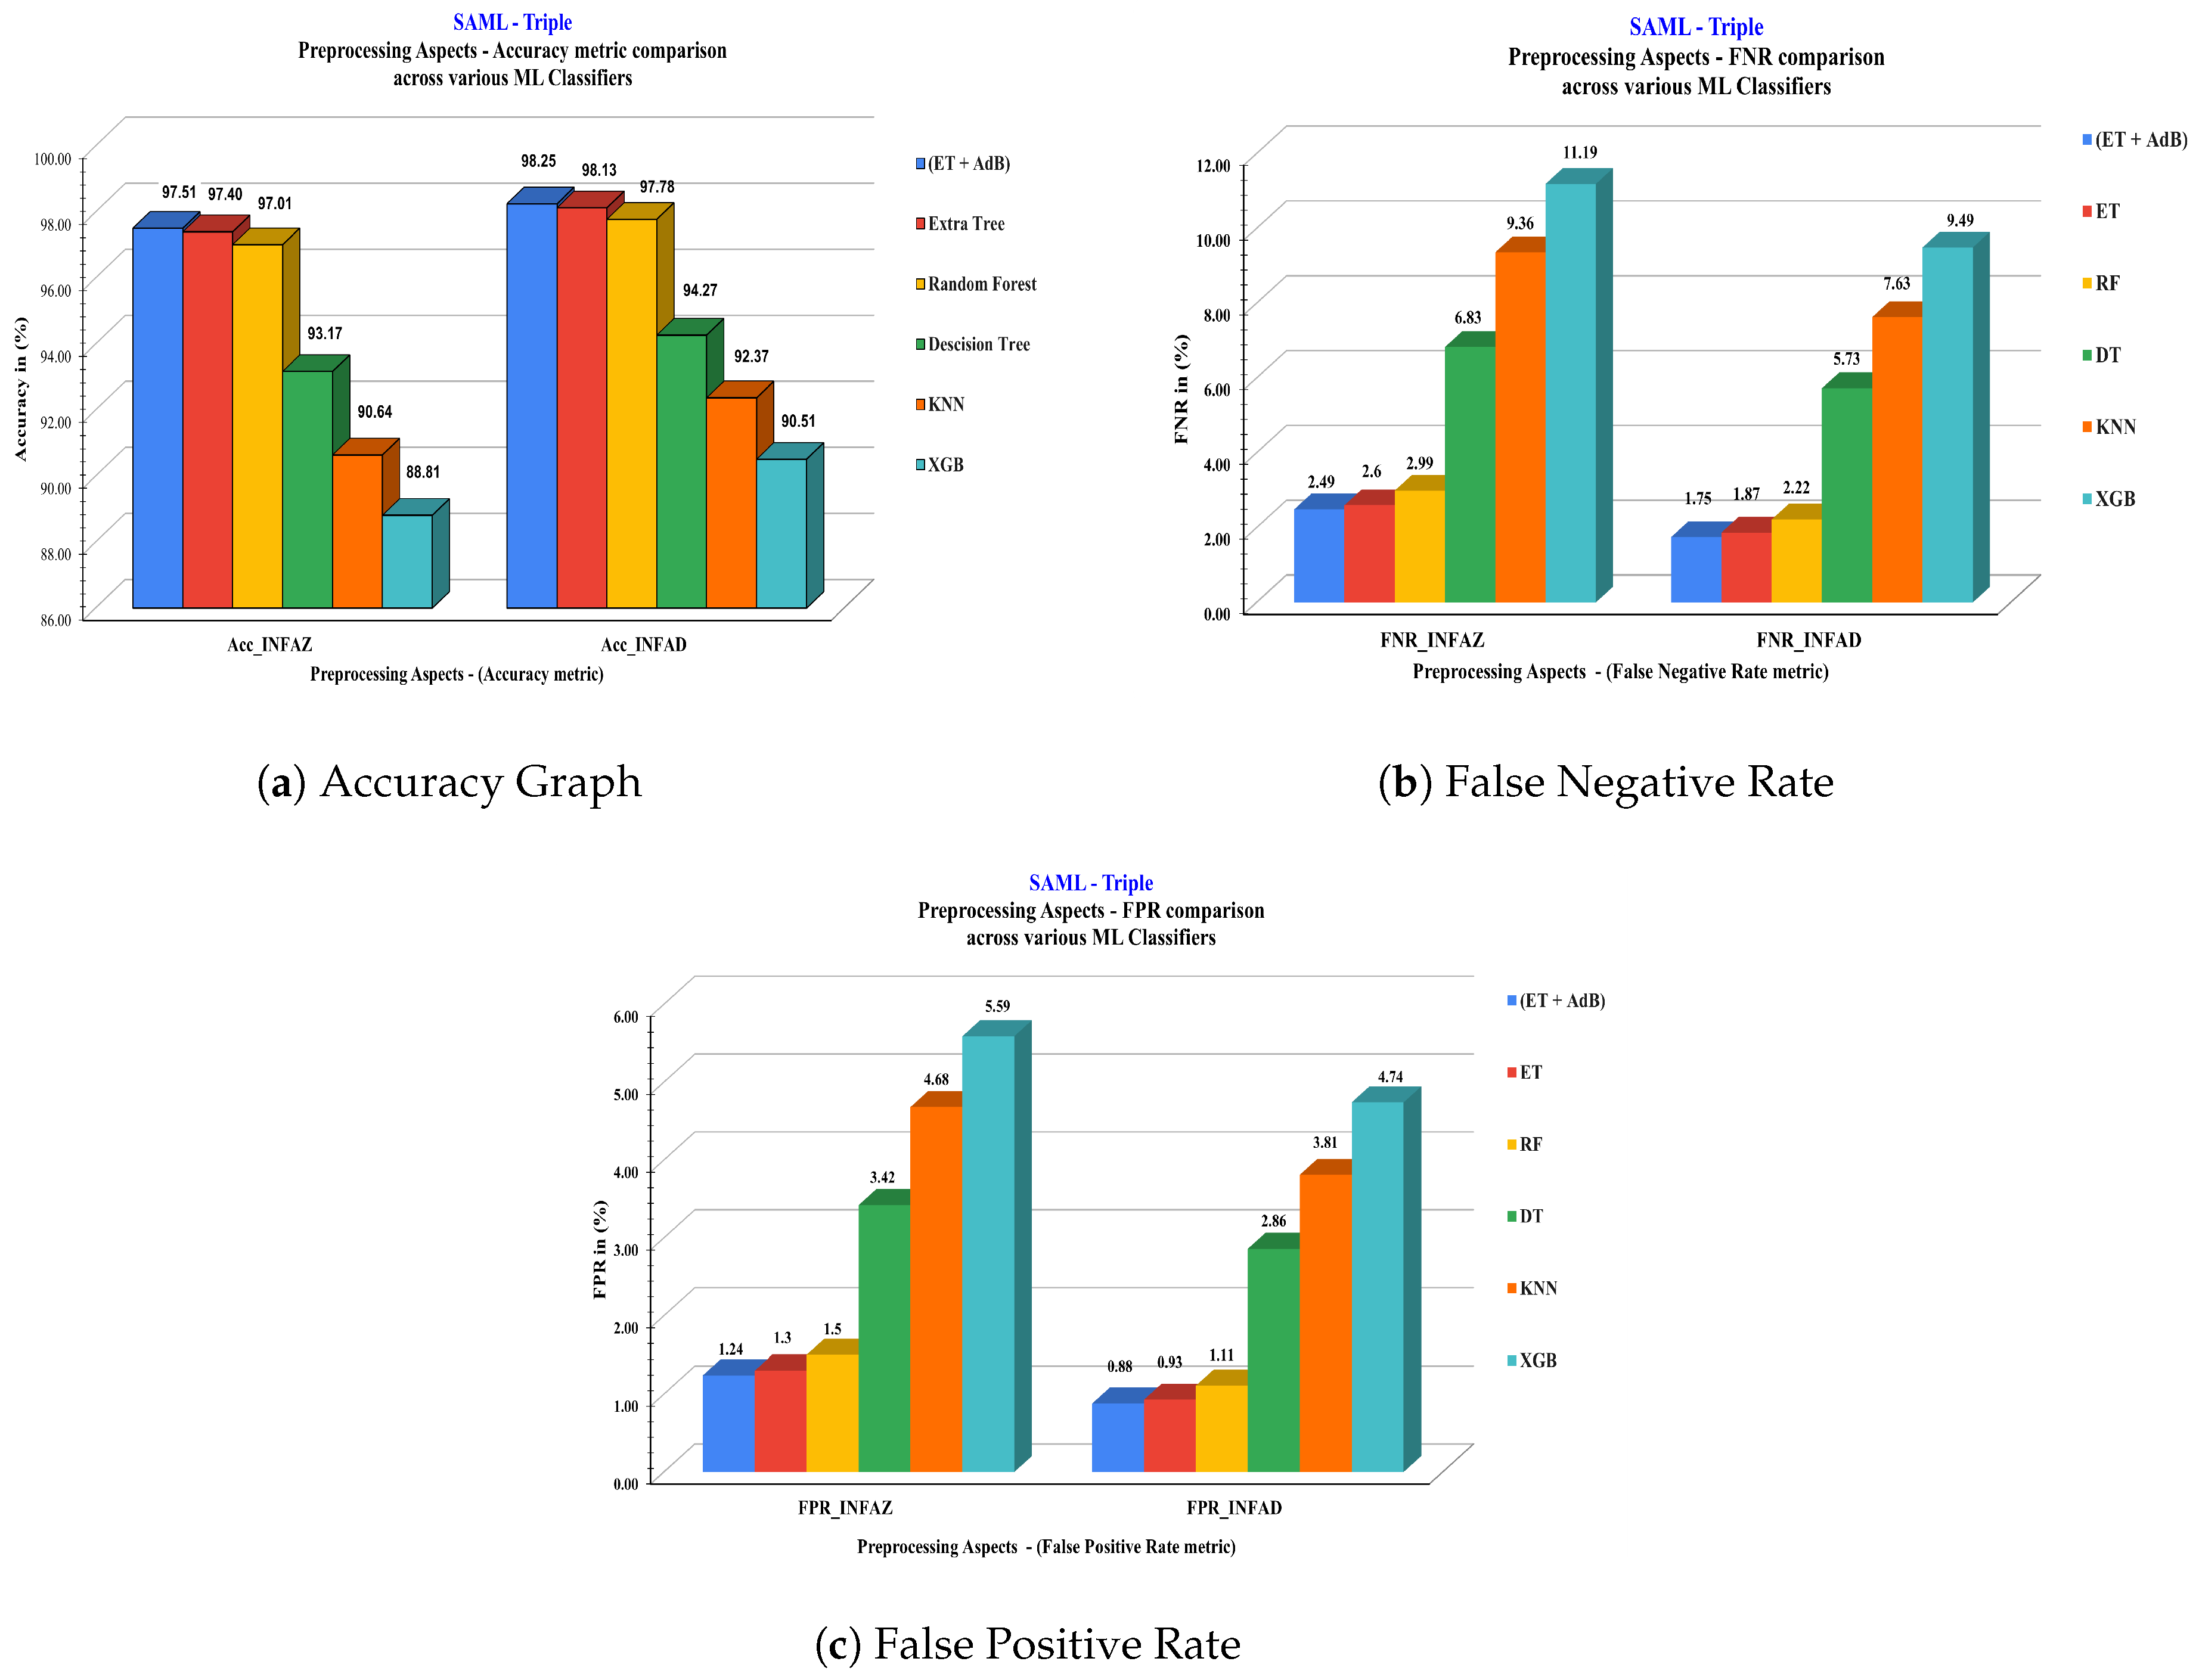
| (ET + AdB) | 97.52 | 98.25 | 97.51 | 98.25 | 97.51 | 98.25 | 97.51 * | 98.25 * | 1.24 | 0.88 | 2.49 | 1.75 |
| ET | 97.41 | 98.13 | 97.40 | 98.13 | 97.40 | 98.13 | 97.40 | 98.13 | 1.30 | 0.93 | 2.60 | 1.87 |
| RF | 97.02 | 97.79 | 97.01 | 97.78 | 97.01 | 97.78 | 97.01 | 97.78 | 1.50 | 1.11 | 2.99 | 2.22 |
| DT | 93.17 | 94.28 | 93.17 | 94.28 | 93.16 | 94.27 | 93.17 | 94.27 | 3.42 | 2.86 | 6.83 | 5.73 |
| KNN | 90.77 | 92.45 | 90.65 | 92.38 | 90.57 | 92.32 | 90.64 | 92.37 | 4.68 | 3.81 | 9.36 | 7.63 |
| XGB | 88.80 | 90.50 | 88.81 | 90.51 | 88.75 | 90.44 | 88.81 | 90.51 | 5.59 | 4.74 | 11.19 | 9.49 |
| 10 Rounds of Batch Processing | Response Time (ms) for 120 Samples/s System [36] | |||||
|---|---|---|---|---|---|---|
| (ET + AdB) | ET | RF | DT | KNN | XGB | |
| Round-1 | 31.68 | 58.72 | 34.66 | 10.70 | 109.62 | 42.02 |
| Round-2 | 24.52 | 46.10 | 36.70 | 11.87 | 41.28 | 45.61 |
| Round-3 | 26.20 | 47.89 | 35.12 | 11.52 | 43.11 | 47.72 |
| Round-4 | 26.00 | 61.02 | 34.54 | 10.67 | 35.06 | 39.12 |
| Round-5 | 23.62 | 59.68 | 36.43 | 12.02 | 38.49 | 42.25 |
| Round-6 | 38.23 | 46.46 | 44.46 | 9.77 | 29.35 | 40.37 |
| Round-7 | 39.23 | 46.57 | 34.97 | 9.54 | 36.67 | 37.75 |
| Round-8 | 23.32 | 47.44 | 34.44 | 9.04 | 35.63 | 17.68 |
| Round-9 | 24.07 | 53.46 | 33.99 | 8.74 | 39.94 | 18.67 |
| Round-10 | 23.72 | 54.09 | 34.25 | 11.4 | 100.04 | 17.99 |
| Average Response Time (ms) | 28.06 | 52.14 | 35.96 | 10.53 | 50.92 | 34.92 |
| Comparison with Various ML Classifiers | Accuracy (%) | Average Response Time (ms) for 120 Samples/s System [36] | Response Time (ms) between two Samples of 8.3 ms [36] |
|---|---|---|---|
| (ET + AdB) | 97.51 | 28.06 | 0.23 |
| ET | 97.40 | 52.14 | 0.43 |
| RF | 97.01 | 35.96 | 0.30 |
| DT | 93.17 | 10.53 | 0.09 |
| KNN | 90.64 | 50.92 | 0.42 |
| XGB | 88.81 | 34.92 | 0.29 |
| Reference Paper | Feature Selection/ Extraction | Number of Features Selection or Extraction | Machine Learning Classifiers | Accuracy (%) | |
|---|---|---|---|---|---|
| INFAZ | INFAD | ||||
| SAML-Triple (Proposed Work) | NCA | 31 | (ET + AdB) | 97.51 * | 98.25 * |
| Upadhyay, Darshana, et al. [22,23] | GBFS | 15 | Tree Based | - | 96.50 |
| RFE-XG | 30 | MV-EM | - | 97.95 | |
| Hu, Chengming, et al. [24,25] | Stacked Denoising Autoencoders (SDAE) | 60 | XGBoost | 90.48 | |
| Multiple Autoencoders (AE) | 30 | Random Forest | 91.78 | ||
| Gumaei, Abdu, et al. [26] | Correlation-Based Feature Selection | 8 to 11 | KNN | 91.87 | |
| Ankitdeshpandey, Karthi, R. [27] | PCA | 31 | Random Forest | 91.14 | |
| Hink, Raymond, C. Borges, et al. [28] | Information Gain | 40 | Adaboost + JRipper | 95.00 | |
| Agrawal, Anand, et al. [29] | ExtraTrees | 10 | LightGBM | - | 95.30 |
| Sunku Mohan, Vamshi, and Sriram Sankaran [30] | Manually selected the Features based on Power Domain Knowledge | 36 | Rule-Based ML + AdaBoost | 97.25 | |
| Bitirgen K, Filik ÜB [31] | PSO | Not Specified | CNN-LSTM | 96.92 | |
| Dataset Used | No. of Features | NCA Components and Iteration Range |
|---|---|---|
| IEEE 14 Bus System [38] | 34 | NCA components list = [2, 5, 10] Max iterations: [5, 10, 15, 20] learning_rate = {0.001} |
| IEEE 57 Bus System [38] | 137 | NCA components list = [60, 70, 80, 90] Max iterations = [5, 10, 15, 20] learning_rate = {0.001} |
| IEEE ‘N’ Bus Systems | IEEE 14-Bus System [38] | IEEE 57-Bus System [38] | ||
|---|---|---|---|---|
| Comparison of Proposed Work with Existing Works | J. Sakhnini et al. [13] | SAML-Triple | J. Sakhnini et al. [13] | SAML-Triple |
| Feature Selection/Extraction Method | BCS | NCA | BCS | NCA |
| ML Algorithm Applied | SVM | (ET+AdB) | SVM | (ET+AdB) |
| Actual No. of Features | 34 | 137 | ||
| No. of Features Selected/ Extracted | 11 Features | 2 Components, 15 iterations, 0.001 learning rate | 94 Features | 90 Components, 5 iterations, 0.001 learning rate |
| Accuracy (%) | 90.69 | 93.94* | 88.59 | 90.92* |
| Dataset Used | Proposed Work | Accuracy (%) (Detection Rate) | FNR (%) (Missing Rate) | FPR (%) (False Alarm) | Response Time (ms) | |
|---|---|---|---|---|---|---|
| A System [36] with 120 Samples/s Records | ||||||
| 3-bus/2-line transmission system (Triple Class) [34] | SAML—Triple NCA with (ET + AdB) classifier | INFAZ | 97.51 | 2.49 | 1.24 | 0.23 |
| INFAD | 98.25 | 1.75 | 0.88 | 0.22 | ||
Disclaimer/Publisher’s Note: The statements, opinions and data contained in all publications are solely those of the individual author(s) and contributor(s) and not of MDPI and/or the editor(s). MDPI and/or the editor(s) disclaim responsibility for any injury to people or property resulting from any ideas, methods, instructions or products referred to in the content. |
© 2024 by the authors. Licensee MDPI, Basel, Switzerland. This article is an open access article distributed under the terms and conditions of the Creative Commons Attribution (CC BY) license (https://creativecommons.org/licenses/by/4.0/).
Share and Cite
Murugesan, N.; Velu, A.N.; Palaniappan, B.S.; Sukumar, B.; Hossain, M.J. Mitigating Missing Rate and Early Cyberattack Discrimination Using Optimal Statistical Approach with Machine Learning Techniques in a Smart Grid. Energies 2024, 17, 1965. https://doi.org/10.3390/en17081965
Murugesan N, Velu AN, Palaniappan BS, Sukumar B, Hossain MJ. Mitigating Missing Rate and Early Cyberattack Discrimination Using Optimal Statistical Approach with Machine Learning Techniques in a Smart Grid. Energies. 2024; 17(8):1965. https://doi.org/10.3390/en17081965
Chicago/Turabian StyleMurugesan, Nakkeeran, Anantha Narayanan Velu, Bagavathi Sivakumar Palaniappan, Balamurugan Sukumar, and Md. Jahangir Hossain. 2024. "Mitigating Missing Rate and Early Cyberattack Discrimination Using Optimal Statistical Approach with Machine Learning Techniques in a Smart Grid" Energies 17, no. 8: 1965. https://doi.org/10.3390/en17081965