
Optimization of Discontinuous Polymer Flooding Processes for Offshore Oilfields Using a Novel PSO–ICA Algorithm
by

Engao Tang
1,2,
Jian Zhang
1,2,
Yi Jin
1,2,
Lezhong Li
1,2,
Anlong Xia
3,
Bo Zhu
3 and
Xiaofei Sun
3,* 1
State Key Laboratory of Offshore Oil & Gas Exploitation, Beijing 100028, China
2
CNOOC Research Institute Limited, Beijing 100028, China
3
School of Petroleum Engineering, China University of Petroleum (East China), Qingdao 266580, China
*
Author to whom correspondence should be addressed.
Energies 2024, 17(8), 1971; https://doi.org/10.3390/en17081971
Submission received: 25 February 2024
/
Revised: 24 March 2024
/
Accepted: 8 April 2024
/
Published: 21 April 2024
(This article belongs to the Section H1: Petroleum Engineering)
Abstract
:Recently, discontinuous polymer flooding has been proposed and successfully applied in some offshore oilfields. The performance of discontinuous polymer flooding depends on various operational parameters, such as injection timing, polymer concentrations, and crosslinker concentrations of four types of chemical slugs. Because the number of the operational parameters are large and they are nonlinearly related, the traditional reservoir numerical simulation might not simultaneously obtain the optimal results of these operational parameters. In this study, to simulate the discontinuous polymer flooding processes, a simulation model was built using a commercial reservoir simulator (CMG STARS), in which the mechanisms of the four types of chemical slugs were considered, such as polymer viscosification, adsorption, and degradation. Then, a PSO–ICA algorithm was developed by using the PSO algorithm to improve the exploration ability of the ICA algorithm. The codes were written with MATLAB and linked to CMG STARS to perform optimization processes. Finally, the PSO–ICA algorithm was compared with the ICA and PSO algorithms on benchmark functions to verify its reliability and applied to optimize a discontinuous polymer flooding process in a typical offshore oilfield in Bohai Bay, China. The results showed that the developed PSO–ICA algorithm had lower iteration numbers, higher optimization accuracy, and faster convergence rate than these of PSO and ICA, indicating that it was an effective method for optimizing the operational parameters of discontinuous polymer flooding processes. Compared to the continuous polymer flooding, the discontinuous polymer flooding had a higher oil production rate, a lower water cut, and a lower residual oil saturation. The net present value of the optimal scheme of discontinuous polymer flooding reached 7.49 × 10⁸ $, which is an increase of 6% over that of the scheme of continuous polymer flooding. More research including selecting more reasonable parameters of the PSO–ICA algorithm to increase its optimization accuracy and convergence rate, comparing with other available optimization algorithms, and verifying the performance of the optimal scheme of discontinuous polymer flooding in the practical offshore oilfield will be required in the future.
1. Introduction
Polymer flooding is a promising enhanced oil recovery method to increase oil recovery [1]. The addition of soluble polymer leads to an increase in the viscosity of injection water, a decrease in water mobility, and an increase in sweep efficiency [2]. In addition, polymer viscoelastic behavior also improves micro displacement efficiency [3,4,5]. Because the facilities required to implement polymer flooding meet the space and weighing requirements of offshore platforms, polymer flooding is gradually being applied in offshore oilfields [6]. For example, an offshore polymer flooding in the Dos Cuadras field near Santa Barbara, California was implemented in 1986 [7]. In addition, a polymer flooding was carried out in Bohai oilfield, China, from 2008 to 2016. The cumulative oil production of nine wells reached 10.80 × 10⁴ m3 [8]. However, offshore oilfields with high heterogeneity present higher-permeability zones through which the injected polymer solution flows from the injector to the producer, resulting in high water cut [9]. In addition, the continuous injection of polymer solution commonly results in high injection pressure, reduced polymer injection, and increased application cost.
Chemical materials, such as gels, crosslinked particles gels, and crosslinked polymer microspheres, are often injected into the reservoirs to preferentially seal the higher-permeability zones [10,11,12,13,14,15,16]. In addition, Claridge (1978) proposed that a polymer solution can be injected using several slugs with gradually decreased polymer concentrations, reducing the polymer loading and viscous fingering compared to one polymer slug [17]. Most reported projects worldwide have followed this scheme [18,19]. Recently, a new chemical flooding method called discontinuous polymer flooding has been proposed to deal with the aforementioned problems of polymer flooding and applied in mature offshore oilfields. For instance, after 5 months of discontinuous polymer flooding in the B reservoir in Bohai Bay, China, the average oil production rate increased by 115% and the water cut decreased by 15% compared with the continuous polymer flooding [20]. In this method, four types of chemical slugs (anti-dilution gel slug, polymer slug, long-acting gel slug, and polymer slug with low concentrations) were injected into the reservoir to improve the performance of polymer flooding. First, an anti-dilution gel slug was injected to seal the higher-permeability zones. Then, a polymer slug was injected to displace the oil. When the water cut or injection pressure sharply increased during the injection of the polymer slug, a long-acting gel slug or a polymer slug with a low concentration was injected to improve the sweep efficiency of polymer or decrease the injection pressure.
The performance of discontinuous polymer flooding depends on various operational parameters of the four types of chemical slugs, such as injection timing, polymer concentrations, and crosslinker concentrations. The number of the operational parameters are large and they are nonlinearly related. Using reservoir numerical simulation to optimize the operational parameters is time-consuming and expensive, meaning it might not simultaneously obtain the optimal results of these operational parameters.
Recently, optimization algorithms have been used to deal with the complex optimization problems [21,22,23,24]. Compared with reservoir numerical simulation, optimization algorithms are more efficient and can save optimization time. Specially, Sayyafzadeh and Keshavarz determined the optimal gas composition and gas injection rate for a coal-bed methane reservoir by using a genetic algorithm (GA) [25]. Eshraghi et al. optimized the operational parameters of a miscible CO2 injection process using particle swarm optimization (PSO) and GA. They found that PSO exhibited better performance than GA [26]. Ghadami et al. optimized a chemical flooding process by using response surface methodology and PSO to maximize the oil recovery. They found that PSO is a better algorithm for the optimization of chemical flooding processes [27]. Al Dossary and Nasrabadi obtained the optimal well locations using the imperialist competitive algorithm (ICA). The results showed that ICA obtained the optimal well location faster than GA and PSO, and also achieved a higher net present value [28].
Aside from the oil industry, ICA also shows a good performance for optimization in other domains, such as electrical power system optimization [29,30], neural network training [31], flow shop scheduling [32], data clustering [33], facility layout problem [34], minimal spanning tree problem [35], and so on. Though the ICA has some advantages such as a fast convergence speed and better optimized results, the exploration capability of ICA is unsatisfactory. Several modified methods have been proposed to solve the aforementioned problem. For instance, Bahrami and Abdechiri introduced a chaotic map to adjust the angles of colonies’ movements toward imperialists [36,37]. Abdechiri proposed an adaptive ICA in which an absorption policy was used to change the angles of colonies moving towards imperialists [38]. Khaled developed a fuzzy adaptive ICA where the deviation parameter was adaptively adjusted using a fuzzy controller [39].
In this study, 120 operational parameters (injection timing, polymer concentrations, and crosslinker concentrations of four types of chemical slugs for 12 injection wells) were simultaneously optimized to find the optimal net present value (NPV) of a discontinuous polymer flooding process. First, to simulate the discontinuous polymer flooding processes, a simulation model was built using a commercial reservoir simulator (CMG STARS), in which the mechanisms of the four types of chemical slugs were considered, such as polymer viscosification, adsorption, and degradation. Then, a PSO–ICA algorithm was developed by using the PSO algorithm to improve the exploration ability of ICA algorithm. The codes were written in MATLAB and linked to CMG STARS to perform optimization processes. Finally, the PSO–ICA algorithm was compared with the ICA and PSO algorithms on benchmark functions to verify its reliability and applied to optimize a discontinuous polymer flooding process in a typical offshore oilfield in Bohai Bay, China. To the best of our knowledge, there are no reservoir numerical simulations and optimizations conducted to investigate discontinuous polymer flooding processes. This study provides an effective method to conduct the optimal design of discontinuous chemical flooding and can be used as a reference in practical applications of the discontinuous polymer flooding process for enhancing oil recovery in offshore oilfields.
2. Reservoir Simulation Model
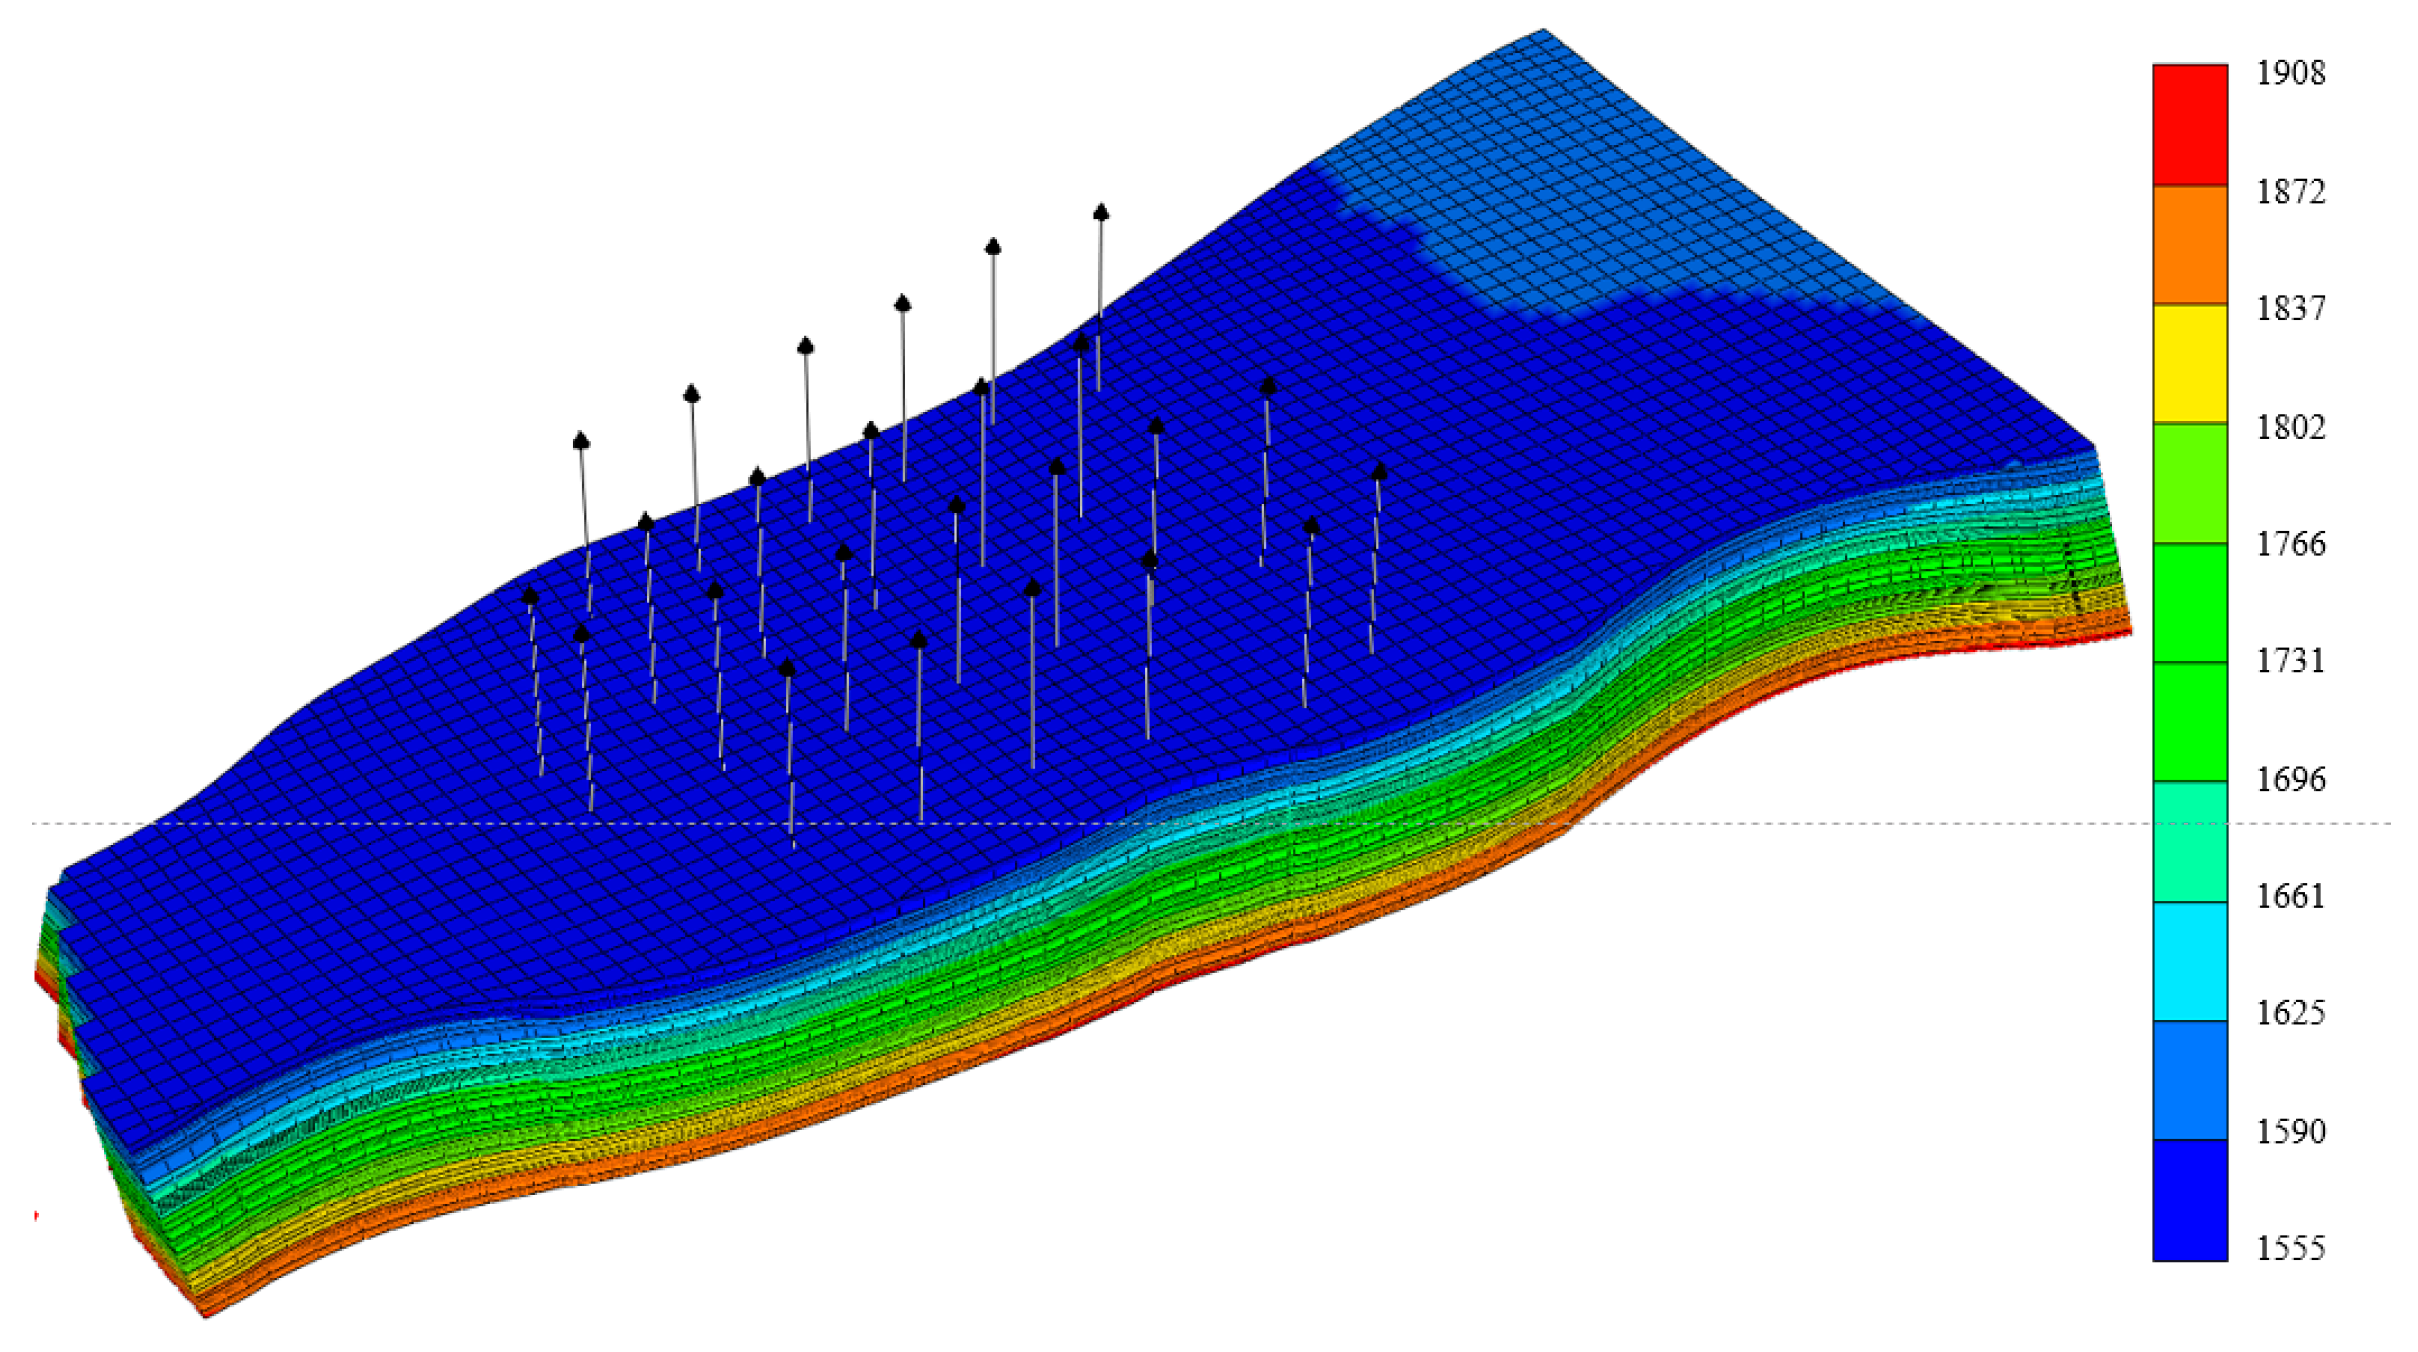
To represent a typical offshore oilfield at Bohai Bay, China, a reservoir model was developed with dimensions of 4200 m × 1800 m × 320 m in x, y, and z directions, respectively, and was discretized into 86 × 44 × 174 cells (total 658,416 cells) (Figure 1). A total of 12 injection wells and 28 production wells were drilled with a well spacing of 190 m. To simulate the discontinuous polymer flooding processes, a simulation model was built using a commercial reservoir simulator (CMG STARS). The model contains nine components (water, crosslinker 1, polymer 1, crosslinker 2, polymer 2, anti-dilution gel and long-acting gel, oil, and solution gas), which appear in oleic phase, gaseous phase, and aqueous phase. Considering the different physical and chemical properties of the anti-dilution gel and long-acting gel, two chemical reaction formula were used to describe the formation of the anti-dilution gel and long-acting gel.
where a, b, c, d, e, and f are the chemical reaction coefficients, which are determined by matching the core displacement experiments.
To characterize the effects of the four types of chemical slugs on discontinuous polymer flooding, the following mechanisms were considered in the simulation model.
- (1)
- The effects of shear rate on polymer viscosity
The effects of shear rate on polymer viscosity is modeled by using Meter’s equation [40]:
where is the shear rate, s−1; and are the polymer and water viscosity, mPa·s; is the shear rate when the viscosity is the average value of and , s−1; is an empirical coefficient.
- (2)
- The adsorption of polymers and gels
During the discontinuous polymer flooding processes, some of the polymers and gel will adsorb on the surface of rocks. The adsorption strength is mainly related to the polymer and gel type, saturations, and rock type [40]. The following equation is used to characterize the adsorption phenomenon.
where AdS is the adsorption capacity of polymer or gel in the model, gmol/m3; AdL is the static adsorption capacity of polymer or gels measured in the laboratory, μg/g; ρr is the rock density of the reservoir, g/cm3; is the porosity, %; Cf is a factor for unit conversion between the model and laboratory.
- (3)
- The permeability reduction
The adsorption of polymer on the surface of rocks reduces the permeability. The aforementioned phenomenon is characterized by the permeability reduction factor, modeled as follows:
where k and K are the absolute permeability of rock before and after polymer flooding, μm2; Rk is the permeability reduction factor, which is a function of the polymer adsorption and residual resistance factor.
where RRF is the residual resistance factor; AD is the cumulative adsorption capacity of the polymer or gel per unit volume of rock, gmole; ADMAX is the maximum adsorption capacity of polymer or gel per unit volume of rock, gmole/m3.
- (4)
- Inaccessible pore volume
The pore volume in the rock that the polymer solution cannot enter due to the large polymer structure can be calculated as follows:
where is the porosity value of the reservoir pores that the polymer solution cannot enter, %; IPV is the inaccessible pore volume, %, which is measured by experiments.
- (5)
- Polymer degradation
During polymer flooding processes, physical, chemical, and biological reactions commonly occur in the formation, resulting in polymer degradation. The following equations are used to characterize the polymer degradation phenomena.
where g and h are the chemical reaction coefficients; rrf is the reaction rate, 1/ day; T1/2 is the half-life of the polymer solution, days.
- (6)
- Polymer and gel viscosification
Compared with water flooding, discontinuous polymer flooding has higher sweep efficiency because the polymer and gel can increase the viscosity of the injection water. The aforementioned mechanism is depicted as follows [41].
where μa and μai are the viscosity of the aqueous phase and the viscosity of component i in the aqueous phase, respectively, mPa·s; n is the component number; xai is the molar fraction of the component i in the aqueous phase; f(xai) is a coefficient of the component i in the aqueous phase. Table 1 and Figure 2 show the detailed fluid and reservoir parameters used in the reservoir simulation model.
From 2006 to 2022, water flooding was used to develop the offshore oilfield. The cumulative oil production was 4 × 10⁶ m3 and the cumulative injection volume of 12 injection wells was 2.02 × 10⁷ m3, respectively. The production model was developed by inputting the production and injection data into CMG STARS. After the aforementioned process, a complete simulation model for discontinuous polymer flooding was developed, which laid a foundation for subsequent optimization processes.
3. Methodology
3.1. Objective Function
In this study, the objective function optimized by the developed PSO–ICA algorithm was the net present value, which was calculated by the following equation [42]:
where NPV is the net present value, 108 $; Rt is the net cash inflow (Benefits) minus cash outflow (Costs) during a period of time (t), 108 $; i is a discount rate; T is the operation time of a discontinuous polymer flooding process, year. The Benefits and Costs of the discontinuous polymer flooding process are calculated by the following equations:
Qcoil and Qdoil are cumulative oil production of continuous and discontinuous polymer flooding process, respectively, t; Poil is the oil price, $/t; Pagc and Pagp are the prices of crosslinker and polymer for the anti-dilution slug, $/t; Pp is the price of polymer for the polymer slug, $/t; Plgc and Plgp are the prices of crosslinker and polymer for the long-acting gel slug, $/t. Magc and Magp are the weight of crosslinker and polymer for the anti-dilution gel slug, $/t; Mp is the weight of polymer for the polymer slug, t; Mlgc and Mlgp are the weight of the crosslinker and polymer for the long-acting gel slug, t. Table 2 shows the parameters used to calculate the NPV.
3.2. PSO–ICA Algorithm
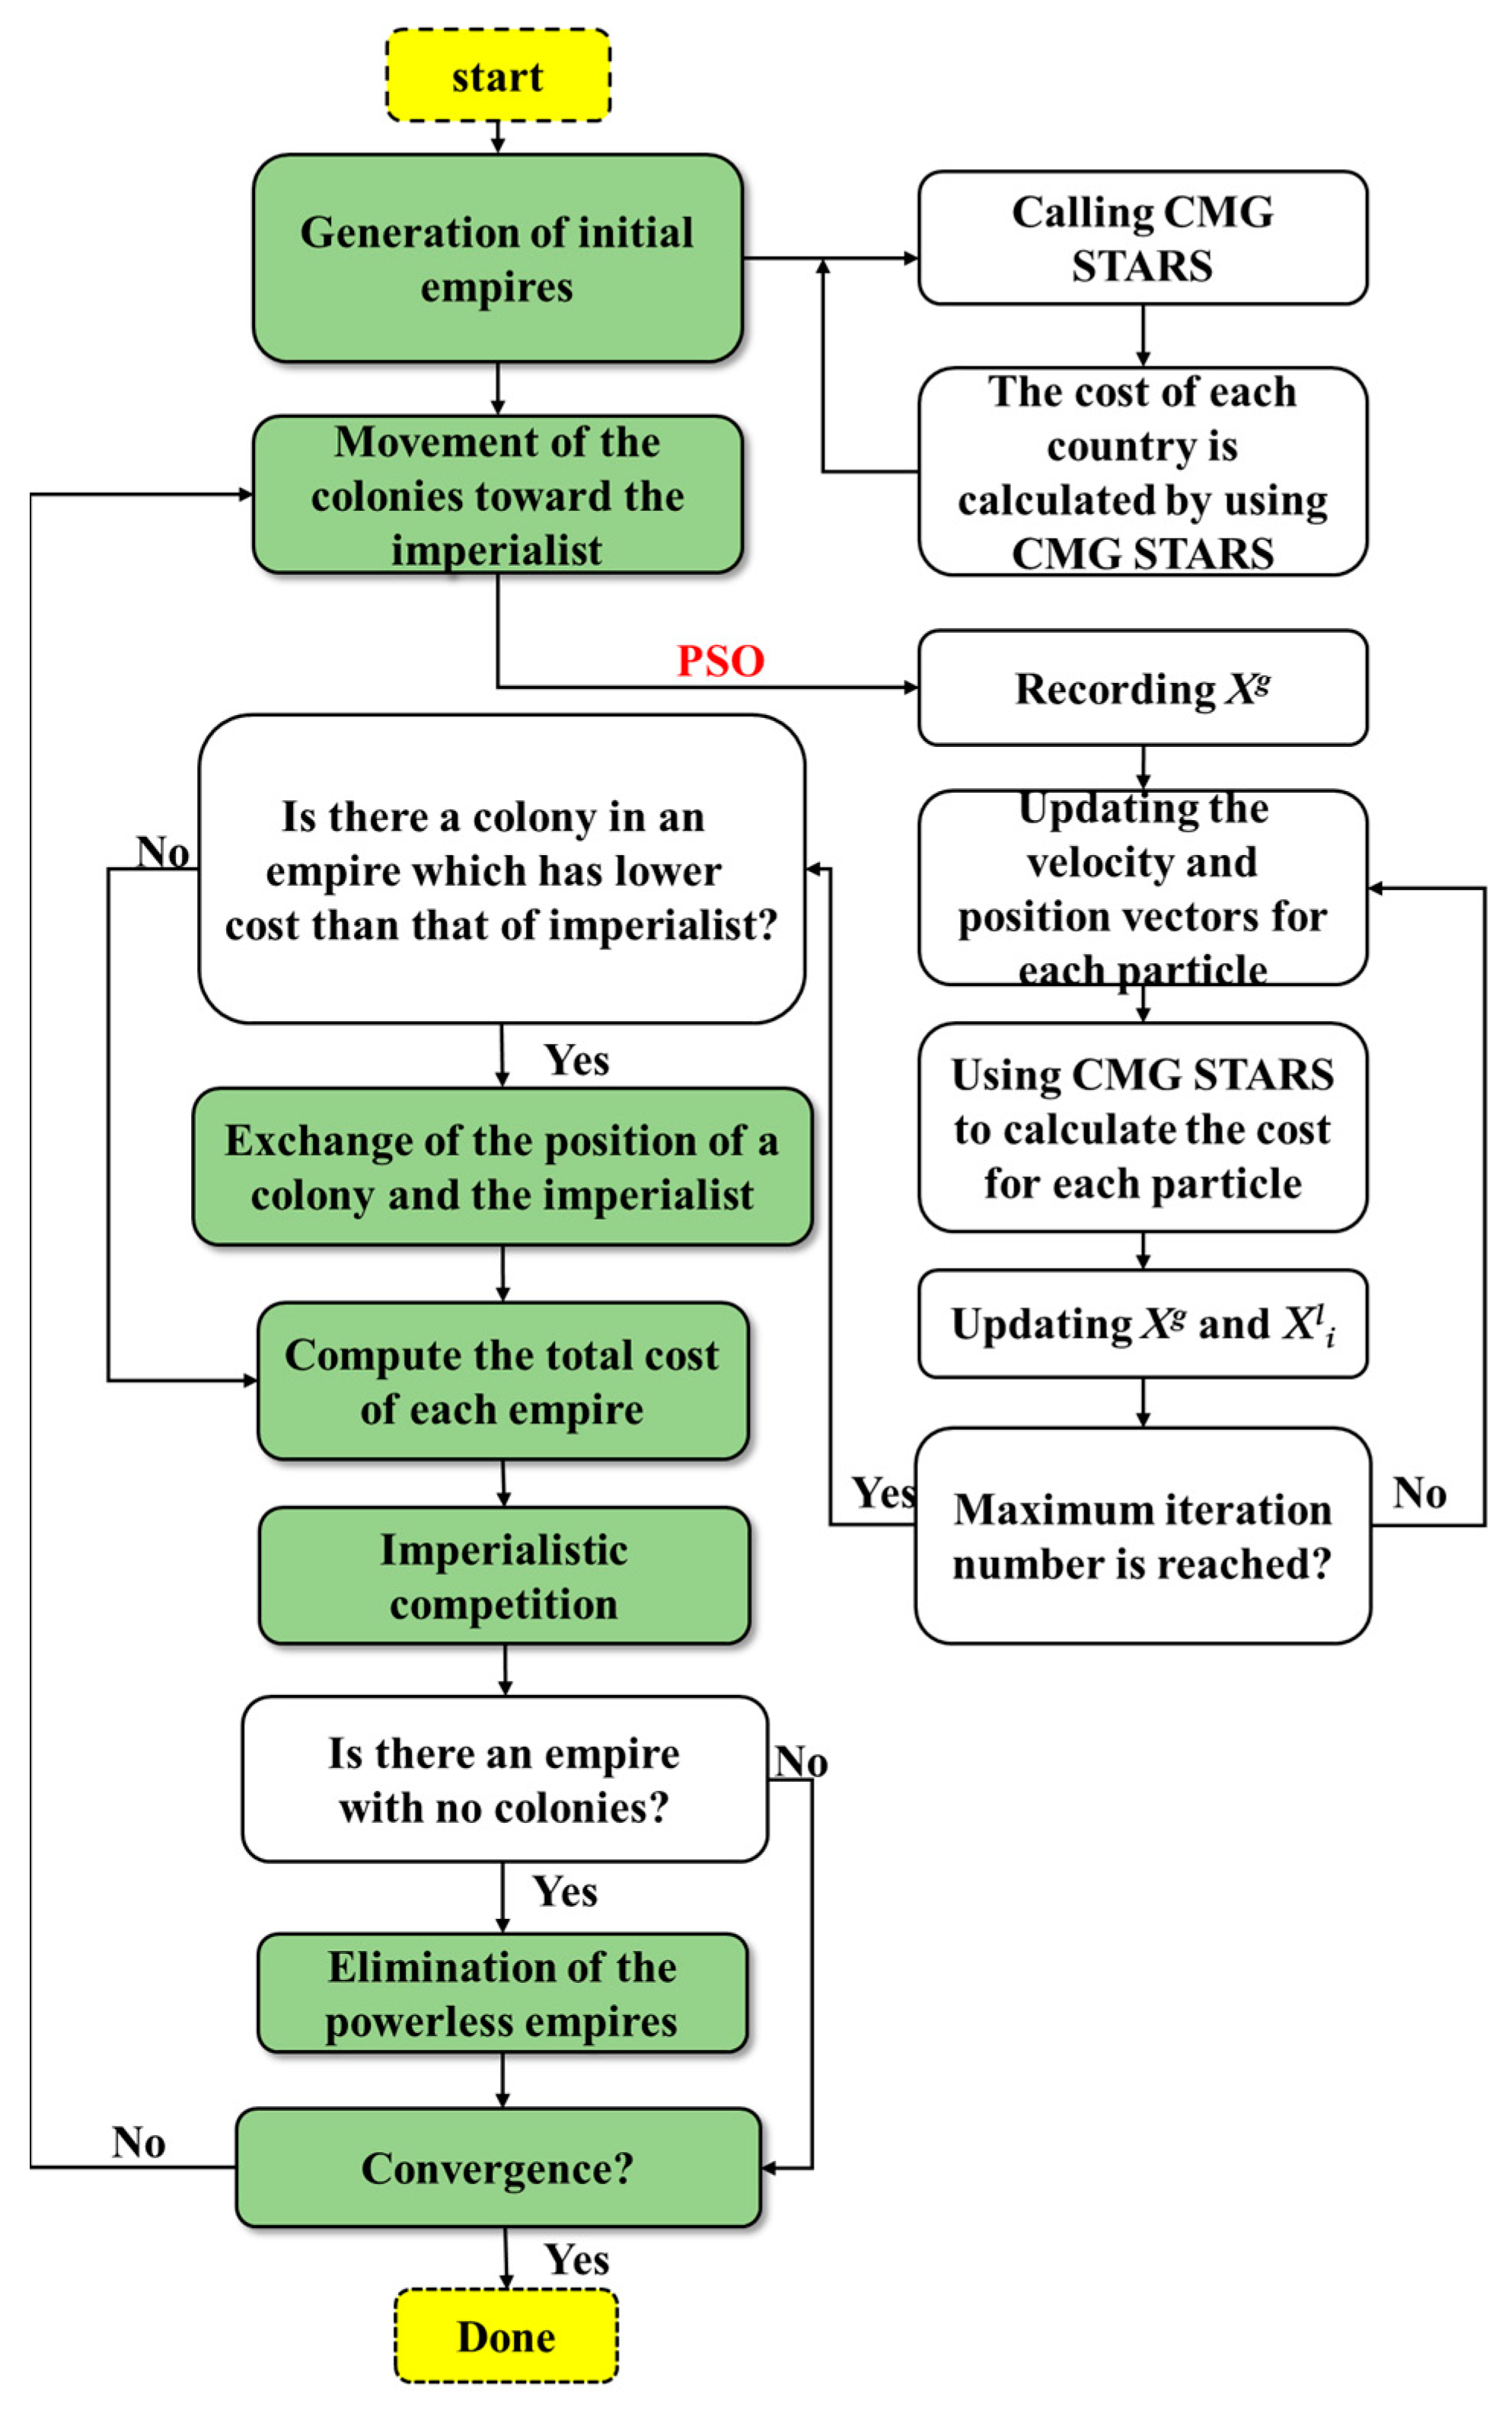
A novel algorithm was developed by combining PSO and ICA algorithms to optimize various operational parameters for discontinuous polymer flooding processes. The establishment process is presented in Figure 3.
- (1)
- Generation of initial empires
During the optimization process, a discontinuous polymer flooding scheme is considered as a country and has Nvar of operational parameters needed to be optimized. Therefore, a country is defined as follows:
Once the values of the operational parameters are given, the cost (the reciprocal of NPV) of each country C can be calculated by using CMG STARS:
To generate an initial empire, Npop of countries is generated. Among the Npop of countries, there are Nimp of imperialist and Ncol of colonies. The relationship between Npop, Nimp, and Ncol satisfies the following equation:
The value of Ncol of an empire depends on its power. The normalized power of each imperialist Pn is obtained by the following:
where cn is the cost of nth imperialist and Cn is the normalized cost of an imperialist.
The initial number of colonies for each empire N.Cn is as follows:
- (2)
- Movement of the colonies toward the imperialist by PSO algorithm
In the traditional ICA, the movement of the colonies toward the imperialist is described by the following equation:
where x is the value of movement; d is the distance between the imperialist and colony; β is a number greater than unity; θ is a random number; γ is a parameter for the deviation from the original direction.
In this study, to enhance the search capability of the traditional ICA algorithm, PSO was introduced into ICA to replace the aforementioned method (Equations (23) and (24)). For the PSO algorithm, a group of particles is distributed as points in the space [43,44,45]. Each particle has the velocity and position vectors, which are defined by the following:
where xiN means the nth operational parameters of discontinuous polymer flooding that need to be optimized at the time step t. A position vector represents a scheme of discontinuous polymer flooding.
For each particle, the NPV is calculated by using CMG STARS based on the position vector. If the NPV of a particle is higher than those of all the previous particles, the position vector of the particle is saved as the best position vector (Xli). If a particle has the highest NPV among all particles in that specific step, its position vector is saved in the global best position vector (Xg). The velocity and position vectors in each step are updated based on the following equations:
where η is the inertia weight; γ1 and γ2 are variables in the range of [0, 1], respectively; α1 and α2 are the cognitive and the social factors, respectively. The aforementioned steps are repeated several times until the maximum iteration number is reached.
- (3)
- Exchange of the position of a colony and the imperialist
After a colony is moved toward the imperialist, the values of the operational parameters are updated and have a higher NPV than these of the previous state. Then, the algorithm continues with the new values of the imperialist and the colonies.
- (4)
- Total power of an empire
The total cost of the nth empire T.Cn is defined as follows:
where ω is a positive number; imperialistn and coloniesn are the total cost of the imperialist and colonies.
- (5)
- Imperialistic competition
All the empires compete with each other based on their power. The empire with the largest power will possess the weakest colonies of the weakest empires.
- (6)
- Elimination of the powerless empires
Because some empires are powerless, their colonies are possessed by other empires during the competition process. An empire will be eliminated when it loses all the colonies.
- (7)
- Convergence
After the competition process, the powerful empire possesses all the colonies and the other empires are eliminated. The algorithm is finished.
4. Results
The developed PSO–ICA algorithm was first analyzed on benchmark functions and compared against ICA and PSO algorithms to evaluate its reliability. Then, the PSO–ICA algorithm was used to optimize the operational parameters of discontinuous polymer flooding to maximize the NPV.
4.1. Validation by Benchmark Functions
The developed PSO–ICA algorithm was analyzed on four benchmark functions. Details of these four functions are shown in Table 3.
Figure 4 shows the analysis results of the PSO-ICA algorithm on four benchmark functions. The individual’s search history shows that the individual searches the main space of the four functions, indicating that the PSO-ICA algorithm has a strong search ability. In addition, the search history is concentrated around the optimal solution (red dot), which means that the PSO-ICA algorithm has a fast convergence speed. An individual’s trajectory shows that the solutions of the four functions have large fluctuations when the iteration number is small (the fluctuation range exceeds 34.15% of the space). However, with the increase in iteration number, the solutions of the four functions tend to be stable. The results proved that the PSO-ICA algorithm has a strong search ability in the function space and can quickly find the optimal solutions. It is noted that the solutions of F1 and F3 become stable and then fluctuate again, meaning that the algorithm jumps out of the locally optimal solution. In addition, Figure 4 shows that the average fitness and best fitness values quickly decrease with the increase in iteration numbers, reflecting that the algorithm has a high convergence speed. In addition, it can be seen from Table 4 that PSO-ICA algorithm has more accurate solutions and less iteration numbers for the four benchmark functions.
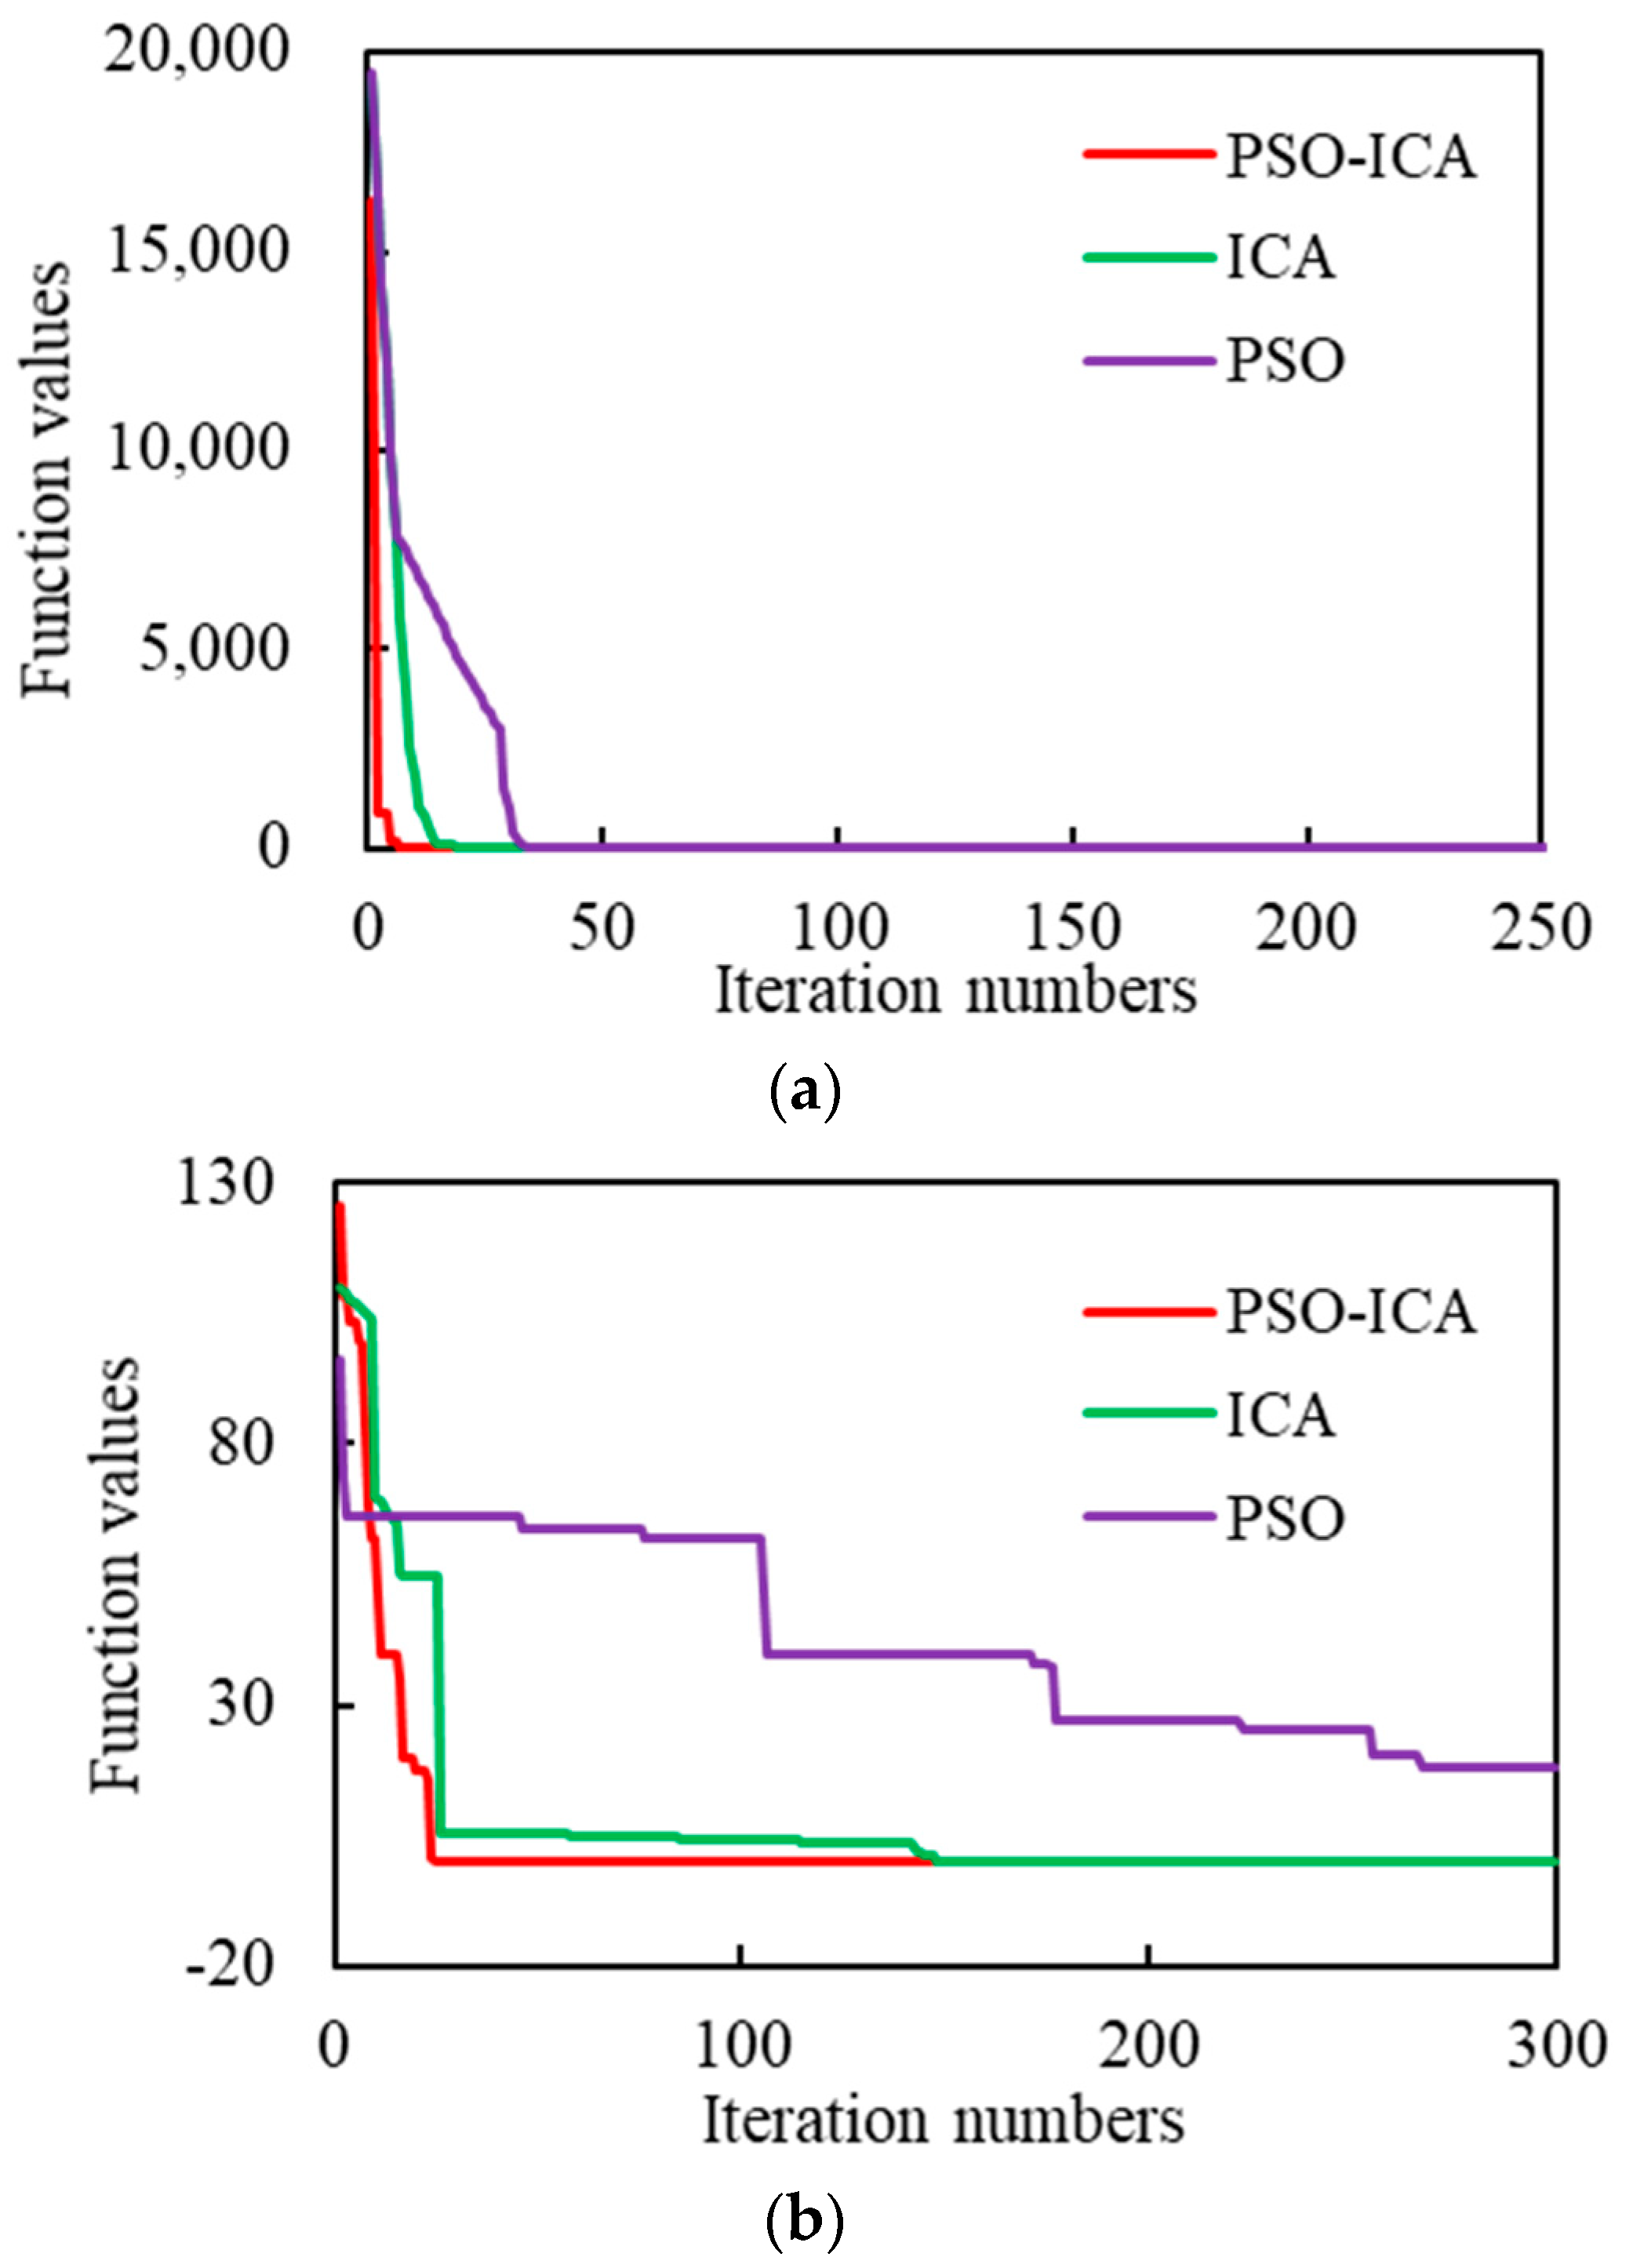
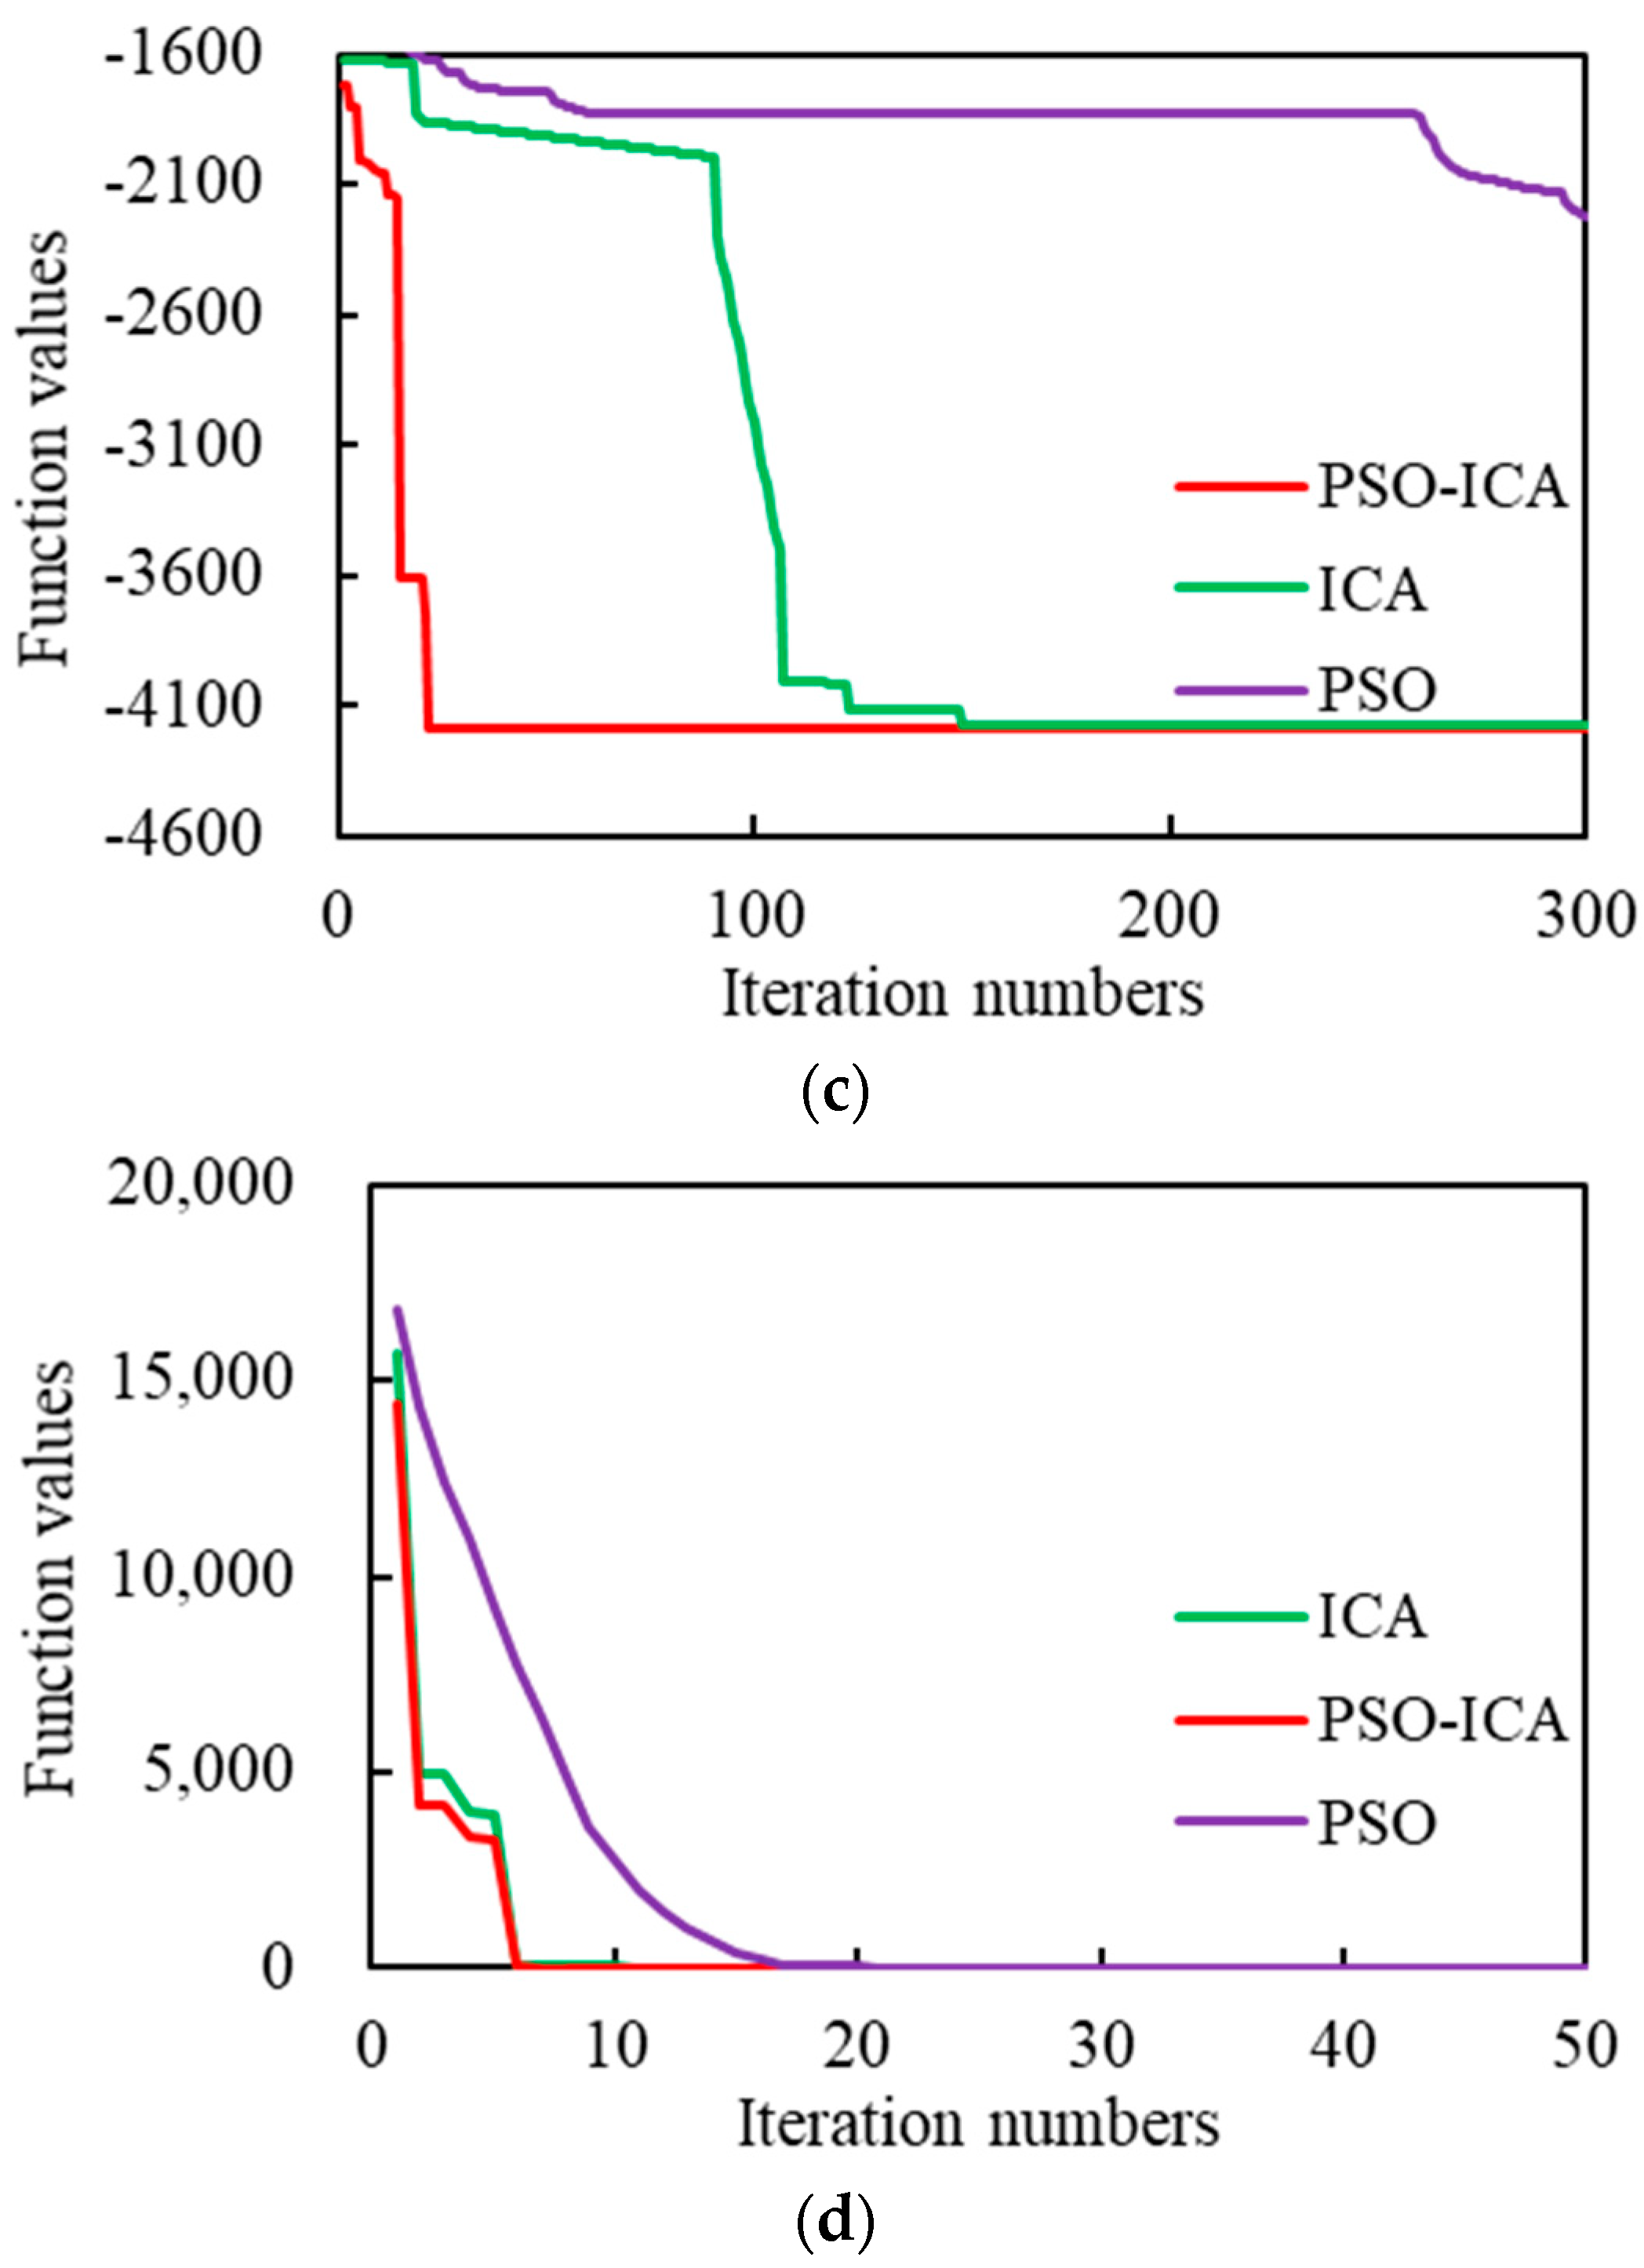
Figure 5 provides a comparison of the convergence rate of the three algorithms. As shown in Figure 5, the convergence rate of the PSO–ICA is the fastest among all the three algorithms. Its better performance is attributed to the introduction of PSO into the ICA, which effectively enhances the search capability of the ICA algorithm and prevents the PSO–ICA from falling into the locally optimal solutions.
4.2. Optimization of Discontinuous Polymer Flooding by the PSO–ICA Algorithm
The PSO–ICA algorithm was used to find the optimal operational parameters of discontinuous polymer flooding. The parameter values used in the algorithm are determined by the sensitivity analysis and shown in Table 5.
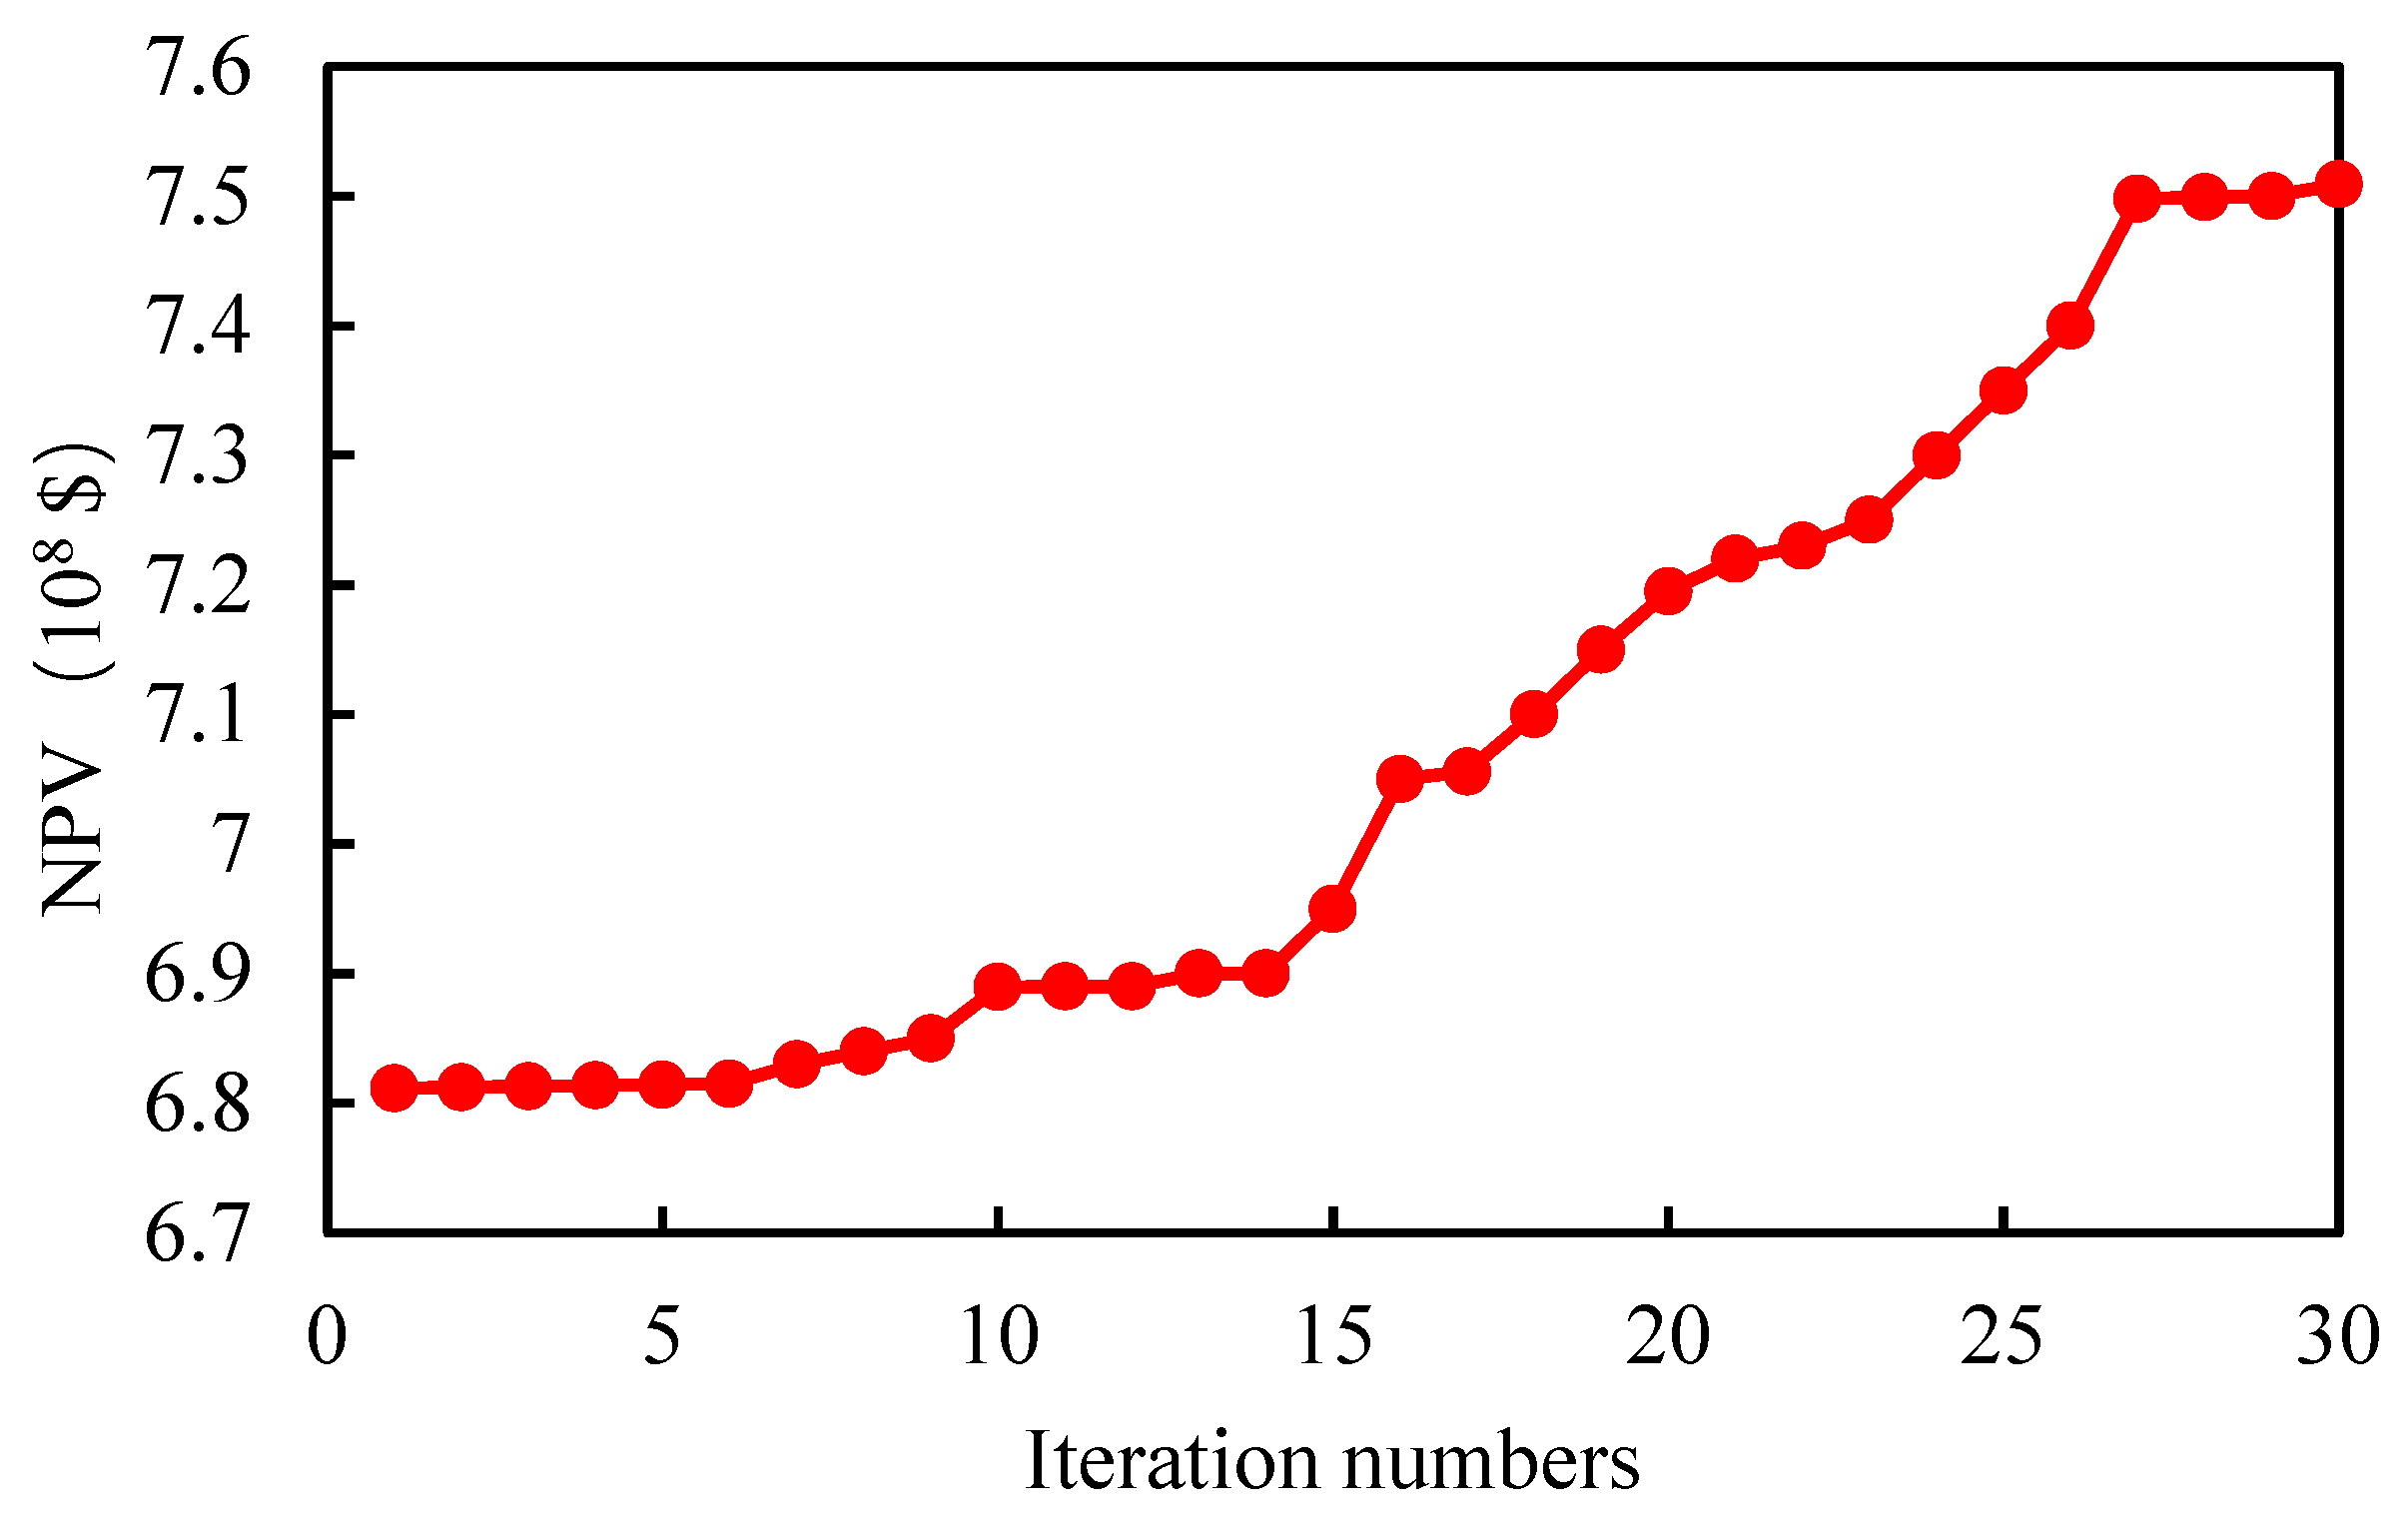
Figure 6 shows the changes of the NPV with iteration numbers during the optimization process. It can be seen from Figure 6 that the NPV increases with the increase in iteration numbers. After 30 iterations, the optimal scheme achieved the highest NPV (7.49 × 10⁸ $).
Figure 7 exhibits the optimization process of the operational parameters of Well P07. The values of the operational parameters are distributed in the entire range at the first iteration. However, after 30 iterations, they are concentrated in the optimal values. Table 6 gives the optimal operational parameters of the 12 injection wells. The results indicate that the PSO–ICA algorithm can be used to determine the optimal operational parameters of discontinuous polymer flooding processes which maximize the NPV.
Figure 8 shows a comparison of performance between the optimal schemes of discontinuous and continuous polymer flooding, indicating that the discontinuous polymer flooding scheme has a higher NPV, a lower water cut, a higher oil production rate, and a lower residual oil saturation. Specially, the NPV value of the optimal scheme of discontinuous polymer flooding reached 7.49 × 10⁸ $, which was an increase of 6% over that of the scheme of continuous polymer flooding. Therefore, discontinuous polymer flooding is an economical and effective method for enhancing oil recovery for offshore oilfields. The main reasons are that the injection of anti-dilution gel and long-acting gel slug effectively sealed the higher-permeability zones, increasing the sweep efficiency of polymer flooding (Figure 8), and the injection of polymer slug with a low concentration decreased the injection pressure and application cost of polymer flooding. In the future, more research including selecting more reasonable parameters of the PSO–ICA algorithm to increase its optimization accuracy and convergence rate, comparing with other available optimization algorithms, and verifying the performance of the optimal scheme of discontinuous polymer flooding in the practical offshore oilfield will be required.
5. Conclusions
- (1)
- The introduction of PSO into ICA effectively enhances the search capability of the ICA and prevents PSO–ICA from falling into local optimum. Therefore, PSO–ICA has lower iteration numbers, higher optimization accuracy, and faster convergence rate than these of PSO and ICA.
- (2)
- The developed PSO–ICA algorithm provides an effective method for optimizing the operational parameters of discontinuous polymer flooding processes by maximizing the NPV value. More applications are needed to further verify the accuracy of the PSO–ICA algorithm.
- (3)
- Compared to continuous polymer flooding, discontinuous polymer flooding has a higher NPV, a higher oil production rate, a lower water cut, and a lower residual oil saturation. The injection of an anti-dilution gel slug, long-acting gel slug, and polymer slug with a low concentration effectively sealed the higher-permeability zones, improved the sweep efficiency of polymer flooding, and decreased the injection pressure and application cost.
- (4)
- The NPV value of the optimal scheme of discontinuous polymer flooding reached 7.49 × 10⁸ $, which is an increase of 6% over that of the scheme of continuous polymer flooding. Discontinuous polymer flooding is an economical and effective method for enhancing oil recovery for offshore oilfields.
Author Contributions
Conceptualization, J.Z.; Methodology, E.T.; Validation, L.L.; Investigation, B.Z.; Resources, Y.J.; Writing—original draft, A.X.; Writing—review & editing, X.S.; Supervision, X.S. All authors have read and agreed to the published version of the manuscript.
Funding
This research was funded by the Key Technologies R&D Program of CNOOC (KJGG2021-0504) and CNOOC Research Institute Limited’s research and development project (No. CCL2022RCPS0553RSN).
Data Availability Statement
The original contributions presented in the study are included in the article, further inquiries can be directed to the corresponding authors.
Conflicts of Interest
Authors Engao Tang, Jian Zhang, Yi Jin and Lezhong Li were employed by the company CNOOC Research Institute Limited. The remaining authors declare that the research was conducted in the absence of any commercial or financial relationships that could be construed as a potential conflict of interest.
References
- Pope, G.A. Recent developments and remaining challenges of enhanced oil recovery. J. Pet. Technol. 2011, 63, 65–68. [Google Scholar] [CrossRef]
- Sheng, J.J.; Leonhardt, B.; Azri, N. Status of polymer-flooding technology. J. Can. Pet. Technol. 2015, 54, 116–126. [Google Scholar] [CrossRef]
- Wang, D.; Cheng, J.; Xia, H.; Li, Q.; Shi, J.P. Viscous-Elastic fluids can mobilize oil remaining after Water-Flood by force parallel to the Oil-Water interface. In Proceedings of the SPE Asia Pacific Improved Oil Recovery Conference, Kuala Lumpur, Malaysia, 8–9 October 2001. [Google Scholar]
- Wei, B.; Romero-Zerón, L.; Rodrigue, D. Oil displacement mechanisms of viscoelastic polymers in enhanced oil recovery (EOR): A review. J. Pet. Explor. Prod. Technol. 2014, 4, 113–121. [Google Scholar] [CrossRef]
- Zhang, K.; Choi, H.J.; Jang, C.H. Turbulent drag reduction characteristics of poly (acrylamide-co-acrylic acid) in a rotating disk apparatus. Colloid. Polym. Sci. 2011, 289, 1821–1827. [Google Scholar] [CrossRef]
- Meter, D.M.; Bird, R.B. Tube flow of non-Newtonian polymer solutions: PART I. Laminar flow and rheological models. AIChE J. 1964, 10, 878–881. [Google Scholar] [CrossRef]
- Dovan, H.T.; Hutchins, R.D.; Terzian, G.A. Dos cuadras offshore polymer flood. In Proceedings of the SPE California Regional Meeting, Ventura, CA, USA, 4–6 April 1990. [Google Scholar]
- Pan, G.M.; Zhang, L.; Huang, J.; Li, H.; Qu, J.F. Twelve years field applications of offshore heavy oil polymer flooding from continuous injection to alternate injection of polymer-water. In Proceedings of the Offshore Technology Conference Asia, Kuala Lumpur, Malaysia, 2–6 November 2020. [Google Scholar]
- Rathinasamy, M.; Chandramouli, S.; Phanindra, K.B.V.N. Estimation of Reservoir Storage Using Artificial Neural Network; Springer: Singapore, 2018; pp. 57–63. [Google Scholar]
- Liu, B.; Bai, B.; Li, Y. Research on preformed gel grains for water shutoff and profile control. Oil Drill. Prod. Technol. 1999, 21, 65–68. (In Chinese) [Google Scholar]
- Bai, B.; Li, Y.; Liu, X. New development of water shutoff and profile control in oilfields in China. Oil Drill. Prod. Technol. 1999, 20, 64–68. (In Chinese) [Google Scholar]
- Bai, B.; Li, L.X.; Liu, Y.Z.; Liu, H.; Wang, Z.G.; You, C.M. Preformed particle gel for conformance control: Factors affecting its properties and applications. SPE Reservoir Eval. Eng. 2007, 10, 415–422. (In Chinese) [Google Scholar] [CrossRef]
- Bai, B.J.; Huang, F.S.; Liu, Y.Z.; Seright, R.S.; Wang, Y.F. Case study on prefromed particle gel for in-depth fluid diversion. In Proceedings of the SPE Symposium on Improved Oil Recovery, Tulsa, OK, USA, 20–23 April 2008. [Google Scholar]
- Tongwa, P.; Nygaard, R.; Bai, B. Evaluation of a nanocomposite hydrogel for water shut-off in enhanced oil recovery applications: Design, synthesis, and characterization. J. Appl. Polym. Sci. 2013, 128, 787–794. [Google Scholar] [CrossRef]
- Tongwa, P.; Nygaard, R.; Bai, B.; Blue, A. Evaluation of potential fracture-sealing materials for remediating CO2 leakage pathways during CO2 sequestration. Int. J. Greenhouse Gas. Control. 2013, 18, 128–138. [Google Scholar] [CrossRef]
- Tongwa, P.; Baojun, B. A more superior preformed particle gel with potential application for conformance control in mature oilfields. J. Pet. Explor. Prod. Technol. 2015, 5, 201–210. [Google Scholar] [CrossRef]
- Claridge, E.L. A method for designing graded viscosity banks. Soc. Pet. Eng. J. 1978, 18, 315–324. [Google Scholar] [CrossRef]
- Zhang, J. Study on discontinuous chemical flooding model of offshore high water cut oilfield. Zhongguo Haishang Youqi 2023, 35, 70–77. (In Chinese) [Google Scholar]
- Standnes, D.C.; Skjevrak, I. Literature review of implemented polymer field projects. J. Pet. Sci. Eng. 2014, 122, 761–775. [Google Scholar] [CrossRef]
- Seright, R.S. How much polymer should be injected during a polymer flood? Review of previous and current practices. SPE J. 2017, 22, 1–18. [Google Scholar] [CrossRef]
- Bagheri, A.; Razeghi, H.R.; Amiri, G.G. Detection and estimation of damage in structures using imperialist competitive algorithm. Noise Control 2012, 19, 405–419. [Google Scholar] [CrossRef]
- Beghi, A.; Cecchinato, L.; Cosi, G.; Rampazzo, M. A PSO-based algorithm for optimal multiple chiller systems operation. Appl. Therm. Eng. 2012, 32, 31–40. [Google Scholar] [CrossRef]
- Shao, W.; Cui, Z.; Cheng, L. Multi-objective optimization of cooling air distributions of grate cooler with different clinker particles diameters and air chambers by genetic algorithm. Appl. Therm. Eng. 2017, 111, 77–86. [Google Scholar] [CrossRef]
- Yang, M.D.; Lin, M.D.; Lin, Y.H.; Tsai, K.T. Multiobjective optimization design of green building envelope material using a non-dominated sorting genetic algorithm. Appl. Therm. Eng. 2017, 111, 1255–1264. [Google Scholar] [CrossRef]
- Sayyafzadeh, M.; Keshavarz, A. Optimisation of gas mixture injection for enhanced coalbed methane recovery using a parallel genetic algorithm. J. Nat. Gas. Sci. Eng. 2016, 33, 942–953. [Google Scholar] [CrossRef]
- Eshraghi, S.E.; Rasaei, M.R.; Zendehboudi, S. Optimization of miscible CO2 EOR and storage using heuristic methods combined with capacitance/resistance and Gentil fractional flow models. Nat. Gas. Sci. Eng. 2016, 32, 304–318. [Google Scholar] [CrossRef]
- Ahmadi, M.A.; Soleimani, R.; Lee, M.; Kashiwao, T.; Bahadori, A. Determination of oil well production performance using artificial neural network (ANN) linked to the particle swarm optimization (PSO) tool. Petroleum 2015, 1, 118–132. [Google Scholar] [CrossRef]
- Dossary, M.A.A.; Nasrabadi, H. Well placement optimization using imperialist competitive algorithm. J. Pet. Sci. Eng. 2016, 147, 237–248. [Google Scholar] [CrossRef]
- Abd-Elazim, S.A.E. Power system stability enhancement via bacteria foraging optimization algorithm. Arabian J. Sci. Eng. 2013, 38, 599–611. [Google Scholar] [CrossRef]
- Abd-Elazim, S.A.E. Imperialist competitive algorithm for optimal statcom design in a multimachine power system. Int. J. Elec. Power. 2016, 76, 136–146. [Google Scholar] [CrossRef]
- Moradifar, A.; Akbari, F.A.; Gorgani, F.K. Comprehensive identification of multiple harmonic sources using fuzzy logic and adjusted probabilistic neural network. Neural Comput. Appl. 2017, 31, 543–556. [Google Scholar] [CrossRef]
- Mortazavi, A.; Khamseh, A.A.; Naderi, B. A novel chaotic imperialist competitive algorithm for production and air transportation scheduling problems. Neural Comput. Appl. 2015, 26, 1709–1723. [Google Scholar] [CrossRef]
- Zandieh, M.; Khatami, A.; Rahmati, S.H.A. Flexible job shop scheduling under condition-based maintenance: Improved version of imperialist competitive algorithm. Appl. Soft Comput. 2017, 58, 449–464. [Google Scholar] [CrossRef]
- Mikaeil, R.; Haghshenas, S.S.; Haghshenas, S.S.; Ataei, M. Performance prediction of circular saw machine using imperialist competitive algorithm and fuzzy clustering technique. Neural Comput. Appl. 2018, 29, 283–292. [Google Scholar] [CrossRef]
- Hosseini, S.; Khaled, A.A.; Vadlamani, S. Hybrid imperialist competitive algorithm, variable neighborhood search, and simulated annealing for dynamic facility layout problem. Neural Comput. Appl. 2014, 25, 1871–1885. [Google Scholar] [CrossRef]
- Bahrami, H.; Faez, K.; Abdechiri, M. Imperialist competitive algorithm using chaos theory for optimization (CICA). In Proceedings of the International Conference on Computer Modelling and Simulation, Cambridge, UK, 24–26 March 2010. [Google Scholar]
- Abdechiri, M.; Faez, K.; Bahrami, H. Neural network learning based on chaotic imperialist competitive algorithm. In Proceedings of the 2010 2nd International Workshop on Intelligent Systems and Applications, Wuhan, China, 7 June 2010. [Google Scholar]
- Abdechiri, M.; Faez, K.; Bahrami, H. Adaptive imperialist competitive algorithm (AICA). In Proceedings of the 9th IEEE International Conference on Cognitive Informatics (ICCI’10), Beijing, China, 7–9 July 2010. [Google Scholar]
- Khaled, A.A.; Hosseini, S. Fuzzy adaptive imperialist competitive algorithm for global optimization. Neural Comput. Appl. 2015, 26, 813–825. [Google Scholar] [CrossRef]
- Gao, S.L.; Chen, Y.; Wang, X.; Li, S.Q.; Yan, S.G.; Hou, B.F. Research on dynamic performance of anti-polymer adsorbent in Henan oilfield. Dangdai Huagong 2021, 50, 2170–2175. (In Chinese) [Google Scholar]
- Zhang, P.; Tan, X.; Yang, R.; Yang, R.F.; Zheng, W.; Zhang, X.L.; Xie, H.J.; Sun, X.F. Numerical Simulations of Nitrogen Foam and Gel-Assisted Steam Flooding for Offshore Heavy Oil Reservoirs. J. Porous Media 2023, 26, 17–32. [Google Scholar] [CrossRef]
- Zandvliet, M.J.; Handels, M.; Van, E.G.M.; Brouwer, D.R.; Jansen, J.D. Adjoint-based well-placement optimization under production constraints. SPE J. 2008, 13, 392–399. [Google Scholar] [CrossRef]
- Askarzadeh, A. Comparison of particle swarm optimization and other metaheuristics on electricity demand estimation: A case study of Iran. Energy 2014, 72, 484–491. [Google Scholar] [CrossRef]
- Ahirwal, M.K.; Kumar, A. Singh G K. Analysis and testing of PSO variants through application in EEG/ERP adaptive filtering approach. Open Biomed. Eng. Lett. 2012, 2, 186–197. [Google Scholar] [CrossRef]
- Atif, E.A.; Ibrahim, M.A.; Shehata, O.M. Performance evaluation of PSO-PID and PSO-FLC for continuum robot’s developed modeling and control. Sci. Rep. 2024, 14, 733. [Google Scholar]
Figure 1.
Three-dimensional reservoir model of the typical offshore oilfield.

Figure 2.
The relative permeabilities of (a) oil-water and (b) gas-fluid.

Figure 3.
The establishment process of PSO–ICA algorithm.

Figure 4.
The analysis results of the PSO-ICA algorithm on the four benchmark functions.

Figure 5.
Comparisons of the convergence rate between PSO–ICA, PSO, and ICA on (a) F1, (b) F2, (c) F3, and (d) F4.
Figure 5.
Comparisons of the convergence rate between PSO–ICA, PSO, and ICA on (a) F1, (b) F2, (c) F3, and (d) F4.


Figure 6.
Changes of NPV with iteration numbers.

Figure 7.
The optimization process of the operational parameters for well P07: (a) polymer concentration of anti-dilution gel slug, (b) polymer concentration of polymer slug, (c) polymer concentration of long-acting gel slug, (d) size of the anti-dilution gel slug, (e) size of polymer slug, (f) size of long-acting gel slug, (g) injection timing of long-acting gel slug, (h) injection timing of polymer slug with low concentrations, (i) size of polymer slug with low concentrations, and (j) polymer concentration of polymer slug with low concentrations.


Figure 8.
A comparison of performance between the optimal scheme of discontinuous and continuous polymer flooding: (a) NPV, (b) oil production rate and water cut, (c) residual oil saturation distribution, and (d) chemical streamlines distribution.
Figure 8.
A comparison of performance between the optimal scheme of discontinuous and continuous polymer flooding: (a) NPV, (b) oil production rate and water cut, (c) residual oil saturation distribution, and (d) chemical streamlines distribution.


Table 1.
The detailed fluid and reservoir parameters.
| Reservoir Properties | Values |
| Average depth (m) | 1731.74 |
| Average reservoir porosity (%) | 16.1 |
| Average reservoir permeability (mD) | 440.7 |
| Reservoir pressure (kPa) | 101 |
| Reservoir temperature (°C) | 70 |
| Rock compressibility (1/kPa) | 10−4 |
| Average oil saturation (%) | 56 |
| Fluid properties | Values |
| Oil density (kg/m3) | 838 |
| Oil viscosity (mPa·s) | 1.9478 |
| Residual resistance factor | 1.3 |
| Inaccessible pore volume | 0.3 |
| ADMAXT of polymer (gmole/m3) | 6.26 |
| ADMAXT of anti-dilution gel (gmole/m3) | 8.25 |
| ADMAXT of long-acting gel (gmole/m3) | 6.60 |
| The half-life of the polymer solution (day) | 1040 |
| Results of the polymer adsorption experiment | |
| Mole fraction of polymer (%) | Adsorption capacity (gmole/m3) |
| 0 | 0 |
| 0.0005 | 5.43 |
| 0.001 | 5.94 |
| 0.0015 | 6.18 |
| 0.002 | 6.25 |
| Results of the anti-dilution gel adsorption experiment | |
| Mole fraction of Anti-dilution gel (%) | Adsorption capacity (gmole/m3) |
| 0 | 0 |
| 0.0005 | 7.43 |
| 0.001 | 7.94 |
| 0.0015 | 8.18 |
| 0.002 | 8.25 |
| Results of the long-acting gel adsorption experiment | |
| Mole fraction of Long-acting gel (%) | Adsorption capacity (gmole/m3) |
| 0 | 0 |
| 0.0005 | 5.94 |
| 0.001 | 6.35 |
| 0.0015 | 6.54 |
| 0.002 | 6.60 |
Table 2.
The parameters used to calculate the NPV.
| Parameters | Values |
|---|---|
| Pagp ($/t) | 2781 |
| Pagc ($/t) | 2503 |
| Pp ($/t) | 2781 |
| Plgp ($/t) | 2781 |
| Plgc ($/t) | 2503 |
| Poil ($/t) | 443 |
Table 3.
Description of the four benchmark functions.
| Function Name | Function Equation | Dimensions | Definition Domain | Optimal Solution |
|---|---|---|---|---|
| F1 | 10 | [−100, 100] | 0 | |
| F2 | 10 | [−5.12, 5.12] | 0 | |
| F3 | 10 | [−500, 500] | −4190 | |
| F4 | 10 | [−100, 100] | 0 |
Table 4.
Comparison of PSO-ICA with PSO and ICA on the four benchmark functions.
| Algorithm | F1 | F2 | F3 | F4 | ||||
|---|---|---|---|---|---|---|---|---|
| Solutions | Iteration Numbers | Solutions | Iteration Numbers | Solutions | Iteration Numbers | Solution | Iteration Numbers | |
| ICA | 10−1 | 62 | 10−3 | 147 | −2221.74 | 150 | 2.5 × 10−144 | 12 |
| PSO | 10−5 | 265 | 17.81 | >300 | −4170.25 | >300 | 0.000742 | 18 |
| PSO–ICA | 10−13 | 3 | 10−14 | 20 | −4189.794 | 21 | 2.08 × 10−140 | 10 |
Table 5.
Parameters used in the PSO-ICA algorithm.
| Parameters | Values |
|---|---|
| Npop | 10 |
| Nimp | 5 |
| Ncol | 5 |
| ƞ | 0.5 |
| α1, α2 | 2 |
| γ1 | 0.8 |
| γ2 | 0.75 |
| ω | 0.1 |
Table 6.
The optimal operational parameters of the 12 injection wells.
| Well Name and Operational Parameters | Polymer Concentration of Anti-Dilution Gel Slug (mg/L) | Polymer Concentration of Polymer Slug (mg/L) | Polymer Concentration of Long-Acting Gel Slug (mg/L) | Size of the Anti-Dilution Gel Slug (day) | Size of Polymer Slug (year) | Size of Long-Acting Gel Slug (day) | Injection Timing of Long-Acting Gel Slug (day) | Polymer Concentration of Polymer Slug with Low Concentrations (mg/L) | Size of Polymer Slug with Low Concentrations (day) | Injection Timing of Polymer Slug with Low Concentrations (day) | Polymer Concentration of Anti-Dilution Gel Slug (mg/L) | Polymer Concentration of Polymer Slug (mg/L) |
|---|---|---|---|---|---|---|---|---|---|---|---|---|
| P07 | 3684 | 1136 | 1939 | 28 | 3 | 45 | 875 | 545 | 49 | 778 | 3684 | 1136 |
| P09 | 1505 | 1200 | 1768 | 21 | 5 | 25 | 821 | 550 | 45 | 722 | 1505 | 1200 |
| P11 | 3035 | 1407 | 1872 | 40 | 6 | 60 | 1429 | 564 | 55 | 1330 | 3035 | 1407 |
| P16 | 2293 | 800 | 1735 | 39 | 3 | 29 | 421 | 588 | 52 | 336 | 2293 | 800 |
| P18 | 1864 | 1458 | 1927 | 20 | 4 | 47 | 1183 | 603 | 41 | 1100 | 1864 | 1458 |
| P19 | 3921 | 992 | 1888 | 39 | 3 | 59 | 1171 | 618 | 53 | 1079 | 3921 | 992 |
| P21 | 3056 | 1337 | 1747 | 41 | 3 | 20 | 900 | 629 | 42 | 807 | 3056 | 1337 |
| P23 | 2759 | 864 | 1554 | 32 | 4 | 48 | 1032 | 634 | 58 | 940 | 2759 | 864 |
| I14 | 2821 | 1566 | 1500 | 38 | 3 | 52 | 1118 | 662 | 41 | 1022 | 2821 | 1566 |
| I26 | 3201 | 1183 | 1735 | 37 | 4 | 35 | 2108 | 677 | 41 | 2022 | 3201 | 1183 |
Disclaimer/Publisher’s Note: The statements, opinions and data contained in all publications are solely those of the individual author(s) and contributor(s) and not of MDPI and/or the editor(s). MDPI and/or the editor(s) disclaim responsibility for any injury to people or property resulting from any ideas, methods, instructions or products referred to in the content. |
© 2024 by the authors. Licensee MDPI, Basel, Switzerland. This article is an open access article distributed under the terms and conditions of the Creative Commons Attribution (CC BY) license (https://creativecommons.org/licenses/by/4.0/).
Share and Cite
MDPI and ACS Style
Tang, E.; Zhang, J.; Jin, Y.; Li, L.; Xia, A.; Zhu, B.; Sun, X. Optimization of Discontinuous Polymer Flooding Processes for Offshore Oilfields Using a Novel PSO–ICA Algorithm. Energies 2024, 17, 1971. https://doi.org/10.3390/en17081971
AMA Style
Tang E, Zhang J, Jin Y, Li L, Xia A, Zhu B, Sun X. Optimization of Discontinuous Polymer Flooding Processes for Offshore Oilfields Using a Novel PSO–ICA Algorithm. Energies. 2024; 17(8):1971. https://doi.org/10.3390/en17081971
Chicago/Turabian StyleTang, Engao, Jian Zhang, Yi Jin, Lezhong Li, Anlong Xia, Bo Zhu, and Xiaofei Sun. 2024. "Optimization of Discontinuous Polymer Flooding Processes for Offshore Oilfields Using a Novel PSO–ICA Algorithm" Energies 17, no. 8: 1971. https://doi.org/10.3390/en17081971
Note that from the first issue of 2016, this journal uses article numbers instead of page numbers. See further details here.