
Efficiency and Mergers and Acquisitions of Electric Utility Companies


1
School of Environment and Society, Tokyo Institute of Technology, 3-3-6 Shibaura, Minato-ku, Tokyo 108-0023, Japan
2
The Center for Economic Research, Shandong School of Development, Shandong University, Jinan 250100, China
*
Author to whom correspondence should be addressed.
Energies 2024, 17(8), 1972; https://doi.org/10.3390/en17081972
Submission received: 25 December 2023
/
Revised: 31 March 2024
/
Accepted: 19 April 2024
/
Published: 22 April 2024
(This article belongs to the Section C: Energy Economics and Policy)
Abstract
:Since the 1990s, market liberalization of the electricity industry has advanced all around the world. To survive in the drastically changing business environment, incumbent electric utility companies have conducted operational reforms, including Mergers and Acquisitions (M&As), to enhance and/or complement existing business capabilities. The purpose of this study was to measure the operational efficiencies of 31 of the world’s largest electric utility companies using data from 2010 to 2020 and examine regional differences in and the impacts of M&As on the efficiencies. For this purpose, we applied a new type of Data Envelopment Analysis (DEA) and Tobit model regression. We provide findings from the empirical analyses and discuss the business implications of M&As for electric utility companies. The operational efficiency measures were different among regions, but did not show statistically significant changes over the study period from 2010 to 2020. Furthermore, the results of regression analyses indicate that the increasing number of M&A buying transactions and M&A total transactions has a negative marginal impact on the operational efficiency or leads to a lower operational efficiency for utility companies. Since electricity utility companies have not received gains in operational efficiency from increasing the number of M&A transactions, they need to be more cautious about whether M&A transactions can provide value to the operation and technology management.
1. Introduction
Operational efficiency represents a fundamental capability of business entities for surviving in a competitive environment. After the global trend of market reforms in the energy industry, most electric power companies made managerial efforts to adapt to a new competitive environment. Large incumbent electric power companies are not exceptions to the trend, and they have conducted dramatic structural reforms through the separation of the transmission and distribution network divisions from the generation division and the creation of wholesale power markets for power trading. Mergers and Acquisitions (M&As) of energy utility firms are also structural reforms that can be conducted in a liberalized market.
The vertical separation of utility firms is often required in order to follow governmental deregulation policy, while M&As are more proactive managerial strategies that firms can use to obtain a competitive edge by expanding and complementing existing business lines. Moreover, leading companies with a large amount of capital strategically acquire new technologies through M&As in their core fields in generation, transmission, and distribution and retail sectors to prepare for future innovative businesses. As stated in [1], energy utilities are increasingly using M&As to search for growth opportunities under various complex factors, shift toward green energy and cope with sustainability issues, change their business model to a sustainable one, and conduct or supplement their own research and development (R&D) of new technologies and innovations.
Although M&As are important from the perspective of business growth and enhancing innovation, we need to point out that no previous studies have examined the quantitative impacts of M&As on the operational efficiency of electric utility firms. Exploring the relationship between operational efficiency and M&As is an interesting topic because it is reasonable to expect that M&As may enhance operational efficiency through various paths, such as improvements in financial performance and reductions in the cost of business operations. Refs. [2,3,4] examined the effects of the utility industry’s M&As on financial performance, although the datasets they used for their empirical analyses did not cover recent changes in the industry, such as the development of market liberalization and the changing trends in and purposes of M&As. Ref. [5] examined M&A value creation using relatively recent data; however, their study included both utility companies and other infrastructure companies. This means that there is a critical gap between our academic knowledge of and the recent business trend in electric power utilities regarding the influence of M&As on operational efficiency.
This study aimed to examine the impacts of changes in the business environment on electric power companies, focusing on M&A transactions and operational efficiency. The reason why we focused on M&As is because we assume that these companies use M&As as a tool for facilitating innovation by obtaining new technologies and businesses. In addition, we focused on the assessment of the corporate performance of large-scale electric power utilities for two reasons. First, large-scale incumbent utilities hold a significant number of capital assets and supply electricity to many consumers. Second, these companies face serious competition from new entrants due to the transition of the industry from traditional to new business models (see [6,7] for global trends in electricity market reform). To investigate the issue, we employed a new approach that combines efficiency measures, statistical tests, and a regression model. These analyses provide new insights into the literature on the electricity industry’s M&As and operational efficiency.
The structure of the remainder of this paper is as follows. Section 2 briefly reviews the international trend in electricity market liberalization and looks at the literature on the analysis of the efficiency and M&As of energy utility companies. Section 3 describes the methodological framework used in this study and provides the three hypotheses that we empirically investigated. Section 4 provides a dataset. Section 5 presents and discusses the empirical results obtained in this study. Section 6 summarizes this study and provides future research directions.
The abbreviations used in this paper are as follows: AI, artificial intelligence; DEA, data envelopment analysis; DMU, decision-making unit; EBITDA, earnings before interest, taxes, depreciation, and amortization; EU, European Union; EWG, exempt wholesale generator; IPP, independent power producer; ISO, independent system operator; M&As, Mergers and Acquisitions; OE, operational efficiency; OI, operational inefficiency; R&D, research and development; RTO, regional transmission organization; RTS, return to scale; PUHCA, Public Utility Holding Company Act; TEV, total enterprise value.
2. Background and Literature Review
2.1. Background
We briefly review the international trend in the market liberalization of the electricity industry in three regions, i.e., Europe, the United States (US), and Asia. The European Union (EU) advanced the liberalization of internal gas and electricity markets in stages. The EU adopted the First Energy Package for the European single market in 1996 for electricity and in 1998 for gas. They were transposed into Member States’ legal systems by 1998 (electricity) and 2000 (gas). The Second Energy Package was adopted in 2003. The directives were transposed into the national law of the Member States by 2004. In the retail market’s liberalization, industrial and domestic consumers were given the option to choose their own gas and electricity suppliers from not only incumbent but also new companies that competed with each other. In April of 2009, the Third Energy Package was adopted to further promote the liberalization of the internal energy market. In June of 2019, the Fourth Energy Package was adopted to introduce new electricity market rules to meet the need for renewable energies and attract investments. Ref. [8] looked at the evidence of the impact of the European single market in electricity on prices, the security of supply, the environment, and innovation. The study found that there has been significant market harmonization and integration, whereas the measured benefits are likely to be small due to the large increase in subsidized renewable energy generation that has been driven by the decarbonization agenda.
In the US, the Energy Policy Act of 1992 established a new type of IPP known as an exempt wholesale generator (EWG). The EWGs were exempt from regulation under the Public Utility Holding Company Act (PUHCA) of 1935, so they could own and operate power plants and sell electricity in the wholesale power market. Orders 888 and 889 were issued in 1996 to further promote market liberalization through the functional separation of generation and transmission and provide open access to the transmission network. Further, Order 2000 was issued to facilitate the energy market’s liberalization by creating independent system operators (ISOs) and regional transmission organizations (RTOs). Contrary to the federal-level deregulation procedure, the introduction of competition to the retail market has been pursued by individual states. As of 2024, 13 of the 50 US states and Washington D.C. have implemented full retail liberalization. The electric utilities in the US operate under a variety of market structures, depending upon the states in which they operate.
Finally, Asian countries followed the trend of Western countries and liberalized their energy utility markets. In Japan, for example, high electricity costs as well as internal and external price differences became a policy issue in the 1990s. In this context, the Electricity Business Act was amended in 1995, 31 years after the previous amendment of the law, in order to incorporate the principle of competition and other measures. Japan’s electricity industry gradually implemented market liberalization under governmental control and the speed of the reform was accelerated after the Fukushima Daiichi nuclear accident. In April of 2016, Japan introduced a licensing system for generation, transmission, and distribution networks and retail business sectors. Japan also implemented full retail liberalization, including for residential consumers. Two years later, in April of 2018, the gas retail market was fully liberalized. As of today, over 700 new retail electric power companies have been registered in the Japanese market. According to [9,10], China has been conducting electricity market reforms since the State Council’s 2015 “Document 9” and subsequent regulatory documents and creating wholesale power markets. The market reform continues to regulate transmission and distribution network companies and has been gradually liberalizing the wholesale and retail electricity sectors, whose prices used to be determined by the government. As in the other economies, China’s electricity industry reform aims to achieve a more market-based environment and allow for the engagement of private investments in the power sector.
2.2. The Literature on Efficiency Analysis of Electric Power Utilities
Next, we summarize previous studies that examined various efficiencies (e.g., operational, managerial, and financial) and the combined efficiencies of electric power utility companies. Since we used DEA for the empirical model, we first refer to [11], who reviewed a research trend in efficiency analysis applied to energy and environmental issues using DEA from 693 articles published during the period 1980–2010. DEA is a popular method for holistic efficiency assessment and is based on mathematical programming. Although the study’s focus was placed on the DEA methodology and its applications, it also compares DEA with other methodologies such as econometric analyses and survey papers.
The research indicates that the productivity and efficiency of the electricity industry have been popular research topics since the 1980s, a relatively early period of research on DEA as applied to energy and the environment. A reason for the popularity during the early period of DEA research was the availability of a well-organized operational and financial database because the industry has historically been regulated by local or central governments. In particular, relatively long time-series operational datasets on the electricity industry have been available in a stable manner to researchers from public domains. Under such governmental regulations, “X-inefficiency” was a well-known problem among researchers that could arise in regulated companies because of a lack of market discipline, which usually functions in firms under market competition conditions [12]. Therefore, efficiency assessment and control under regulation were important issues to electric power companies and helped them prevent the occurrence of inefficiencies. The assessment was also useful to regulatory agencies when considering how to prepare effective regulation schemes.
Under the process of deregulation, the transmission/distribution network was unbundled from electricity generation in order to promote fair competition among incumbent utilities and new entrants. The governmental regulations remained in the transmission/distribution network sectors, while other businesses, such as the electricity generation and retail sectors, were liberalized and market competition was introduced in these sectors. This brought about changes in research interests for the energy sector, wherein the research trend gradually shifted away from the efficiency analysis of a company as a whole to that of individual sectors for generation, transmission, distribution, and retail. This trend can be observed in [11], in which the increase in published papers for total utility operations is modest compared with that for the generation and network sectors. For example, many researchers have devoted their efforts to the efficiency analysis of electric power plants, focusing on the generation sector. These researchers include [13,14,15,16]. Moreover, studies on individual technologies for energy conservation, renewable energy sources, and environmental protection and sustainability have gained momentum and become the most popular research topics. For example, studies on companies’ performance with respect to renewable energy sources include [17,18,19,20,21,22,23,24].
2.3. The Literature on the M&As of Electric Power Utilities
Recognizing the recent trend in the prior literature, however, we need to point out that the assessment of the corporate performance of large-scale electric power utilities is of interest to us from two perspectives. First, large-scale incumbent utilities hold a significant number of capital assets and supply electricity to many consumers. Thus, their operations still significantly influence consumers’ costs and benefits. Second, they face serious competition from new entrants due to the transition of the industry from traditional to new business models. To establish new utility business models, they have been acquiring new technologies in green business, energy storage, AI, smart energy, smart operations, platform operations, and big data processing, e.g., as discussed in [1,25,26,27,28,29,30,31], through innovation and competitive strategies. Such strategies often appear in companies’ R&D expenses and patent applications. In addition, the management of large-scale utilities influences funding, M&As, and strategic alliances with venture capital businesses that hold these new technologies. This study analyzes the relationship between the operational efficiency of utility companies and M&A behavior. This is because M&As that buy new businesses are a clear measure of energy companies’ efforts to improve their performance and create new value from innovation.
2.4. Purpose of the Study
Market liberalization and regulatory changes have rapidly occurred all around the world and inevitably influenced the management strategy of electricity utility companies. However, as stated earlier, few studies have examined the impacts of these changes on large-scale electric power utilities, particularly from the perspective of impacts on operational efficiency. Further, as stated in [32,33,34], merger proponents and opponents hold different opinions on efficiency gains from M&As, and conflicting evidence has been produced. This study investigates the impacts of changes in the business environment on the operational efficiency of electric power companies, particularly focusing on M&A transactions as a tool for facilitating innovation and the resulting regional differences among companies.
3. Methodological Framework
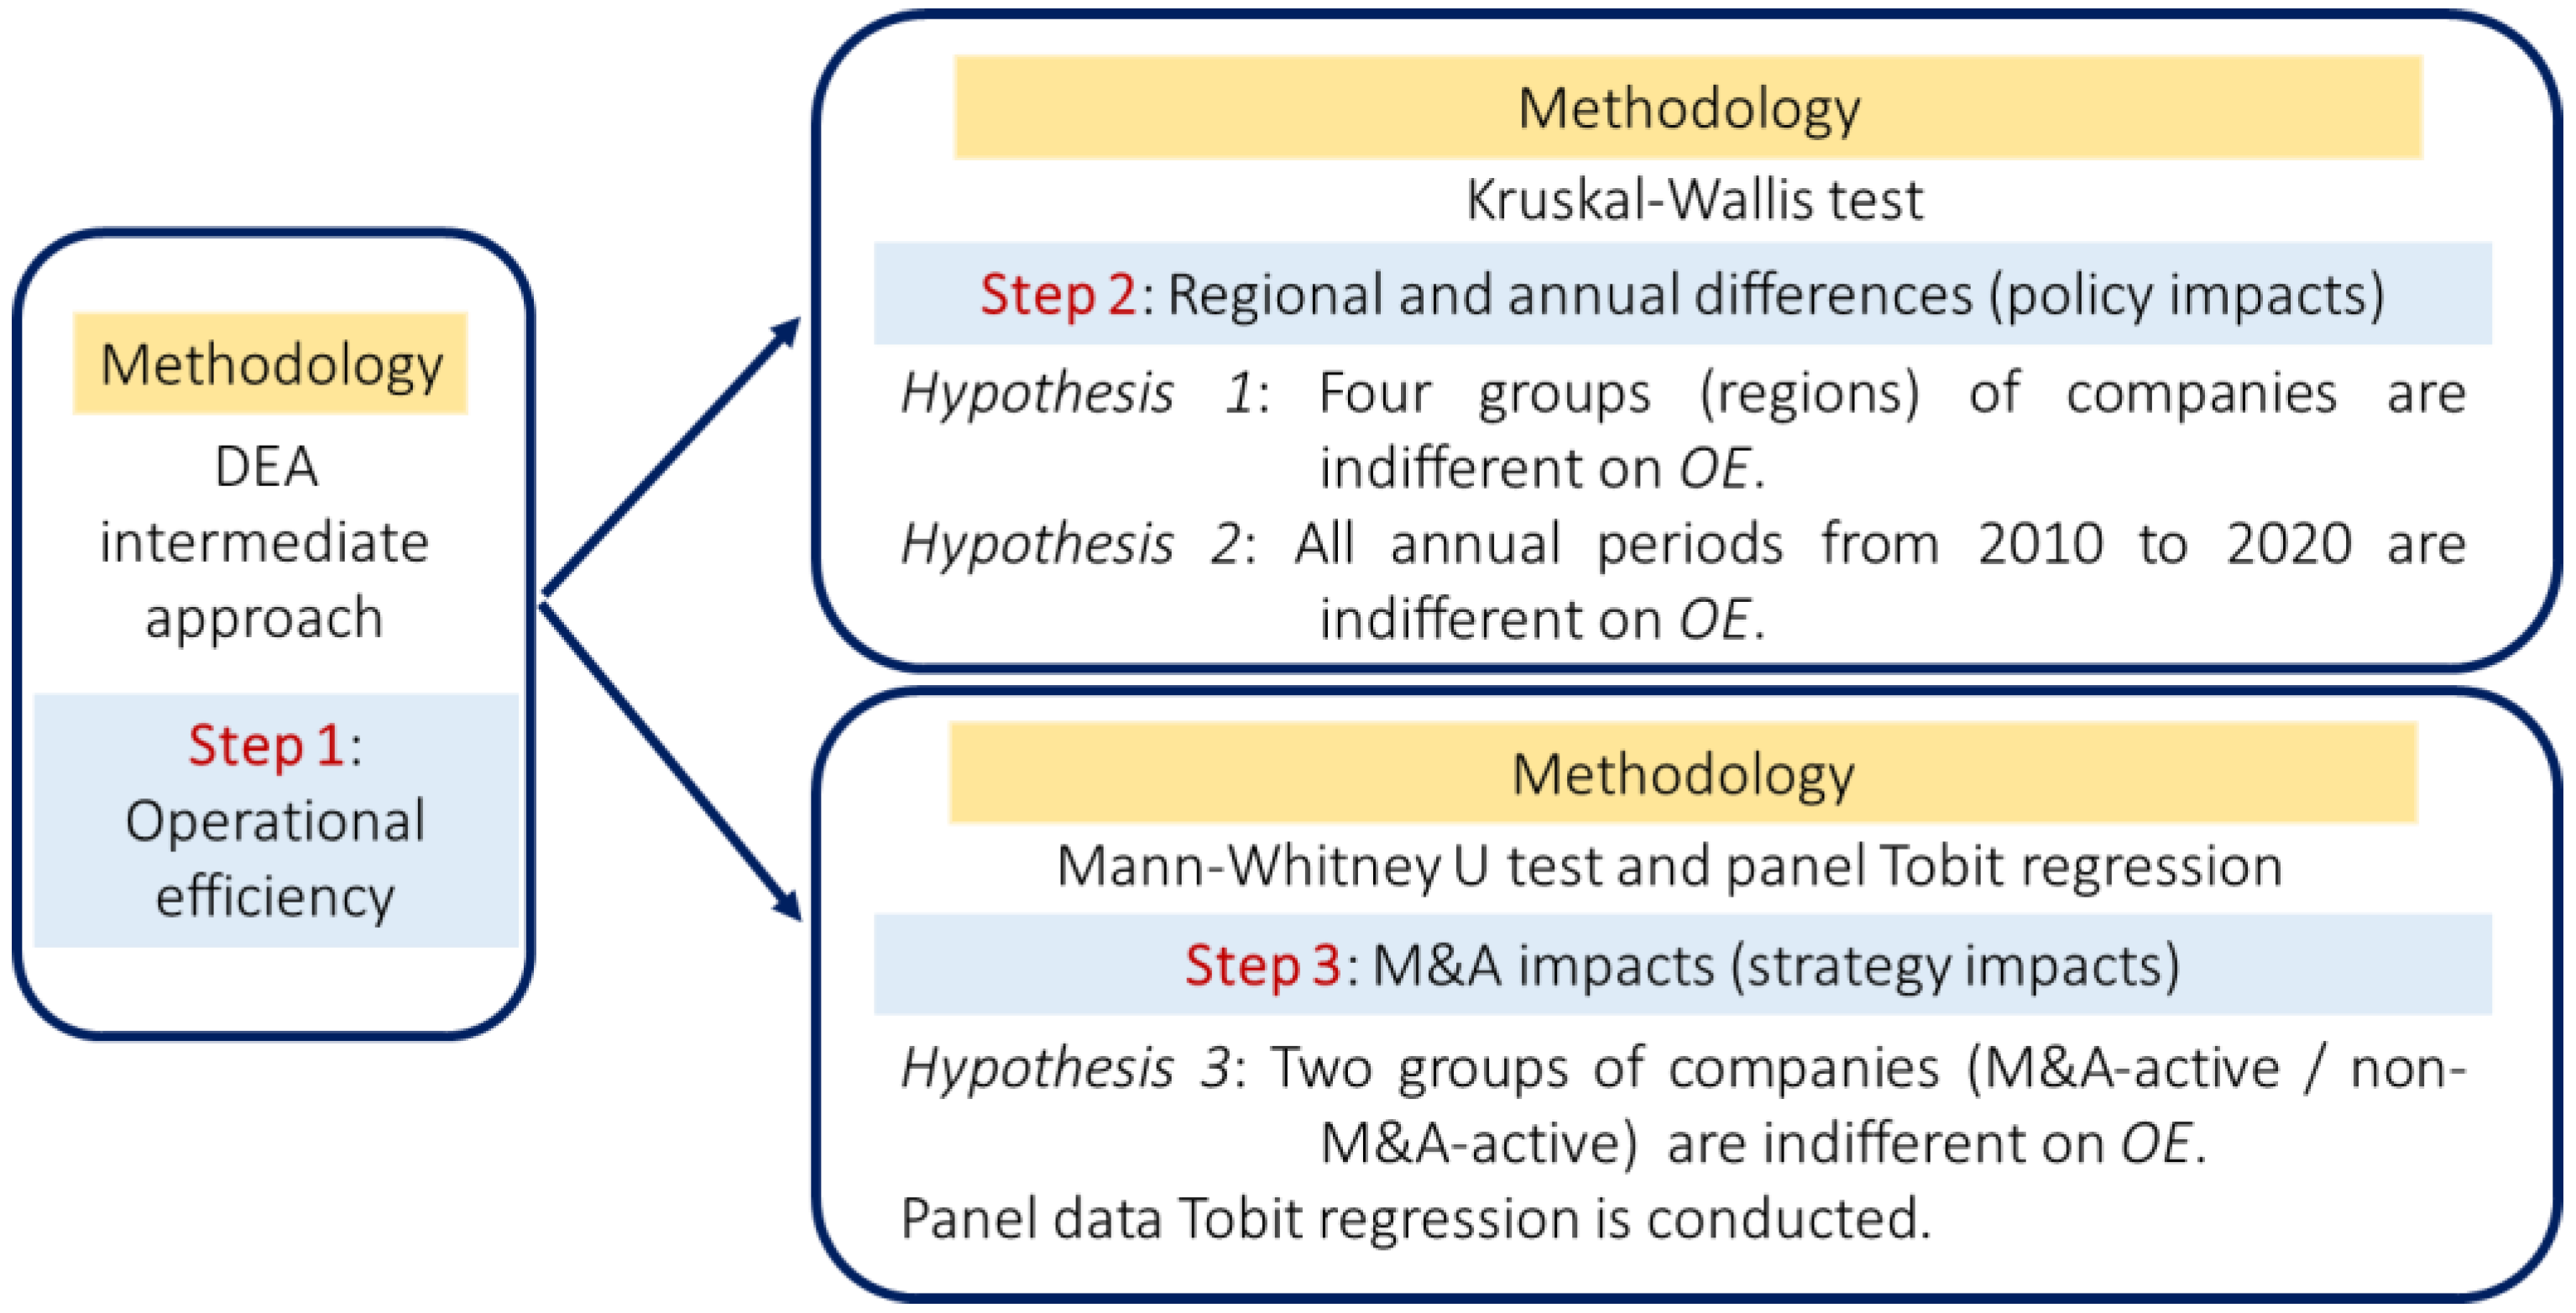
We conducted the three-step analysis visually described in Figure 1.
Step 1 of DEA has a unique feature in that it combines radial and non-radial models. The model can measure the operational efficiency of utility firms by using the DEA intermediate approach [35] that maintains both input and output production factors and determines the degree of OE by considering these individual influences. Step 2 performs a non-parametric (rank-sum) test to examine regional and annual differences in OE measures. Step 3 conducts a non-parametric test to examine the differences in OE between M&A-active and non-M&A-active companies. Step 3 also performs a Tobit regression analysis in which OI is a dependent variable.
Note that DEA does not provide any statistical inferences, so we generally have some difficulty in applying various statistical tests to DEA efficiency measures. The combination of the DEA model and non-parametric statistical tests opens up a new research avenue for empirical studies on the performance assessment of firms.
3.1. DEA for Operational Efficiency (OE)
We first measured the operational efficiency of electricity utility companies. Here, each utility company corresponds to a DMU, which is a widely used abbreviation in DEA studies. In each DMU, production technology transforms an input vector with components () into an output vector with components (). We utilized the intermediate DEA approach that was first proposed by [35]. Their study includes a new formulation for the intermediate model that incorporates undesirable outputs (e.g., CO2 emissions). Our formulation does not include undesirable outputs; thus, it more straightforwardly combines inputs and outputs in a unified structure in the DEA model.
In the use of DEA, we determine the level of operational efficiency (OE) of a specific th DMU by relatively comparing DMUs ( at the th period in a total of periods (. That is, we consider DMUs to be evaluated and the DMU uses a column vector of inputs () to yield a column vector of outputs (), where and . Here, the superscript indicates a vector transpose. It is assumed that and for all .
We evaluated the performance of each DMU by the proposed intermediate approach. In particular, we measured the degree of OE of the specific th DMU at the specific th period under variable returns to scale technology () by using the following model:
where is a column vector of unknown variables (often called ‘‘structural” or “intensity” variables) used to connect the input and output vectors by a convex combination. and represent data range adjustments on and G, and and are all slack variables related to inputs and outputs, respectively. is a very small prescribed number, which was set to be 0.0001 in this study. s.t. stands for subject to, URS stands for unrestricted, and ξ is an inefficiency score. The unified inefficiency scores () indicate the magnitude of a directional vector toward the frontier, and the slacks ( and ) are used to express the parts of the difference that cannot be specified in the unified inefficiency scores.
The first term of the left-hand side of the first and second constraints in Model (1) formulates an efficiency frontier of DMUs in all periods (). Thus, the frontier consists of the best performers of all DMUs and all periods. Moreover, the right-hand side indicates the observed performance of a specific th DMU in a specific th period. The remaining parts on the left-hand side, and , indicate the differences between the efficiency frontier and the observed performance of the specific th DMU at the th period in multiple dimensional factors.
The degree of of the th DMU at the th period is measured by
where the superscript () stands for variable returns to scale (RTSs) in production technology. The inefficiency score () and all slack variables ( and ) are determined on the optimality (*) of Model (1). The degree of is obtained by subtracting the level of unified inefficiency from unity as specified in Equation (2).
Model (1) has two important features. First, the efficiency value does not depend upon the type of factor orientation (i.e., inputs or outputs). The standard DEA models originate from the ratio form such that they have the two types of orientation featured with either inputs or outputs. The input-oriented efficiency is different from that of the output-oriented measure. The analytical feature implies that we may have some difficulty in understanding which efficiencies we should use for our assessments. Moreover, Model (1) does not have this difficulty in determining the level of efficiency because all factors (inputs and outputs) are unified by a single efficiency measure (). Second, Equation (2) can be connected to non-parametric statistical tests that are based upon the computational results of Model (1) because it produces the ranks of all DMUs over all periods. This is a methodological benefit for examining the null hypothesis of whether there is no difference in unified measures among different regions and periods. As already stated, the major difficulty of the standard DEA is that it does not provide any statistical inferences. As a result, we often encounter problems in applying it to empirical studies. That is a shortcoming of DEA. In this study, we attempted to overcome these conventional difficulties using non-parametric statistical tests and regression analyses of efficiency measures.
3.2. Mann–Whitney U Test and Tobit Regression
First, we conducted a Mann–Whitney U test between the two groups. Then, to examine the impacts of regional differences and M&As on , we performed a panel-data-censored Tobit model regression, wherein the level of “operational inefficiency” () is considered a dependent variable and regional dummies and the number of M&As are used as independent variables. Specifically, we transformed the efficiency measure into “”. This is because we imposed a zero-censoring threshold on the Tobit regression so that it adopts the standard setting of the Tobit model for our computational convenience. Due to this transformation, we understand that variables with positive coefficients decrease efficiency, while those with negative coefficients increase efficiency when they increase. After the transformation, each efficiency measure changes into an inefficiency measure , which distributes on [0, 1] where the censoring point is zero. The zero in the corresponds to the status of full efficiency. Consequently, we performed a regression (panel data Tobit regression) to analyze the .
Specifically, we describe the basic formulation of the estimation model as follows.
where is a random error term, the subscript represents the th company , represents the th period , and denotes the th region among the four regions for the dummy variable that takes 1 for Region 1 (Europe), Region 2 (North America), and Region 3 (Asia Pacific) and zero for the others. Note that we use the one-period lag variable of M&As (), considering the lagged impact of M&As on the .
3.3. Hypotheses on Region, Time, and M&As
The first research issue explored in this study was to determine whether there are differences in terms of among different regions. The companies’ headquarters are located in different regions and operate under distinct processes and time schedules on deregulation. The market reforms of the electricity industry are briefly described in Section 1. In this study, we classified 31 electric power utility companies into four groups according to their region (Europe, the US and Canada, the Asia Pacific, and others). In addition, we were interested in examining whether their efficiencies varied over time during the observed annual periods. These hypotheses are based on [3], in which the regional and time differences in companies (North America and Europe in their study) influenced M&A value creation and operational efficiency due to the differences in the business environment and regulation. Two of the null hypotheses examined in this study can be summarized as follows.
Hypothesis 1:
The four regional groups do not show any difference and belong to the same group in terms of their OE measures.
Hypothesis 2:
The different annual periods from 2010 to 2020 do not show any difference and belong to the same group in terms of their OE measures.
In addition, to examine whether the M&A strategy of electric power companies affects the level of , we classified the 31 companies into two groups: those that are active in M&As for business growth (M&A-active companies) and those are not (non-M&A-active companies). An M&A-active company was defined in such a manner that the average number of M&As over time is placed in the first quartile among all companies, while a non-M&A-active company is in the fourth quartile. Then, we examined the following hypothesis:
Hypothesis 3:
The two groups of electric power companies (i.e., M&A-active and non-M&A-active companies) belong to the same group in terms of their OE measures.
This is based on the various efficiency hypotheses described for electric power utilities in [33], that is, merger-induced efficiencies include scale economies, system reliability, energy interchange, load diversity economies, maintenance economies, emergency responses, and other economies. All these factors influence how utility companies improve their operational efficiency.
4. Data Description
The dataset used in this study consists of 31 of the world’s largest electric power utility companies, which were selected by applying the condition that both the total revenue and total assets of the annual period 2020 were more than USD 10 billion. The data period was from 2010 to 2020 (11 annual periods). All companies are public companies that are listed on stock exchange markets.
For our efficiency analysis, we used three inputs and three outputs. The inputs were total assets, total operating expenses, and capital expenditure. These input variables represent essential resources for company operations that include capital, labor, and materials. They are measured in monetary terms. The three outputs were total revenue, EBITDA, and TEV as of the 1st of July for each year. The total revenue is the gross output of each company in monetary terms. This variable also represents the business scale of a company. The EBITDA represents a company’s capability to earn profit from its core business. This output variable is often used to analyze the profitability of international companies because interest rate levels, tax rates, and depreciation methods differ from country to country. That is, this variable evaluates profitability while avoiding the influence of these differences in profitability measures. The EBITDA is also useful for the comparison of companies with large capital investments and high depreciation burdens because it aims to exhibit the amount of profit by minimizing the impacts from those differences in capital investments. Thus, the EBITDA is useful for the common assessment of large-scale electric power utility companies located in various countries. The TEV represents a company’s total value, which includes not only a company’s equity value but also the market value of its debt. In addition to conventional accounting variables, market values such as TEV are useful for measuring a company’s output.
We also used the number of M&As for each company and year, which was separated into buying and selling contracts. All input and output data and the number of M&As were obtained from the S&P Capital IQ database. Table 1 presents the period average of variables for each company and the total averages for each variable. Inputs and outputs were measured in monetary units by million USD and were calculated using historical conversion rates. The numbers of M&As were counted during the year when the contracts were closed.
5. Empirical Results
5.1. Operational Efficiency and Statistical Tests
Table 2 shows the results on OE sorted by region (Region 1, Europe; Region 2, North America; Region 3, Asia Pacific; Region 4, the others), with total averages for each company and year. Table 3 summarizes the group averages in the four regions, with total averages for each year at the bottom of the table and those for each company on the right of the table. The OE was calculated by using Equation (2), which applies the optimal values in Model (1). Figure 2 visually describes the annual development of the group average efficiencies described in Table 3.
To statistically examine whether Hypotheses 1 and 2 are valid or not as described in Section 3.3, we performed two non-parametric tests. Table 4 shows the results of the Kruskal–Wallis rank-sum tests, wherein Test 1 is for Hypothesis 1 and Test 2 is for Hypothesis 2. Further, Table 5 shows the results of the Mann–Whitney U test, wherein Test 3 is for Hypothesis 3 on the M&A-active and non-M&A-active company groups.
Table 4 indicates that Hypothesis 1 is rejected at the 1% significance level, and Hypothesis 2 is not rejected at the 10% significance level. That is, OE measures are different among the four regions, but do not show statistically significant changes over the study period from 2010 to 2020. Thus, regional differences are persistent and relatively important compared with temporal changes in . Furthermore, Table 5 indicates that Hypothesis 3 is rejected at the 1% significance level, implying that the is different between M&A-active and non-M&A-active companies.
5.2. Regression Analysis
As an extended analysis of the statistical tests presented in Section 5.1, Table 6 and Table 7 describe the results of panel data Tobit regression on . Table 6 presents the results of Models 1-1 to 1-6, and Table 7 presents those of Models 2-1 to 2-6.
The dependent variable is for both tables as described in Equation (3). M&A variables are separated into buying and selling transactions in Table 6 (MA-B and MA-S), while they are summed to make a single integrated variable (MA-T) of total M&A transactions in Table 7. In both tables, Model 1 (1-1 and 2-1) is the base model that employs a limited number of variables with M&A variables and regional dummies as independent variables. In particular, these variables are MA-B for the number of M&A buying transactions, MA-S for the number of M&A selling transactions, and MA-T for the number of M&A total transactions, in which it is noted that all these MA variables lag one period behind the dependent variable in order to take into consideration the impact of the transaction on the efficiency measure. The other models are modified versions based on Model 1.
For example, Model 2 (1-2 and 2-2) replaces regional dummies with company dummies for M&A-active and non-M&A-active ones (Q1 and Q4). That is, Q1 is a dummy variable for M&A-active companies (1 for active and 0 for the others) and Q4 is a dummy variable for non-M&A-active companies (1 for non-active and 0 for the others). Model 3 (1-3 and 2-3) adds company dummies to Model 1. Model 4 (1-4 and 2-4) adds interaction terms to Model 1, which are MA-B and MA-S multiplied by the company dummies (Q1 and Q4) of M&A. Model 5 (1-5 and 2-5) replaces regional dummies with company ones based on Model 4. Model 6 (1-6 and 2-6) employs all of the variables used in the other models.
These regression models may seem like parsimonious ones. However, as described below, some important variables have already been incorporated into the analytical framework of this study, particularly in the efficiency measure (Step 1 in Figure 1 and Equations (1) and (2)), which is a dependent variable in the panel data Tobit regression model (Step 3 in Figure 1 and Equation (3)). Total assets (used as an input) and total revenue (used as an output) represent size factors, and total operating expenses (used as an input) and capital expenditure (used as an input) represent cost factors. Regarding the ownership of companies, all sample companies in this study were selected from listed companies that are investor-owned companies, so there is no need to differentiate among sample companies. Country GDP may function as a control variable in Equation (3), but the effect of the variable is appropriately incorporated through the total revenue (used as an output) in the DEA efficiency measure and also captured in sample-specific effects that are formulated by a random error term in Equation (3) of the panel data Tobit regression used in this study. Market concentration is another interesting control variable, but we could not obtain these data. Therefore, we understand that the use of this variable is a promising future research direction for this study.
5.3. Discussion
We obtained three findings from the results. First, all models in Table 6 show that the estimated coefficients of the MA-B variable are positive and statistically significant at the 5% or 10% level with the exception of Model 1-4, which means that the increasing number of M&A buying transactions has a negative marginal impact on the operational efficiency or leads to a lower operational efficiency for utility companies. Moreover, all interaction terms with MA-B and MA-S are not significant in Models 1-4, 1-5, and 1-6. This indicates that the impact of M&As on the operational efficiency is not significantly different among companies regardless of whether they have M&A-active or non-M&A-active features. The results are almost the same as those in Table 7 with the exception of the insignificant coefficient of MA-T from Model 2-1 to Model 2-3.
Second, the dummy variable for non-M&A-active companies is positive and statistically significant at the 5% or 1% level in all models employing this variable in Table 6 and Table 7, implying that companies with a lower number of M&As are associated with lower operational efficiency. Third, the regional dummies are not significant for almost all models employing these variables. The exceptions are negative coefficients for North America in Models 3 and 6 in Table 6 and Table 7, indicating higher operational efficiency in companies in the North American region. Finally, the dummy variables for M&A-active companies are not significant, although the sign of the coefficient is negative (higher efficiency) for all models.
Third, it is interesting to note that the first and second findings complement each other for the impacts on efficiency from M&As. That is, non-M&A-active companies originally had lower efficiency levels compared with the other companies, and when the tendency was controlled by the dummy variable, the marginal impact of M&A buying transactions and that of M&A total transactions on the operational efficiency became negative so as to produce lower efficiency levels. From these findings, it can be assumed that the efficiency differences between M&A-active (higher) and non-M&A-active (lower) companies tend to decrease with the increasing number of M&A transactions at the current level of transactions. Thus, electric power utility companies have not received a benefit to operational efficiency from increasing the number of M&A transactions. So, they need to be more cautious about M&A transactions on the question of whether they can provide value to the operation. This is a new insight obtained in this study that previous studies have not addressed. It should be noted, however, that there might be some lag in the positive impacts of M&As on the operational efficiency because new business portfolios and technologies can often take some time to provide the expected results.
6. Conclusions
This study examined the operational efficiency of 31 of the world’s largest electric power utility companies during the market liberalization period from 2010 to 2020 by applying an intermediate DEA approach. We performed non-parametric tests and panel data Tobit regression to examine regional differences and impacts of M&As on efficiencies. From the results, we obtained three findings and discussed the business implications for electric power utility companies under market liberalization.
From the empirical results, we confirmed that Hypothesis 1 is rejected at the 1% significance level and Hypothesis 2 is not rejected at the 10% significance level, which means that, while the operational efficiency measures are different among the four regions, they do not show statistically significant changes over the study period from 2010 to 2020. Furthermore, Hypothesis 3 is rejected at the 1% significance level, implying that the operational efficiency is different between M&A-active and non-M&A-active companies.
The results of the regression analyses indicate that the increasing number of M&A buying and M&A total transactions has a negative marginal impact on operational efficiency or leads to a lower operational efficiency for utility companies. Moreover, all of the interaction terms of M&As were not significant in all models. This indicates that the marginal impact of M&As on operational efficiency is not different among companies regardless of whether they have M&A-active or non-M&A-active features. In addition, companies with a lower number of M&As had originally been associated with a lower operational efficiency, and companies located in the North American region had a higher operational efficiency than companies located in the other regions.
These results reveal that efficiency differences between M&A-active (higher in efficiency) and non-M&A-active (lower in efficiency) companies tend to decrease with the increasing number of M&A transactions at the current level of M&As. Since electric power utility companies have not received a benefit to operational efficiency from increasing the number of M&A transactions, they need to be more cautious about M&A transactions on the question of whether they can provide value to the operation and technological innovation.
We have five tasks to explore in the future. First, although this study focused on M&As and considered the indirect impacts of innovation on performance, the direct impacts of R&D expenses and patents on operational efficiency are an interesting research topic. The construction of a dataset comprising these variables is not easy task but is worthy of the challenge. Second, we did not look at detailed characteristics of M&A transactions. Examining what types of M&A transactions can provide improvements in efficiency for companies is another interesting research topic. Third, we examined electric power utility companies, so the natural extension of this study is to include gas utility and multi-utility companies in samples. Fourth, it is possible to methodologically extend this study. In particular, we could extend the efficiency measures in DEA to incorporate technological change components with a time shift structure. Finally, introducing some variables into the panel data Tobit regression, such as market concentration and other economic variables, is a promising task for the future.
Author Contributions
Conceptualization, M.G.; methodology, M.G. and T.S.; software, M.G. and T.T.; validation, M.G.; formal analysis, M.G. and T.T.; investigation, M.G.; resources, M.G.; data curation, M.G. and T.T.; writing—original draft preparation, M.G.; writing—review and editing, M.G. and T.S.; visualization, M.G. and T.T.; supervision, M.G.; project administration, M.G.; funding acquisition, M.G. All authors have read and agreed to the published version of the manuscript.
Funding
This study was financially supported by the Japan Society for the Promotion of Science (JSPS) through a Grant-in-Aid for Scientific Research (KAKENHI) 19K04878.
Data Availability Statement
The data used in this study are available from S&P Capital IQ database. Restrictions apply to the availability of these data based on database contracts.
Conflicts of Interest
The authors declare no conflicts of interest.
References
- Niemczyk, J.; Sus, A.; Borowski, K.; Jasiński, B.; Jasińska, K. The dominant motives of mergers and acquisitions in the energy sector in Western Europe from the perspective of green economy. Energies 2022, 15, 1065. [Google Scholar] [CrossRef]
- Becker-Blease, J.R.; Goldberg, L.G.; Kaen, F.R. Mergers and acquisitions as a response to the deregulation of the electric power industry: Value creation or value destruction? J. Regul. Econ. 2008, 33, 21–53. [Google Scholar] [CrossRef]
- Kishimoto, J.; Goto, M.; Inoue, K. Do acquisitions by electric utility companies create value? Evidence from deregulated markets. Energy Policy 2017, 105, 212–224. [Google Scholar] [CrossRef]
- Mydland, Ø. Lost economies of scope and potential merger gains in the Norwegian electricity industry. Empir. Econ. 2020, 58, 3077–3100. [Google Scholar] [CrossRef]
- Teti, E.; Tului, S. Do mergers and acquisitions create shareholder value in the infrastructure and utility sectors? Analysis of market perceptions. Util. Policy 2020, 64, 101053. [Google Scholar] [CrossRef]
- Sioshansi, F. (Ed.) Competitive Electricity Markets: Design, Implementation, Performance; Elsevier Global Energy Policy and Economics Series; Elsevier: Amsterdam, The Netherlands, 2008. [Google Scholar]
- Sioshansi, F. (Ed.) Evolution of Global Electricity Markets: New Paradigms, New Challenges, New Approaches; Academic Press: Cambridge, MA, USA, 2013. [Google Scholar]
- Pollitt, M.G. The European single market in electricity: An economic assessment. Rev. Ind. Organ. 2019, 55, 63–87. [Google Scholar] [CrossRef]
- Lin, J.; Kahrl, F.; Yuan, J.; Liu, X.; Zhang, W. Challenges and strategies for electricity market transition in China. Energy Policy 2019, 133, 110899. [Google Scholar] [CrossRef]
- Liu, Y.; Jiang, Z.; Guo, B. Assessing China’s provincial electricity spot market pilot operations: Lessons from Guangdong province. Energy Policy 2022, 164, 112917. [Google Scholar] [CrossRef]
- Sueyoshi, T.; Yuan, Y.; Goto, M. A literature study for DEA applied to energy and environment. Energy Econ. 2017, 62, 104–124. [Google Scholar] [CrossRef]
- Leibenstein, H. Allocative efficiency vs. X-efficiency. Am. Econ. Rev. 1966, 56, 392–415. [Google Scholar]
- Du, M.; Wang, B.; Wu, Y. Sources of China’s economic growth: An empirical analysis based on the BML index with green growth accounting. Sustainability 2014, 6, 5983–6004. [Google Scholar] [CrossRef]
- Fleishman, R.; Alexander, R.; Bretschneider, S.; Popp, D. Does regulation stimulate productivity? The effect of air quality policies on the efficiency of US power plants. Energy Policy 2009, 37, 4574–4582. [Google Scholar] [CrossRef]
- Guaita-Pradas, I.; Blasco-Ruiz, A. Analyzing profitability and discount rates for solar PV plants. A Spanish case. Sustainability 2020, 12, 3157. [Google Scholar] [CrossRef]
- Munisamy, S.; Arabi, B. Eco-efficiency change in power plants: Using a slacks-based measure for the meta-frontier Malmquist–Luenberger productivity index. J. Clean. Prod. 2015, 105, 218–232. [Google Scholar] [CrossRef]
- Chen, H.H.; Shen, T.S.; Xu, X.L.; Ma, C. The impacts of different expansion modes on performance of small solar energy firms: Perspectives of Absorptive Capacity. Sci. World J. 2013, 2013, 365089. [Google Scholar] [CrossRef]
- Ibarloza, A.; Heras-Saizarbitoria, I.; Allur, E.; Larrea, A. Regulatory cuts and economic and financial performance of Spanish solar power companies: An empirical review. Renew. Sustain. Energy Rev. 2018, 92, 784–793. [Google Scholar] [CrossRef]
- Li, N.; Liu, C.; Zha, D. Performance evaluation of Chinese photovoltaic companies with the input-oriented dynamic SBM model. Renew. Energy 2016, 89, 489–497. [Google Scholar] [CrossRef]
- Lin, C.Y.; Lee, A.H.; Kang, H.Y.; Lee, W.H. An integrated model to evaluate the performance of solar PV firms. In Proceedings of the 9th International Conference on Informatics in Control, Automation and Robotics 2012, (OMDM-2012), Rome, Italy, 28–31 July 2012; pp. 609–613. [Google Scholar]
- Wang, C.H.; Chuang, J.J. Integrating decision tree with back propagation network to conduct business diagnosis and performance simulation for solar companies. Decis. Support Syst. 2016, 81, 12–19. [Google Scholar] [CrossRef]
- Wu, J.S. Applying stochastic frontier analysis to measure the operating efficiency of solar energy companies in China and Taiwan. Pol. J. Environ. Stud. 2020, 29, 3385–3393. [Google Scholar] [CrossRef]
- Zhang, H.; Zheng, Y.; Aytun Ozturk, U.; Li, S. The impact of subsidies on overcapacity: A comparison of wind and solar energy companies in China. Energy 2016, 94, 821–827. [Google Scholar] [CrossRef]
- Zhang, H.; Zheng, Y.; Zhou, D.; Zhu, P. Which subsidy mode improves the financial performance of renewable energy firms? A panel data analysis of wind and solar energy companies between 2009 and 2014. Sustainability 2015, 7, 16548–16560. [Google Scholar] [CrossRef]
- Andriuškevičius, K.; Štreimikienė, D. Sustainability framework for assessment of mergers and acquisitions in energy sector. Energies 2022, 15, 4557. [Google Scholar] [CrossRef]
- Burger, S.; Luke, M. Business models for distributed energy resources: A review and empirical analysis. Energy Policy 2017, 109, 230–248. [Google Scholar] [CrossRef]
- Chasin, F.; Paukstadt, U.; Gollhardt, T.; Becker, J. Smart energy driven business model innovation: An analysis of existing business models and implications for business model change in the energy sector. J. Clean. Prod. 2020, 269, 122083. [Google Scholar] [CrossRef]
- Fikru, M.G.; Gautier, L. Electric utility mergers in the presence of distributed renewable energy. Energy Econ. 2021, 101, 105436. [Google Scholar] [CrossRef]
- Palmié, M.; Boehm, J.; Friedrich, J.; Parida, V.; Wincent, J.; Kahlert, J.; Gassmann, O.; Sjödin, D. Startups versus incumbents in ‘green’ industry transformations: A comparative study of business model archetypes in the electrical power sector. Ind. Mark. Manag. 2021, 96, 35–49. [Google Scholar] [CrossRef]
- Pereira, G.I.; Niesten, E.; Pinkse, J. Sustainable energy systems in the making: A study on Business model adaptation in incumbent utilities. Technol. Forecast. Soc. Chang. 2022, 174, 121207. [Google Scholar] [CrossRef]
- Wasilewska, N.; Wasilewski, M.; Zabolotnyy, S.; Osiichuk, D. The impact of M&As on the competitive positioning of European energy firms and market power concentration on EU national energy markets. Energies 2022, 15, 8798. [Google Scholar] [CrossRef]
- Gilbert, R.; Newbery, D. Analytical screens for electricity mergers. Rev. Ind. Organ. 2008, 32, 217–239. [Google Scholar] [CrossRef]
- Hartman, R.S. The efficiency effects of electric utility mergers: Lessons from statistical cost analysis. Energy 1996, 17, 425. [Google Scholar]
- Leggio, K.B.; Lien, D. Mergers in the electric utility industry in a deregulatory environment. J. Regul. Econ. 2000, 17, 69–85. [Google Scholar] [CrossRef]
- Sueyoshi, T.; Yuan, Y. Social sustainability measured by intermediate approach for DEA environmental Assessment: Chinese regional planning for economic development and pollution prevention. Energy Econ. 2017, 66, 154–166. [Google Scholar] [CrossRef]
Figure 1.
Three-Step Approach. Note: OE, operational efficiency; OI, operational inefficiency.

Figure 2.
Operational Efficiency Measures of the Four Groups. Note: The numbers from 1 to 4 indicate regional groups. “All” means the total average for all groups.
Figure 2.
Operational Efficiency Measures of the Four Groups. Note: The numbers from 1 to 4 indicate regional groups. “All” means the total average for all groups.


Table 1.
Averages of Variables Used in This Study.
| Company Name | Country and City of Headquarters | Total Assets | Total Operating Expenses | Capital Expenditure | Total Revenue | EBITDA | Total Enterprise Value | M&A-Buy | M&A-Sell |
|---|---|---|---|---|---|---|---|---|---|
| Electricité de France S.A. | France, Paris | 326,268 | 76,414 | 17,167 | 84,818 | 18,137 | 94,879 | 13.64 | 11.18 |
| Enel SpA | Italy, Rome | 200,811 | 78,453 | 8446 | 90,611 | 18,523 | 125,030 | 6.09 | 6.64 |
| Korea Electric Power Corporation | South Korea, Naju | 150,808 | 45,463 | 11,349 | 48,758 | 10,945 | 65,657 | 2.09 | 1.36 |
| Duke Energy Corporation | USA, Charlotte | 120,842 | 15,960 | 7156 | 20,872 | 8576 | 88,733 | 4.82 | 1.73 |
| Iberdrola, S.A. | Spain, Bilbao | 126,572 | 33,459 | 5468 | 39,071 | 9373 | 83,683 | 2.36 | 5.27 |
| Saudi Electricity Company | Saudi Arabia, Riyadh | 94,326 | 11,176 | 10,074 | 12,256 | 4785 | 44,781 | 0.00 | 0.00 |
| Exelon Corporation | USA, Chicago | 95,738 | 24,170 | 6500 | 28,304 | 8060 | 59,718 | 0.73 | 1.18 |
| NextEra Energy | USA, Juno Beach | 85,277 | 12,202 | 9951 | 16,527 | 7354 | 87,496 | 3.55 | 3.09 |
| Southern Company | USA, Atlanta | 88,163 | 15,187 | 6139 | 19,355 | 6912 | 77,058 | 4.18 | 1.09 |
| Tokyo Electric Power Company Holdings | Japan, Tokyo | 136,922 | 56,405 | 6181 | 58,208 | 8052 | 69,162 | 2.73 | 2.18 |
| PG&E Corporation | USA, San Francisco | 65,804 | 14,323 | 5413 | 16,411 | 4711 | 37,607 | 0.18 | 0.18 |
| American Electric Power Company | USA, Columbus | 62,576 | 12,407 | 4627 | 15,510 | 5011 | 50,002 | 0.91 | 1.00 |
| Kansai Electric Power Company | Japan, Osaka | 73,292 | 29,355 | 4245 | 30,121 | 4634 | 49,665 | 1.73 | 0.55 |
| Fortum Oyj | Finland, Espoo | 31,488 | 9609 | 1084 | 11,133 | 2199 | 24,539 | 4.09 | 8.73 |
| Edison International | USA, Rosemead | 52,631 | 9795 | 4204 | 12,067 | 3860 | 33,549 | 0.36 | 0.91 |
| Entergy Corporation | USA, New Orleans | 46,173 | 9270 | 3544 | 11,122 | 3568 | 29,134 | 0.73 | 0.55 |
| EnBW Energie Baden-Württemberg AG | Germany, Karlsruhe | 47,026 | 23,206 | 1722 | 24,357 | 2379 | 16,499 | 4.18 | 3.00 |
| Chubu Electric Power Company | Japan, Nagoya | 55,472 | 25,778 | 2842 | 26,809 | 3692 | 36,440 | 3.82 | 1.36 |
| Xcel Energy Inc. | USA, Minneapolis | 39,299 | 9133 | 3359 | 11,075 | 3322 | 33,140 | 1.09 | 0.45 |
| EDP-Energias de Portugal | Portugal, Lisbon | 51,357 | 16,267 | 2695 | 18,391 | 3856 | 37,574 | 2.27 | 3.00 |
| Kyushu Electric Power Company | Japan, Fukuoka | 45,159 | 17,196 | 2835 | 17,201 | 2281 | 32,375 | 0.82 | 0.36 |
| Tenaga Nasional Berhad | Malaysia, Kuala Lumpur | 33,315 | 9567 | 2379 | 11,380 | 3265 | 24,199 | 1.27 | 0.00 |
| FirstEnergy Corp. | USA, Akron | 45,432 | 10,731 | 2767 | 12,792 | 3459 | 36,633 | 0.27 | 0.64 |
| Tohoku Electric Power Company | Japan, Sendai | 41,373 | 18,607 | 2717 | 19,332 | 3059 | 29,664 | 0.45 | 0.36 |
| Endesa | Spain, Madrid | 51,363 | 24,242 | 2268 | 27,694 | 5438 | 36,556 | 2.09 | 1.91 |
| Rosseti | Russia, Moscow | 39,352 | 14,135 | 4240 | 16,504 | 4389 | 15,537 | 4.18 | 1.82 |
| Chugoku Electric Power Co. | Japan, Hiroshima | 29,921 | 11,733 | 1662 | 12,134 | 1536 | 23,235 | 0.45 | 0.27 |
| CLP Holdings Limited | Hong Kong, Hung Hom | 27,761 | 9422 | 1337 | 11,237 | 2725 | 31,050 | 1.00 | 0.45 |
| Enel Américas S.A. | Chile, Santiago | 25,429 | 8301 | 1003 | 10,821 | 3303 | 20,129 | 0.91 | 0.55 |
| PGE Polska Grupa Energetyczna S.A. | Poland, Warsaw | 18,879 | 7226 | 1702 | 8418 | 2002 | 9436 | 2.18 | 1.91 |
| Public Joint Stock Company Inter RAO UES | Russia, Moscow | 11,780 | 14,396 | 681 | 15,187 | 1177 | 4560 | 5.36 | 4.00 |
| Total Average | 74,858 | 21,729 | 4702 | 24,467 | 5503 | 45,410 | 2.53 | 2.12 |
Note: All data were obtained from the S&P Capital IQ database. The monetary units were converted to million USD based on the historical exchange rate for total assets, total operating expenses, capital expenditure, total revenue, EBITDA, and total enterprise value. The numbers of mergers and acquisitions for M&A buying and M&A selling contracts were counted for the year when the contracts were closed. M&A-active companies are Electricité de France S.A., Enel SpA, Duke Energy Corporation, Iberdrola, S.A., NextEra Energy, Fortum Oyj, EnBW Energie Baden-Württemberg AG, and Public Joint Stock Company Inter RAO UES, and non-M&A-active companies are Saudi Electricity Company, PG&E Corporation, Edison International, Entergy Corporation, Kyushu Electric Power Company, Tenaga Nasional Berhad, FirstEnergy Corp., Tohoku Electric Power Company, and Chugoku Electric Power Co.
Table 2.
Results on Operational Efficiency (OE).
| Region | Country and City of Headquarters | Company Name | Year | |||||||||||
|---|---|---|---|---|---|---|---|---|---|---|---|---|---|---|
| 2010 | 2011 | 2012 | 2013 | 2014 | 2015 | 2016 | 2017 | 2018 | 2019 | 2020 | Avg. | |||
| 1 | Finland, Espoo | Fortum Oyj | 0.882 | 0.897 | 0.833 | 0.831 | 0.895 | 0.821 | 0.672 | 0.648 | 0.824 | 0.837 | 0.726 | 0.806 |
| France, Paris | Electricité de France S.A. | 0.835 | 0.839 | 0.741 | 0.776 | 0.788 | 0.730 | 0.658 | 0.635 | 0.655 | 0.663 | 0.653 | 0.725 | |
| Germany, Karlsruhe | EnBW Energie Baden-Württemberg AG | 0.638 | 0.636 | 0.669 | 0.582 | 0.504 | 0.513 | 0.491 | 0.643 | 0.556 | 0.541 | 0.648 | 0.584 | |
| Italy, Rome | Enel SpA | 0.969 | 0.972 | 0.923 | 0.965 | 0.968 | 0.959 | 0.924 | 0.954 | 0.962 | 0.965 | 0.969 | 0.957 | |
| Poland, Warsaw | PGE Polska Grupa Energetyczna S.A. | 0.665 | 0.786 | 0.599 | 0.665 | 0.639 | 0.644 | 0.594 | 0.599 | 0.534 | 0.548 | 0.515 | 0.617 | |
| Portugal, Lisbon | EDP - Energias de Portugal | 0.746 | 0.856 | 0.780 | 0.776 | 0.858 | 0.814 | 0.795 | 0.789 | 0.784 | 0.723 | 0.763 | 0.789 | |
| Spain, Madrid | Endesa | 0.934 | 0.936 | 0.860 | 0.671 | 0.904 | 0.910 | 0.874 | 0.899 | 0.864 | 0.866 | 0.913 | 0.875 | |
| Spain, Bilbao | Iberdrola, S.A. | 0.792 | 0.935 | 0.861 | 0.898 | 0.926 | 0.882 | 0.898 | 0.792 | 0.938 | 0.942 | 0.946 | 0.892 | |
| 2 | USA, Columbus | American Electric Power Company | 0.856 | 0.856 | 0.841 | 0.822 | 0.826 | 0.832 | 0.864 | 0.848 | 0.799 | 0.832 | 0.860 | 0.840 |
| USA, Charlotte | Duke Energy Corporation | 0.806 | 0.831 | 0.778 | 0.928 | 0.926 | 0.923 | 0.935 | 0.937 | 0.913 | 0.920 | 0.937 | 0.894 | |
| USA, Rosemead | Edison International | 0.590 | 0.639 | 0.717 | 0.696 | 0.754 | 0.717 | 0.785 | 0.797 | 0.728 | 0.736 | 0.758 | 0.720 | |
| USA, New Orleans | Entergy Corporation | 0.794 | 0.699 | 0.647 | 0.719 | 0.783 | 0.697 | 0.725 | 0.705 | 0.652 | 0.735 | 0.718 | 0.716 | |
| USA, Chicago | Exelon Corporation | 0.904 | 0.908 | 0.796 | 0.795 | 0.742 | 0.751 | 0.770 | 0.822 | 0.820 | 0.864 | 0.802 | 0.816 | |
| USA, Akron | FirstEnergy Corp. | 0.773 | 0.787 | 0.767 | 0.787 | 0.668 | 0.794 | 0.814 | 0.828 | 0.849 | 0.800 | 0.813 | 0.789 | |
| USA, Juno Beach | NextEra Energy | 0.812 | 0.805 | 0.761 | 0.884 | 0.919 | 0.920 | 0.922 | 0.946 | 0.927 | 0.941 | 0.942 | 0.889 | |
| USA, San Francisco | PG&E Corporation | 0.752 | 0.708 | 0.670 | 0.650 | 0.729 | 0.676 | 0.754 | 0.836 | 0.668 | 0.572 | 0.610 | 0.693 | |
| USA, Atlanta | Southern Company | 0.893 | 0.913 | 0.923 | 0.875 | 0.890 | 0.904 | 0.874 | 0.784 | 0.875 | 0.933 | 0.934 | 0.891 | |
| USA, Minneapolis | Xcel Energy Inc. | 0.681 | 0.730 | 0.738 | 0.705 | 0.734 | 0.729 | 0.818 | 0.817 | 0.770 | 0.807 | 0.817 | 0.759 | |
| 3 | Hong Kong, Hung Hom | CLP Holdings Limited | 0.782 | 0.792 | 0.835 | 0.791 | 0.834 | 0.822 | 0.911 | 0.917 | 0.910 | 0.860 | 0.855 | 0.846 |
| Japan, Nagoya | Chubu Electric Power Company | 0.894 | 0.847 | 0.702 | 0.652 | 0.667 | 0.735 | 0.854 | 0.721 | 0.724 | 0.698 | 0.722 | 0.747 | |
| Japan, Fukuoka | Kyushu Electric Power Company | 0.791 | 0.765 | 0.609 | 0.644 | 0.649 | 0.633 | 0.715 | 0.731 | 0.683 | 0.691 | 0.671 | 0.689 | |
| Japan, Hiroshima | Chugoku Electric Power Co. | 0.714 | 0.676 | 0.689 | 0.660 | 0.668 | 0.658 | 0.658 | 0.648 | 0.632 | 0.661 | 0.667 | 0.666 | |
| Japan, Osaka | Kansai Electric Power Company | 0.889 | 0.870 | 0.646 | 0.632 | 0.687 | 0.670 | 0.836 | 0.859 | 0.813 | 0.765 | 0.710 | 0.761 | |
| Japan, Sendai | Tohoku Electric Power Company | 0.764 | 0.778 | 0.611 | 0.644 | 0.758 | 0.788 | 0.810 | 0.736 | 0.697 | 0.687 | 0.680 | 0.723 | |
| Japan, Tokyo | Tokyo Electric Power Company Holdings | 0.946 | 0.846 | 0.664 | 0.648 | 0.766 | 0.758 | 0.760 | 0.731 | 0.731 | 0.723 | 0.644 | 0.747 | |
| Malaysia, Kuala Lumpur | Tenaga Nasional Berhad | 0.743 | 0.586 | 0.736 | 0.701 | 0.792 | 0.811 | 0.811 | 0.792 | 0.757 | 0.793 | 0.820 | 0.758 | |
| South Korea, Naju | Korea Electric Power Corporation | 0.634 | 0.588 | 0.566 | 0.596 | 0.775 | 0.868 | 0.897 | 0.730 | 0.595 | 0.585 | 0.702 | 0.685 | |
| 4 | Chile, Santiago | Enel Américas S.A. | 0.984 | 1.000 | 0.935 | 0.924 | 0.877 | 0.802 | 0.820 | 0.899 | 0.849 | 0.882 | 0.842 | 0.892 |
| Russia, Moscow | Public Joint Stock Company Inter RAO UES | 0.721 | 0.724 | 0.538 | 0.524 | 0.639 | 0.724 | 0.729 | 0.773 | 0.869 | 0.855 | 0.772 | 0.715 | |
| Russia, Moscow | Rosseti | 0.670 | 0.676 | 0.617 | 0.626 | 0.732 | 0.645 | 0.673 | 0.707 | 0.681 | 0.683 | 0.625 | 0.667 | |
| Saudi Arabia, Riyadh | Saudi Electricity Company | 0.436 | 0.440 | 0.512 | 0.480 | 0.609 | 0.491 | 0.552 | 0.598 | 0.699 | 0.770 | 0.767 | 0.578 | |
| Avg. | 0.784 | 0.785 | 0.728 | 0.727 | 0.771 | 0.762 | 0.780 | 0.778 | 0.766 | 0.770 | 0.768 | 0.913 | ||
Note: Regions are classified into four groups (1, Europe; 2, North America and Canada; 3, Asia Pacific; 4, the others).
Table 3.
Regional Classification: Annual Averages.
| Region | Year | |||||||||||
|---|---|---|---|---|---|---|---|---|---|---|---|---|
| 2010 | 2011 | 2012 | 2013 | 2014 | 2015 | 2016 | 2017 | 2018 | 2019 | 2020 | Avg. | |
| 1 | 0.808 | 0.857 | 0.783 | 0.770 | 0.810 | 0.784 | 0.738 | 0.745 | 0.764 | 0.761 | 0.767 | 0.781 |
| 2 | 0.786 | 0.788 | 0.764 | 0.786 | 0.797 | 0.794 | 0.826 | 0.832 | 0.800 | 0.814 | 0.819 | 0.801 |
| 3 | 0.795 | 0.750 | 0.673 | 0.663 | 0.733 | 0.749 | 0.806 | 0.763 | 0.727 | 0.718 | 0.719 | 0.736 |
| 4 | 0.703 | 0.710 | 0.651 | 0.639 | 0.714 | 0.665 | 0.694 | 0.744 | 0.774 | 0.797 | 0.752 | 0.713 |
| All | 0.784 | 0.785 | 0.728 | 0.727 | 0.771 | 0.762 | 0.780 | 0.778 | 0.766 | 0.770 | 0.768 | 0.765 |
Note: Regions are classified into four groups (1, Europe; 2, North America and Canada; 3, Asia Pacific; 4, the others).
Table 4.
Results of the Kruskal–Wallis Rank-Sum Tests.
| Degrees of Freedom | H-Score | |
|---|---|---|
| Test 1 | 3 | 27.431 *** |
| Test 2 | 10 | 9.816 |
Note: *** p < 0.01.
Table 5.
Results of the Mann–Whitney U Tests.
| Degrees of Freedom | Z-Score | |
|---|---|---|
| Test 3 | 1 | 5.692 *** |
Note: *** p < 0.01.
Table 6.
Results of Panel Data Tobit Regression (M&As on selling and buying transactions).
| Dependent Variable | Independent Variables | Model 1-1 | Model 1-2 | Model 1-3 | Model 1-4 | Model 1-5 | Model 1-6 | |||||||||||||
|---|---|---|---|---|---|---|---|---|---|---|---|---|---|---|---|---|---|---|---|---|
| Coef. | Z Score | Coef. | Z Score | Coef. | Z Score | Coef. | Z Score | Coef. | Z Score | Coef. | Z Score | |||||||||
| Operational Inefficiency (OI) | MA-B | Number of M&A Buy (lag1) | 0.003 | 1.85 | * | 0.004 | 2.23 | ** | 0.004 | 2.21 | ** | 0.004 | 1.47 | 0.005 | 1.75 | * | 0.005 | 1.71 | * | |
| MA-B Q1 | Interaction term | 0.001 | 0.18 | 0.001 | 0.19 | 0.001 | 0.26 | |||||||||||||
| MA-B Q4 | Interaction term | −0.001 | −0.08 | −0.005 | −0.44 | −0.005 | −0.46 | |||||||||||||
| MA-S | Number of M&A Sell (lag1) | −0.002 | −0.78 | −0.001 | −0.47 | −0.001 | −0.61 | 0.002 | 0.64 | 0.003 | 0.88 | 0.003 | 0.81 | |||||||
| MA-S Q1 | Interaction term | −0.006 | −1.28 | −0.006 | −1.33 | −0.007 | −1.37 | |||||||||||||
| MA-S Q4 | Interaction term | −0.004 | −0.35 | −0.009 | −0.75 | −0.007 | −0.63 | |||||||||||||
| R1 | Regional dummy for Europe | −0.064 | −1.13 | −0.025 | −0.49 | −0.060 | −1.07 | −0.024 | −0.47 | |||||||||||
| R2 | Regional dummy for North America | −0.085 | −1.57 | −0.100 | −2.12 | ** | −0.084 | −1.55 | −0.098 | −2.11 | ** | |||||||||
| R3 | Regional dummy for Asia Pacific | −0.013 | −0.23 | −0.041 | −0.85 | −0.013 | −0.23 | −0.039 | −0.81 | |||||||||||
| Q1 | Company dummy for M&A-active | −0.041 | −1.03 | −0.047 | −1.18 | −0.030 | −0.70 | −0.036 | −0.84 | |||||||||||
| Q4 | Company dummy for non-M&A-active | 0.080 | 2.16 | ** | 0.094 | 2.67 | *** | 0.091 | 2.39 | ** | 0.104 | 2.88 | *** | |||||||
| Constant | 0.278 | 6.05 | *** | 0.215 | 9.12 | *** | 0.264 | 6.22 | *** | 0.276 | 6.01 | *** | 0.208 | 8.54 | *** | 0.256 | 5.99 | *** | ||
Note: *** p < 0.01, ** p < 0.05, * p < 0.1.
Table 7.
Results of Panel Data Tobit Regression (M&As on total transactions).
| Dependent Variable | Independent Variables | Model 2-1 | Model 2-2 | Model 2-3 | Model 2-4 | Model 2-5 | Model 2-6 | |||||||||||||
|---|---|---|---|---|---|---|---|---|---|---|---|---|---|---|---|---|---|---|---|---|
| Coef. | Z Score | Coef. | Z Score | Coef. | Z Score | Coef. | Z Score | Coef. | Z Score | Coef. | Z Score | |||||||||
| Operational Inefficiency (OI) | MA-T | Number of M&A (lag1) | 0.001 | 0.94 | 0.002 | 1.50 | 0.002 | 1.39 | 0.003 | 1.51 | 0.004 | 1.85 | * | 0.004 | 1.79 | * | ||||
| MA-T Q1 | Interaction term | −0.003 | −1.19 | −0.003 | −1.20 | −0.003 | −1.19 | |||||||||||||
| MA-T Q4 | Interaction term | −0.003 | −0.37 | −0.007 | −0.93 | −0.006 | −0.86 | |||||||||||||
| R1 | Regional dummy for Europe | −0.070 | −1.23 | −0.031 | −0.61 | −0.064 | −1.14 | −0.030 | −0.58 | |||||||||||
| R2 | Regional dummy for North America | −0.085 | −1.57 | −0.101 | −2.11 | ** | −0.084 | −1.54 | −0.098 | −2.07 | ** | |||||||||
| R3 | Regional dummy for Asia Pacific | −0.013 | −0.23 | −0.042 | −0.84 | −0.014 | −0.26 | −0.040 | −0.81 | |||||||||||
| Q1 | Company dummy for M&A-active | −0.045 | −1.13 | −0.049 | −1.21 | −0.027 | −0.64 | −0.032 | −0.73 | |||||||||||
| Q4 | Company dummy for non-M&A-active | 0.079 | 2.11 | ** | 0.091 | 2.57 | ** | 0.091 | 2.38 | ** | 0.103 | 2.82 | *** | |||||||
| Constant | 0.280 | 6.07 | *** | 0.216 | 9.14 | *** | 0.267 | 6.24 | *** | 0.278 | 6.01 | *** | 0.208 | 8.45 | *** | 0.257 | 5.92 | *** | ||
Note: *** p < 0.01, ** p < 0.05, * p < 0.1.
Disclaimer/Publisher’s Note: The statements, opinions and data contained in all publications are solely those of the individual author(s) and contributor(s) and not of MDPI and/or the editor(s). MDPI and/or the editor(s) disclaim responsibility for any injury to people or property resulting from any ideas, methods, instructions or products referred to in the content. |
© 2024 by the authors. Licensee MDPI, Basel, Switzerland. This article is an open access article distributed under the terms and conditions of the Creative Commons Attribution (CC BY) license (https://creativecommons.org/licenses/by/4.0/).
Share and Cite
MDPI and ACS Style
Goto, M.; Tomikawa, T.; Sueyoshi, T. Efficiency and Mergers and Acquisitions of Electric Utility Companies. Energies 2024, 17, 1972. https://doi.org/10.3390/en17081972
AMA Style
Goto M, Tomikawa T, Sueyoshi T. Efficiency and Mergers and Acquisitions of Electric Utility Companies. Energies. 2024; 17(8):1972. https://doi.org/10.3390/en17081972
Chicago/Turabian StyleGoto, Mika, Tadaaki Tomikawa, and Toshiyuki Sueyoshi. 2024. "Efficiency and Mergers and Acquisitions of Electric Utility Companies" Energies 17, no. 8: 1972. https://doi.org/10.3390/en17081972
Note that from the first issue of 2016, this journal uses article numbers instead of page numbers. See further details here.