

Properties of Forest Tree Branches as an Energy Feedstock in North-Eastern Poland
by
 ,
,
Mariusz Jerzy Stolarski
1,2,*,
Natalia Wojciechowska
1,
Mateusz Seliwiak
1 and
Tomasz Krzysztof Dobrzański
1 1
Department of Genetics, Plant Breeding and Bioresource Engineering, Faculty of Agriculture and Forestry, University of Warmia and Mazury in Olsztyn, 10-724 Olsztyn, Poland
2
Centre for Bioeconomy and Renewable Energies, University of Warmia and Mazury in Olsztyn, Plac Łódzki 3, 10-719 Olsztyn, Poland
*
Author to whom correspondence should be addressed.
Energies 2024, 17(8), 1975; https://doi.org/10.3390/en17081975
Submission received: 28 March 2024
/
Revised: 12 April 2024
/
Accepted: 18 April 2024
/
Published: 22 April 2024
(This article belongs to the Section A4: Bio-Energy)
Abstract
:Tree branches from forest tree harvesting for the timber industry are an important energy feedstock. Solid biofuel in the form of wood chips, produced from branches, is an excellent renewable energy source for generating heat and electricity. However, the properties of wood chips as a solid biofuel produced from forest tree branches can vary greatly depending on the species from which they have been produced. Therefore, this study aimed to assess the thermophysical properties and elemental composition of fresh branches harvested from nine tree species (pedunculate oak, silver birch, European ash, common aspen, grey alder, Norway maple, Scots pine, European larch and Norway spruce) over three consecutive years (2020–2022). The branches of the tree species most commonly found in Polish forests (Scots pine) were characterized by the highest heating value (an average of 20.74 GJ Mg−1 DM), the highest carbon content (an average of 55.03% DM), the lowest ash (an average of 0.60% DM) and nitrogen contents (an average of 0.32% DM), and low sulfur (an average of 0.017% DM) and chlorine contents (an average of 0.014% DM). A cluster analysis showed that the branches of all three coniferous tree species (Scots pine, Norway spruce and European larch) formed one common cluster, indicating similar properties. The branches of the European ash were characterized by the lowest wood moisture content (an average of 37.19% DM) and thus the highest lower heating value (an average of 10.50 GJ Mg−1). During the three years of the study, the chlorine and ash contents of the branches of the tree species under study exhibited the highest variability.
1. Introduction
As energy consumption in the European Union (EU) countries exceeds energy production, the entire EU, as well as most of its Member States, are dependent on energy imports from outside the EU. In 1990, the energy import dependency of the entire EU averaged 50%, while in 2022, this index reached a value of 62.5% [1]. What is alarming is the very rapid increase in Poland’s dependence on energy imports, as the country was practically energy-independent in the early 1990s, which was mainly due to the reliance of the entire economy on solid coal fuels. However, at the beginning of the century, Poland’s dependence on energy imports rose to approximately 10%, while in 2022, it was already over 46%. Due to the high dependence of the EU as a whole on energy imports (including the increasing dependence of Poland), as well as for other economic, political, environmental and social reasons, there is an increasing focus on the use of renewable energy sources (RESs). Therefore, an increase in the share of RESs in final energy consumption is evident both across the EU and in Poland. As for the EU, the share of renewable energy in the final energy consumption in 2004 was 9.61%, while in 2022, it was 23.02% [2]. On the other hand, for Poland, it increased from 6.88% in 2004 to 16.87% in 2022. Unfortunately, it has to be stated that Poland had one of the lowest indices for the share of energy from renewable sources in the final energy consumption. All countries neighboring Poland showed higher values for this indicator. Among the EU Member States, the leader in this respect was Sweden, where, in the years 2004–2022, as much as 38.33–66.00% of the final energy consumption originated from RESs.
The structure of energy production from RESs is dominated by solid biofuels, which, on average, accounted for over 41% in the EU, while in Poland, they accounted for 64.5% [3]. Therefore, analyses of the availability of solid biomass from different sources, as well as assessments of its quality as an energy feedstock, continue to be important and topical issues. Solid biomass for energy purposes can originate from agriculture, mainly in the form of cereal and rape straw [4] and in the form of straw, semi-ligneous and wood harvested from perennial industrial crop plantations [5,6,7,8,9]. However, the main sources of solid biomass in the form of wood are forests and the timber industry [10,11,12]. As far as forests are concerned, the residues resulting from thinning or felling are mainly harvested for energy purposes. In practice, this biomass is in the form of branches and tree tops that are not suitable for industrial use. This type of energy feedstock is referred to in Poland as wood residues from forest management, or small-sized wood, and is designated as M2E grade [13]. In practice, the wood residues of this type are harvested immediately after felling in the form of chips (M2 ZE) or bales (M2 BE). When woodchips are harvested, they are most commonly used directly for energy purposes, such as fresh woodchips with a high moisture content (40–50%). In contrast, bales are stored in heaps to naturally reduce the moisture content of biomass and then are shredded into chips, which, depending on the weather conditions and the bale storage duration, can have a significantly lower moisture content (20–30%) [14].
It is estimated that the worldwide supply of energy wood could reach 165 EJ y−1, which could potentially meet 2–18% of global primary energy consumption in 2050 [15]. In contrast, the total potential of the main woody biomass sorts (stem wood, branches and harvest losses, stumps and thinnings from young forests) in the EU for 2030 has been estimated at 623–895 million m3 y−1 [16]. However, it must be emphasized that forests mainly play an important role in providing raw wood material for the production of various products and energy. The potential for harvesting solid biomass of M2E grade in Poland is significant, as forests occupy an area of 9274.8 thousand ha, i.e., 29.7% of the country’s area [17]. In Poland, in 2022, a total of 44,646.7 thousand m3 of timber was harvested. This volume was dominated by large timber (42,702.8 thousand m3), followed by small-sized wood (1943.8 thousand m3) and stump wood (0.8 thousand m3). It should also be added that the harvest of small-sized timber in 2022 increased by as much as 25.2% as compared to 2021 [17]. Forests in Poland are decidedly dominated by coniferous trees (68.6% of the forest area), with the remaining surface (31.4%) being covered by deciduous trees. In terms of species, however, the pine is the most common, with an area share of 58.6% [18]. As for the coniferous species, the spruce ranked second in this category (5.3%). On the other hand, in terms of the deciduous species, the largest area was occupied by the oak (8.0%), followed by the birch (6.8%). It should be noted here that pine is a very widespread species, also throughout Europe, and one of the most important species from economic [19,20] and energy points of view [21,22]. Moreover, the different sorts of this species can be multi-directionally used, including for the production of environmentally friendly polymer materials and/or biofuels [23]. In the cited studies, it was further found that pine branches and needles have a higher heating value due to their higher lignin content, which makes them preferable for use as solid biofuel. Nevertheless, other less common coniferous and deciduous tree species are harvested for economic purposes, with resulting wood residues in the form of small-sized wood (M2E). This woody biomass grade represents an important renewable energy feedstock particularly suitable for local district heating plants and CHP plants. In addition, Poland has recently seen the upgrading of old local coal-fired heating plants to modern facilities fed with solid biomass and is thus constantly increasing the demand for this solid biofuel, including wood chips [24,25]. Therefore, analysis of the quality of (M2E) woody biomass derived from various tree species continues to be topical and important from a practical point of view. Therefore, this study aimed to assess the thermophysical properties and elemental composition of fresh M2E-grade branches harvested from nine tree species in the north-eastern region of Poland (including three coniferous and six deciduous species) over three consecutive years (2020–2022).
2. Materials and Methods
2.1. The Subject and Factors of the Study
The study analyzed the branches of forest trees, which were the residues of the logging of tree stands aged approximately 35–40 years located in the Spychowo Forest Division, Stróżki Forest District, in the north-eastern region of Poland. Nine tree species formed the first factor of the study, including six deciduous species: common aspen (Populus tremula L.), grey alder (Alnus incana (L.) Moench), European ash (Fraxinus excelsior L.), silver birch (Betula pendula Roth), pedunculate oak (Quercus robur L.) and Norway maple (Acer platanoides L.), and three coniferous species: Scots pine (Pinus sylvestris L.), European larch (Larix decidua Mill.) and Norway spruce (Picea abies (L.) H. Karst). The three consecutive years (2020, 2021 and 2022) of branch harvesting were the second factor of the study [26,27,28]. The branches of all the species in the three consecutive years were harvested from the same location in the autumn (October), at the end of the growing season of the trees. Fresh samples of the branches (without leaves or needles or any other organic or mineral contaminants) were randomly selected for each species each year. The diameters of the harvested branches fell within a range of 2–7 cm but mostly averaged approximately 3–4 cm. During branch sampling, approximately 30 cm long shoot sections were cut from the branches and packed in plastic bags. The pooled samples of branches of each species weighed approximately 3–4 kg and were transported to the Energy Feedstock Assessment Laboratory of the University of Warmia and Mazury in Olsztyn for further analyses and assays.
2.2. Laboratory Analyses
The branch samples delivered to the laboratory were cut with an electric chipper (BOSCH AXT 25 TC, 2500 W, turbine cut system, Hungary), which yielded a homogeneous wood chip fraction. Laboratory samples were then collected from the chips, and individual analyses were performed. All the laboratory analyses for the branches of each species were conducted each year in three replications. In the first instance, the moisture content (MC) of the studied species biomass was determined. The chips were dried in an FD BINDER dryer (BINDER, Tuttlingen, Germany) at 105 °C to obtain a constant weight in accordance with standard PN-EN ISO 18134-2 [29]. After being dried, the chips were ground using a Retsch SM 200 laboratory mill (Retsch, Haan, Germany) with a sieve with a mesh diameter of 1 mm. The ash content (Ash) was determined at 550 °C and the fixed carbon (FC) and volatile matter (VM) contents at 650 °C, using an Eltra Tga-Thermostep thermogravimetric analyzer (ELTRA, Neuss, Germany), in accordance with standards PN-EN ISO 18122:2016-01 [30] and PN-EN ISO 18123:2016-01 [31]. The elemental composition (including the carbon (C), hydrogen (H) and sulfur (S) contents) was determined using an Eltra CHS-500 analyzer (ELTRA, Neuss, Germany) in accordance with standards PN-EN ISO 16948:2015-07 [32] and PN-EN ISO 16994:2016-10 [33]. The nitrogen (N) value was determined by the Kjeldahl method using a K-435 digestion unit and a BUCHI B-324 distillation unit (BUCHI, Flawil, Switzerland). The chlorine (Cl) content was determined using Eschka’s mixture in accordance with standard PN-ISO 587:2000 [34]. The higher heating value (HHV) was determined using an IKA C2000 calorimeter (IKA, Taufen, Germany) by the dynamic method, and the lower heating value (LHV) was calculated based on the pre-determined HHV, MC and H contents in accordance with standard PN-EN ISO 18125:2017-07 [35].
where
LHV = (HHV − 206 × H) × (1 − 0.01 × MC) − 23.0 × MC
LHV—lower heating value (J g−1);
HHV—higher heating value (J g−1 DM);
H—hydrogen content (% DM);
MC—moisture content (%).
2.3. Statistical Analysis
Prior to the statistical analyses, the normality of the characteristics under study was checked using the Shapiro–Wilk test. In this analysis, the first factor was the branches of the nine tree species, while the second factor was the three consecutive years of their harvesting. Arithmetic means and standard deviations were calculated for the thermophysical properties and elemental composition under analysis. Using Tukey’s multiple-comparison test (HSD), homogeneous groups were determined at a significance level of p < 0.05. The Pearson correlation coefficient was also determined between the analyzed characteristics, and statistically significant (p < 0.05) relationships between the variables were checked. In addition, a similarity analysis was carried out for the examined branches of nine different tree species and for the determined qualitative and quantitative properties. A multidimensional cluster analysis was applied, agglomeration was carried out using Ward’s method, and Euclidean distances were used as a measure of distance. The cut-off significance was adopted based on the Sneath criterion at levels of 33% and 66%. Moreover, descriptive statistics were determined for the entire dataset for the branches of all the tree species, which included the mean, median, variation coefficient, standard deviation, lower and upper quartile, and minimum and maximum values. All statistical analyses were conducted using the STATISTICA 13 software (TIBCO Software Inc., Palo Alto, CA, USA).
3. Results and Discussion
3.1. Thermophysical Properties of the Branches of the Tree Species under Study
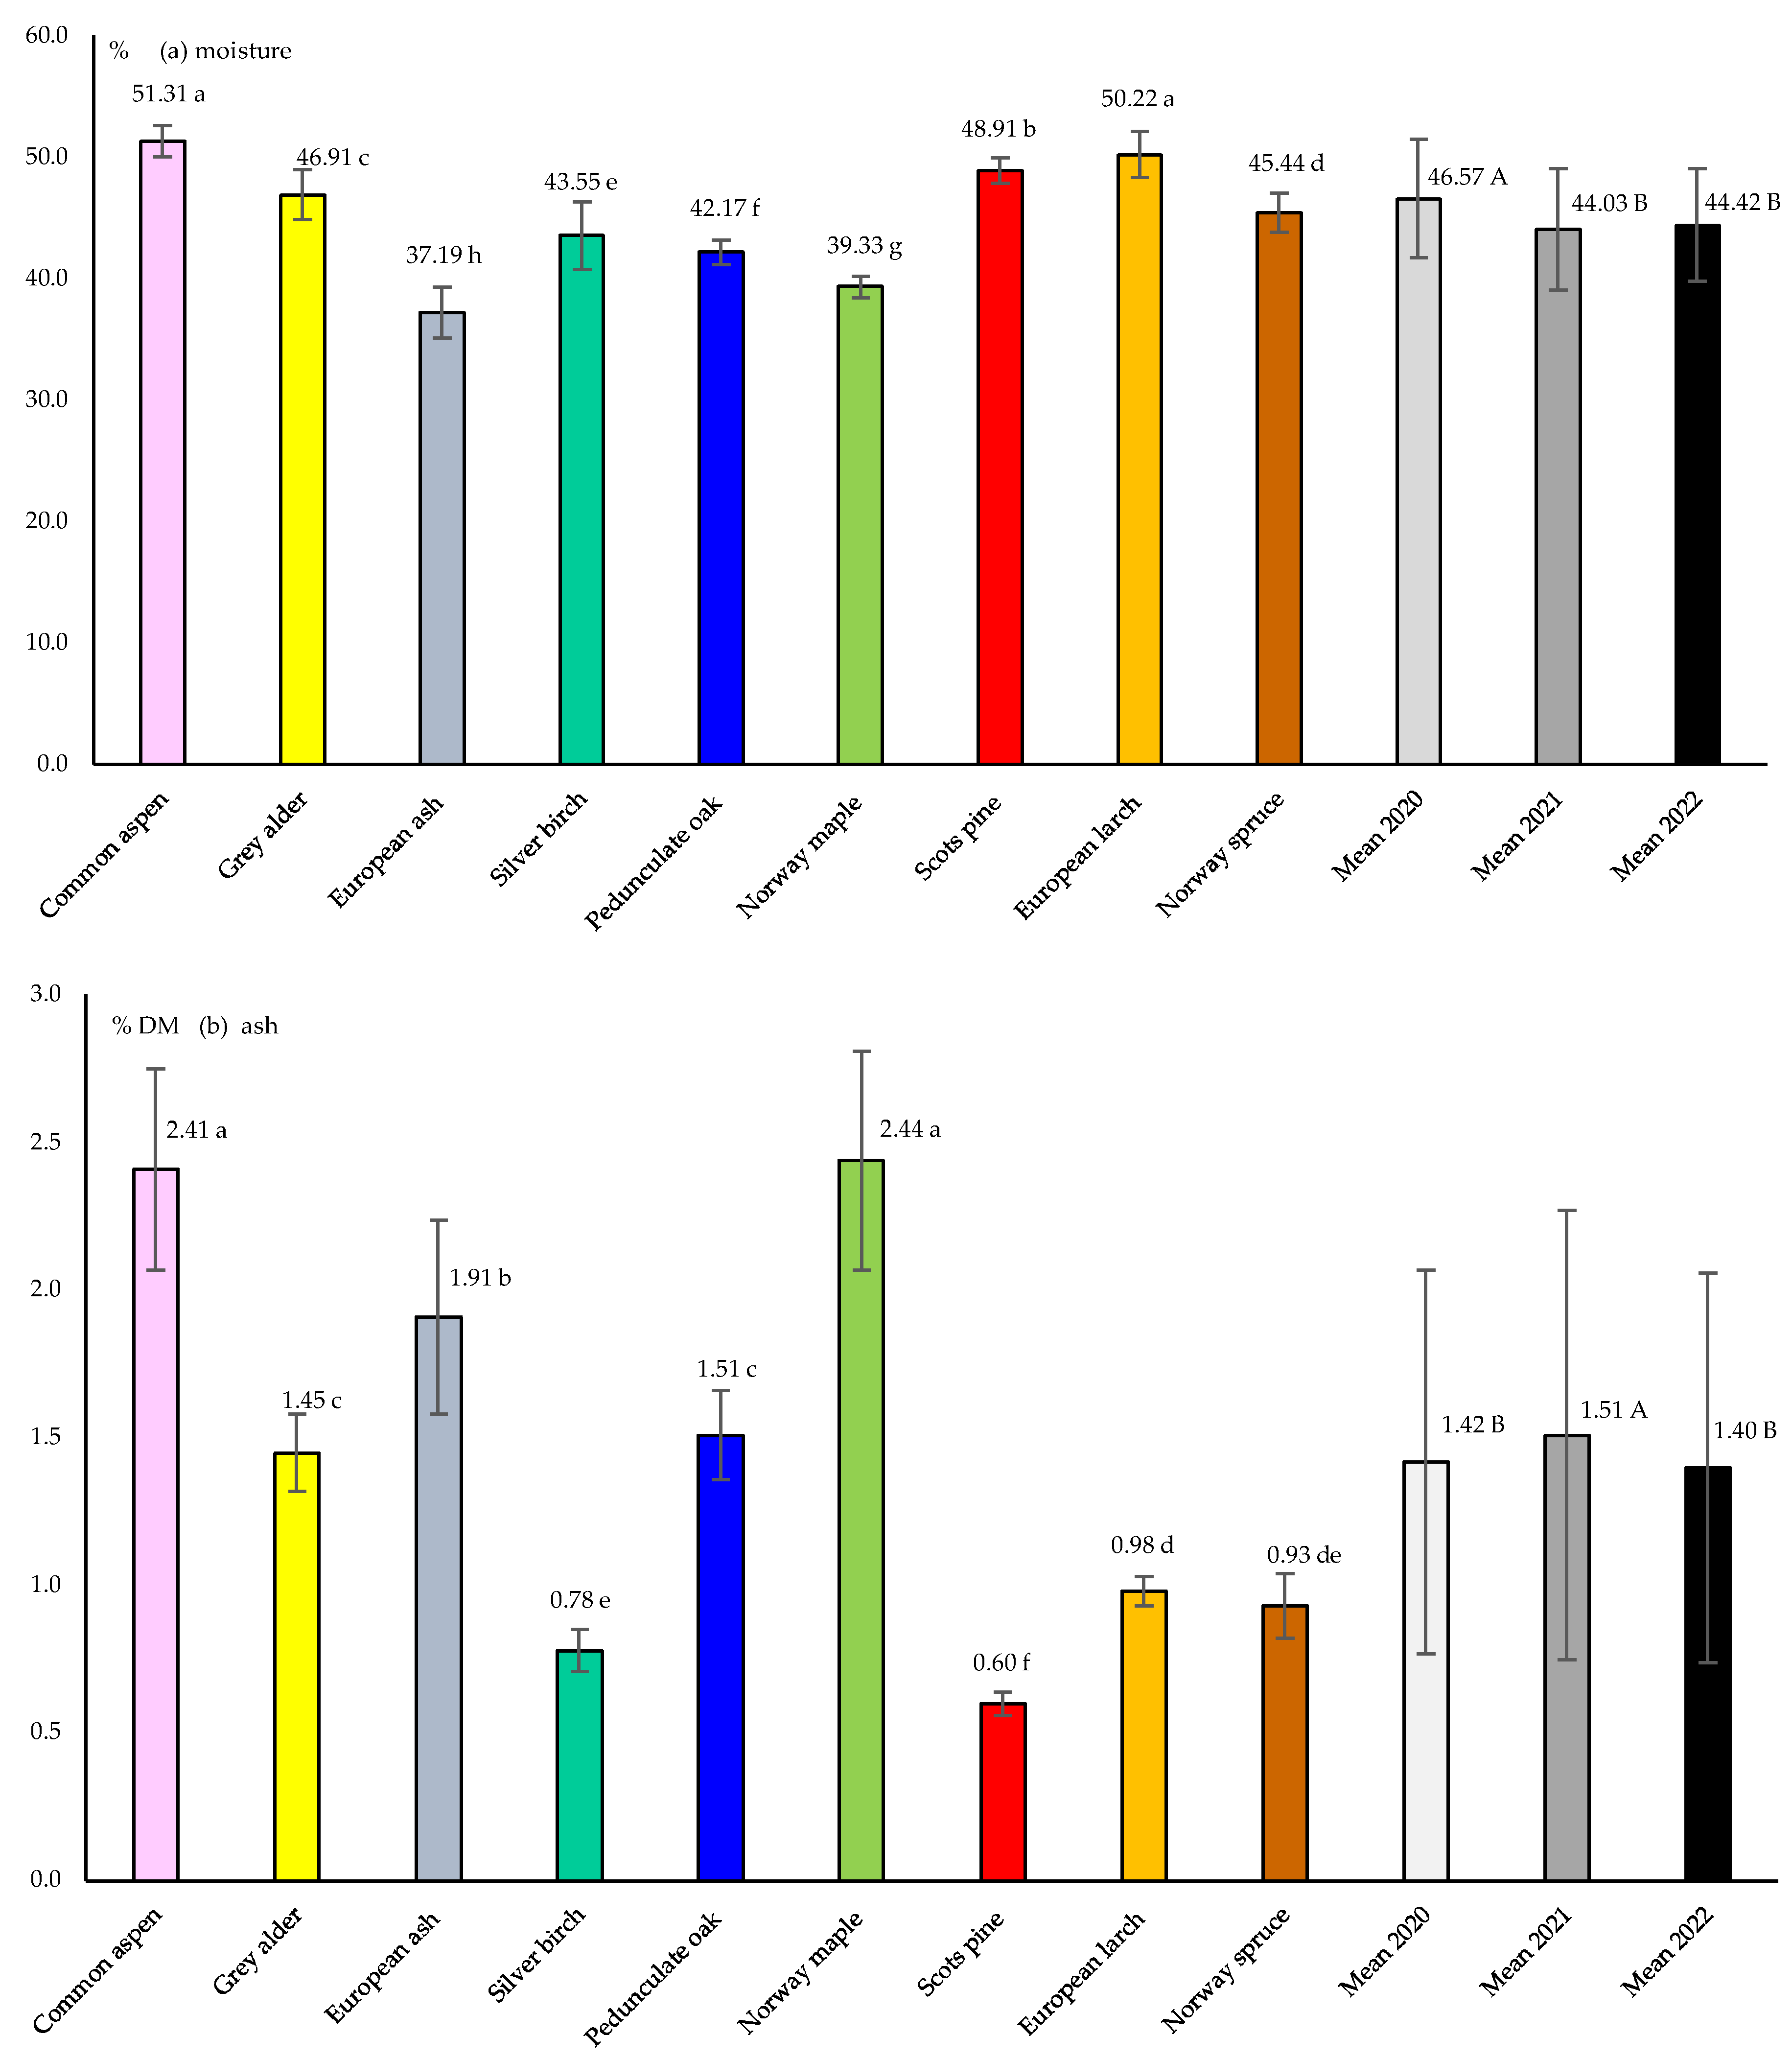
The thermophysical properties under study (MC, Ash, FC, VM, HHV and LHV) were significantly differentiated (p < 0.001) by the main factors (the species and year of harvesting) as well as by the interactions between them (Table 1). Of all the species under study, the branches of the European ash were characterized by the significantly lowest moisture content (37.19%, homogeneous group “h”) (Figure 1a). The branches of the Norway maple were also characterized by a moisture content below 40%. It should be noted that, for these two species, the moisture content of the harvested branches was less than 40% in all three years of the study (Table 2). On the other hand, the highest average moisture content was noted for the branches of the common aspen (51.31%, homogeneous group “a”) (Figure 1a). An equally high average moisture content (50.22%) was noted for the branches of the European larch. However, the average moisture content of the branches of the other five tree species under study ranged from slightly above 42% to nearly 49% for the pedunculate oak and Scots pine, respectively. In turn, throughout the experiment, the moisture content of the branches of all the species under study ranged from 35.38% to 52.67% for the European ash in 2021 and the European larch in 2020, respectively (Table 2). It should also be added that the average moisture content of the branches harvested in 2020 was significantly higher by approximately two percentage points (pp) compared with the average values obtained in 2021 and 2022 (Figure 1a). However, from the practical point of view, it should be stated that these differences were not large. It should also be added that the moisture content of fresh branches in our study was at an acceptable level because the moisture content of the branches or wood immediately after tree felling can reach up to 60% [36]. A moisture content similar to the current results was obtained in Sweden for chips produced from logging residues of mainly Norway spruce with a small addition of Scots pine and birch, which amounted to 50.6% immediately after the harvest [37]. On the other hand, the moisture content of chips produced from small pine logs and twigs was higher (52.5%) [38]. In turn, the moisture content of the short rotation coppice (SRC) shoots immediately after the harvest varied and amounted to approximately 40% for the black locust and 50% and 60% for the willow and aspen, respectively [39,40,41,42]. As the moisture content of woody biomass immediately after the harvest is high, it is often reduced by means of drying in the open air or under a canopy, which results in the moisture content being reduced to as low as approximately 20%, depending on the species and the storage conditions and duration. For example, the moisture content of logging residues after they had dried naturally in summer, depending on the species, ranged from 23.3% through 23.9 and 30.3% to 36.0% for the Norway spruce, Scots pine, silver birch and black alder, respectively [43]. Variations in the moisture content of wood chips from a mixture of different species (29–46%), depending on the period of harvesting, were also confirmed in another study [44], in which the chips had a higher moisture content during winter, with the value of this characteristic being lower in spring and summer by 8 and 17 pp, respectively, and increasing again in autumn. Therefore, the moisture content of woody biomass varies greatly depending on species, atmospheric conditions and storage period.
The branches of the Scots pine were characterized by the significantly lowest ash content of 0.60% DM on average (homogeneous group “f”) (Figure 1b). Moreover, for the remaining two coniferous trees and the silver birch, the average ash content was below 1% DM but was significantly higher than that for the Scots pine. As for three more species (grey alder, European ash and pedunculate oak), the average ash content ranged from 1.45 to 1.91% DM. On the other hand, for the common aspen and Norway maple, the value of this characteristic was the highest and amounted to 2.4% DM (homogeneous group “a”). In addition, in the consecutive years of the study, this value for these two tree species fell in a range of 2.12–2.92% DM (Table 2). In a different study, the ash content of logging residues of Scots pine was also the lowest (0.7% DM) compared with those of the silver birch, Norway spruce and black alder, for which the values were 1.4, 1.4 and 1.9% DM [43]. The cited values were, therefore, similar to those obtained in the current study. As the bark contains more ash than the wood [41], thinner branches that include a higher proportion of the bark in relation to the wood will contain more ash than branches with a larger diameter or pure wood. Therefore, the ash content of the stem wood, branch base, branch twigs and stem bark of the Scots pine was 0.22% DM, 0.48% DM, 1.56% DM and 1.78% DM, respectively [45]. However, the ash content of the wood and bark of the Norway spruce was 0.28% DM and 2.32% DM, respectively [46]. Similar relationships in this regard have been demonstrated for this species in other studies [47]. A very similar low ash content (0.24% DM) was determined in the wood of Norway spruce, and in the bark of the European beech, it was as high as 7.80% DM [48]. Even higher ash content values were determined in the branches and bark of the Greek spruce: 3.2% DM and 9.5% DM, respectively [49]. Therefore, sawmill residues (in the form of sawdust or pieces of pure wood) generally contain less ash (<1% DM) compared with the branches harvested in forests due to the higher proportion of bark in the branches as well as the inclusion of mineral parts [46]. Therefore, the ash content of commercial wood chips in Poland ranged from 2.1 to 4.8% DM [44], while in Sweden, it was 2.9% DM [37].
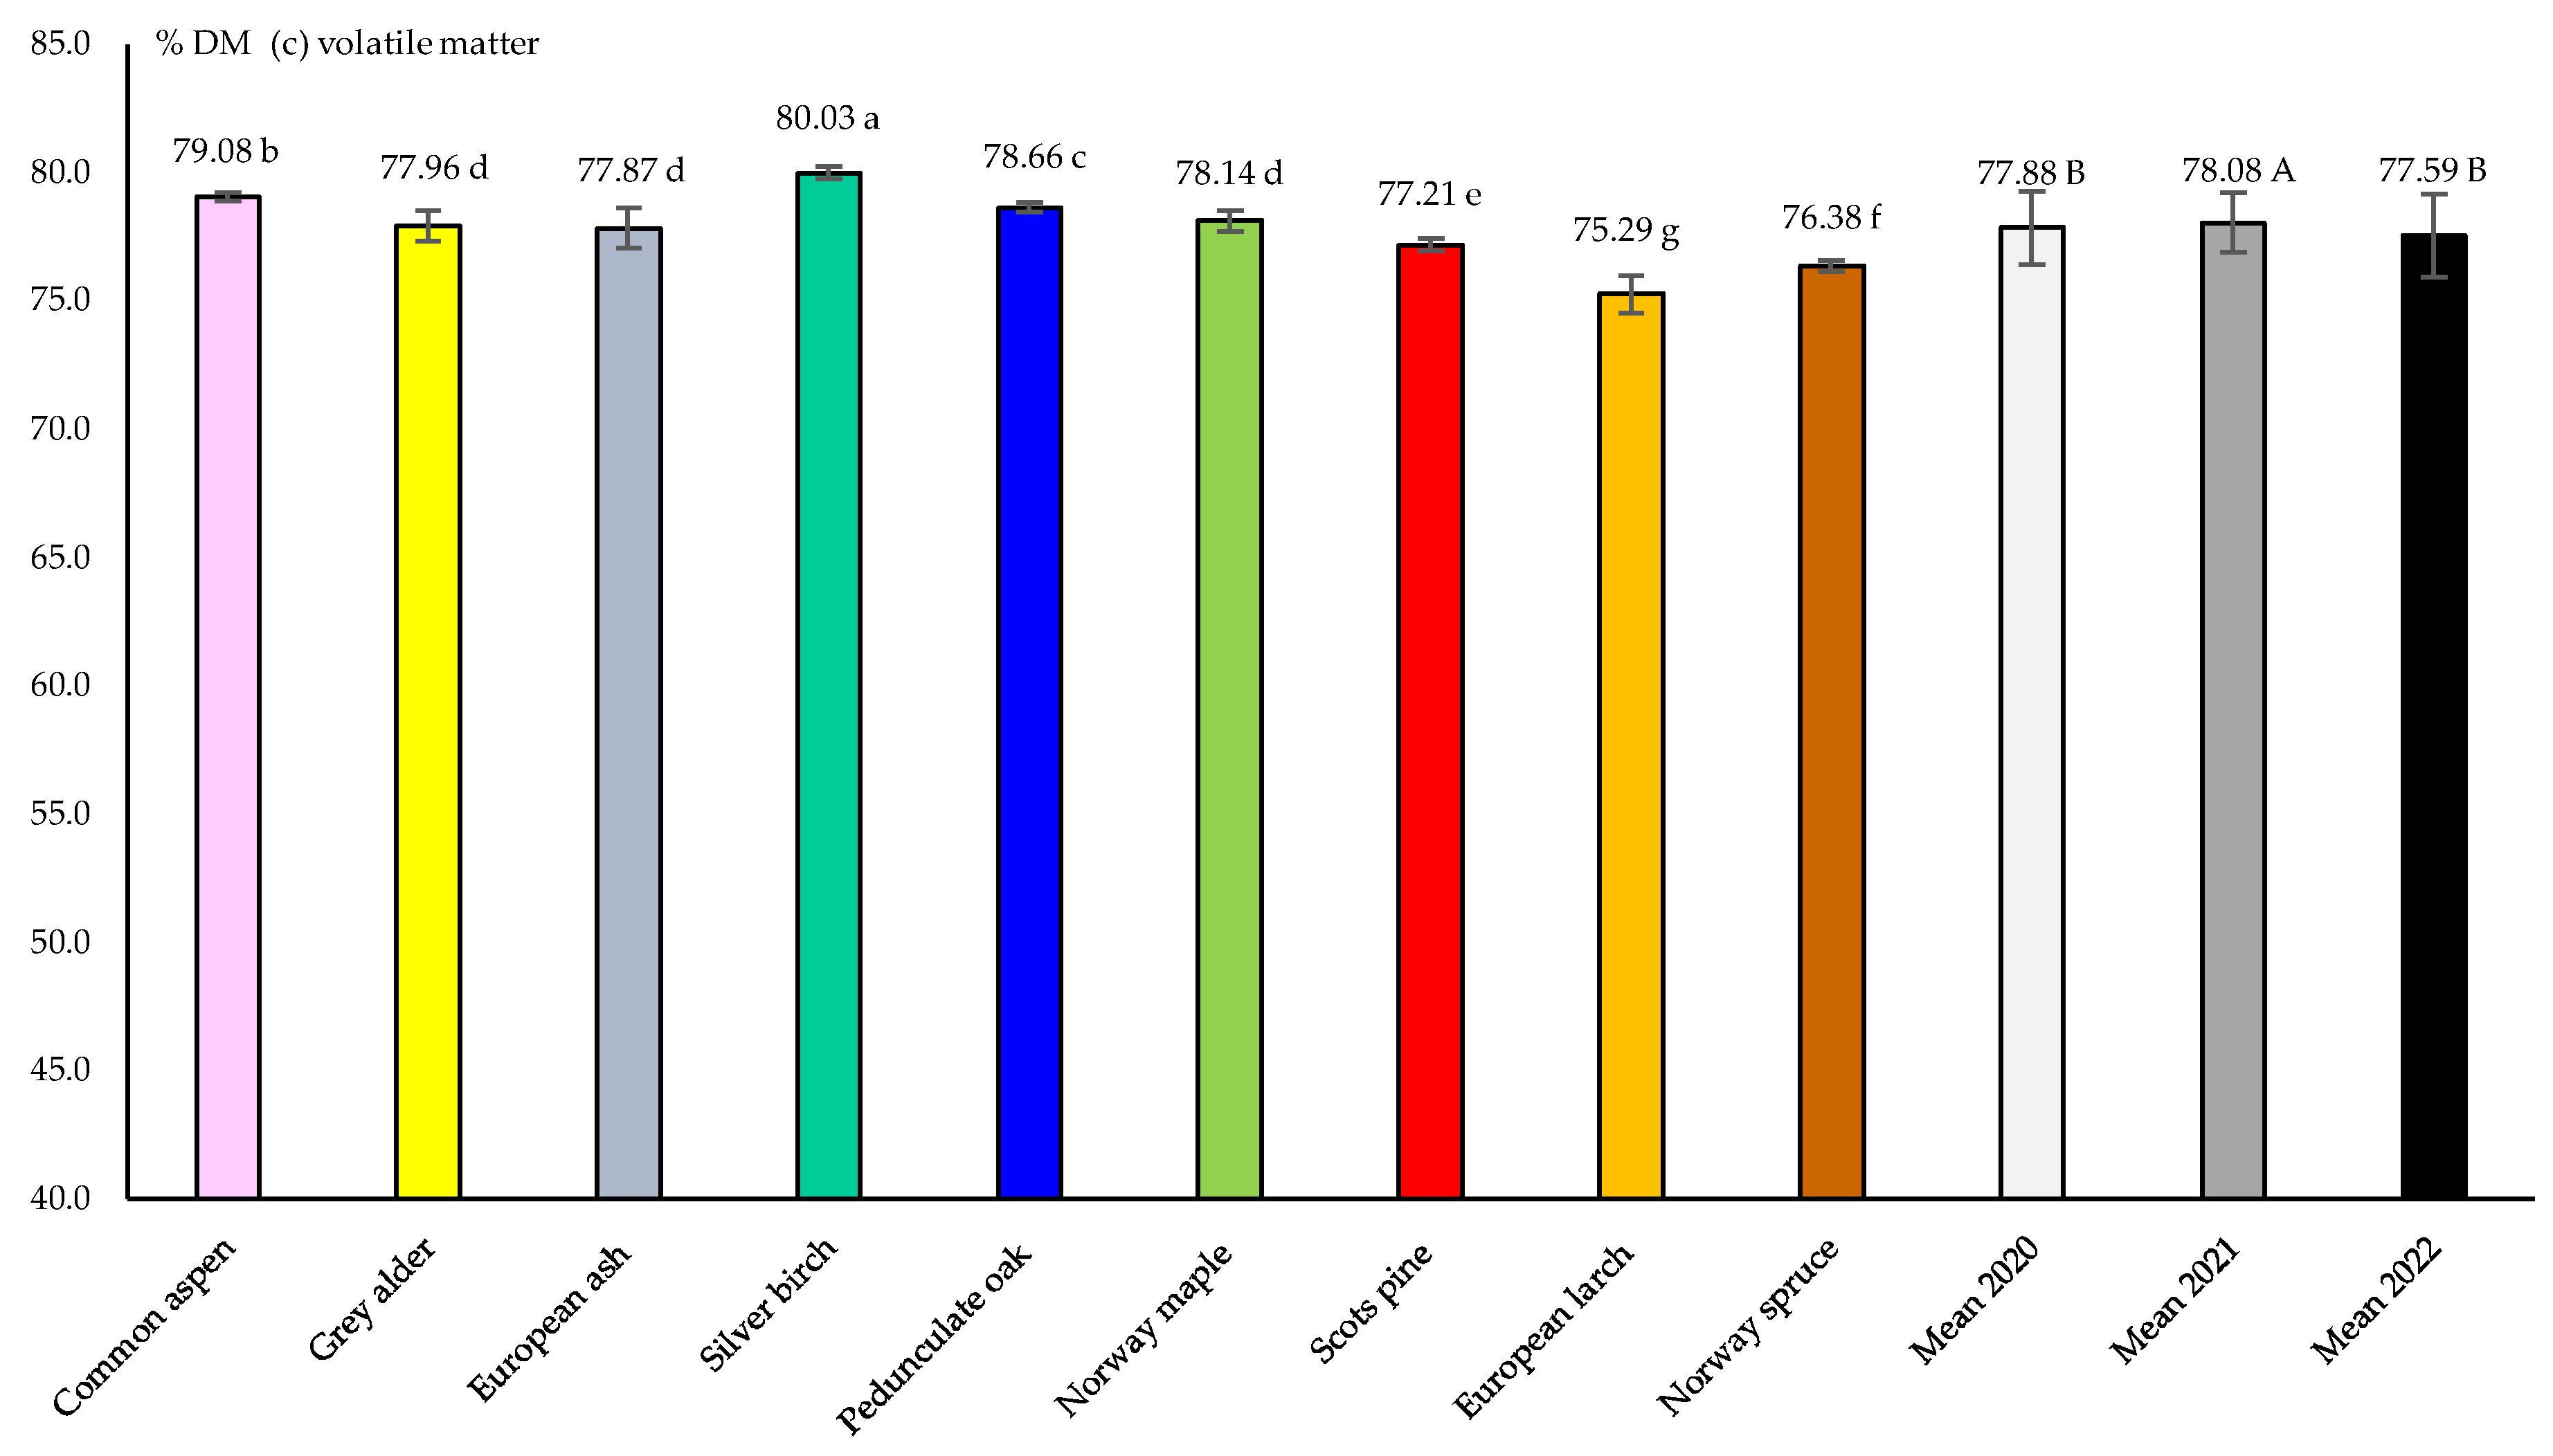
The branches of deciduous trees were, in general, characterized by significantly higher VM contents than coniferous trees (Figure 1c). On the other hand, the European Larch branches had the significantly highest FC content (an average of 23.73% DM, homogeneous group “a”) (Figure 2a). As for the other two coniferous tree species, the value of this characteristic was significantly lower (homogeneous groups “b” and “c”), yet it was still high, as it averaged over 22% DM. In turn, the FC content of the branches of most deciduous tree species was lower and ranged on average from 19.2 to 20.6% DM. The definitely lowest average value for this characteristic was noted for the branches of the common aspen (an average of 18.51% DM, homogeneous group “h”). The above relationships in terms of the VM and FC contents of the branches of coniferous tree species, compared with the deciduous tree species, were observed in all the years of the study (Table 2). Since the FC content was significantly positively correlated with the HHV (Table 3), the HHV of the branches of all the coniferous tree species was over 20 GJ Mg−1 DM, and among them, the highest value was noted for the branches of the Scots pine (20.74 GJ Mg−1 DM) (Figure 2b). As far as the deciduous tree species are concerned, the grey alder and silver birch showed a significantly higher HHV value than the other deciduous tree species. However, these values were still lower as compared to the HHV of the Scots pine by approximately 4%. However, the branches of the Norway maple were characterized by the lowest HHV (18.78 GJ Mg−1 DM), with this value being lower as compared to the Scots pine by approximately 9%. Throughout the experiment, the HHV of the branches ranged from 18.55 GJ Mg−1 DM for the Norway maple in 2022 to 20.95 GJ Mg−1 DM for the Scots pine in 2021 (Table 2).
Another study also demonstrated that the HHV of coniferous tree biomass was higher (20.4–20.5 GJ Mg−1 DM) compared with the deciduous species (19.8–20.2 GJ Mg−1 DM) [50,51]. On the other hand, the HHV of logging residues for the Norway spruce (20.6 GJ Mg−1 DM) was lower by 0.2 GJ Mg−1 DM compared with the Scots pine, silver birch and black alder [43]. Moreover, the bark was characterized by a higher HHV than other types of woody biomass [14,52].
As the LHV was significantly very strongly (−0.95) correlated with the moisture content of the branches (Table 3), the highest average LHV (10.50 GJ Mg−1) was noted for the branches of the European ash, i.e., those with the lowest moisture content (Figure 2c). It should be added here that for this species, the LHV exceeded the value of 10 GJ Mg−1 in each year of the study (Table 2). However, of the remaining eight species, this was also the case only for the silver birch in 2021. On the other hand, the average LHV for the silver birch, pedunculate oak and Norway spruce was in the third homogeneous group, “c”, and for the Norway maple, in the second (“b”) group, with the value of this characteristic being lower (in the range of 7–11%) than the average value for the European ash (Figure 2c). The average LHV values for the branches of three other species, i.e., the grey alder, Scots pine and European larch, were even lower (by 16–21%) and fell within a range of 8.84–8.33 GJ Mg−1 (homogeneous groups “d”–“e”). However, the last homogeneous group, “f”, included the branches of the common aspen, whose average LHV amounted to only 7.59 GJ Mg−1, i.e., was 28% lower compared with the European ash. In another study, the LHV of fresh chips from logging residues, mainly Norway spruce with a small addition of Scots pine and birch, amounted to 8.35% GJ Mg–1 [37] and therefore fell within the lower range obtained in the current study. On the other hand, the LHV of fresh Scots pine biomass was, on average, 8.63 GJ Mg–1 [53]. However, since the LHV of commercial wood chips during the autumn and winter seasons ranged from 8.9 to 9.95 GJ Mg–1 [44], the cited values also fell within the range of results obtained in the current study. Similar LHV values were obtained for fresh SRC shoots, including aspen, willow and black locust shoots, and amounted, on average, to 6.80, 8.10 and 10.25 GJ Mg–1, respectively [54]. On the other hand, the LHV for seasoned, naturally dried chips from logging residues of the black alder, silver birch, Scots pine and Norway spruce was higher and amounted to 11.3, 12.5, 14.0 and 14.1 GJ Mg–1, respectively [43]. Obviously, this mainly resulted from the lower moisture content of naturally dried logging residues of these species.
3.2. The Elemental Composition of the Branches of the Tree Species under Study
The contents of most of the elements under study (C, H, N and S) were significantly differentiated (p < 0.001) by the two main factors (the species and the year of harvesting) and the interactions between them (Table 1). On the other hand, for the Cl content, no significant effect of the year of harvesting was noted. The branches of the Scots pine were characterized by the significantly highest carbon content of 55.03% DM on average (Figure 3a). A high C content (on average, over 54% DM) was also exhibited by the branches of the silver birch and the Norway spruce, followed by the European larch (on average, over 53.73% DM). As for the branches of the four deciduous tree species, the average C content ranged from 51 to 52% DM, with the lowest value for this characteristic (an average of 49.99% DM) found for the branches of the common aspen. In all the years of the study, the C content of the common aspen branches was lower than that of the other tree species under study (Table 4). In another study, the C content of commercial wood chips ranged from 53.44% DM to 56.09% DM for veneer and chips for paper making, respectively [14]. On the other hand, the C content on the Scots pine biomass was, on average, 53.43% DM [53]. A high C content was also exhibited by the SRC shoots of the aspen and willow (on average, slightly above 53.3% DM) as well as the black locust (slightly below 53% DM) [41]. However, in another study, SRC willow contained less C (approximately 49% DM) than the black locust and aspen (on average, over 51.5% DM) [40]. A low C content (48.4% DM) was determined for Pinus sp. sawdust [55], Hevea brasiliensis sawdust (48.5% DM) [56] and Betula pendula wood chips (50.4% DM) [57].
The H content of the branches of all the tree species under study was, on average, over 6% DM (Figure 3b). Although the differences between the species were not excessively large, three homogeneous groups were distinguished. The highest H value (an average of 6.31% DM) was noted for the branches of the silver birch, with European ash and Scots pine also being included in the same homogeneous group. Five species were classified into the next homogeneous group, “b”, while the last group, “c”, contained the European larch (an average of 6.02% DM). Significantly greater variation between the branches of the tree species under study was noted for the N content (Figure 4a). The significantly highest average N content was determined in the branches of the grey alder (0.72% DM) (homogeneous group “a”). Two further deciduous species (the European ash and Norway maple) were included in the second homogeneous group, “b”, with an approximately 25% lower content of this element. Two further deciduous species (the silver birch and pedunculate oak) were classified into another group, with an approximately 38–40% lower N content. As for the coniferous species, the lowest N content (an average of 0.34% DM) was determined for the branches of the common aspen; therefore, this value was lower by almost 53% compared with this content in the branches of the grey alder. On the other hand, the lowest average N content (0.32% DM) throughout the experiment was noted for the branches of the Scots pine (homogeneous group “f”). In the branches of two other coniferous tree species (the Norway spruce and European larch), the N content was higher than that for the Scots pine while being lower in relation to most deciduous tree species. Even lower N contents (an average of 0.12% DM) were found in the Scots pine biomass, with more of this element (0.15% DM) being found in wood slabs than in sawdust (0.08% DM), which might have been due to the greater proportion of the bark in wood slabs [53]. A low N content (0.13% DM) was also noted for other Scots pine sawdust [58]. The N content is definitely higher in the bark compared with pure wood; therefore, commercial chips for paper making (mainly from pine wood) contained an average of 0.11% DM of this element, while the pine bark and birch bark contained 0.41% DM and 0.55% DM, respectively [14]. Similar relationships were also found in other studies [59]. A high N content was noted for the SRC shoots of the willow (0.38% DM) and aspen (0.43% DM). However, the highest N content (0.91% DM) was noted for the SRC shoots of the black locust [41], which resulted from the actual free nitrogen fixation by this species. The cited N content in the black locust shoots was even higher than the N content of the branches of the grey alder obtained in the current study. It should also be stressed that a high N content of solid biofuel is not desirable, as it leads to higher NOx emissions [60].
The branches of the grey alder and European ash were characterized by the significantly highest average S content (0.034% DM) (Figure 4b) in the consecutive years of the study (Table 4). In the second homogeneous group, “b”, the branches of three deciduous tree species (the common aspen, pedunculate oak and Norway maple) and the European larch were classified in terms of the average S content, with the value of this characteristic being approximately 26–29% lower (Figure 4b). The remaining three tree species were classified into the third homogeneous group, “c”, with the average S content being lower by approximately 50–53% compared with the average content of the grey alder branches. The S content was significantly positively correlated with the N content (0.70) and the ash content (0.48) and negatively correlated with the C, HHV, H and MC contents (Table 3). Since the S content is, in general, definitely higher in the bark as compared to pure wood [61], commercial chips for paper making (mainly from pine wood) contained an average of 0.011% DM S, while the birch bark and pine bark contained 0.033% DM and 0.032% DM, respectively [14]. Therefore, the S content of the branches of the grey alder and European ash obtained in the current study was slightly higher than the content of this element in the bark of the birch and pine. A similar (0.033% DM) [41] or higher (0.050% DM) [40] S content was noted for the SRC shoots of the black locust. The S content of biomass is also of importance, as SO2 emissions generated when combusting biomass are determined, inter alia, by the content of this element in biofuels [62].
The branches of the silver birch contained significantly the most Cl (an average of 0.032% DM) (homogeneous group “a”) (Figure 4c) and in each of the consecutive years of the study (Table 4). The branches of the Norway maple and grey alder were classified into the next groups, “b” and “c”, for which the values for this characteristic were 19% and 38% lower, respectively (Figure 4c). On the other hand, the branches of the remaining six tree species were classified into one homogeneous group, “d”, with an average Cl content approximately 56–66% lower compared with that of silver birch. In another study [53], the average Cl content of Scots pine biomass was 0.017% DM. In the cited study, wood slabs contained more Cl (0.022% DM) compared with sawdust (0.011% DM), which was due to the larger proportion of bark in the wood slabs, as bark is characterized by a higher Cl content than wood [63]. The low Cl content of Scots pine wood (0.01% DM) was also confirmed in other studies [64]. A high Cl content of biomass is undesirable, as it increases K release and KCl formation [65]. In addition, during the biomass combustion process, gaseous forms of HCl and Cl2 can be formed and precipitation of CaCl2 can occur.
3.3. Overall Characteristics of Forest Tree Branches as a Solid Biofuel
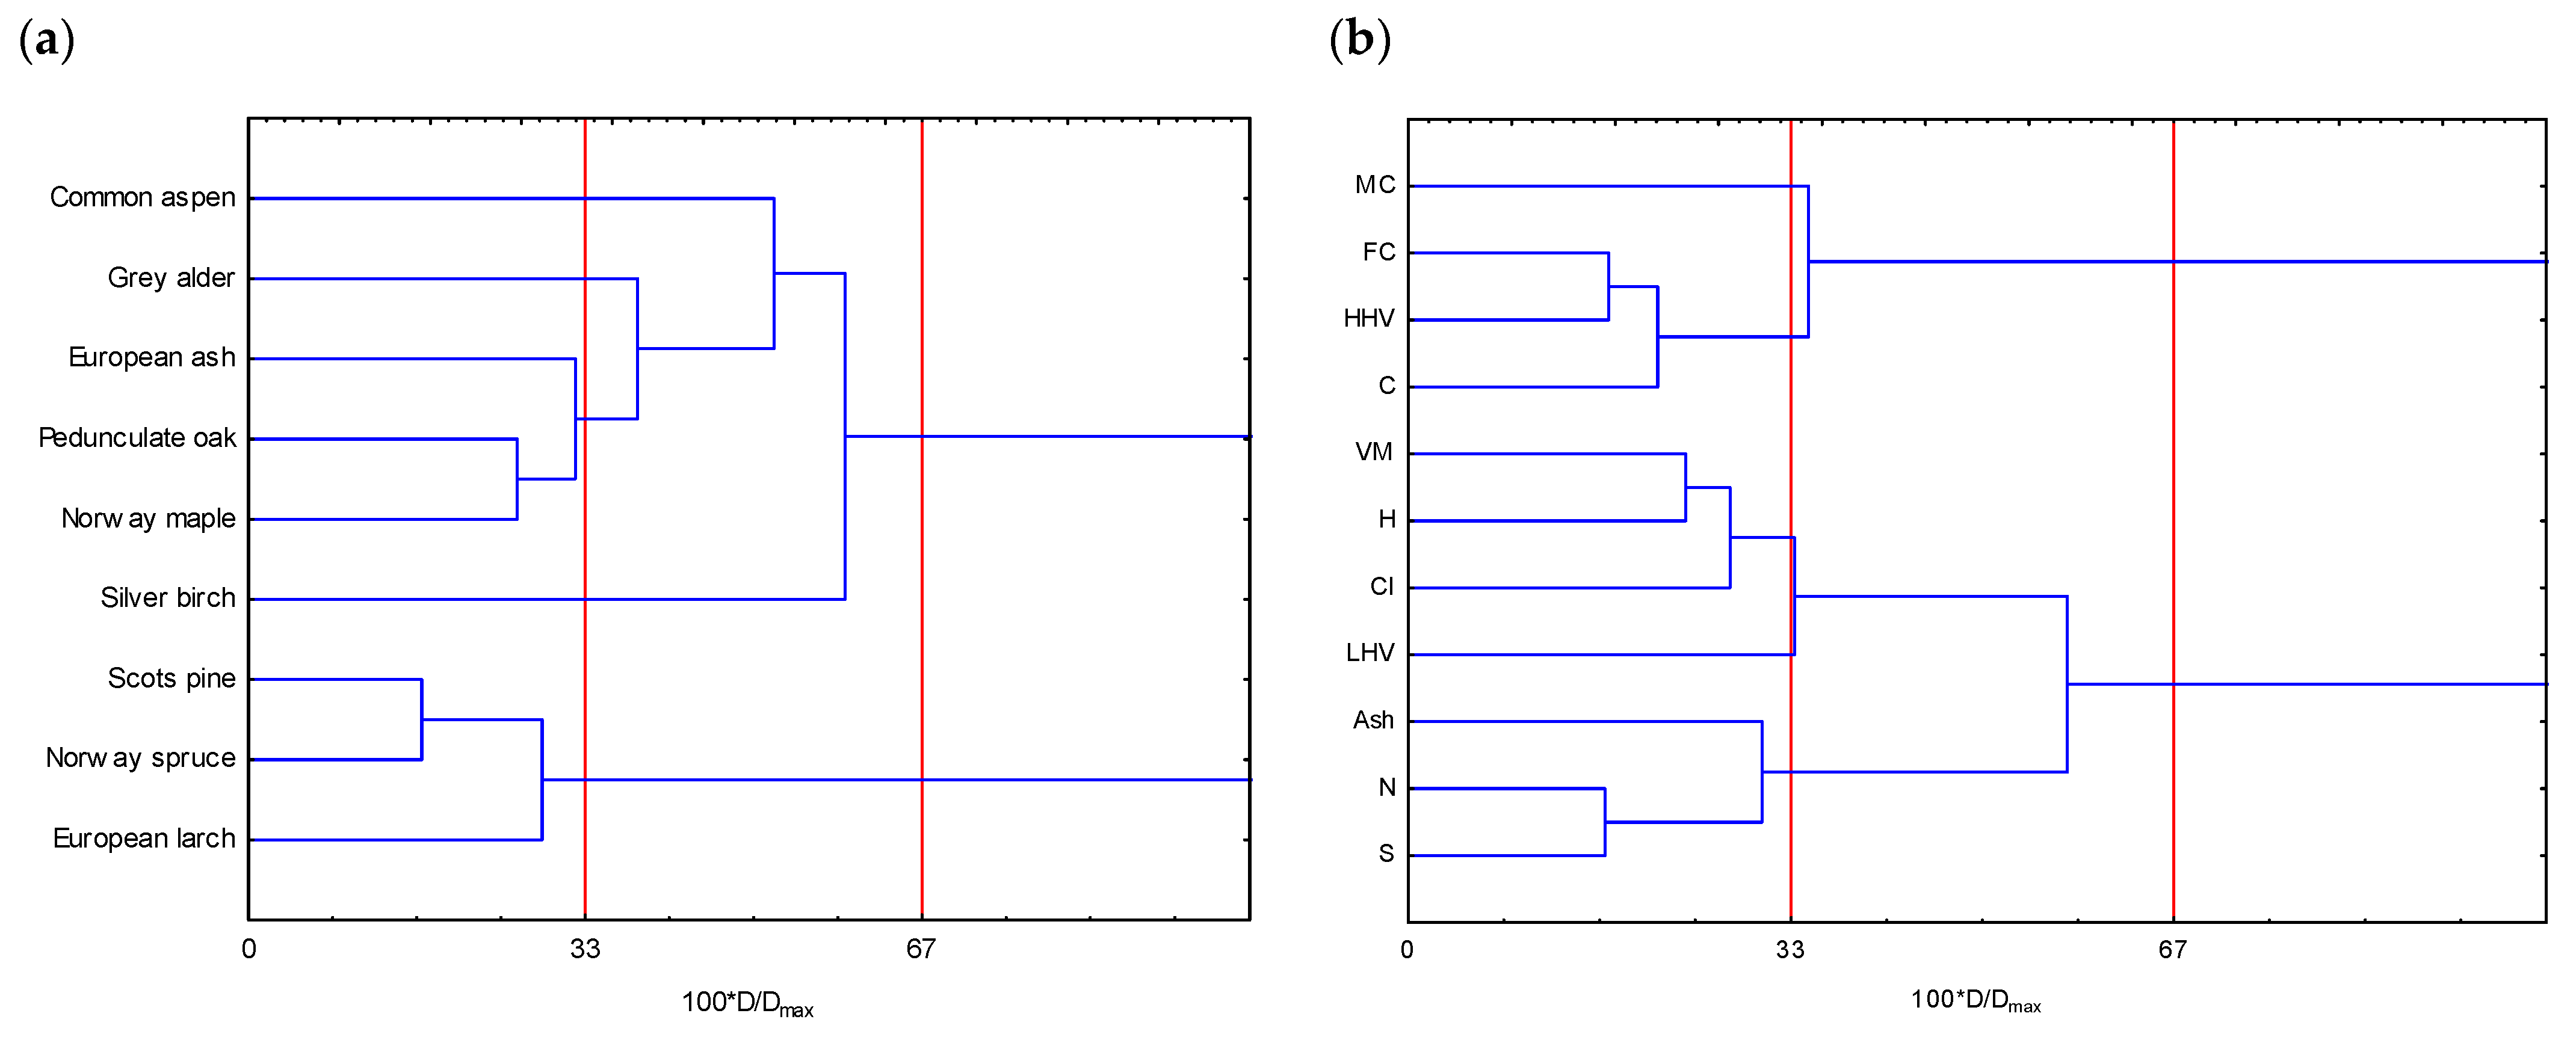
The significant variation in terms of the Cl and ash contents between the branches of forest tree species and the years of the study was confirmed by high variation coefficients of 49.6 and 47.3%, respectively (Table 5). As for the Cl contents, the minimum value was only 0.008% DM, and the maximum value was 0.043% DM, while for ash, these values were 0.54 and 3.00% DM, respectively. On the other hand, the N and S contents exhibited an average variation of 28–29%. Moreover, the range (the minimum value–the maximum value) for N content was from 0.25 to 0.85% DM, while for S, it was from 0.012 to 0.040% DM. In turn, the MC was characterized by an even lower variation (10.9%), with a range from 34.96 to 53.37%. However, the remaining characteristics of the tree branches under study (H, C, FC, VM, HHV and LHV) were characterized by low variation (variation coefficient < 10%). A cluster analysis for the eleven examined characteristics demonstrated that a cut-off of 2/3 Dmax resulted in two separate clusters (Figure 5b). MC, FC, HHV and C were included in one cluster, with the remaining seven characteristics forming a second cluster. However, with a cut-off of 1/3 Dmax, five clusters were formed. MC separated from FC, HHV and C to form two separate clusters. Also, LHV formed its own independent cluster. The ash, N and S contents formed another cluster, as did H, Cl and VM. It was also found for the branches of the tree species under study that with a cut-off of 2/3 Dmax, two main clusters were formed (Figure 5a). Three coniferous tree species (Scots pine, Norway spruce and European larch) and six deciduous tree species formed two independent clusters of their own. In contrast, when the accuracy of the analysis was increased (with a cut-off of 1/3 Dmax), five clusters were distinguished. Three coniferous tree species still formed a single cluster, which indicates their very similar properties. However, it should be noted that the Scots pine was more closely related to the Norway spruce than to the European larch. The deciduous tree species, on the other hand, were divided into four clusters, with three species (European ash, pedunculate oak and Norway maple) forming a common cluster, which indicates their very similar properties. However, the pedunculate oak and Norway maple were more closely related to each other than to the European ash. On the other hand, three independent clusters were formed for the branches of the remaining three deciduous tree species, i.e., the common aspen, grey alder and silver birch, which proves their distinctiveness. It should also be mentioned that, in addition to the quality of the dendromass, another important issue is the energy intensity of the woodchip production process for different tree species. This is important because it can affect the final assessment of the energy efficiency of the entire energy production process, from wood harvesting through logistics to energy generation. Indeed, other studies have shown that when using low-powered chippers, ash requires the most energy, followed by pine and spruce [66].
4. Conclusions
Tree branches, being a residue from the harvesting of forest trees for timber industry purposes, represent a source of solid biomass for energy purposes. This study analyzed the energy-important characteristics of fresh branches from nine different tree species (including three coniferous species and six deciduous species) over three consecutive years. The results obtained demonstrated significant variation between the species under study as well as between the years of the study and the interactions between the main factors. This information is important from scientific and practical points of view and can be helpful in making a decision on using chips from the branches of various tree species as a solid biofuel for renewable energy generation. The branches of all three coniferous tree species (Scots pine, Norway spruce and European larch) were characterized by similar properties and formed one common cluster, even though the Scots pine was more closely related to the Norway spruce than to the European larch. Moreover, the branches of the Scots pine were characterized by the highest HHV and C contents, by the lowest ash and N contents, and by low S and Cl contents. On the other hand, the highest LHV was noted for the branches of the European ash. Moreover, the European ash, pedunculate oak and Norway maple formed a common cluster, indicating their very similar properties. However, the latter two species were more closely related to each other than to the European ash. Furthermore, the branches of the common aspen, grey alder and silver birch formed three independent clusters of their own, which demonstrates their distinctiveness. Information on the characteristics of the energy properties of the branches of different tree species can help in planning the supply of solid biofuel from branches of selected tree species to a specific bioenergy installation. Variations in the moisture content, LHV and elemental composition of branches in the studied species can directly impact a bioenergy plant’s cost and efficiency. These factors must, therefore, be considered for optimal operation.
Author Contributions
Conceptualization, M.J.S.; methodology, M.J.S., N.W., M.S. and T.K.D.; validation, M.J.S., N.W., M.S. and T.K.D.; formal analysis, M.J.S., N.W., M.S. and T.K.D.; investigation, M.J.S., N.W., M.S. and T.K.D.; resources, M.J.S., N.W., M.S. and T.K.D.; data curation, M.J.S., N.W., M.S. and T.K.D.; writing—original draft preparation, M.J.S.; writing—review and editing, M.J.S., N.W., M.S. and T.K.D.; visualization, M.J.S.; supervision, M.J.S.; project administration, M.J.S.; funding acquisition, M.J.S. All authors have read and agreed to the published version of the manuscript.
Funding
The results presented in this paper were obtained as part of a comprehensive study financed by the University of Warmia and Mazury in Olsztyn, Faculty of Agriculture and Forestry, Department of Genetics, Plant Breeding and Bioresource Engineering (grant no. 30.610.007-110).
Data Availability Statement
The data presented in this study are available on request from the corresponding author.
Acknowledgments
We would like to thank the staff of the Department of Genetics, Plant Breeding and Bioresource Engineering for their technical support during the experiment.
Conflicts of Interest
The authors declare no conflicts of interest.
References
- Eurostat. Energy Imports Dependency. 2024. Available online: https://ec.europa.eu/eurostat/databrowser/view/NRG_IND_ID__custom_9437402/default/table?Lang=en (accessed on 21 January 2024).
- Eurostat. Share of Energy from Renewable Sources. 2024. Available online: https://ec.europa.eu/eurostat/databrowser/view/NRG_IND_REN__custom_9437410/default/table?Lang=en (accessed on 21 January 2024).
- Statistics Poland. Energy from Renewable Sources in 2022; Statistics Poland: Warsaw/Rzeszow, Poland, 2023. [Google Scholar]
- Gradziuk, P. The Economic Importance and Possibilities of Using Straw for Energy Purposes in Poland; Institute of Soil Science and Plant Cultivation State Research Institute: Puławy, Poland, 2015. [Google Scholar]
- Scordia, D.; Papazoglou, E.G.; Kotoula, D.; Sanz, M.; Ciria, C.S.; Pérez, J.; Maliarenko, O.; Prysiazhniuk, O.; von Cossel, M.; Greiner, B.E.; et al. Towards Identifying Industrial Crop Types and Associated Agronomies to Improve Biomass Production from Marginal Lands in Europe. GCB Bioenergy 2022, 14, 710–734. [Google Scholar] [CrossRef]
- Matyka, M.; Radzikowski, P. Productivity and Biometric Characteristics of 11 Varieties of Willow Cultivated on Marginal Soil. Agriculture 2020, 10, 616. [Google Scholar] [CrossRef]
- Amaducci, S.; Facciotto, G.; Bergante, S.; Perego, A.; Serra, P.; Ferrarini, A.; Chimento, C. Biomass Production and Energy Balance of Herbaceous and Woody Crops on Marginal Soils in the Po Valley. GCB Bioenergy 2017, 9, 31–45. [Google Scholar] [CrossRef]
- Jankowski, K.J.; Dubis, B.; Sokólski, M.M.; Załuski, D.; Bórawski, P.; Szempliński, W. Biomass Yield and Energy Balance of Virginia Fanpetals in Different Production Technologies in North-Eastern Poland. Energy 2019, 185, 612–623. [Google Scholar] [CrossRef]
- Jankowski, K.J.; Dubis, B.; Kozak, M. Sewage Sludge and the Energy Balance of Jerusalem Artichoke Production—A Case Study in North-Eastern Poland. Energy 2021, 236, 121545. [Google Scholar] [CrossRef]
- Picchio, R.; Latterini, F.; Venanzi, R.; Stefanoni, W.; Suardi, A.; Tocci, D.; Pari, L. Pellet Production from Woody and Non-Woody Feedstocks: A Review on Biomass Quality Evaluation. Energies 2020, 13, 2937. [Google Scholar] [CrossRef]
- Enström, J.; Eriksson, A.; Eliasson, L.; Larsson, A.; Olsson, L. Wood Chip Supply from Forest to Port of Loading—A Simulation Study. Biomass Bioenergy 2021, 152, 106182. [Google Scholar] [CrossRef]
- Stolarski, J.; Wierzbicki, S.; Nitkiewicz, S.; Stolarski, M.J. Wood Chip Production Efficiency Depending on Chipper Type. Energies 2023, 16, 4894. [Google Scholar] [CrossRef]
- The State Forests National Forest Holding, Technical Conditions—Wood Residues, Annex 12 to Regulation No. 51 of DGLP of 30/09/2019. Available online: http://drewno.zilp.lasy.gov.pl/drewno/Normy/12._pozostaosci_drzewne.pdf (accessed on 21 January 2024).
- Stolarski, M.J.; Krzyżaniak, M.; Olba-Zięty, E.; Stolarski, J. Changes in Commercial Dendromass Properties Depending on Type and Acquisition Time. Energies 2023, 16, 7973. [Google Scholar] [CrossRef]
- Lauri, P.; Havlík, P.; Kindermann, G.; Forsell, N.; Böttcher, H.; Obersteiner, M. Woody Biomass Energy Potential in 2050. Energy Policy 2014, 66, 19–31. [Google Scholar] [CrossRef]
- Verkerk, P.J.; Anttila, P.; Eggers, J.; Lindner, M.; Asikainen, A. The Realisable Potential Supply of Woody Biomass from Forests in the European Union. For. Ecol. Manag. 2011, 261, 2007–2015. [Google Scholar] [CrossRef]
- Statistics Poland. Forestry in 2022; Signal Information; Statistics Poland: Warsaw, Poland, 2023; p. 5. [Google Scholar]
- Statistics Poland. Statistical Yearbook of Forestry 2022; Statistical Publishing Establishment; Statistics Poland: Warsaw, Poland, 2022; p. 360. [Google Scholar]
- Roszyk, E.; Mania, P.; Iwańska, E.; Kusiak, W.; Broda, M. Mechanical Performance of Scots Pine Wood from Northwestern Poland—A Case Study. Bioresources 2020, 15, 6781–6794. [Google Scholar] [CrossRef]
- Kozakiewicz, P.; Jankowska, A.; Mamiński, M.; Marciszewska, K.; Ciurzycki, W.; Tulik, M. The Wood of Scots Pine (Pinus sylvestris L.) from Post-Agricultural Lands Has Suitable Properties for the Timber Industry. Forests 2020, 11, 1033. [Google Scholar] [CrossRef]
- Demirbas, A. Reuse of Wood Wastes for Energy Generation. Energy Sources Part A Recovery Util. Environ. Eff. 2009, 31, 1687–1693. [Google Scholar] [CrossRef]
- Pedišius, N.; Praspaliauskas, M.; Pedišius, J.; Dzenajavičienė, E.F. Analysis of Wood Chip Characteristics for Energy Production in Lithuania. Energies 2021, 14, 3931. [Google Scholar] [CrossRef]
- Moriana, R.; Vilaplana, F.; Ek, M. Forest Residues as Renewable Resources for Bio-Based Polymeric Materials and Bioenergy: Chemical Composition, Structure and Thermal Properties. Cellulose 2015, 22, 3409–3423. [Google Scholar] [CrossRef]
- Vusić, D.; Vujanić, F.; Pešić, K.; Šafran, B.; Jurišić, V.; Zečić, Ž. Variability of Normative Properties of Wood Chips and Implications to Quality Control. Energies 2021, 14, 3789. [Google Scholar] [CrossRef]
- Irdla, M.; Padari, A.; Kurvits, V.; Muiste, P. The Chipping Cost of Wood Raw Material for Fuel in Estonian Conditions. For. Stud. 2017, 66, 65–74. [Google Scholar] [CrossRef]
- Wojciechowska, N. Evaluation of Properties of Selected Forest Solid Biofuels on the Background of Fossil Fuels. Master’s Thesis, University of Warmia and Mazury in Olsztyn, Olsztyn, Poland, 2021; p. 47. [Google Scholar]
- Seliwiak, M. Assessment of Energy Properties of Selected Solid Biofuels of Forest Origin against the Background of Coal Fuels. Master’s Thesis, University of Warmia and Mazury in Olsztyn, Olsztyn, Poland, 2022; p. 33. [Google Scholar]
- Dobrzański, T.K. Forest-Based Solid Biofuels as an Energy Feedstock. Master’s Thesis, University of Warmia and Mazury in Olsztyn, Olsztyn, Poland, 2023; p. 52. [Google Scholar]
- PN-EN ISO 18134-2; Solid Biofuels–Determination of Moisture Content–Dryer Method–Part 2: Total Moisture–Simplified Method. Polish Standardization Committee: Warsaw, Poland, 2014.
- PN-EN ISO 18122:2016-01; Solid Biofuels—Determination of Ash Content. Polish Standardization Committee: Warsaw, Poland, 2016.
- PN-EN ISO 18123:2016-01; Solid Biofuels—Determination of Volatile Matter Content. Polish Standardization Committee: Warsaw, Poland, 2016.
- PN-EN ISO 16948:2015-07; Solid Biofuels—Determination of Total Content of Carbon, Hydrogen and Nitrogen. Polish Standardization Committee: Warsaw, Poland, 2015.
- PN-EN ISO 16994:2016-10; Solid Biofuels—Determination of Total Content of Sulfur and Chlorine. Polish Standardization Committee: Warsaw, Poland, 2016.
- PN-ISO 587:2000; Solid Fuels—Determination of Chlorine Using Eschka Mixture. Polish Standardization Committee: Warsaw, Poland, 2000.
- PN-EN ISO 18125:2017-07; Solid Biofuels—Determination of Calorific Value. Polish Standardization Committee: Warsaw, Poland, 2017.
- Kask, Ü.; Vares, V.; Saareoks, M. Wood Fuel User Manual, 1st ed.; Tartu Regional Energy Agency: Tartu, Estonia, 2020; pp. 14–43. [Google Scholar]
- Anerud, E.; Jirjis, R.; Larsson, G.; Eliasson, L. Fuel Quality of Stored Wood Chips—Influence of Semi-Permeable Covering Material. Appl. Energy 2018, 231, 628–634. [Google Scholar] [CrossRef]
- Deboni, T.L.; Simioni, F.J.; Brand, M.A.; Lopes, G.P. Evolution of the Quality of Forest Biomass for Energy Generation in a Cogeneration Plant. Renew. Energy 2019, 135, 1291–1302. [Google Scholar] [CrossRef]
- Sabatti, M.; Fabbrini, F.; Harfouche, A.; Beritognolo, I.; Mareschi, L.; Carlini, M.; Paris, P.; Scarascia-Mugnozza, G. Evaluation of Biomass Production Potential and Heating Value of Hybrid Poplar Genotypes in a Short-Rotation Culture in Italy. Ind. Crops Prod. 2014, 61, 62–73. [Google Scholar] [CrossRef]
- Monedero, E.; Hernández, J.; Collado, R. Combustion-Related Properties of Poplar, Willow and Black Locust to Be Used as Fuels in Power Plants. Energies 2017, 10, 997. [Google Scholar] [CrossRef]
- Stachowicz, P.; Stolarski, M.J. Thermophysical Properties and Elemental Composition of Black Locust, Poplar and Willow Biomass. Energies 2022, 16, 305. [Google Scholar] [CrossRef]
- Mitsui, Y.; Seto, S.; Nishio, M.; Minato, K.; Ishizawa, K.; Satoh, S. Willow Clones with High Biomass Yield in Short Rotation Coppice in the Southern Region of Tohoku District (Japan). Biomass Bioenergy 2010, 34, 467–473. [Google Scholar] [CrossRef]
- Kurvits, V.; Ots, K.; Kangur, A.; Korjus, H.; Muiste, P. Assessment of Load and Quality of Logging Residues from Clear-Felling Areas in Järvselja: A Case Study from Southeast Estonia. Cent. Eur. For. J. 2020, 66, 3–11. [Google Scholar] [CrossRef]
- Stolarski, M.J.; Stachowicz, P.; Sieniawski, W.; Krzyżaniak, M.; Olba-Zięty, E. Quality and Delivery Costs of Wood Chips by Railway vs. Road Transport. Energies 2021, 14, 6877. [Google Scholar] [CrossRef]
- Dibdiakova, J.; Wang, L.; Li, H. Characterization of Ashes from Pinus sylvestris Forest Biomass. Energy Procedia 2015, 75, 186–191. [Google Scholar] [CrossRef]
- Palacka, M.; Vician, P.; Holubčík, M.; Jandačka, J. The Energy Characteristics of Different Parts of the Tree. Procedia Eng. 2017, 192, 654–658. [Google Scholar] [CrossRef]
- Neiva, D.M.; Araújo, S.; Gominho, J.; Carneiro, A.d.C.; Pereira, H. An Integrated Characterization of Picea abies Industrial Bark Regarding Chemical Composition, Thermal Properties and Polar Extracts Activity. PLoS ONE 2018, 13, e0208270. [Google Scholar] [CrossRef]
- Nosek, R.; Holubcik, M.; Jandacka, J. The Impact of Bark Content of Wood Biomass on Biofuel Properties. Bioresources 2015, 11, 44–53. [Google Scholar] [CrossRef]
- Ninikas, K.; Ntalos, G.; Mitani, A.; Koutsianitis, D. Calorific Values from Greek Spruce Residues and Bioenergy Potentials via Pellet Production. Pro Ligno 2019, 15, 300–305. [Google Scholar]
- Telmo, C.; Lousada, J.; Moreira, N. Proximate Analysis, Backwards Stepwise Regression between Gross Calorific Value, Ultimate and Chemical Analysis of Wood. Bioresour. Technol. 2010, 101, 3808–3815. [Google Scholar] [CrossRef] [PubMed]
- Pretzsch, H. Forest Dynamics, Growth and Yield from Measurement to Model, 1st ed.; Springer: Berlin/Heidelberg, Germany, 2009; pp. 90–93. [Google Scholar]
- Feng, S.; Cheng, S.; Yuan, Z.; Leitch, M.; Xu, C. Valorization of Bark for Chemicals and Materials: A Review. Renew. Sustain. Energy Rev. 2013, 26, 560–578. [Google Scholar] [CrossRef]
- Dudziec, P.; Stachowicz, P.; Stolarski, M.J. Diversity of Properties of Sawmill Residues Used as Feedstock for Energy Generation. Renew. Energy 2023, 202, 822–833. [Google Scholar] [CrossRef]
- Stachowicz, P.; Stolarski, M.J. Short Rotation Woody Crops and Forest Biomass Sawdust Mixture Pellet Quality. Ind. Crops Prod. 2023, 197, 116604. [Google Scholar] [CrossRef]
- Chen, T.; Deng, C.; Liu, R. Effect of Selective Condensation on the Characterization of Bio-Oil from Pine Sawdust Fast Pyrolysis Using a Fluidized-Bed Reactor. Energy Fuels 2010, 24, 6616–6623. [Google Scholar] [CrossRef]
- Ali, L.; Ahmed Baloch, K.; Palamanit, A.; Raza, S.A.; Laohaprapanon, S.; Techato, K. Physicochemical Characterisation and the Prospects of Biofuel Production from Rubberwood Sawdust and Sewage Sludge. Sustainability 2021, 13, 5942. [Google Scholar] [CrossRef]
- Sarker, S.; Nielsen, H.K. Preliminary Fixed-Bed Downdraft Gasification of Birch Woodchips. Int. J. Environ. Sci. Technol. 2015, 12, 2119–2126. [Google Scholar] [CrossRef]
- Rosas, J.G.; Gómez, N.; Cara-Jiménez, J.; González-Arias, J.; Olego, M.Á.; Sánchez, M.E. Evaluation of Joint Management of Pine Wood Waste and Residual Microalgae for Agricultural Application. Sustainability 2020, 13, 53. [Google Scholar] [CrossRef]
- García, R.; Pizarro, C.; Lavín, A.G.; Bueno, J.L. Spanish Biofuels Heating Value Estimation. Part I: Ultimate Analysis Data. Fuel 2014, 117, 1130–1138. [Google Scholar] [CrossRef]
- Filbakk, T.; Jirjis, R.; Nurmi, J.; Høibø, O. The Effect of Bark Content on Quality Parameters of Scots Pine (Pinus sylvestris L.) Pellets. Biomass Bioenergy 2011, 35, 3342–3349. [Google Scholar] [CrossRef]
- Kraszkiewicz, A. Chemical Composition and Selected Energy Properties of Black Locust Bark (Robinia Pseudoacacia L.). Agric. Eng. 2016, 20, 117–124. [Google Scholar] [CrossRef]
- He, Y.; Zhao, Y.; Chai, M.; Zhou, Z.; Sarker, M.; Li, C.; Liu, R.; Cai, J.; Liu, X. Comparative Study of Fast Pyrolysis, Hydropyrolysis and Catalytic Hydropyrolysis of Poplar Sawdust and Rice Husk in a Modified Py-GC/MS Microreactor System: Insights into Product Distribution, Quantum Description and Reaction Mechanism. Renew. Sustain. Energy Rev. 2020, 119, 109604. [Google Scholar] [CrossRef]
- Alakangas, E.; Hurskainen, M.; Laatikainen-Luntama, J.; Korhonen, J. Properties of Indigenous Fuels in Finland, 1st ed.; VTT Technical Research Centre of Finland Ltd.: Jyväskylä, Finland, 2016. [Google Scholar]
- Fiala, M.; Nonini, L. Biomass and Biofuels. EPJ Web Conf. 2018, 189, 00006. [Google Scholar] [CrossRef]
- Han, K.; Gao, J.; Qi, J. The Study of Sulphur Retention Characteristics of Biomass Briquettes during Combustion. Energy 2019, 186, 115788. [Google Scholar] [CrossRef]
- Warguła, Ł.; Kukla, M.; Wieczorek, B.; Krawiec, P. Energy Consumption of the Wood Size Reduction Processes with Employment of a Low-Power Machines with Various Cutting Mechanisms. Renew. Energy 2022, 181, 630–639. [Google Scholar] [CrossRef]
Figure 1.
The average moisture content (a), ash content (b) and volatile matter content (c) values for the branches of the studied tree species from the three consecutive years of harvesting and the average values for each year. a, b, c, d, e, f, g, h denote homogeneous groups for the species presented separately for each characteristic; A, B, C denote homogeneous groups for the year of harvesting presented separately for each characteristic; error bars denote standard deviations.


Figure 2.
The fixed carbon content (a), the higher heating value (b) and the lower heating value (c), on average for the branches of the tree species under study from the three consecutive years of harvesting and the average values for each year. a, b, c, d, e, f, g, h denote homogeneous groups for the species presented separately for each characteristic; A, B, C denote homogeneous groups for the year of harvesting presented separately for each characteristic; error bars denote standard deviations.


Figure 3.
The average carbon (a) and hydrogen (b) contents for the branches of the tree species under study from the three consecutive years of harvesting and the average values for each year. a, b, c, d, e, f denote homogeneous groups for the species presented separately for each characteristic; A, B, C denote homogeneous groups for the year of harvesting presented separately for each characteristic; error bars denote standard deviations.

Figure 4.
The average nitrogen (a), sulfur (b) and chlorine (c) contents for the branches of the tree species under study from the three consecutive years of harvesting, and the average values for each year. a, b, c, d, e, f denote homogeneous groups for the species presented separately for each characteristic; A, B, C denote homogeneous groups for the year of harvesting presented separately for each characteristic; no letters denote no significant differences; error bars denote standard deviations.

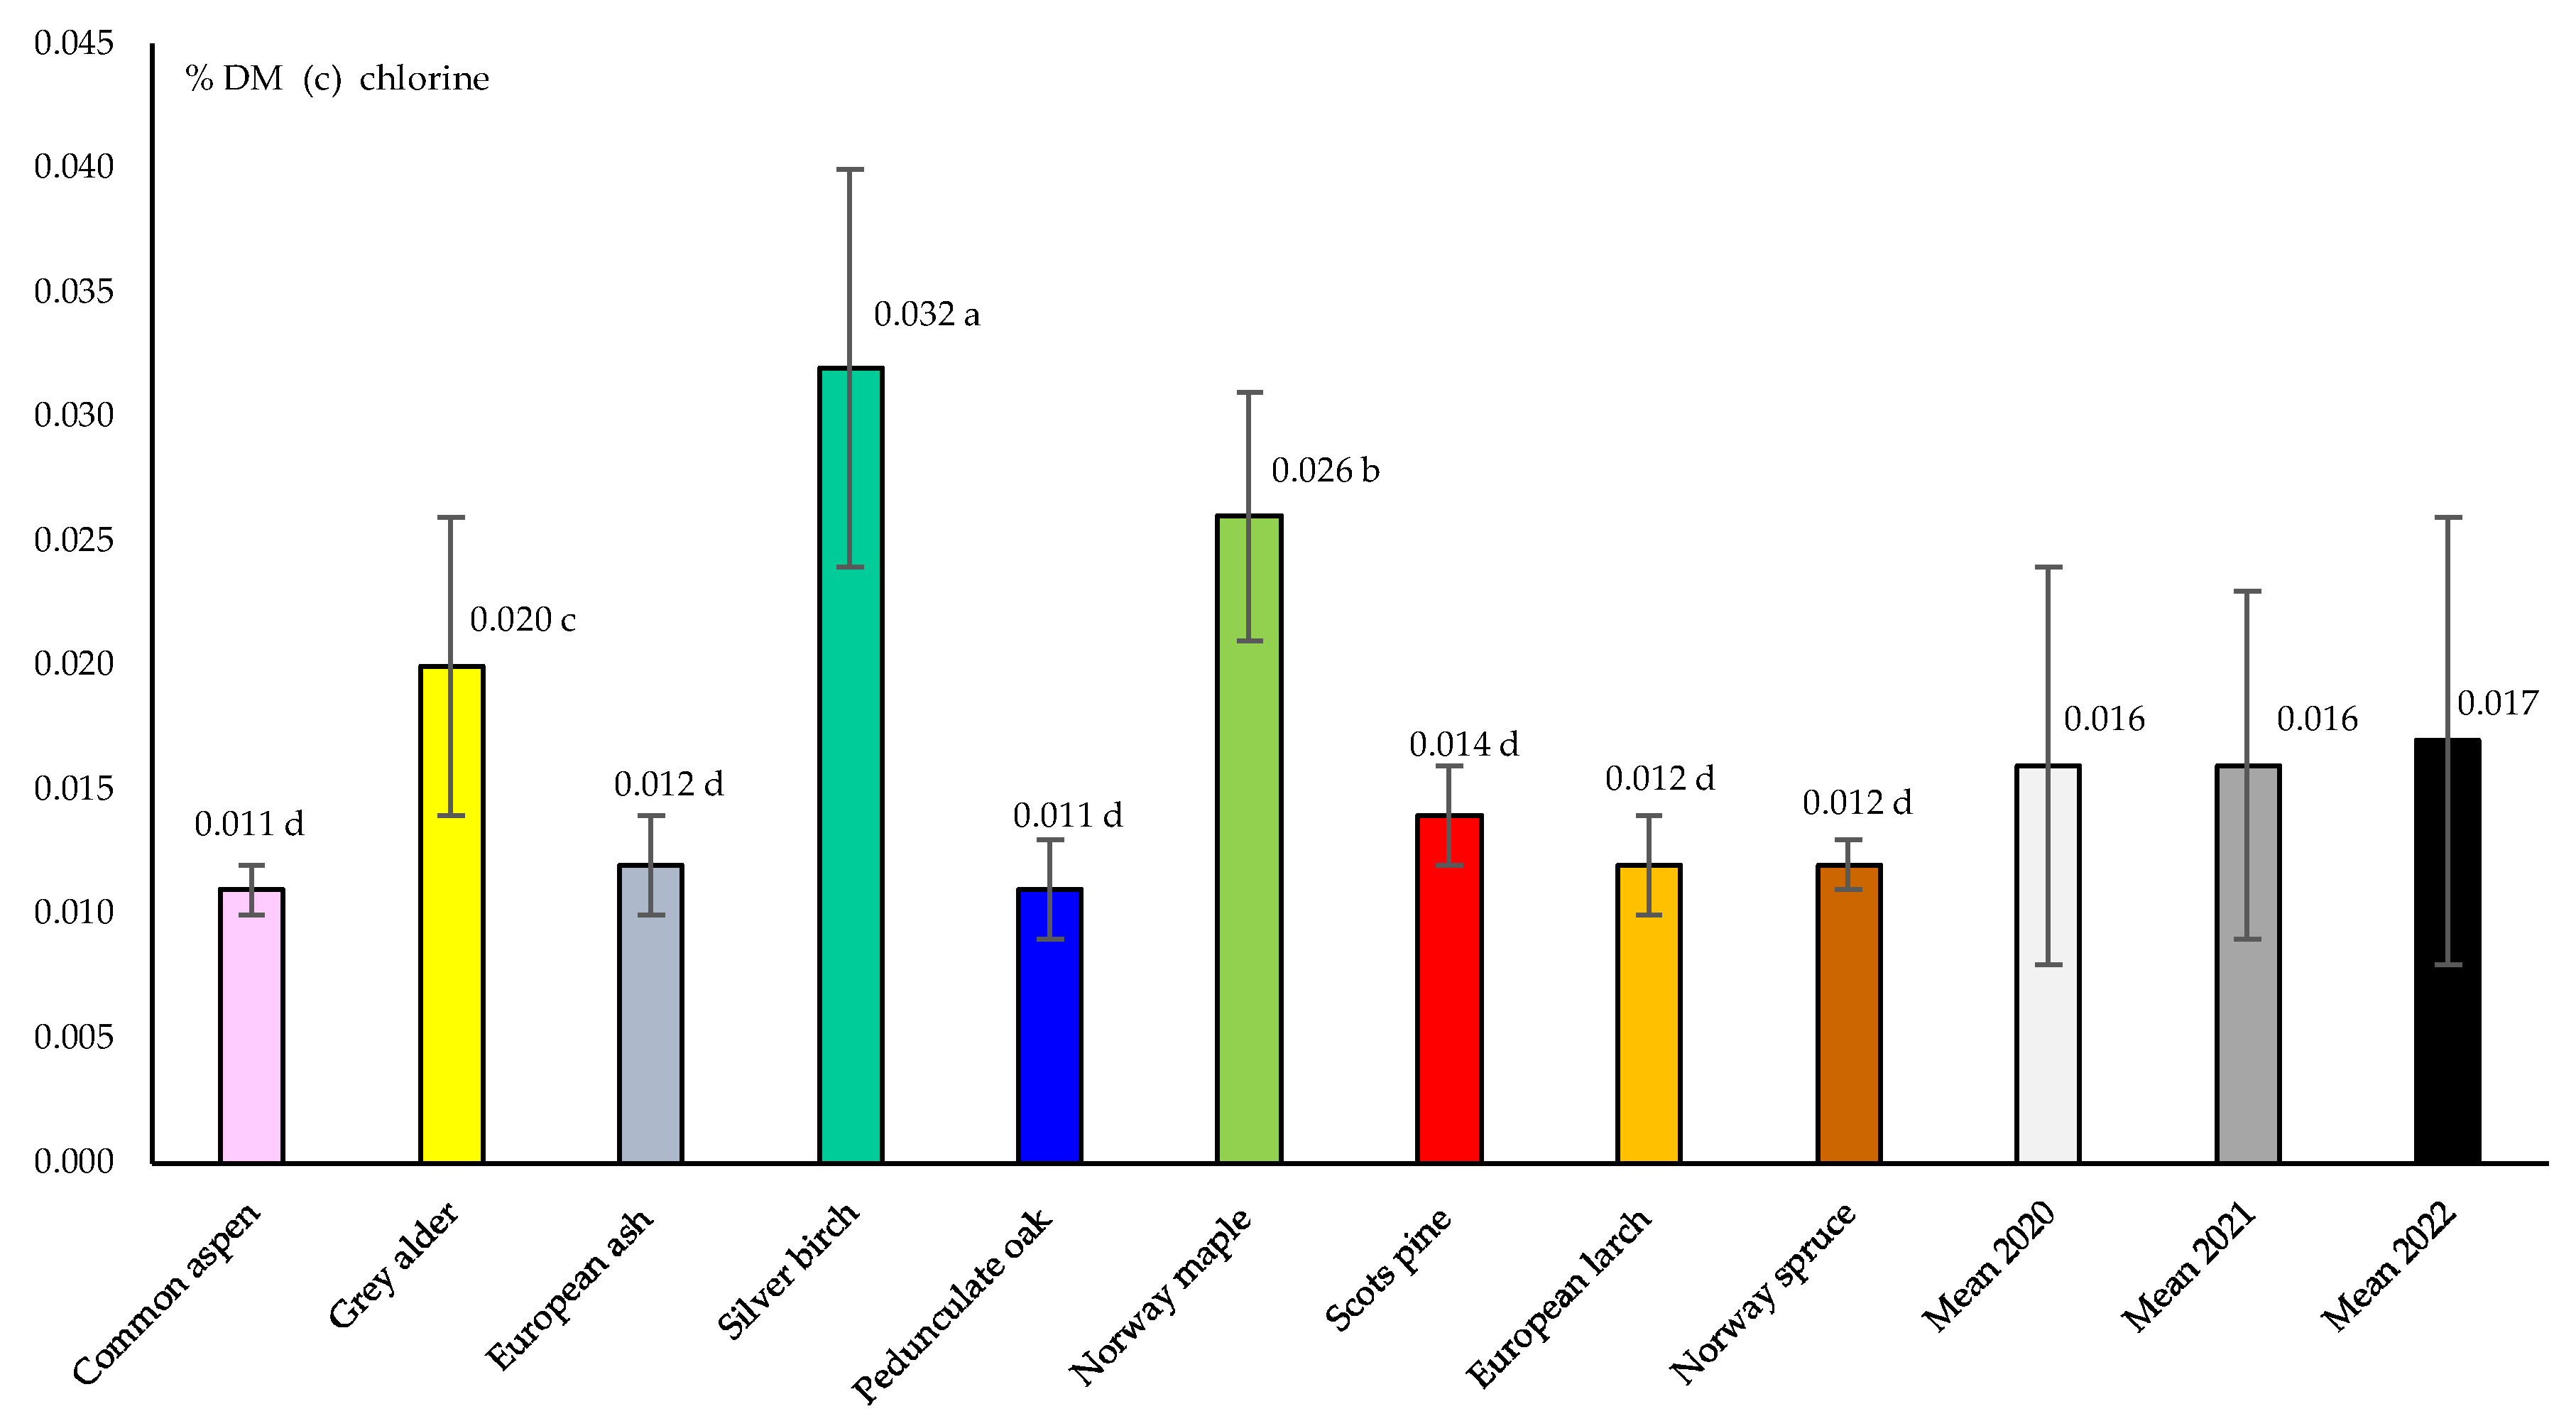
Figure 5.
A dendrogram of a hierarchical cluster analysis showing the similarities between the branches of tree species under study (a) and their thermophysical properties and elemental composition (b). The red vertical line marks the Sneath criterion (2/3 Dmax) and (1/3 Dmax). D—linkage distance; Dmax—maximum linkage distance.


Table 1.
Analysis of variance (ANOVA) p values for the studied characteristics.
| Source of Variation | MC | Ash | HHV | LHV | Cl | For the Other Characteristics 1 |
|---|---|---|---|---|---|---|
| Species (A) | <0.001 * | <0.001 * | <0.001 * | <0.001 * | <0.001 * | <0.001 * |
| Year of harvesting (B) | <0.001 * | 0.001 * | <0.001 * | <0.001 * | 0.137 | <0.001 * |
| A × B | <0.001 * | <0.001 * | <0.001 * | <0.001 * | <0.001 * | <0.001 * |
* Significant values (p < 0.05). 1 FC, VM, C, H, N and S contents.
Table 2.
Thermophysical properties of the branches of the tree species under study in the three consecutive years of harvesting.
Table 2.
Thermophysical properties of the branches of the tree species under study in the three consecutive years of harvesting.
| Species and the Year of Harvesting | MC (%) | Ash (% DM) | FC (% DM) | VM (% DM) | HHV (GJ Mg−1 DM) | LHV (GJ Mg−1) |
|---|---|---|---|---|---|---|
| Common aspen, 2020 | 52.54 ± 0.72 a | 2.63 ± 0.01 a | 18.17 ± 0.05 i | 79.19 ± 0.04 b | 19.30 ± 0.01 e | 7.36 ± 0.14 f |
| Common aspen, 2021 | 51.63 ± 0.14 a | 2.48 ± 0.47 a | 18.35 ± 0.47 i | 79.18 ± 0.02 b | 19.30 ± 0.02 e | 7.53 ± 0.02 f |
| Common aspen, 2022 | 49.77 ± 0.19 b | 2.12 ± 0.17 a | 19.02 ± 0.30 h | 78.87 ± 0.13 c | 19.23 ± 0.01 f | 7.89 ± 0.05 e |
| Grey alder, 2020 | 49.63 ± 0.31 b | 1.39 ± 0.03 c | 21.22 ± 0.20 d | 77.39 ± 0.23 e | 20.05 ± 0.03 c | 8.34 ± 0.06 d |
| Grey alder, 2021 | 45.59 ± 0.12 c | 1.62 ± 0.01 b | 19.89 ± 0.09 e | 78.50 ± 0.09 d | 19.94 ± 0.01 c | 9.10 ± 0.04 c |
| Grey alder, 2022 | 45.52 ± 0.41 c | 1.34 ± 0.08 c | 20.67 ± 0.68 e | 77.99 ± 0.63 d | 19.83 ± 0.02 d | 9.07 ± 0.08 c |
| European ash, 2020 | 39.05 ± 2.71 e | 1.86 ± 0.06 b | 20.28 ± 0.02 e | 77.86 ± 0.04 d | 19.40 ± 0.03 e | 10.15 ± 0.55 ab |
| European ash, 2021 | 35.38 ± 0.41 f | 1.57 ± 0.03 b | 19.67 ± 0.05 f | 78.77 ± 0.05 c | 19.46 ± 0.11 e | 10.90 ± 0.13 a |
| European ash, 2022 | 37.13 ± 0.45 e | 2.32 ± 0.09 a | 20.71 ± 0.15 e | 76.98 ± 0.23 e | 19.23 ± 0.05 f | 10.45 ± 0.12 a |
| Silver birch, 2020 | 46.26 ± 1.03 c | 0.78 ± 0.01 e | 19.09 ± 0.14 g | 80.12 ± 0.15 a | 19.84 ± 0.06 d | 8.91 ± 0.25 |
| Silver birch, 2021 | 40.11 ± 0.14 d | 0.83 ± 00.2 e | 19.44 ± 0.01 f | 79.73 ± 0.01 a | 19.89 ± 0.27 d | 10.23 ± 0.16 ab |
| Silver birch, 2022 | 44.27 ± 0.43 c | 0.72 ± 0.10 e | 19.04 ± 0.06 g | 80.24 ± 0.13 a | 19.75 ± 0.02 d | 9.25 ± 0.10 c |
| Pedunculate oak, 2020 | 43.34 ± 0.28 d | 1.37 ± 0.02 c | 19.84 ± 0.19 f | 78.79 ± 0.18 c | 19.22 ± 0.02 f | 9.19 ± 0.06 c |
| Pedunculate oak, 2021 | 42.06 ± 0.56 d | 1.70 ± 0.03 b | 19.65 ± 0.06 f | 78.66 ± 0.09 c | 19.07 ± 0.06 f | 9.34 ± 0.08 c |
| Pedunculate oak, 2022 | 41.10 ± 0.32 d | 1.47 ± 0.06 c | 20.00 ± 0.17 e | 78.54 ± 0.23 c | 19.05 ± 0.05 f | 9.54 ± 0.06 c |
| Norway maple, 2020 | 39.89 ± 0.15 e | 2.13 ± 0.02 a | 19.26 ± 0.25 g | 78.61 ± 0.23 c | 18.99 ± 0.04 g | 9.77 ± 0.02 b |
| Norway maple, 2021 | 39.71 ± 1.00 e | 2.92 ± 0.09 a | 19.29 ± 0.17 g | 77.80 ± 0.26 d | 18.81 ± 0.06 g | 9.65 ± 0.17 b |
| Norway maple, 2022 | 38.39 ± 0.39 e | 2.27 ± 0.04 a | 19.72 ± 0.03 f | 78.02 ± 0.02 d | 18.55 ± 0.01 h | 9.78 ± 0.07 b |
| Scots pine, 2020 | 48.63 ± 0.55 b | 0.55 ± 0.01 f | 22.36 ± 0.16 d | 77.09 ± 0.17 e | 20.74 ± 0.03 a | 8.89 ± 0.13 d |
| Scots pine, 2021 | 48.12 ± 1.07 b | 0.65 ± 0.01 f | 21.88 ± 0.16 d | 77.48 ± 0.17 e | 20.95 ± 0.05 a | 9.10 ± 0.26 c |
| Scots pine, 2022 | 49.97 ± 0.51 b | 0.60 ± 0.01 f | 22.32 ± 0.20 d | 77.08 ± 0.21 e | 20.51 ± 0.07 b | 8.47 ± 0.08 d |
| European larch, 2020 | 52.67 ± 0.51 a | 1.03 ± 0.01 d | 23.65 ± 0.07 b | 75.32 ± 0.07 g | 20.36 ± 0.07 b | 7.87 ± 0.10 e |
| European larch, 2021 | 48.84 ± 0.56 b | 1.00 ± 0.01 d | 22.93 ± 0.22 b | 76.08 ± 0.23 f | 20.40 ± 0.06 b | 8.65 ± 0.10 d |
| European larch, 2022 | 49.16 ± 0.56 b | 0.92 ± 0.02 d | 24.62 ± 0.26 a | 74.47 ± 0.29 h | 20.13 ± 0.04 b | 8.47 ± 0.10 d |
| Norway spruce, 2020 | 47.09 ± 0.99 b | 1.07 ± 0.02 d | 22.43 ± 0.02 c | 76.51 ± 0.01 f | 20.43 ± 0.03 b | 9.07 ± 0.19 c |
| Norway spruce, 2021 | 44.78 ± 1.57 c | 0.84 ± 0001 e | 22.65 ± 0.17 c | 76.51 ± 0.17 f | 20.32 ± 0.02 b | 9.49 ± 0.32 c |
| Norway spruce, 2022 | 44.44 ± 0.78 c | 0.88 ± 0.03 e | 22.99 ± 0.16 b | 76.14 ± 0.19 f | 20.13 ± 0.06 b | 9.45 ± 0.18 c |
a,b,c,d,e,f,g,h,i Homogeneous groups for the species × year of harvesting interaction presented separately for each characteristic; ± standard deviations.
Table 3.
Pearson correlation coefficients for the studied characteristics.
| Characteristic | MC (%) | FC (% DM) | VM (% DM) | Ash (% DM) | HHV (GJ Mg−1 DM) | LHV (GJ Mg−1) | C (% DM) | H (% DM) | N (% DM) | S (% DM) | Cl (% DM) |
|---|---|---|---|---|---|---|---|---|---|---|---|
| MC (%) | 1.00 | ||||||||||
| FC (% DM) | 0.32 * | 1.00 | |||||||||
| VM (% DM) | −0.26 * | −0.93 * | 1.00 | ||||||||
| Ash (% DM) | −0.27 * | −0.62 * | 0.27 * | 1.00 | |||||||
| HHV (GJ Mg−1 DM) | 0.54 * | 0.71 * | −0.48 * | −0.81 * | 1.00 | ||||||
| LHV (GJ Mg−1) | −0.95 * | −0.10 | 0.12 | 0.00 | −0.24 * | 1.00 | |||||
| C (% DM) | 0.09 | 0.57 * | −0.31 * | −0.81 * | 0.68 * | 0.15 | 1.00 | ||||
| H (% DM) | −0.24 * | −0.25 * | 0.36 * | −0.12 | 0.04 | 0.28 * | 0.08 | 1.00 | |||
| N (% DM) | −0.42 * | −0.24 * | 0.13 | 0.33 * | −0.36 * | 0.35 * | −0.39 * | 0.02 | 1.00 | ||
| S (% DM) | −0.27 * | −0.13 | −0.07 | 0.48 * | −0.42 * | 0.15 | −0.54 * | −0.23 * | 0.70 * | 1.00 | |
| Cl (% DM) | −0.25 * | −0.33 * | 0.42 * | −0.04 | −0.19 | 0.22 | 0.12 | 0.17 | 0.26 * | −0.11 | 1.00 |
* Significant values (p < 0.05).
Table 4.
The elemental composition of the branches of the tree species under study in the three consecutive years of harvesting.
Table 4.
The elemental composition of the branches of the tree species under study in the three consecutive years of harvesting.
| Species and the Year of Harvesting | C (% DM) | H (% DM) | N (% DM) | S (% DM) | Cl (% DM) |
|---|---|---|---|---|---|
| Common aspen, 2020 | 50.50 ± 0.08 f | 6.07 ± 0.01 b | 0.35 ± 0.01 d | 0.021 ± 0.002 b | 0.011 ± 0.001 d |
| Common aspen, 2021 | 49.02 ± 0.26 g | 6.21 ± 0.10 a | 0.30 ± 0.01 f | 0.023 ± 0.002 b | 0.010 ± 0.001 d |
| Common aspen, 2022 | 50.45 ± 0.03 f | 6.03 ± 0.01 b | 0.38 ± 0.04 d | 0.028 ± 0.002 b | 0.011 ± 0.002 d |
| Grey alder, 2020 | 52.96 ± 0.35 c | 5.90 ± 0.09 b | 0.64 ± 0.02 a | 0.035 ± 0.001 a | 0.025 ± 0.001 b |
| Grey alder, 2021 | 50.13 ± 0.12 f | 6.24 ± 0.20 a | 0.72 ± 0.05 a | 0.029 ± 0.003 a | 0.022 ± 0.001 c |
| Grey alder, 2022 | 51.55 ± 0.23 e | 6.15 ± 0.01 b | 0.81 ± 0.03 a | 0.036 ± 0.001 a | 0.012 ± 0.002 d |
| European ash, 2020 | 53.33 ± 0.45 c | 6.17 ± 0.02 a | 0.58 ± 0.01 b | 0.032 ± 0.001 a | 0.011 ± 0.003 d |
| European ash, 2021 | 51.90 ± 0.11 d | 6.46 ± 0.22 a | 0.47 ± 0.01 b | 0.030 ± 0.003 a | 0.010 ± 0.001 d |
| European ash, 2022 | 51.58 ± 0.24 e | 6.07 ± 0.04 b | 0.56 ± 0.06 b | 0.039 ± 0.001 a | 0.014 ± 0.002 d |
| Silver birch, 2020 | 54.46 ± 0.43 b | 6.27 ± 0.03 a | 0.41 ± 0.01 c | 0.017 ± 0.001 c | 0.030 ± 0.013 a |
| Silver birch, 2021 | 55.04 ± 0.20 a | 6.19 ± 0.06 a | 0.46 ± 0.01 c | 0.015 ± 0.004 c | 0.030 ± 0.005 a |
| Silver birch, 2022 | 54.62 ± 0.14 a | 6.47 ± 0.01 a | 0.41 ± 0.01 c | 0.017 ± 0.001 c | 0.035 ± 0.002 a |
| Pedunculate oak, 2020 | 52.50 ± 0.12 c | 6.02 ± 0.04 b | 0.41 ± 0.01 c | 0.024 ± 0.001 b | 0.011 ± 0.002 d |
| Pedunculate oak, 2021 | 52.51 ± 0.34 c | 6.19 ± 0.05 a | 0.46 ± 0.03 c | 0.023 ± 0.003 b | 0.011 ± 0.002 d |
| Pedunculate oak, 2022 | 51.46 ± 0.30 e | 6.05 ± 0.10 b | 0.49 ± 0.03 b | 0.027 ± 0.002 b | 0.011 ± 0.003 d |
| Norway maple, 2020 | 51.44 ± 0.11 e | 5.90 ± 0.06 b | 0.50 ± 0.02 b | 0.022 ± 0.002 b | 0.024 ± 0.003 b |
| Norway maple, 2021 | 52.05 ± 0.22 d | 6.26 ± 0.16 a | 0.61 ± 0.04 b | 0.023 ± 0.003 b | 0.022 ± 0.002 b |
| Norway maple, 2022 | 51.35 ± 0.23 e | 6.02 ± 0.08 b | 0.52 ± 0.02 b | 0.028 ± 0.001 b | 0.033 ± 0.003 a |
| Scots pine, 2020 | 55.20 ± 0.04 a | 6.09 ± 0.08 b | 0.26 ± 0.01 g | 0.017 ± 0.001 c | 0.013 ± 0.001 d |
| Scots pine, 2021 | 54.67 ± 0.23 a | 6.19 ± 0.02 a | 0.34 ± 0.01 e | 0.015 ± 0.002 c | 0.012 ± 0.001 d |
| Scots pine, 2022 | 55.22 ± 0.25 a | 6.27 ± 0.02 a | 0.35 ± 0.01 d | 0.019 ± 0.001 c | 0.016 ± 0.002 d |
| European larch, 2020 | 54.50 ± 0.40 b | 5.70 ± 0.04 c | 0.35 ± 0.02 d | 0.026 ± 0.001 b | 0.010 ± 0.001 d |
| European larch, 2021 | 53.54 ± 0.06 b | 6.32 ± 0.16 a | 0.35 ± 0.01 d | 0.020 ± 0.003 b | 0.014 ± 0.001 d |
| European larch, 2022 | 53.16 ± 0.65 c | 6.04 ± 0.04 b | 0.45 ± 0.01 c | 0.025 ± 0.001 b | 0.013 ± 0.001 d |
| Norway spruce, 2020 | 54.00 ± 0.37 b | 5.96 ± 0.05 b | 0.36 ± 0.01 d | 0.018 ± 0.001 c | 0.011 ± 0.001 d |
| Norway spruce, 2021 | 55.47 ± 0.19 a | 6.16 ± 0.20 b | 0.31 ± 0.01 e | 0.017 ± 0.002 c | 0.011 ± 0.001 d |
| Norway spruce, 2022 | 53.85 ± 0.09 b | 6.19 ± 0.01 a | 0.40 ± 0.01 c | 0.016 ± 0.001 c | 0.013 ± 0.001 d |
a,b,c,d,e,f,g Homogeneous groups for the species × year of harvesting interaction presented separately for each characteristic; ± standard deviations.
Table 5.
Statistical analysis indicators for the characteristics under study (N Valid = 81).
| Characteristic | Mean | Median | Minimum Value | Maximum Value | Lower Quartile | Upper Quartile | Standard Deviation | Coefficient of variation (%) |
|---|---|---|---|---|---|---|---|---|
| MC (%) | 45.00 | 45.59 | 34.96 | 53.37 | 40.81 | 49.29 | 4.90 | 10.90 |
| FC (% DM) | 20.71 | 20.00 | 17.88 | 24.88 | 19.44 | 22.36 | 1.73 | 8.36 |
| VM (% DM) | 77.85 | 78.00 | 74.18 | 80.34 | 76.92 | 78.79 | 1.42 | 1.82 |
| Ash (% DM) | 1.44 | 1.37 | 0.54 | 3.00 | 0.84 | 1.93 | 0.68 | 47.30 |
| HHV (GJ Mg−1 DM) | 19.74 | 19.78 | 18.54 | 21.01 | 19.22 | 20.28 | 0.62 | 3.17 |
| LHV (GJ Mg−1) | 9.11 | 9.14 | 7.19 | 11.03 | 8.54 | 9.61 | 0.86 | 9.48 |
| C (% DM) | 52.83 | 52.85 | 48.76 | 55.66 | 51.55 | 54.46 | 1.77 | 3.35 |
| H (% DM) | 6.13 | 6.13 | 5.65 | 6.68 | 6.02 | 6.24 | 0.18 | 2.98 |
| N (% DM) | 0.45 | 0.42 | 0.25 | 0.85 | 0.35 | 0.52 | 0.13 | 29.07 |
| S (% DM) | 0.024 | 0.023 | 0.012 | 0.040 | 0.018 | 0.028 | 0.007 | 28.47 |
| Cl (% DM) | 0.017 | 0.013 | 0.008 | 0.043 | 0.011 | 0.022 | 0.008 | 49.55 |
Disclaimer/Publisher’s Note: The statements, opinions and data contained in all publications are solely those of the individual author(s) and contributor(s) and not of MDPI and/or the editor(s). MDPI and/or the editor(s) disclaim responsibility for any injury to people or property resulting from any ideas, methods, instructions or products referred to in the content. |
© 2024 by the authors. Licensee MDPI, Basel, Switzerland. This article is an open access article distributed under the terms and conditions of the Creative Commons Attribution (CC BY) license (https://creativecommons.org/licenses/by/4.0/).
Share and Cite
MDPI and ACS Style
Stolarski, M.J.; Wojciechowska, N.; Seliwiak, M.; Dobrzański, T.K. Properties of Forest Tree Branches as an Energy Feedstock in North-Eastern Poland. Energies 2024, 17, 1975. https://doi.org/10.3390/en17081975
AMA Style
Stolarski MJ, Wojciechowska N, Seliwiak M, Dobrzański TK. Properties of Forest Tree Branches as an Energy Feedstock in North-Eastern Poland. Energies. 2024; 17(8):1975. https://doi.org/10.3390/en17081975
Chicago/Turabian StyleStolarski, Mariusz Jerzy, Natalia Wojciechowska, Mateusz Seliwiak, and Tomasz Krzysztof Dobrzański. 2024. "Properties of Forest Tree Branches as an Energy Feedstock in North-Eastern Poland" Energies 17, no. 8: 1975. https://doi.org/10.3390/en17081975
Note that from the first issue of 2016, this journal uses article numbers instead of page numbers. See further details here.