
Experimental Study of Direct Shear Properties of Anisotropic Reservoir Shale
by
 , , , ,
Bowen Zheng
1,2,3,*,
Shengwen Qi
1,2,3,*,
Songfeng Guo
1,2,3,
Ning Liang
1,2,3,
Guangming Luo
1,2,3,
Xiaohui Zhang
1,2,3,
Wei Lu
1,2,3,
Chao Jin
4,5,
Yongchao Li
1,2,3,
Xin Yu
1,2,3,
Zifang Zhu
1,2,3 and
Jianing Cong
1,2,3 1
Key Laboratory of Shale Gas and Geoengineering, Institute of Geology and Geophysics, Chinese Academy of Sciences, Beijing 100029, China
2
Innovation Academy for Earth Science, Chinese Academy of Sciences, Beijing 100029, China
3
College of Earth and Planetary Sciences, University of Chinese Academy of Sciences, Beijing 100049, China
4
School of Earth Science and Engineering, Hebei University of Engineering, Handan 056038, China
5
Collaborative Innovation Center of Resource Exploration and Exploitation, Hebei University of Engineering, Handan 056038, China
*
Authors to whom correspondence should be addressed.
Energies 2024, 17(8), 1977; https://doi.org/10.3390/en17081977
Submission received: 22 November 2023
/
Revised: 8 April 2024
/
Accepted: 11 April 2024
/
Published: 22 April 2024
(This article belongs to the Special Issue New Challenges in Unconventional Oil and Gas Reservoirs)
Abstract
:Understanding the shear mechanical properties of shale reservoirs is of great significance in the study of the formation stability around horizontal shale wells and the propagation and evolution of fractures for shale fracturing. However, the existing direct shear test results are limited due to small sample sizes and low shear rates. Based on previous experimental research results, the mechanical properties of anisotropic reservoir shale in direct shear tests with different experimental conditions were explored in this study. It was found that the shear mode, shear strain rate, and normal stress have a significant impact on the deformation and failure characteristics of shale. The peak shear displacement, peak shear strength, and shear stiffness of shale present an increasing trend of fluctuation, with an increase in the bedding angle. The peak shear strength of shale decreases with an increase in the shear strain rate, and this decrease trend descends with an increase in the shear strain rate. The shape of the shear fracture zone and the shear fracture mode of shale exhibit bedding effect characteristics. The fractal dimension of the shale shear fracture surface morphology shows a trend of fluctuation with the variation in the bedding angle. Further, the shear strain rate was found to play a dominant role in the fractal dimension of the shear fracture surface. The larger shear strain rate strengthens the bedding effect of the roughness for the shear fracture surface morphology. The results of this study provide a theoretical reference for determining the engineering geomechanics characteristics of shale reservoirs.
1. Introduction
Shale reservoirs are characterized by tight and low permeability, with a porosity of less than 10% and a permeability of 101~3 nD [1,2]. To achieve industrial development, it is necessary to drill and fracture shale reservoirs to form a fracture network. Therefore, horizontal well drilling and hydraulic fracturing technologies have become key technologies in shale gas development [3,4,5].
The deformation mechanism, failure mechanism, and mechanical properties of a rock mass are controlled by its structure, which is a main reason for the anisotropic characteristics of a rock mass [6,7,8,9,10,11,12,13,14]. The most common type of anisotropic rock mass is a transversely isotropic rock mass [15,16]. There are some theoretical studies on the mechanical properties of transversely isotropic rock masses in the recent literature. For instance, Zhao et al. [15] presented a double-yield-surface plasticity theory for transversely isotropic rock masses that differentiated between plastic deformation through solid matrixes and localized plasticity along weak bedding planes. On this basis, Zhao et al. [16] proposed a tensile failure criterion for transversely isotropic rock masses that distinguished tensile fracturing mechanisms as occurring either through anisotropic rock matrixes or along weak bedding planes. Shale is a typical transversely isotropic rock mass; its bedding structure is developed and its bedding strength is low [4,17,18,19]. On one hand, during horizontal well drilling, shale formations around shale horizontal wells are more likely to shear and slide along the bedding plane, resulting in a significant increase in the risk of collapse and instability of horizontal wells [20,21]. On the other hand, in the process of hydraulic fracturing, shale bedding and natural fractures are the key to the formation of complex network fractures [22]. The propagation of complex network fractures is often accompanied by complex mechanical properties, such as shear, slip, and dislocation, which play crucial roles in the formation of complex secondary fractures from hydraulic main fractures connecting bedding or natural fractures [23]. Previous studies have demonstrated that the fracturing of reservoir shale in the shear failure mode is very common during wellbore instability and hydraulic fracturing [21,22,23]. Therefore, studying the shear mechanical properties of reservoir shale with different bedding orientations is of great significance in accurately evaluating the formation stability around shale horizontal wells, as well as in understanding the propagation and evolution of shale fractures [24].
Both triaxial compression tests with different confining stresses and direct shear experiments with various normal stresses are usually adopted to explore the shear mechanical properties of reservoir shale [20]. Previous research shows that the triaxial compression test is difficult to use to analyze the propagation and evolution of a shear fracture in depth due to the uncertainty of the shear fracture plane and the randomness of the fracture initiation point. However, the direct shear experiment can overcome this weakness [24]. Moreover, the loading path can be precisely controlled and experimental parameters are easily obtained in the direct shear experiment [25,26,27,28,29,30,31]. Hence, the direct shear experiment has been viewed as the preferred experimental method to understand the shear properties of reservoir shale [20,21,22,24,32,33]. In order to theoretically study the effect of shear mechanical properties for shale on the stability control of horizontal well drilling and the optimal design of hydraulic fracturing in shale gas reservoirs, many scholars have conducted direct shear experiments to characterize the shear mechanical properties of reservoir shale with different bedding orientations [20,21,22,24,32,33]. For example, Ma and Chen [21] conducted direct shear tests on cubic shale samples with side lengths of 50 mm. It was found that when the shear directions were 0° and 90° with the shale bedding orientation, the cohesion of the latter was 2.1 times that of the former and the internal friction angle was 1.2 times that of the former. The peak shear strength of shale exhibited anisotropic characteristics. Yuan and Chen [32] performed direct shear tests on cylindrical shale samples with a diameter of 25 mm soaked in water- and oil-based drilling fluids and found that when the shear direction was 0° and 90° with respect to the shale bedding orientation, the internal friction angle and cohesion of the latter were higher than those of the former, the cohesion controlled the shale strength, and the internal friction angle controlled the range of shale failure along the bedding. Heng et al. [22] conducted a series of direct shear tests at the shear rate of 0.002 mm/s on cylindrical shale samples with a diameter of 50 mm. It indicated that for the shear direction at the increasing angles of 0°, 30°, 60°, and 90° with the shale bedding orientation (obtuse-angle shear mode, clockwise rotation along the shear direction to the bedding orientation with an obtuse angle, as shown in Figure 1a), the peak shear strength of shale increased first and then decreased. When the angle was 30°, it reached a maximum; the shear failure mechanism of shale included three modes: the shear failure of the shale rock mass, the tensile failure of the shale bedding, and the shear composite failure of the rock mass and shear slip along the shale bedding. The anisotropy of the peak shear strength of shale was controlled by the anisotropy of its shear failure mechanism. Lu et al. [20] conducted a group of direct shear tests at the shear rate of 0.0003 mm/s on cubic shale samples with a side length of 50 mm. It was found that for increasing the angle of the shear direction from 0° to 30°, 60°, and 90° with the shale bedding orientation (acute-angle shear mode, clockwise rotation along the shear direction to the bedding orientation with an acute angle, as shown in Figure 1b), the peak shear strength of shale increased first and then decreased. When the angle was 60°, it reached a maximum and a new anisotropic shear failure criterion was proposed. At the angle of 0°, the fractal dimension of the shale fracture surface was lower, and when the angle was 30°–90°, the fractal dimension of the shale fracture surface was larger. Li [33] performed direct shear tests at the shear rates of 0.002–0.003 mm/s on cylindrical shale samples with a diameter of 50 mm. The shear-stress–shear-displacement curve of shale clearly exhibited four characteristic stages, including a slow increase in shear stress, a rapid rise in shear stress, a rapid drop in shear stress, and a residual strength stage. Nevertheless, the sample size and the shear rate of existing direct shear tests are small and the relevant research conclusions are limited.
In this work, based on the experimental research results in the previous literature, comparative test studies of the direct shear properties for anisotropic reservoir shale were conducted for experimental conditions of a larger sample size (along the shear direction length of 100 mm) and a higher shear rate (0.01 mm/s), considering different bedding angles of shale (acute-angle shear mode, shear direction, and bedding orientation of 0°, 30°, 45°, 60°). This paper mainly includes five parts. The Section 1 summarizes the research status of the shale direct shear tests. The Section 2 introduces the shale direct shear test method. The Section 3 describes the experimental results and compares the research results with those of previous studies. The Section 4 and Section 5 provide the relevant discussion and conclusion, respectively.
2. Materials and Methods
2.1. Specimen Preparation
The shales in this study were all from the shale outcrop of the Longmaxi Formation in Shizhu County, Chongqing, China, which were very similar to the shales of Heng et al. [22], Lu et al. [20], and Li [33]. The shale was greyish-black with developed bedding. We transported large shale samples to the laboratory and used a rock sample cutter to process the shale into cuboid samples. To study the influence of the bedding angle on the shale shear properties, we cut the shale into samples with bedding angles of 0°, 30°, 45°, and 60° to the shear direction. The size of each sample was 100 mm × 60 mm × 100 mm (length × width × height), and the unevenness of each end face did not exceed 0.02 mm, as shown in Figure 2a,b (modified after [22]). In this study, the acute-angle shear loading mode was adopted in the direct shear test, as shown in Figure 2c.
The formula for calculating the normal and shear stresses of shale was given as
where σn is the normal stress, τ is the shear stress, N is the normal load, F is the shear load, and S is the nominal area of the sample in the shear direction.
σn = N/S, τ = F/S
2.2. Test Apparatus and Procedure
Direct shear tests on shale were carried out using the dynamic direct shear test apparatus (TFD-500/1000-JS), which was developed by the Key Laboratory of Shale Gas and Geoengineering, Institute of Geology and Geophysics, Chinese Academy of Sciences (Beijing, China), and can be utilized for different dynamic direct shear tests on rock masses [34]. The apparatus is presented in Figure 3. The sample was placed in the shear box before the experiment, and the stresses applied to samples with different bedding angles during the experiments are shown in Figure 4.
The loading conditions for shale samples with different bedding angles of 0°, 30°, 45°, and 60° used in the experiments are listed in Table 1. The normal loading condition and the shear loading condition represented constant normal load (CNL) and constant shear rate (CSR), respectively. The experimental processes were as follows: first, the normal load was applied in the load control mode at the loading rate of 50 N/s until the preset normal load of 6 kN, namely the normal stress of 1 MPa, was reached, after which it remained constant. Subsequently, the shear load was applied in the displacement control mode with the constant shear rate of 0.01 mm/s, namely, the shear strain rate of 0.0001/s, until the preset shear displacement was reached. During the experiments, the normal load and shear load were recorded in real time using a test apparatus with the system acquisition frequency of 100 Hz.
3. Results
3.1. Relationship between Shear Stress and Shear Displacement
The shear stress and shear displacement curves of shale samples with different bedding angles after the direct shear tests are displayed in Figure 5. It is apparent that the shear stress and shear displacement curves for different samples exhibited similar characteristics. In the early work of Martin and Chandler [35], the deformation and failure process of a rock mass can be divided into five stages: the crack closure stage, elastic deformation stage, stable fracture stage, unstable fracture stage, and post-peak stage. On this basis, Heng et al. [24], Lu et al. [20], and Li [33] divided the shear stress and shear displacement curve of shale into four stages during their direct shear tests, respectively. By referring to previous conclusions [20,24,33,35] according to the relation of the shear stress and shear displacement in this study, we divided the shear stress and shear displacement curve into three stages (Stage OA, Stage AB, and Stage BC), as shown in Figure 6.
Stage OA: the shear stress increased with an increase in shear displacement. At this stage, the slope of the curve was relatively small; similar shear stress and shear displacement characteristics were observed by Heng et al. [24], Lu et al. [20], and Li [33]. Previous studies [20,24,33] revealed that under the action of the normal load and the shear load during this stage, the very small gap between the sample and the shear box was closed, and the microcracks and voids inside the sample were closed.
Stage AB: the shear stress increased with an increase in shear displacement, and the slope of the curve was larger than that in Stage OA. At this stage, the sample underwent approximately linear elastic deformation; when the strength was close to the peak value, the slope of the curve decreased slightly. At this stage, the sample underwent internal microcrack initiation, propagation, and gradual penetration.
Stage BC: after the shear stress reached the peak strength, there was an obvious inflection point. The shear stress decreased sharply with an increase in shear displacement and then entered the residual strength stage. At this stage, the sample underwent the process of shear fracture plane penetration and crack plane shear slip.
3.2. Shear Failure Pattern
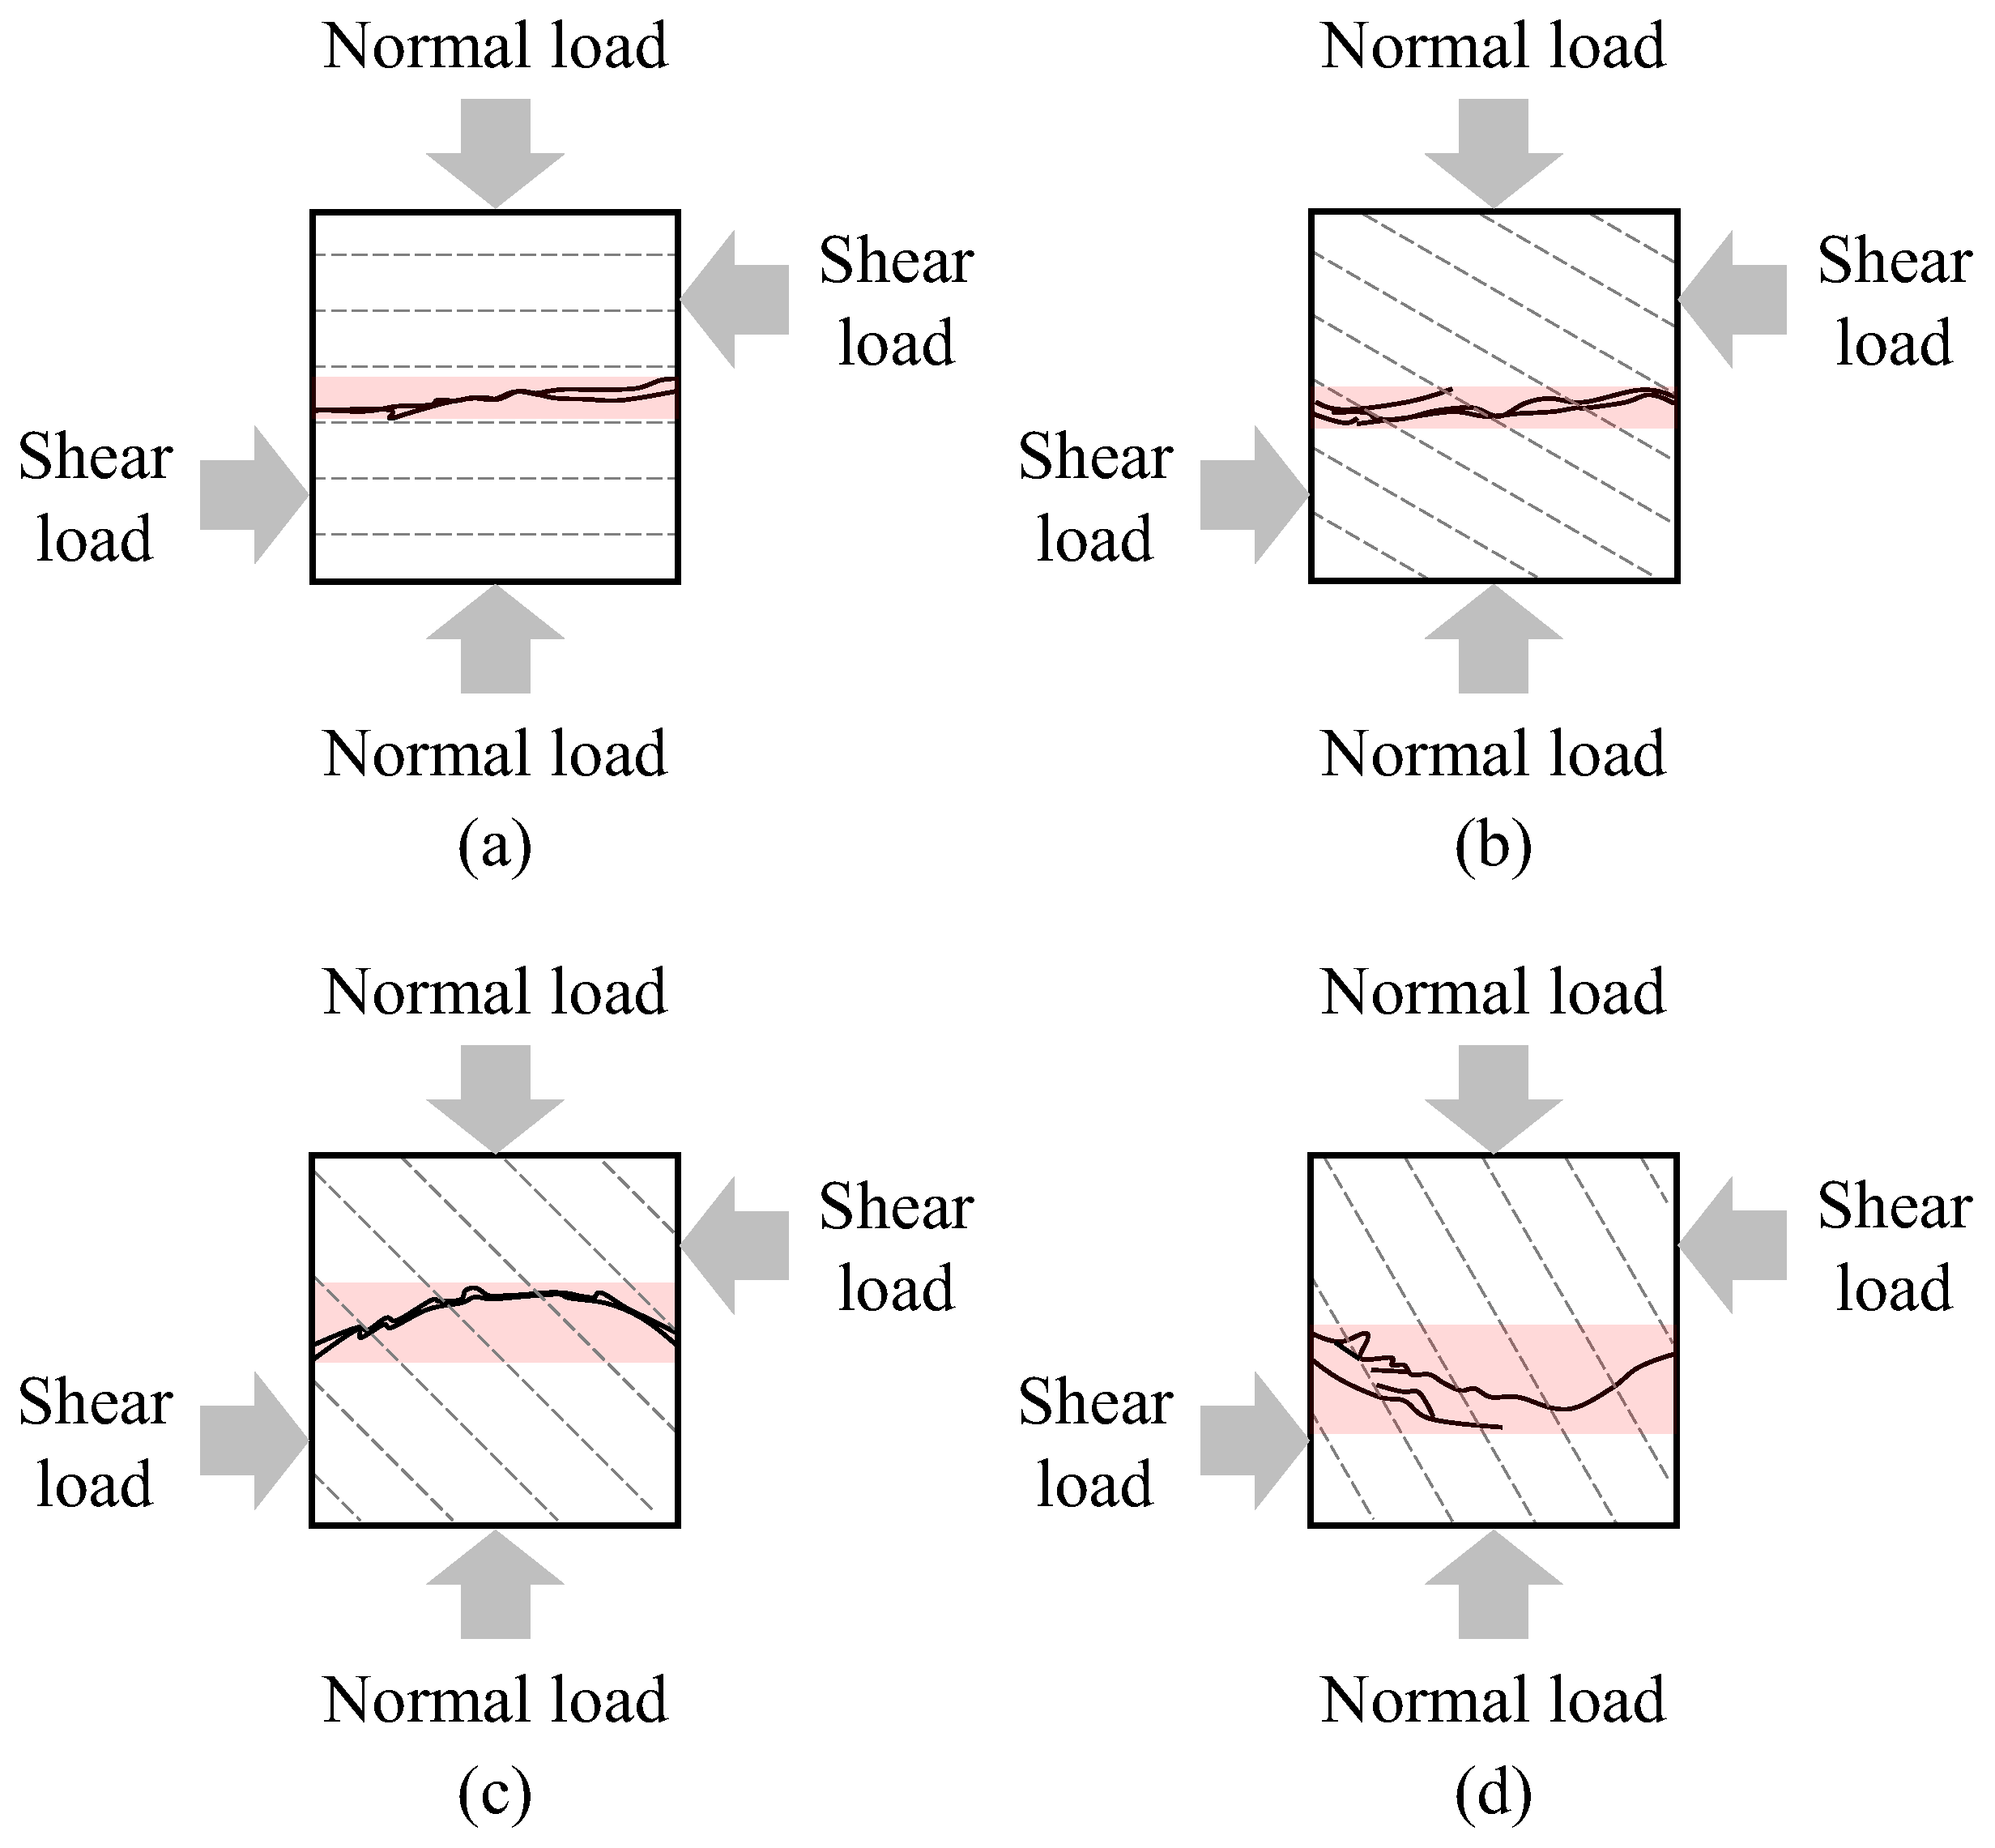
The failure pattern of shale samples after the direct shear tests is depicted in Figure 7. According to Figure 7, the trace of the shale shear fracture zone and its range of influence are shown in Figure 8. As can be seen in Figure 7 and Figure 8, when the bedding angles were 0° and 30°, the shear fracture zone of the sample was straight and rough. When the bedding angles were 45° and 60°, the shear fracture zone of the sample was curved and rough, and the influence range of the shear fracture zone expanded; thus, the shear fracture zone shape of shale clearly exhibited bedding effect characteristics.
In the previous literature on direct shear tests for rock masses, the conclusions showed that tensile-induced fractures were prone to be curved and shear-induced fractures were comparatively straight [36,37,38,39]. Hence, on the basis of the above findings, the shale shear fracture planes were carefully observed according to Figure 7 and Figure 8. Then we preliminarily performed the qualitative analysis of the genetic mechanism for shale shear fracture zone cracks (Figure 9). It was found that the shear fracture mode of shale showed an obvious bedding effect, as follows.
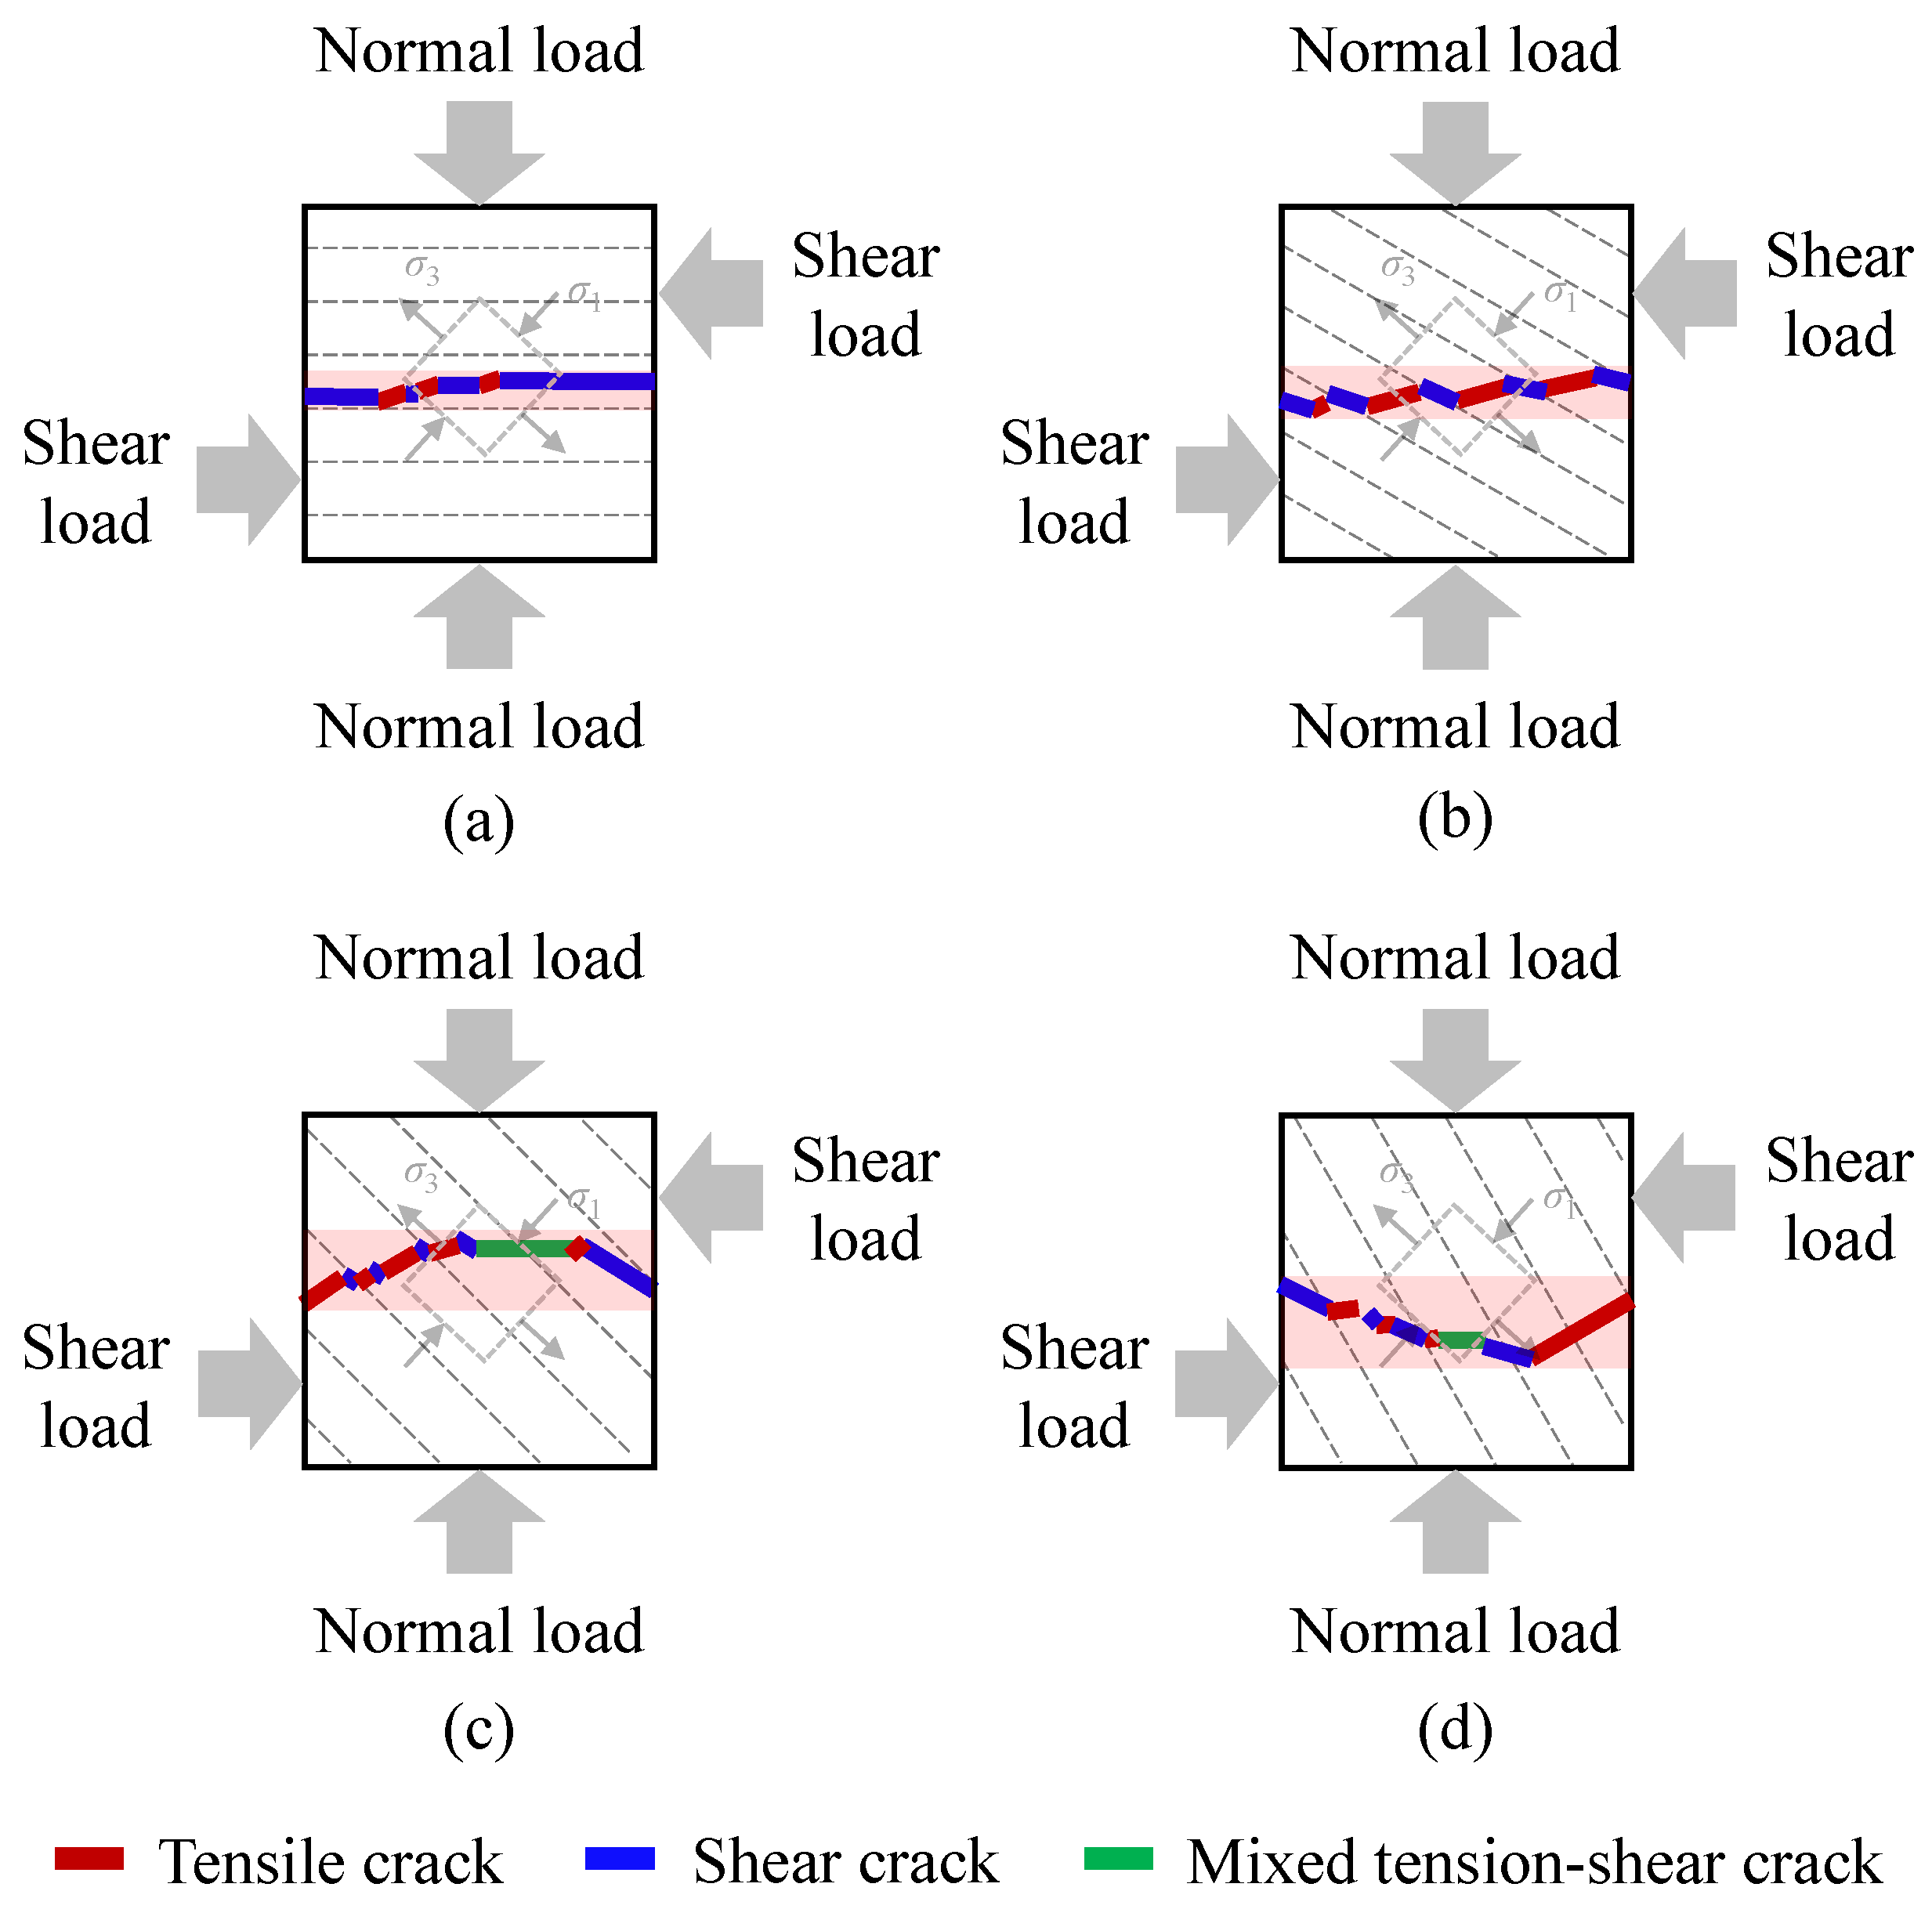
When the bedding angle was 0°, the sample produced shear cracks along the shear direction, the shear load induced the formation of echelon tension cracks near the shear plane, and the shear cracks and tension cracks connected to form a shear fracture zone.
As the bedding angle reached 30°, the sample produced echelon shear cracks along the bedding orientation. The shear load induced echelon tension cracks in the shale matrix near the shear plane, and the shear cracks and tension cracks connected to form a shear fracture zone.
When the bedding angle was 45°, one end of the sample traced the bedding orientation and generated shear cracks. Simultaneously, the other end of the shale produced echelon tension cracks that crossed the bedding orientation and echelon shear cracks along the bedding orientation. In addition, mixed tension–shear cracks were produced in the middle of the shale along the shear direction; shear cracks, tension cracks, and mixed tension–shear cracks connected to form shear fracture zones.
As the bedding angle reached 60°, one end of the sample traced the bedding orientation to produce shear cracks and induce the generation of echelon tension cracks. Simultaneously, the other end of the shale produced tension cracks oblique to the bedding orientation. In addition, mixed tension–shear cracks were generated in the middle of the shale along the shear direction. Shear cracks, tension cracks, and mixed tension–shear cracks connected to form shear fracture zones.
3.3. Shear Fracture Surface Morphology
Rock mass fracture surface morphology is critically affected by the rock mass’s failure pattern. A quantitative description of the shear fracture surface morphology of shale is of great importance in analyzing the local rupture mechanism [20]. Fractal theory can quantitatively describe the roughness and complexity of a fractured surface [14]. The fractal dimension calculation method recommended by Zheng et al. [14] was employed in this work. First, we used a 3D laser scanner (Creaform Handyscan 3D VIUscan, Quebec City, Quebec, Canada) at the Key Laboratory of Shale Gas and Geoengineering, Institute of Geology and Geophysics, Chinese Academy of Sciences to scan the shear fracture surface morphology of the shale (Figure 10a), and then we utilized the related software (VXelements, Version 5.0) to calculate the fractal dimension of the shear fracture surface morphology. The projection size of the calculated area on each shear fracture surface was 80 mm × 48 mm (Figure 10b), yielding 400 × 240 measured points per surface.
The fractal dimension calculation results for the shale shear fracture surface morphology are provided in Figure 11. It is apparent from Figure 11 that the fractal dimension of the shear fracture surface morphology for shale samples varied with the change in the bedding angle. When the bedding angle was 45°, the roughness of the shear fracture surface morphology was the highest. When the bedding angle was greater than 45°, the upper shear fracture surface was rougher than the lower shear fracture surface. It can be seen in Figure 11 that the shaded zone covers the distribution range for the fractal dimension of the shear fracture surface morphology for shale samples with different bedding angles. When the bedding angle increases, the shaded zone area is enlarged, revealing that the difference in the morphology between the upper and lower shear fracture surfaces increased with an increase in the bedding angle, thus indicating that the bedding effect of the difference in the degree of the local fracture, as well as the complexity of the morphology between the upper and lower shear fracture planes in shale, was enhanced.
3.4. Shear Strength and Shear Stiffness
According to Figure 5, the peak shear displacement, peak shear strength, and shear stiffness (peak load/peak displacement, MN/m) of the shale direct shear tests were obtained, as shown in Figure 12. It can be seen from Figure 12 that the peak shear displacement, peak shear strength, and shear stiffness of shale samples with different bedding angles exhibited similar trends; they all fluctuated and increased with increasing bedding angles. When the bedding angle was 0°, the peak shear displacement, peak shear strength, and shear stiffness were all minimum; when the bedding angle was 60°, the peak shear displacement, peak shear strength, and shear stiffness were maximized.
Based on the peak shear strength formula for shale proposed by Lu et al. [20] and Li [33], the peak shear strength was calculated for the normal stress of 1 MPa, as shown in Table 2 and Table 3.
From Table 2 and Table 3, the peak shear strength of shale samples with different bedding angles under different shear strain rates and the normal stress of 1 MPa is shown in Figure 13. It can be seen from Figure 13 that the peak shear strength of shale decreased with an increase in the shear strain rate. The shaded zone covers the distribution range for the peak shear strength of shale samples with different bedding angles under different shear strain rates. It can be seen that the slope (absolute value) of the upper or lower envelope line for the shaded zone decreased with an increase in the shear strain rate range, which revealed that the variation amplitude of the peak shear strength from the shear strain rate scope of 4 × 10⁻⁵/s to 1 × 10⁻⁴/s was smaller than that from 6 × 10⁻⁶/s to 4 × 10⁻⁵/s, no matter the bedding angle, thus indicating that the decrease tendency of the peak shear strength descended with an increase in the shear strain rate (Figure 13). From the shaded zone, we can see that when the shear strain rate was 6 × 10⁻⁶/s, the distribution range of the peak shear strength with different bedding angles was larger than those at the shear strain rates of 4 × 10⁻⁵/s and 1 × 10⁻⁴/s, which shows that the bedding effect on the peak shear strength at 6 × 10⁻⁶/s was stronger than those at 4 × 10⁻⁵/s and 1 × 10⁻⁴/s, thus indicating that when the shear strain rate was the lowest (6 × 10⁻⁶/s), the bedding effect on the peak shear strength was the strongest (Figure 13). However, it is noteworthy that there were differences in the sample shape (Table 3).
4. Discussion
4.1. Shear Deformation and Failure Characteristics
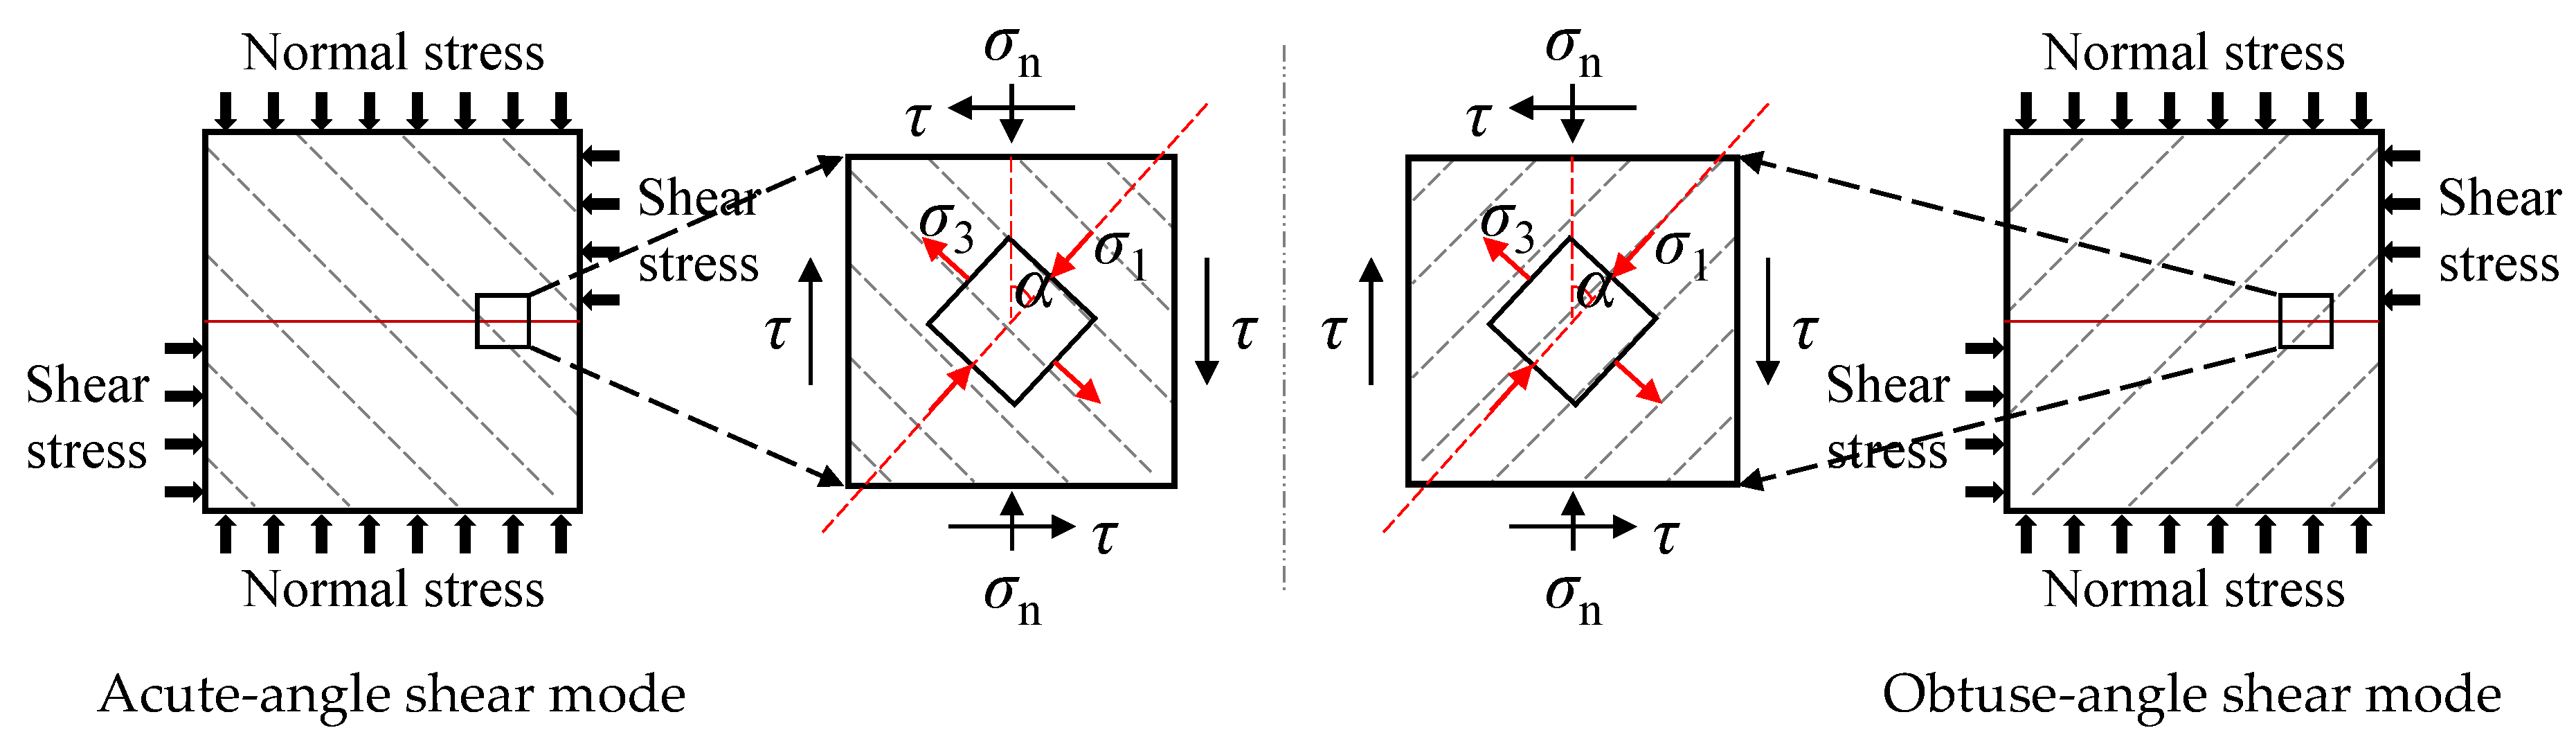
The deformation and failure characteristics of shale are controlled via the shear mode and the loading conditions. Both this study and Lu et al. [20] adopted the acute-angle shear mode, whereas Heng et al. [22] utilized the obtuse-angle shear mode. Differently from the literature of Lu et al. [20], in this paper, the sample size and the shear rate were twice and 30 times those used by Lu et al. [20], respectively (Table 3). Nevertheless, the normal stress in this work (1 MPa) was much lower than that (20–60 MPa) in the work by Lu et al. [20]. In the case of the same shear mode, for the shear stress and shear displacement curves (Figure 6), when the shear strain rate was lower and the normal stress was higher, the periodic change in the slope of the pre-peak curve observed by Lu et al. [20] was more obvious. In addition, as mentioned above, the shear strain rate in Lu et al. [20] was much lower than that in this study (Table 3). Therefore, the smaller shear strain rate and higher normal stress caused more significant phase change characteristics in pre-peak deformation for the shear stress and displacement curve concluded by Lu et al. [20]. In the case with different shear modes, when the angle between the shear direction and the bedding orientation was the same, the shale showed stronger brittle failure characteristics in the acute-angle shear test than those in the obtuse-angle shear test performed by Heng et al. [22]. It was found that the deformation and failure characteristics of shale were sensitive to the shear mode (acute angle or obtuse angle) and loading conditions such as the shear strain rate and normal stress.
4.2. Shear Fracture Mode
The shear fracture mode of shale is affected by the shear mode. In Heng et al. [22], for the obtuse-angle shear mode, the shale sample produced tensile cracks along the orientation of the bedding plane under the action of shear load. In this work, under the acute-angle shear mode and the action of the shear load, the tension cracks were generated oblique to the bedding orientation, and the angle between the tension crack and the shear direction was less than 45° (Figure 9). It should be noted that different types of cracks for shear fracture zones in Figure 9 were mainly qualitatively speculated from the morphology of tensile cracks and shear cracks. In terms of mixed tension–shear cracks, these were mainly qualitatively inferred from the development location as well as the direction of tension–shear cracks and their relationships with tension cracks and shear cracks, as well as the surface roughness and shear slip marks of tension–shear cracks [11,36,37,38,39]. For different types of cracks, the shear fracture mode was controlled by both the bedding plane and the matrix, corresponding to the stress state of the micro-element near the shear plane.
As investigated by Ikari et al. [40] and discussed by Heng et al. [24], for the acute-angle shear mode, when the normal stress was small, the shear load induced compressive stress (maximum principal stress) and tensile stress (minimum principal stress) near the shear plane. The stress state of the micro-element near the shear plane is depicted in Figure 14, modified from Heng et al. [24] and Lu et al. [20]. The maximum principal stress (compressive stress) was perpendicular to the bedding plane, or its normal angle was small. There was a tendency to compact the bedding plane and strengthen the shear slip along the bedding plane. As a result, echelon shear cracks were generated along the bedding plane or at a smaller angle, as shown in Figure 15. Conversely, the minimum principal stress (tensile stress) was generated approximately along the bedding plane or at a smaller angle. Although it inhibited the echelon tension cracks along the bedding plane, it produced the echelon tension cracks connected with the echelon shear cracks. The echelon tension cracks were generated in the direction of the maximum principal stress and intersected with the direction of the minimum principal stress at a larger angle in the shale matrix (Figure 15). In the work by Zhao et al. [16], the authors elaborated how the overall behaviors of a transversely isotropic rock mass were determined via two competing failure modes either through matrixes or along bedding planes based on the theoretical analysis and the experimental verification. They found that the tensile strength of matrixes exhibited anisotropic characteristics and varied with the bedding orientation, which provided a good explanation of why the direction of tensile cracks through shale matrixes changed with the bedding orientation for shale samples with different bedding angles in this study. For a position far from the shear plane, the direction of the stress field for the micro-element may be deflected, and the stress state may be more complex, causing the distribution of the current tension cracks and shear cracks.
4.3. Influence of the Bedding Angle
The effect of the bedding angle on the shape of the shale shear fracture zone was different. For the same shear mode, the shear fracture zone in the work by Lu et al. [20] was flat and straight, and its shape did not obviously change with the bedding angle. Conversely, the shape of the shear fracture zone in this study was greatly affected by the bedding angle, as shown in Figure 8. As previously mentioned in Table 3 and Section 4.1, in terms of the different loading conditions for this work and Lu et al. [20], it indicates that the bedding effect of the shear fracture mode showed a strengthening trend with the greater shear strain rate and the lower normal stress (Figure 8).
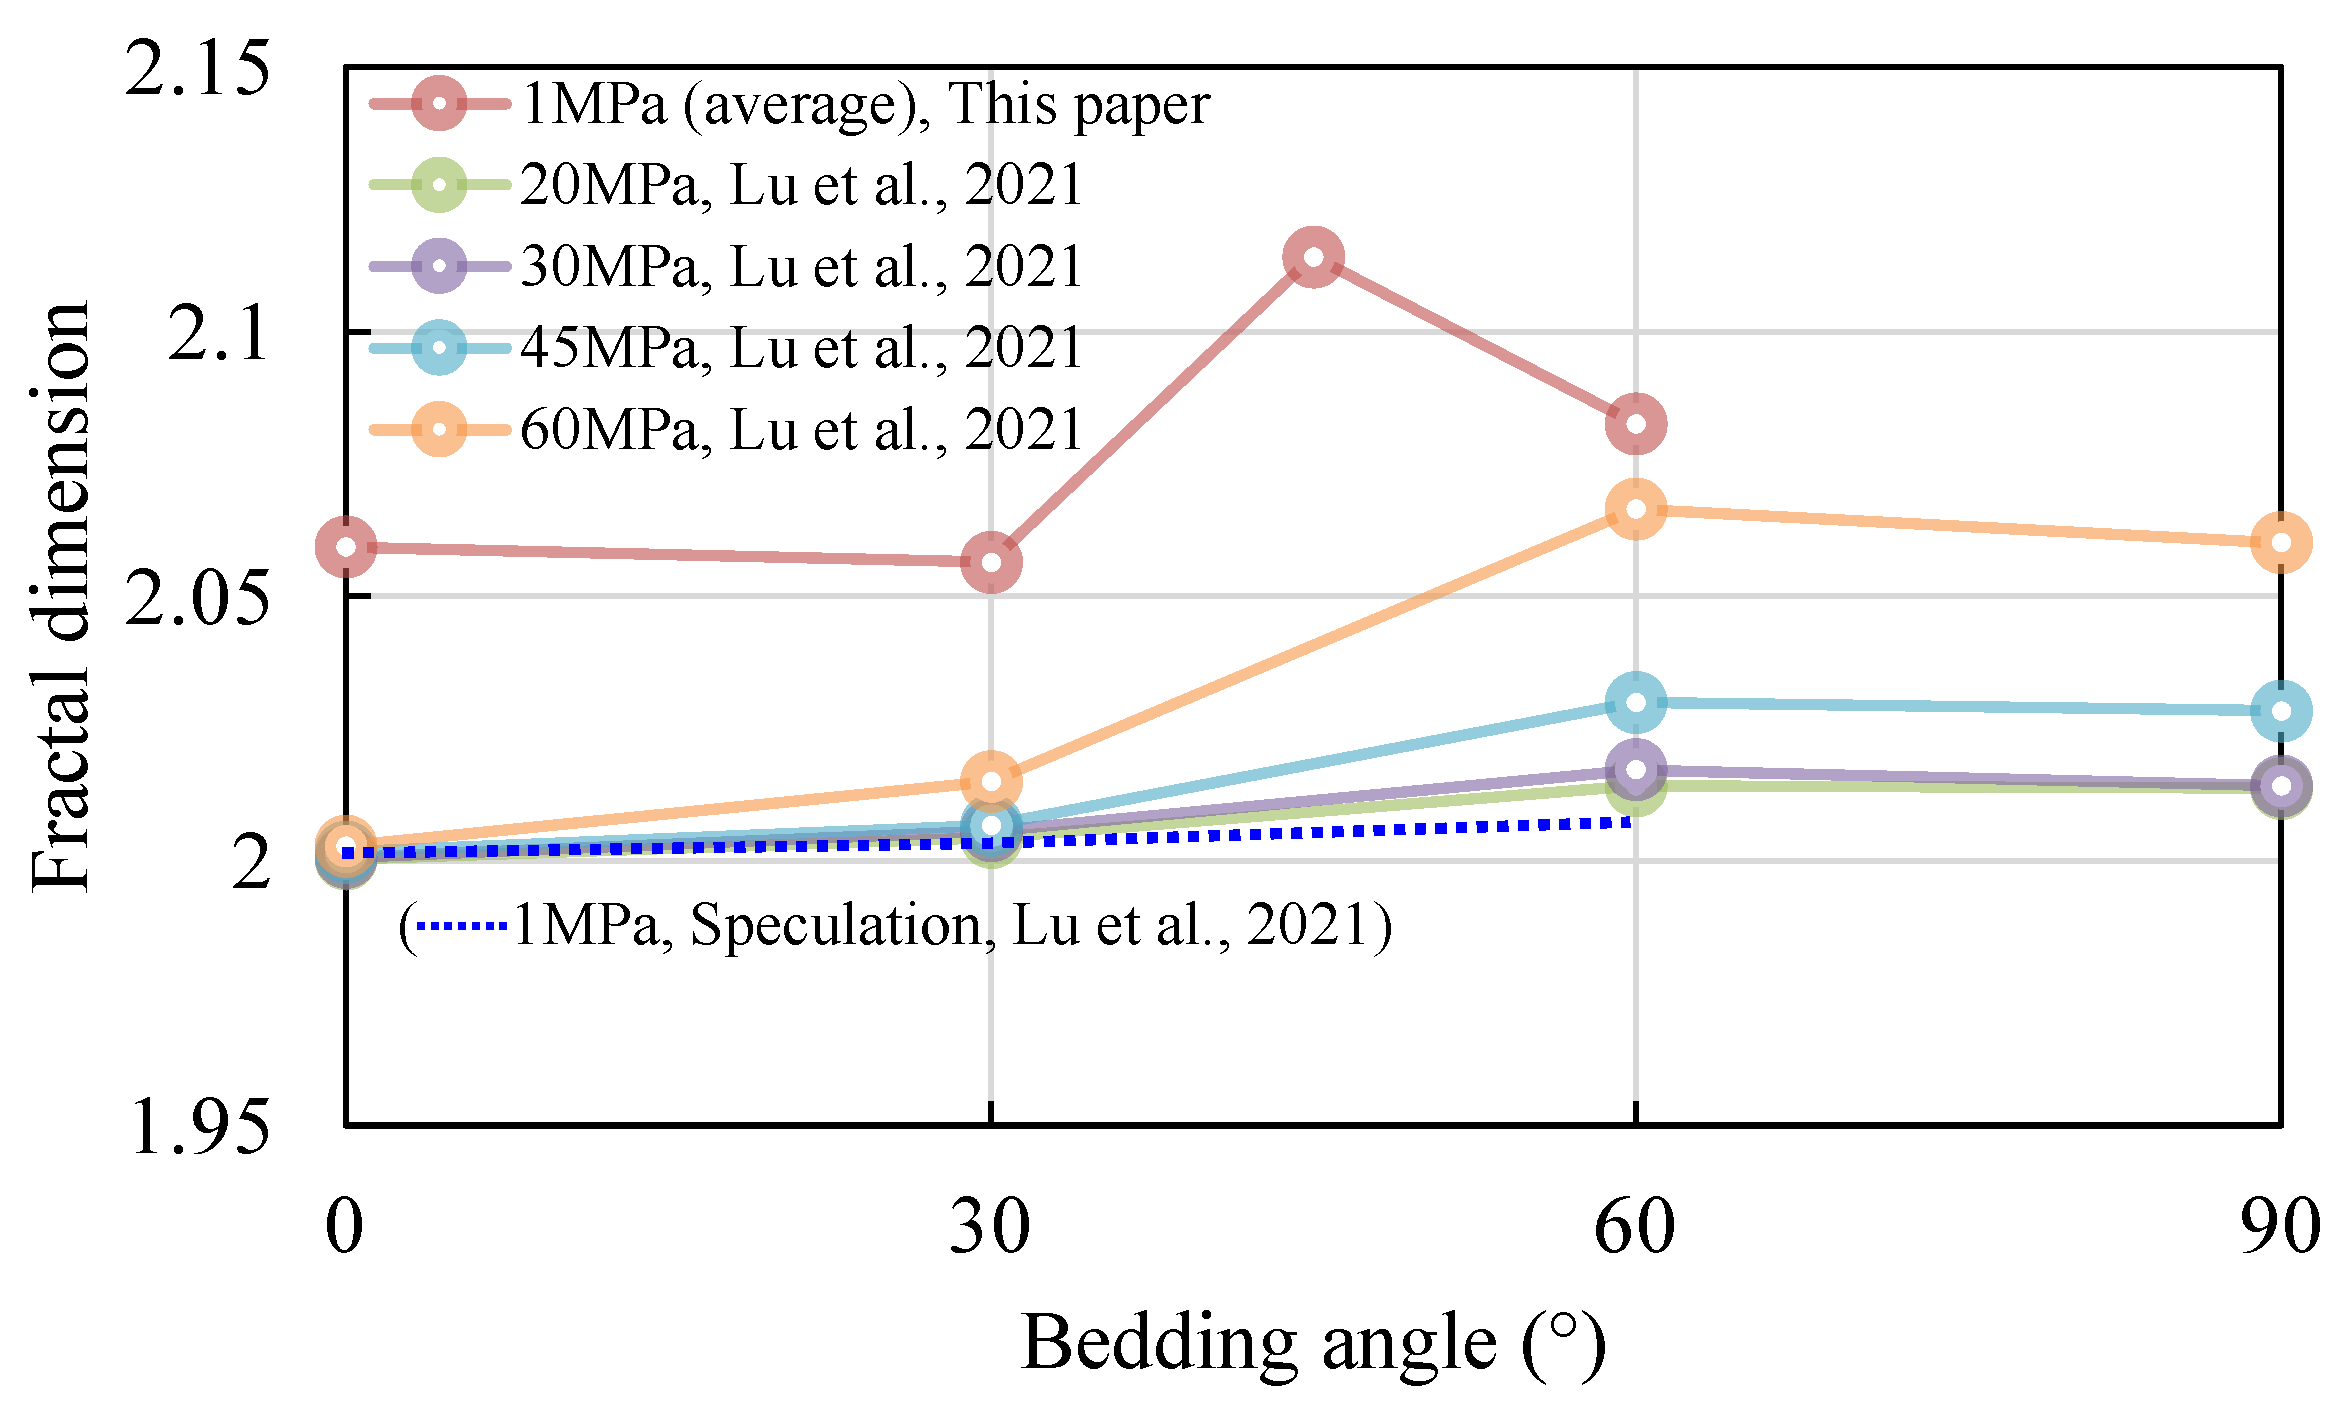
The bedding angle had an influence on the shale shear fracture surface morphology. Although the normal stress in this study was low (1 MPa), the fractal dimension of the shear fracture surface morphology at different bedding angles was greater than that of the shear fracture surface morphology under high normal stress (20–60 MPa) in the work by Lu et al. [20], as shown in Figure 16. It should be noted that the fractal dimension of this work in Figure 16 was the average value of fractal dimension for the upper and lower shear fracture planes. In order to facilitate the comparison of the fractal dimension under the same normal stress of 1 MPa, we gave the quantitative presumption about the fractal dimension of the shear fracture surface for shale samples of different bedding angles with the normal stress of 1 MPa based on variations of the fractal dimension for the shear fracture surface morphology with bedding angles under different normal stress conditions utilized in Lu et al. [20]. It can be seen from Figure 16 that when the bedding angle increased from 30° to 60°, the shear strain rate increased (Table 3) and the bedding effect of the roughness for the shear fracture surface morphology increased. Moreover, it can be seen that when the shear strain rate was greater (Table 3), there was a stronger bedding effect from the roughness for the shear fracture surface morphology. This indicates that the shear strain rate played a dominant role in the fractal dimension of the shear fracture surface morphology.
The effect of bedding angle on the shear strength of other lithologies has been discussed in the previous literature. For instance, previous researchers found that the shear strength values showed an increase with the increase in the angle between the bedding plane of the Mont Terri Opalinus Claystones and the shear plane in the direction of shear [41]. On the basis of Heng et al. [22], Lu et al. [20], and Li [33], the peak shear strength of shale samples with different bedding angles is depicted in Figure 17. It can be seen from Figure 17 that when the normal stress was the same (1 MPa) and the bedding angle was less than 90° (acute-angle shear mode), the peak shear strength fluctuated and increased with an increase in the bedding angle. As the bedding angle was between 90° and 180° (obtuse-angle shear mode), the peak shear strength fluctuated and decreased with an increase in the bedding angle. It can be seen that the shear strain rate effect of the peak shear strength strengthened with an increase in the bedding angle. Figure 17 shows that the peak shear strength values for the bedding angles of 60° and 150° were maximal for the acute-angle shear mode and the obtuse-angle shear mode, respectively, which could be mainly due to more mixed-mode fractures and more complicated failure mechanisms along the bedding plane and the matrix, resulting in greater peak shear strength, as described in Section 4.2 and by Heng et al. [22] and Lu et al. [20]. The stress states of the micro-element near the shear plane for the acute-angle shear mode and the obtuse-angle shear mode are shown in Figure 18, revised from Heng et al. [24] and Lu et al. [20]. With regard to the acute-angle shear mode, the shear force tended to induce bedding plane compaction and prevent the tensile splitting of the bedding plane but promoted shear slip. In terms of the obtuse-angle shear mode, there was a trend of shear force inducing a large amount of bedding plane cracking and producing echelon cracks with complex shapes [24]. This indicates that different shear modes and various bedding angles result in complicated fracture mechanisms and the anisotropy of peak shear strength in shale.
4.4. Influence of the Shear-Strain Rate
Previous studies have reported that there are two types of rate effects for rock materials in direct shear tests [34,42,43,44]. One type has a shear-rate-strengthening effect on the shear strength of rock mass discontinuities such as granite and concrete [34,43]. The other type has a shear-rate-weakening influence on the shear strength of discontinuities such as sandstone and plaster [42,43]. In this study, we found that there was the phenomenon of a shear-rate-weakening effect on the shear strength of shale, which displayed the similar rate influence of shear strength of sandstone, possibly due to their common lithology. From Table 3 and Figure 13 and Figure 17, we can see that when the sample shape was the same, the shale samples of the same size had peak shear strength values of proximate magnitudes. It seems that the peak shear strength of shale decreased with both the shear rate and the sample size increasing overall. However, when shale samples with different sizes were applied to shear loads of various shear rates, it was difficult to rigorously conclude the specific influence of the shear rate or sample size, especially the area involved in the shearing on the peak shear strength, based on the current experimental results. Therefore, the parameter of the shear strain rate was introduced to analyze the rate influence on the peak shear strength of shale, which could avoid the uncertainty caused by the two-factor variables of shear rate and sample size. It was suggested in Section 4.3 that relatively complicated failure patterns could result in a higher failure strength. At a lower shear rate, the shear force loading on shale took longer than that at a higher shear rate. Furthermore, the experiments at a lower shear rate, namely, with a longer shear loading time, could probably induce more complex fractures, causing a greater shear strength than that at a higher shear rate, which might explain the experimental law behind the peak shear strength of shale decreasing with an increase in shear strain rate, as seen in Figure 13.
4.5. Potential Applications
As mentioned above, these findings have potential application value in shale horizontal well engineering and fracturing engineering. For instance, in terms of the stability for the formation around a shale horizontal well, when the bedding angle is 0° or 45°, the shear strength of shale appears to be low (Figure 12 and Figure 17). In this case, it is recommended that corresponding measures should be taken to ensure the stability of the surrounding stratum for the shale horizontal well, considering both the geostress and the bedding angle of the formation around the shale horizontal well. As another example, with regard to the expansion and evolution of fractures for shale fracturing, when the bedding angle is 60°, the difference in the morphology between the upper and lower shear fracture planes reaches a maximum (Figure 11), which means that the degree of the local fracture, as well as the complexity of the morphology, is the highest and the fractures may have higher permeability characteristics. Further, when the bedding angle is 45°, the roughness of the shear fracture surface appears larger (Figure 11), indicating that fractures are more likely to form self-support during subsequent shearing, thus potentially providing a more favorable channel for shale gas seepage and then increasing the productivity of shale reservoirs. From these points of view, we suggest adjusting and optimizing fracturing programs to induce more shear cracks. Therefore, the bedding angle or angle range could have an important impact on the formation stability around the shale horizontal well and the expansion and evolution of fractures in shale fracturing.
4.6. Limitations and Prospects
In this study, we have explored the shear properties of anisotropic reservoir shale based on both our experiments and previous experimental results. Nevertheless, due to the fresh shale samples for the direct shear tests being difficult to process, there are still some limitations to the use of the data from the current results of our research regarding shale direct shear tests, especially the information from the dynamic direct shear tests for shale, taking into account that the sample size and the normal stress conditions are insufficient. In future research, we recommend carrying out shale direct shear tests with a larger sample size and the greater normal stress in the higher shear strain rate range to explore the influence of size, as well as normal stress and rate effects, in depth. Moreover, we suggest conducting acoustic emission monitoring in shale dynamic direct shear tests to quantitatively determine the distribution of tensile cracks or shear cracks on the shear fracture surface. Then, suitable statistic models, such as the deformation constitutive equation and the strength criterion formula, could be proposed, to quantitatively evaluate the experimental results.
5. Conclusions
In order to study the shear properties of anisotropic reservoir shale, on the basis of previous experimental research results, shale direct shear tests were performed using a larger sample size (100 mm along the shear direction), as well as a higher shear rate (0.01 mm/s), and comparative studies were carried out considering different bedding angles with a low normal stress condition. The following conclusions are drawn:
- (1)
- The deformation and failure characteristics of shale are affected by the shear mode, shear strain rate, and normal stress. The peak shear displacement, peak shear strength, and shear stiffness of shale fluctuate with an increase in the bedding angle. The peak shear strength of shale decreases with an increase in the shear strain rate, and this tendency decreases with an increase in the shear strain rate.
- (2)
- The shape of the shear fracture zone and the shear fracture mode of shale have clear bedding effect characteristics. With an increase in the bedding angle, the shape of the shear fracture zone changes from a straight rough type to a curved rough type and the influence range of the shear fracture zone expands.
- (3)
- The fractal dimension of the shale shear fracture surface morphology fluctuates with a change in the bedding angle, and the bedding effect of the difference in the local fracture degree and the morphology complexity between the upper and lower shear fracture surfaces increases with an increase in the bedding angle. The larger the shear strain rate, the stronger the bedding effect of the roughness of the shear fracture surface morphology.
Author Contributions
Conceptualization, B.Z. and S.Q.; methodology, S.Q. and S.G.; software, G.L., X.Z. and Z.Z.; validation, N.L. and C.J.; formal analysis, W.L.; investigation, X.Y. and Y.L.; data curation, J.C.; writing—original draft preparation, B.Z.; writing—review and editing, S.Q., B.Z. and S.G.; funding acquisition, B.Z. and S.Q. All authors have read and agreed to the published version of the manuscript.
Funding
This work was funded by the National Natural Science Foundation of China under Grant Nos. 41825018, 42141009, 41902289, and 41888101, the Key Research Program of the Institute of Geology and Geophysics, CAS under Grant No. IGGCAS-202201, the Youth Innovation Promotion Association Foundation of the Chinese Academy of Sciences under Grant No. 2023073, and the Second Tibetan Plateau Scientific Expedition and Research Program (STEP) under Grant No. 2019QZKK0904.
Data Availability Statement
Data are contained within this article.
Acknowledgments
We thank Xiao Li and Shouding Li very much for providing us with the shale samples.
Conflicts of Interest
The authors declare no conflicts of interest.
References
- Zhang, D.; Yang, T.; Wu, T.; Li, X.; Zhao, J. Recovery mechanisms and key issues in shale gas development. Chin. Sci. Bull. 2017, 61, 62–71. (In Chinese) [Google Scholar] [CrossRef]
- Fu, H.J.; Yan, D.T.; Yao, C.P.; Su, X.B.; Wang, X.M.; Wang, H.; Li, Y.G. Pore structure and multi-scale fractal characteristics of adsorbed pores in marine shale: A case study of the Lower Silurian Longmaxi Shale in the Sichuan Basin, China. J. Earth Sci.-China 2022, 33, 1278–1290. [Google Scholar] [CrossRef]
- Curtis, J.B. Fractured shale-gas systems. Am. Assoc. Pet. Geol. Bull. 2002, 86, 1921–1938. [Google Scholar] [CrossRef]
- Martineau, D.F. History of the Newark East field and the Barnett Shale as a gas reservoir. Am. Assoc. Pet. Geol. Bull. 2007, 91, 399–403. [Google Scholar] [CrossRef]
- Yao, J.; Ding, Y.; Sun, H.; Fan, D.; Wang, M.; Jia, C. Productivity analysis of fractured horizontal wells in tight gas reservoirs using a gas-water two-phase flow model with consideration of a threshold pressure gradient. Energy Fuel 2023, 37, 8190–8198. [Google Scholar] [CrossRef]
- Barton, N. Review of a new shear-strength criterion for rock joints. Eng. Geol. 1973, 7, 287–332. [Google Scholar] [CrossRef]
- Grasselli, G.; Egger, P. Constitutive law for the shear strength of rock joints based on three-dimensional surface parameters. Int. J. Rock Mech. Min. Sci. 2003, 40, 25–40. [Google Scholar] [CrossRef]
- Hoek, E. Strength of jointed rock masses. Géotechnique 1983, 33, 187–223. [Google Scholar] [CrossRef]
- Kulatilake, P.H.S.W.; Shou, G.; Huang, T.H.; Morgan, R.M. New peak shear strength criteria for anisotropic rock joints. Int. J. Rock Mech. Min. Sci. Geomech. Abstr. Pergamon 1995, 32, 673–697. [Google Scholar] [CrossRef]
- Li, J.; Li, H.; Zhao, J. An improved equivalent viscoelastic medium method for wave propagation across layered rock masses. Int. J. Rock Mech. Min. Sci. 2015, 73, 62–69. [Google Scholar] [CrossRef]
- Li, J.; Ma, G.; Zhao, J. An equivalent viscoelastic model for rock mass with parallel joints. J. Geophys. Res. Solid. Earth 2010, 115, 1923–1941. [Google Scholar] [CrossRef]
- Li, J.; Rong, L.; Li, H.; Hong, S. An SHPB test study on stress wave energy attenuation in jointed rock masses. Rock Mech. Rock Eng. 2019, 52, 403–420. [Google Scholar] [CrossRef]
- Niandou, H.; Shao, J.; Henry, J.P.; Fourmaintraux, D. Laboratory investigation of the mechanical behaviour of Tournemire shale. Int. J. Rock Mech. Min. Sci. 1997, 34, 3–16. [Google Scholar] [CrossRef]
- Zheng, B.; Qi, S.; Luo, G.; Liu, F.; Huang, X.; Guo, S. Characterization of discontinuity surface morphology based on 3D fractal dimension by integrating laser scanning with ArcGIS. Bull. Eng. Geol. Environ. 2021, 80, 2261–2281. [Google Scholar] [CrossRef]
- Zhao, Y.; Borja, R.I. A double-yield-surface plasticity theory for transversely isotropic rocks. Acta Geotech. 2022, 17, 5201–5221. [Google Scholar] [CrossRef]
- Zhao, Y.; Wang, R.; Zhang, J. A dual-mechanism tensile failure criterion for transversely isotropic rocks. Acta Geotech. 2022, 17, 5187–5200. [Google Scholar] [CrossRef]
- He, J.; Afolagboye, L.O. Influence of layer orientation and interlayer bonding force on the mechanical behavior of shale under Brazilian test conditions. Acta Mech. Sin. 2018, 34, 349–358. [Google Scholar] [CrossRef]
- Josh, M.; Esteban, L.; Piane, C.D.; Sarout, J.; Dewhurst, D.N.; Clennell, M.B. Laboratory characterisation of shale properties. J. Pet. Sci. Eng. 2012, 88–89, 107–124. [Google Scholar] [CrossRef]
- Kuila, U.; Dewhurst, D.N.; Siggins, A.F.; Raven, M.D. Stress anisotropy and velocity anisotropy in low porosity shale. Tectonophysics 2011, 503, 34–44. [Google Scholar] [CrossRef]
- Lu, H.; Xie, H.; Luo, Y.; Ren, L.; Zhang, R.; Li, C.; Wang, J.; Yang, M. Failure characterization of Longmaxi shale under direct shear mode loadings. Int. J. Rock Mech. Min. Sci. 2021, 148, 104936. [Google Scholar] [CrossRef]
- Ma, T.; Chen, P. Prediction method of shear instability region around the borehole for horizontal wells in bedding shale. Pet. Drill. Tech. 2014, 42, 26–36. (In Chinese) [Google Scholar] [CrossRef]
- Heng, S.; Guo, Y.; Yang, C.; Daemen, J.J.K.; Li, Z. Experimental and theoretical study of the anisotropic properties of shale. Int. J. Rock Mech. Min. Sci. 2015, 74, 58–68. [Google Scholar] [CrossRef]
- Daneshy, A.A. Off-balance growth: A new concept in hydraulic fracturing. J. Pet. Technol. 2003, 55, 78–85. [Google Scholar] [CrossRef]
- Heng, S.; Li, X.; Liu, X.; Zhang, X. Study on the propagation mechanisms of shale fractures under direct shear conditions. Chin. J. Rock Mech. Eng. 2019, 38, 2438–2450. (In Chinese) [Google Scholar] [CrossRef]
- Barton, N.; Bandis, S.; Bakhtar, K. Strength, deformation and conductivity coupling of rock joints. Int. J. Rock Mech. Min. Sci. Geomech. Abstr. 1985, 22, 121–140. [Google Scholar] [CrossRef]
- Barton, N.; Choubey, V. The shear strength of rock joints in theory and practice. Rock Mech. 1977, 10, 1–54. [Google Scholar] [CrossRef]
- Homand, F.; Belem, T.; Souley, M. Friction and degradation of rock joint surfaces under shear loads. Int. J. Numer. Anal. Methods Geomech. 2001, 25, 973–999. [Google Scholar] [CrossRef]
- Jing, L.; Nordlund, E.; Stephansson, O. An experimental study on the anisotropy and stress-dependency of the strength and deformability of rock joints. Int. J. Rock Mech. Min. Sci. Geomech. Abstr. 1992, 29, 535–542. [Google Scholar] [CrossRef]
- Li, J.; Yuan, W.; Li, H.; Zou, C. Study on dynamic shear deformation behaviors and test methodology of sawtooth-shaped rock joints under impact load. Int. J. Rock Mech. Min. Sci. 2022, 158, 105210. [Google Scholar] [CrossRef]
- Luo, G.; Qi, S.; Zheng, B. Rate effect on the direct shear behavior of granite rock bridges at low to subseismic shear rates. J. Geophys. Res. Solid Earth 2022, 127, e2022JB024348. [Google Scholar] [CrossRef]
- Yu, K.W.; Xu, L.; Peng, J.B.; Zuo, L.; Guan, G.X. Development of a new in-situ interface shear box test apparatus and its applications. J. Earth Sci.-China 2023, 34, 935–939. [Google Scholar] [CrossRef]
- Yuan, H.; Chen, P. Strength weakening rules of shale hydration based on direct shear tests. Nat. Gas. Ind. 2015, 35, 71–77. (In Chinese) [Google Scholar] [CrossRef]
- Li, T. Study on Anisotropic Mechanical Behavior of Reservoir Shale in Shear Failure. Master’s Thesis, Chongqing University, Chongqing, China, 2021. (In Chinese) [Google Scholar] [CrossRef]
- Qi, S.; Zheng, B.; Wu, F.; Huang, X.; Guo, S.; Zhan, Z.; Zou, Y.; Barla, G. A new dynamic direct shear testing device on rock joints. Rock Mech. Rock Eng. 2020, 53, 4787–4798. [Google Scholar] [CrossRef]
- Martin, C.D.; Chandler, N.A. The progressive fracture of Lac du Bonnet granite. Int. J. Rock Mech. Min. Sci. Geomech. Abstr. 1994, 31, 643–659. [Google Scholar] [CrossRef]
- Asadizadeh, M.; Moosavi, M.; Hossaini, M.F.; Masoumi, H. Shear strength and cracking process of non-persistent jointed rocks: An extensive experimental investigation. Rock Mech. Rock Eng. 2018, 51, 415–428. [Google Scholar] [CrossRef]
- Cui, Y. Effect of joint type on the shear behavior of synthetic rock. Bull. Eng. Geol. Environ. 2019, 78, 3395–3412. [Google Scholar] [CrossRef]
- Lajtai, E.Z. Shear strength of weakness planes in rock. Int. J. Rock Mech. Min. Sci. Geomech. Abstr. 1969, 6, 499–515. [Google Scholar] [CrossRef]
- Lajtai, E.Z. Strength of discontinuous rocks in direct shear. Géotechnique 1969, 19, 218–233. [Google Scholar] [CrossRef]
- Ikari, M.J.; Niemeijer, A.R.; Marone, C. Experimental investigation of incipient shear failure in foliated rock. J. Struct. Geol. 2015, 77, 82–91. [Google Scholar] [CrossRef]
- Buocz, I.; Rozgonyi-Boissinot, N.; Török, Á. Influence of discontinuity inclination on the shear strength of Mont Terri Opalinus Claystones. Period. Polytech.-Civ. 2017, 61, 447–453. [Google Scholar] [CrossRef]
- Crawford, A.M.; Curran, J.H. The influence of shear velocity on the frictional resistance of rock discontinuities. Int. J. Rock Mech. Min. Sci. Geomech. Abstr. 1981, 18, 505–515. [Google Scholar] [CrossRef]
- Atapour, H.; Moosavi, M. The influence of shearing velocity on shear behavior of artificial joints. Rock Mech. Rock Eng. 2014, 47, 1745–1761. [Google Scholar] [CrossRef]
- Zheng, B.; Qi, S.; Huang, X.; Guo, S.; Wang, C.; Zhan, Z.; Luo, G. An advanced shear strength criterion for rock discontinuities considering size and low shear rate. Appl. Sci. 2020, 10, 4095. [Google Scholar] [CrossRef]
Figure 1.
Loading mode of direct shear tests for shale: (a) obtuse-angle shear mode; (b) acute-angle shear mode.
Figure 1.
Loading mode of direct shear tests for shale: (a) obtuse-angle shear mode; (b) acute-angle shear mode.
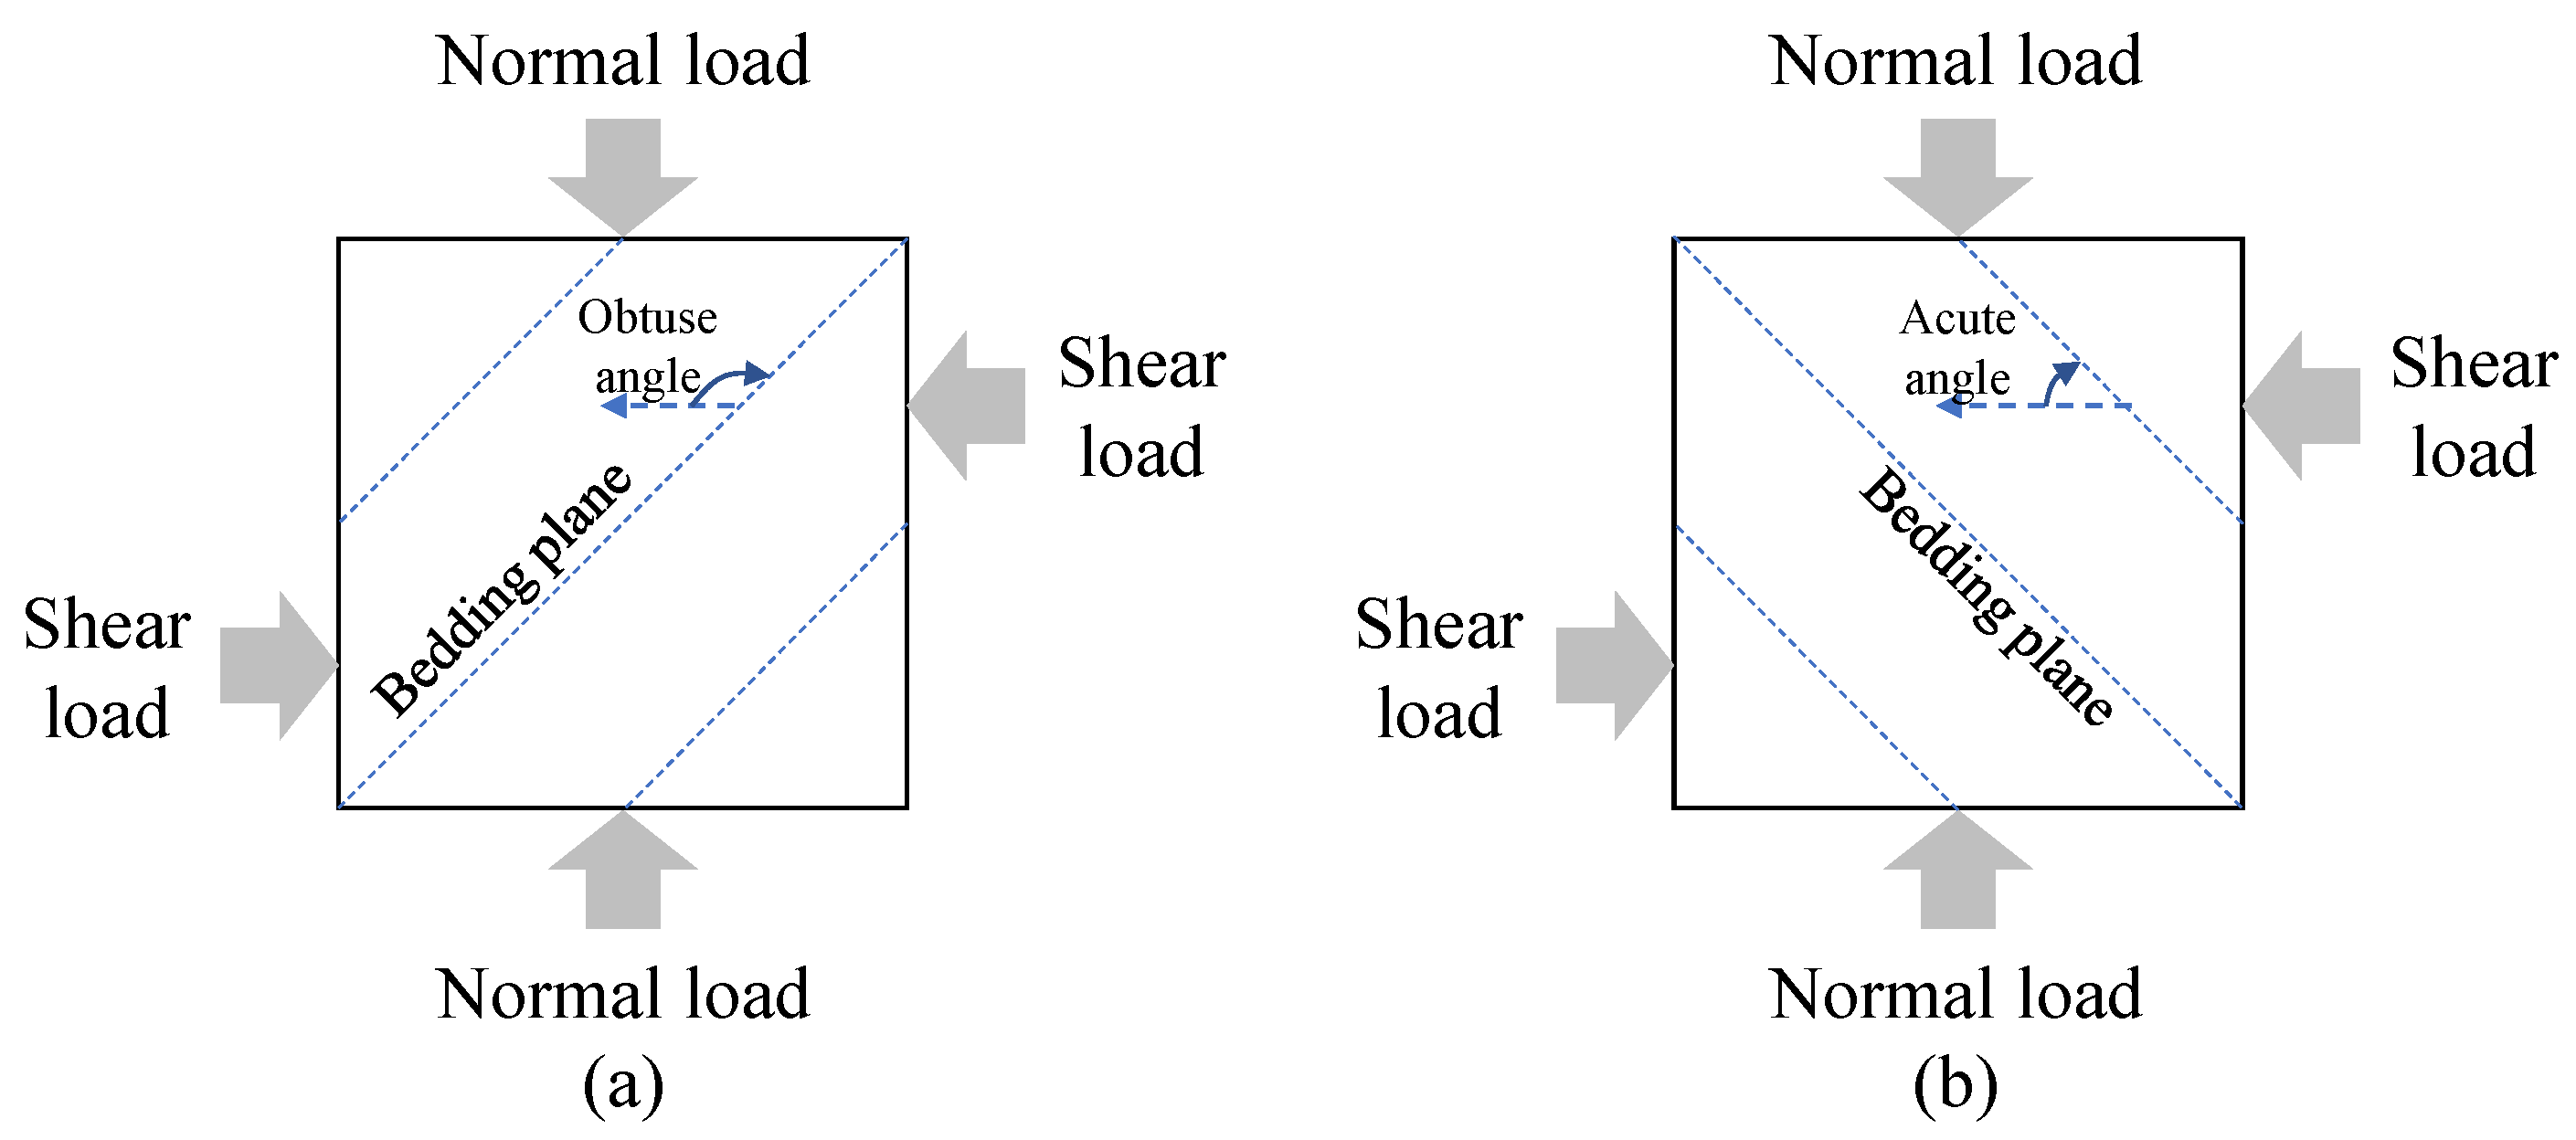
Figure 2.
Sample preparation and diagram of loading in the direct shear test: (a) processing of reservoir shale samples with different bedding angles; (b) sample size; (c) loading diagram of a sample in the experiment.
Figure 2.
Sample preparation and diagram of loading in the direct shear test: (a) processing of reservoir shale samples with different bedding angles; (b) sample size; (c) loading diagram of a sample in the experiment.
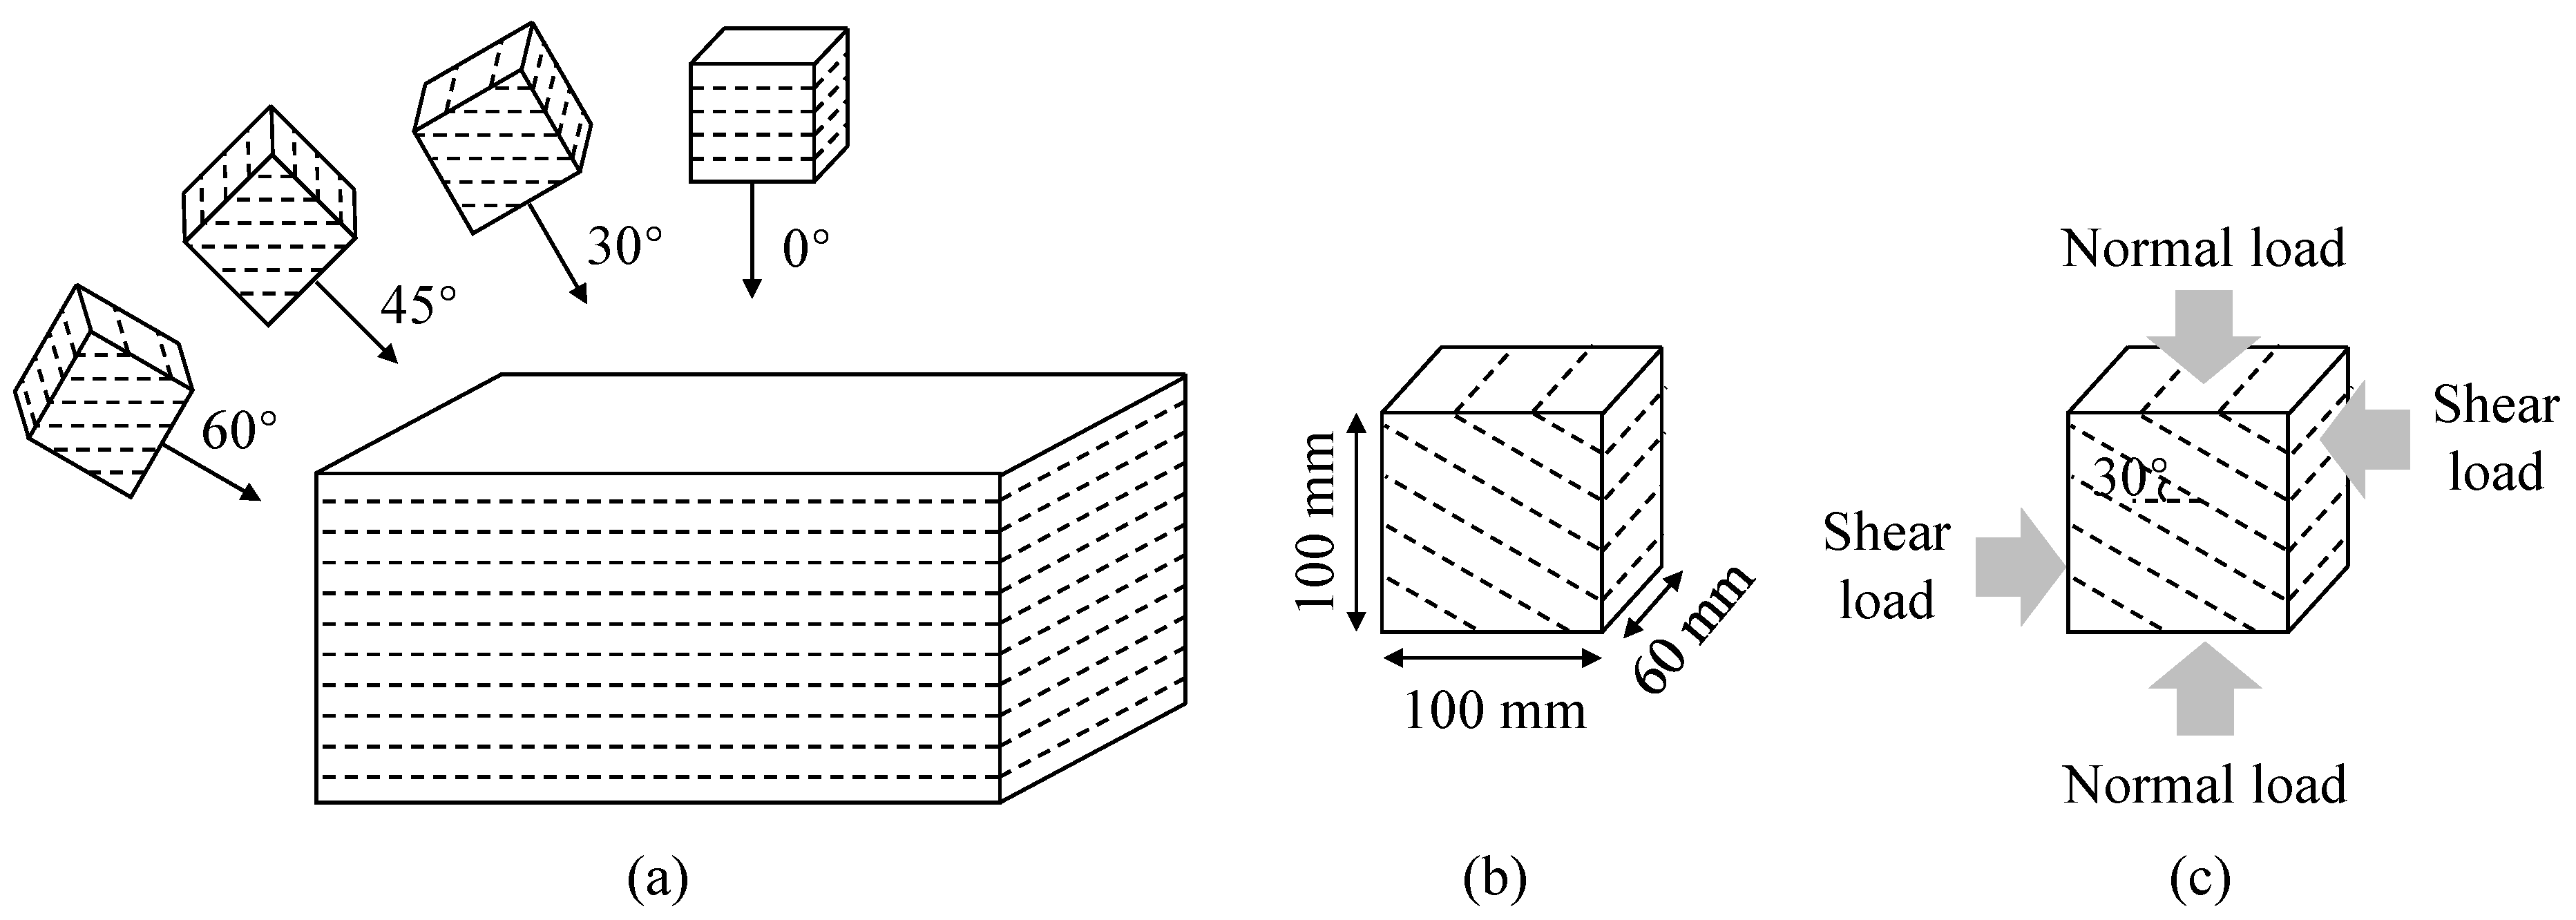
Figure 3.
Photograph of the dynamic direct shear test apparatus (TFD-500/1000-JS).
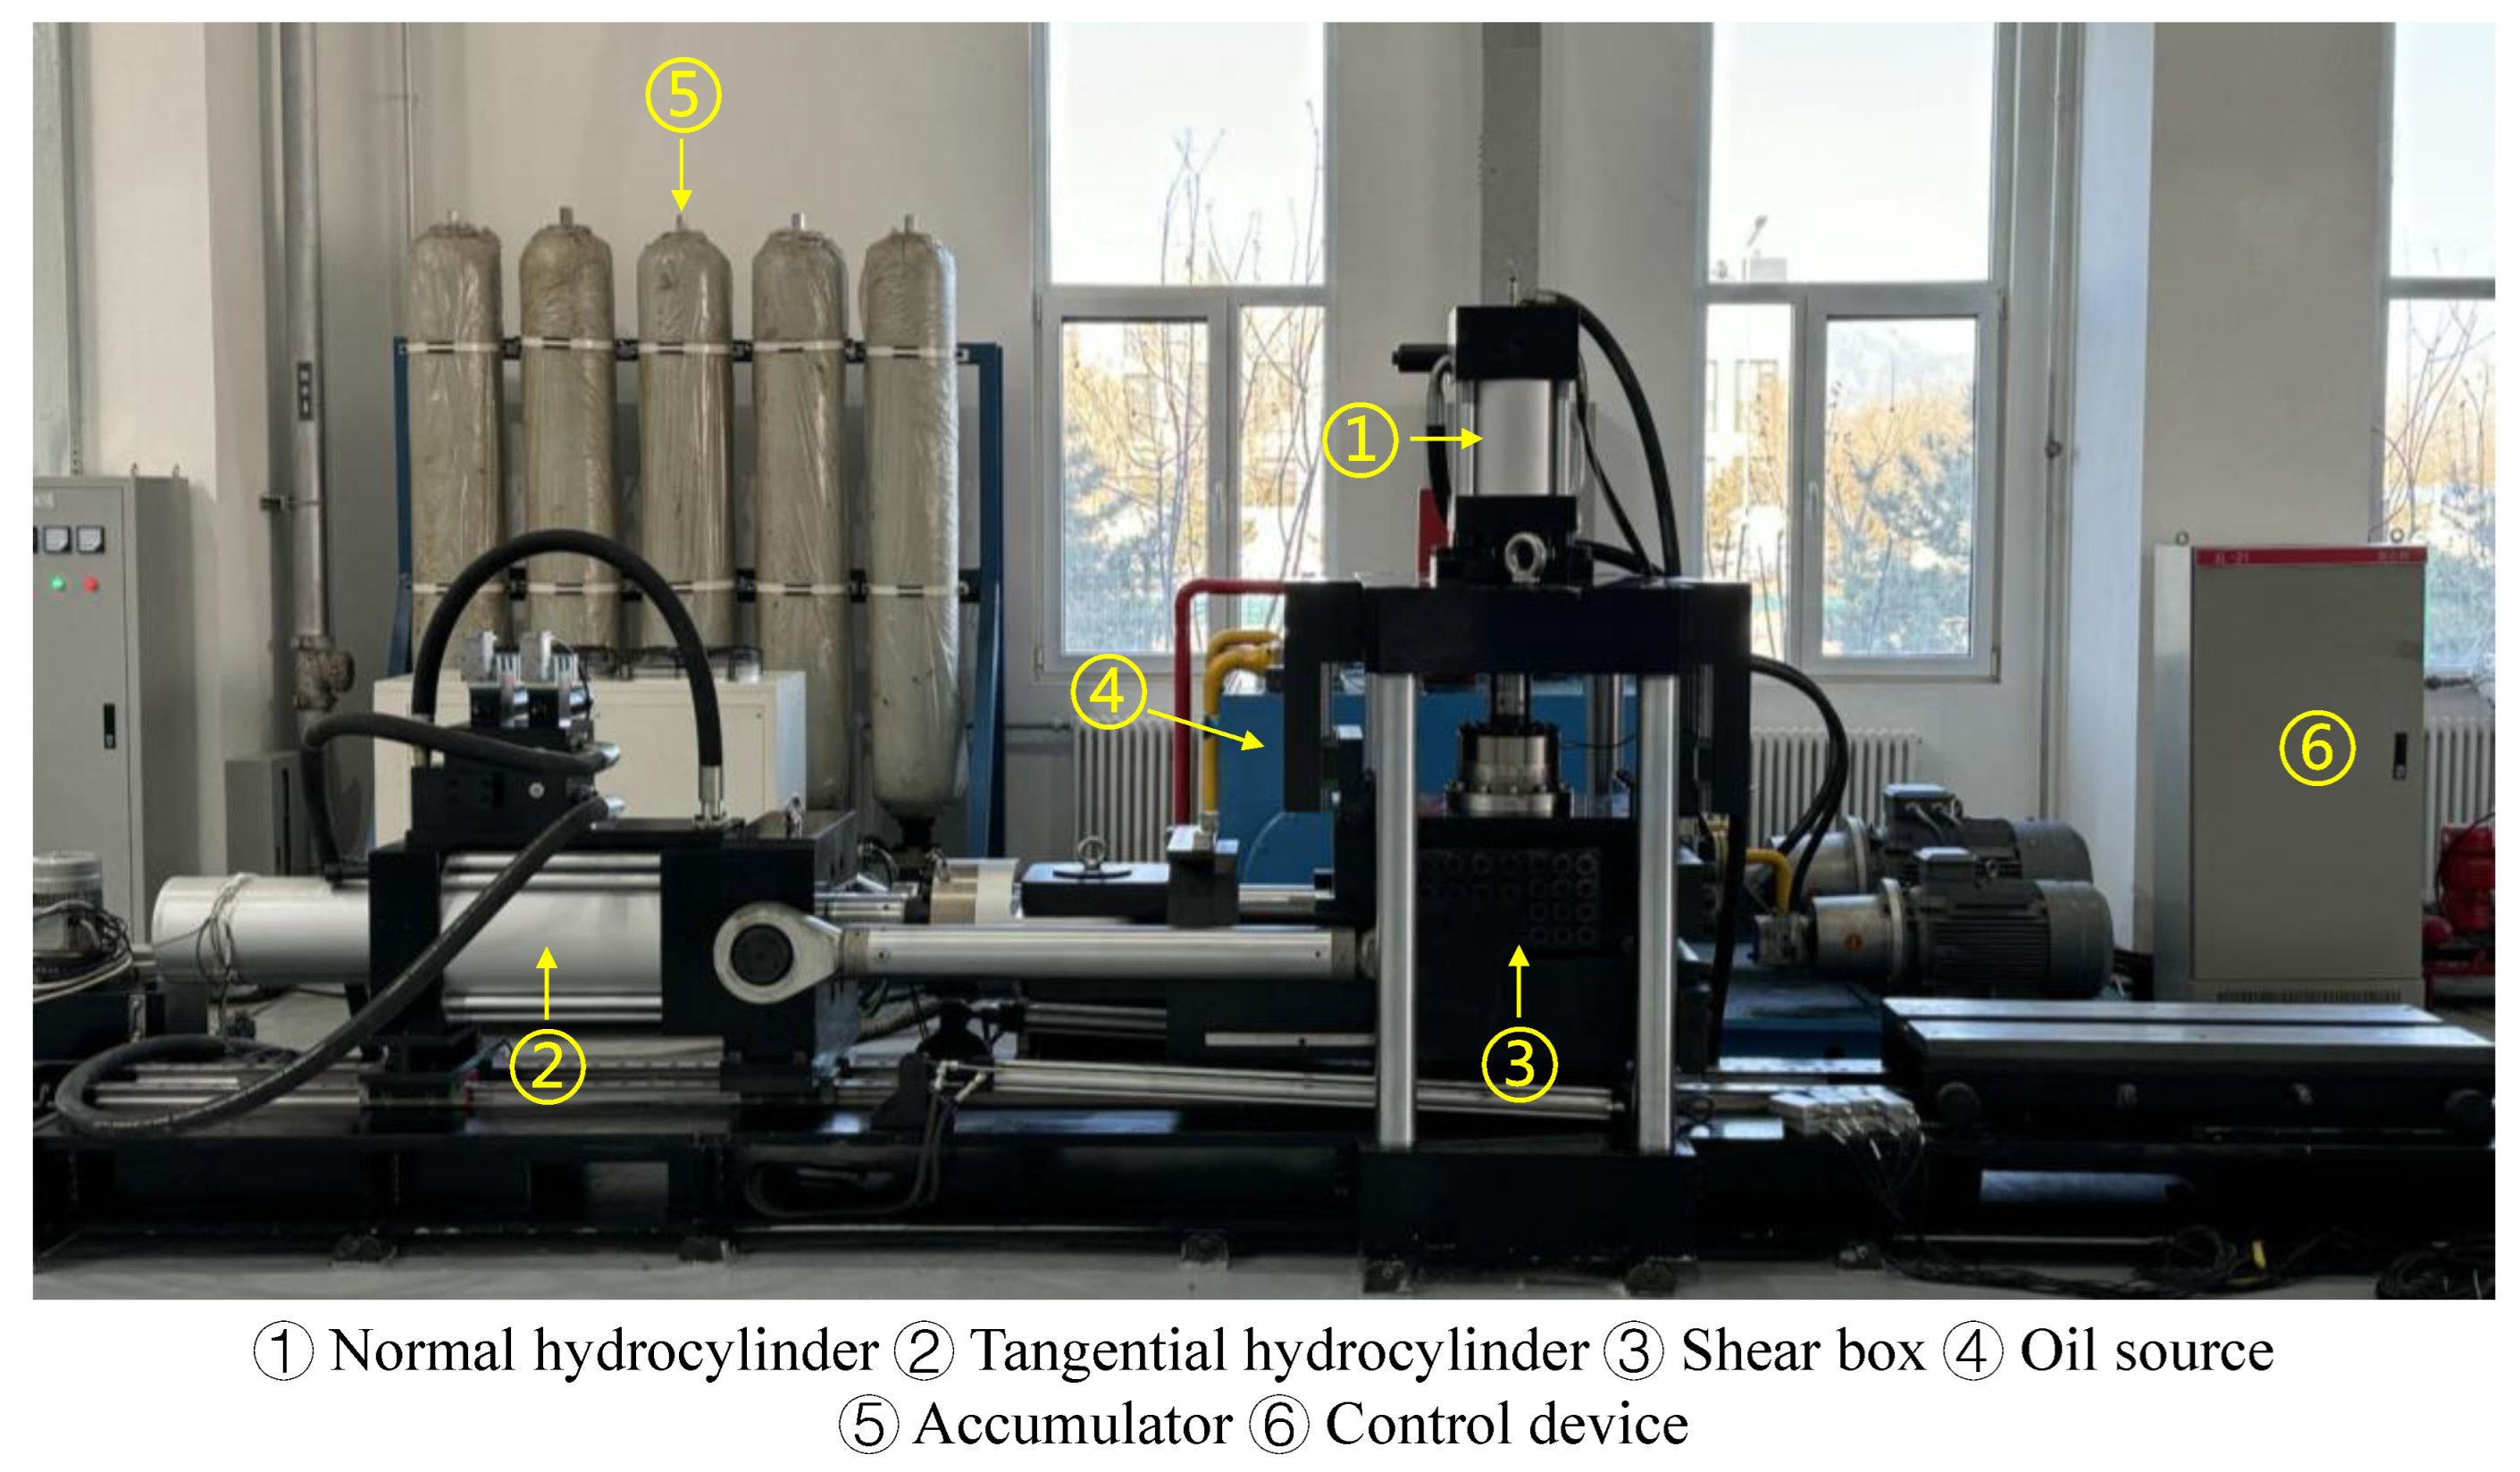
Figure 4.
Shale sample in the shear box and its stress conditions.

Figure 5.
Shear stress and shear displacement curves of shale samples with different bedding angles of (a) 0°, (b) 30°, (c) 45°, and (d) 60°.
Figure 5.
Shear stress and shear displacement curves of shale samples with different bedding angles of (a) 0°, (b) 30°, (c) 45°, and (d) 60°.
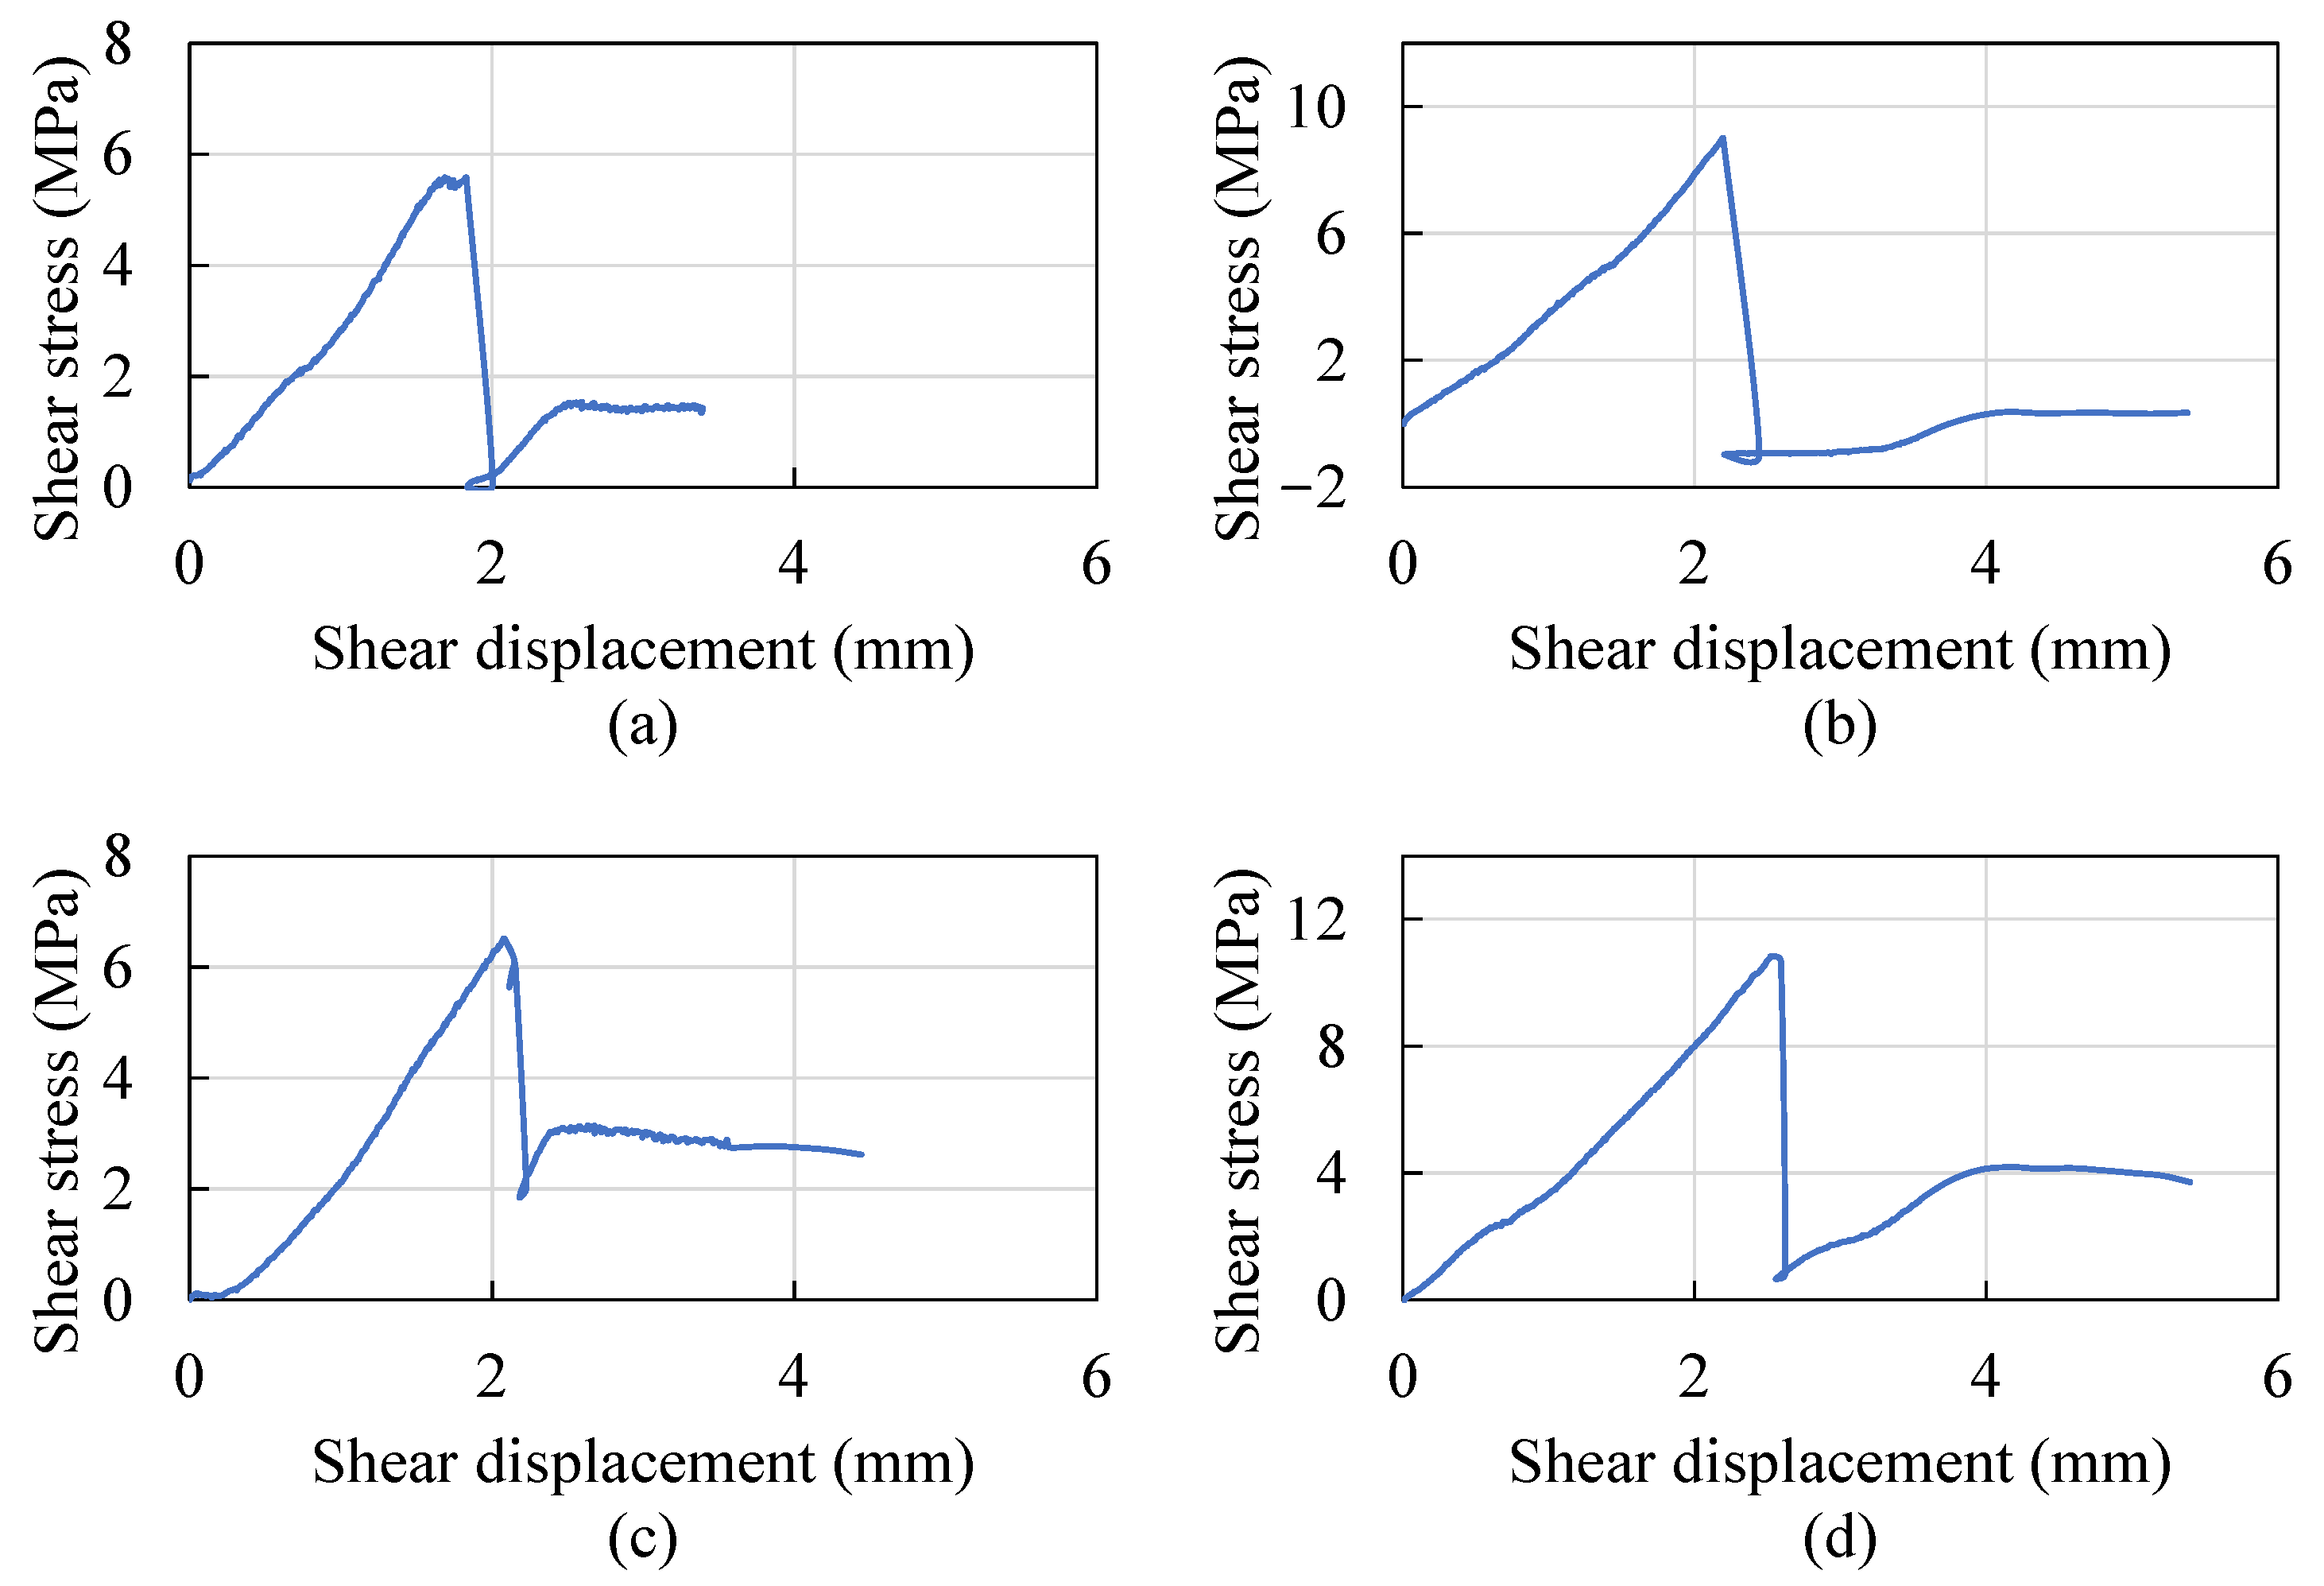
Figure 6.
Variation characteristics of the shear stress and shear displacement curve (taking the sample with the bedding angle of 45° as an example).
Figure 6.
Variation characteristics of the shear stress and shear displacement curve (taking the sample with the bedding angle of 45° as an example).
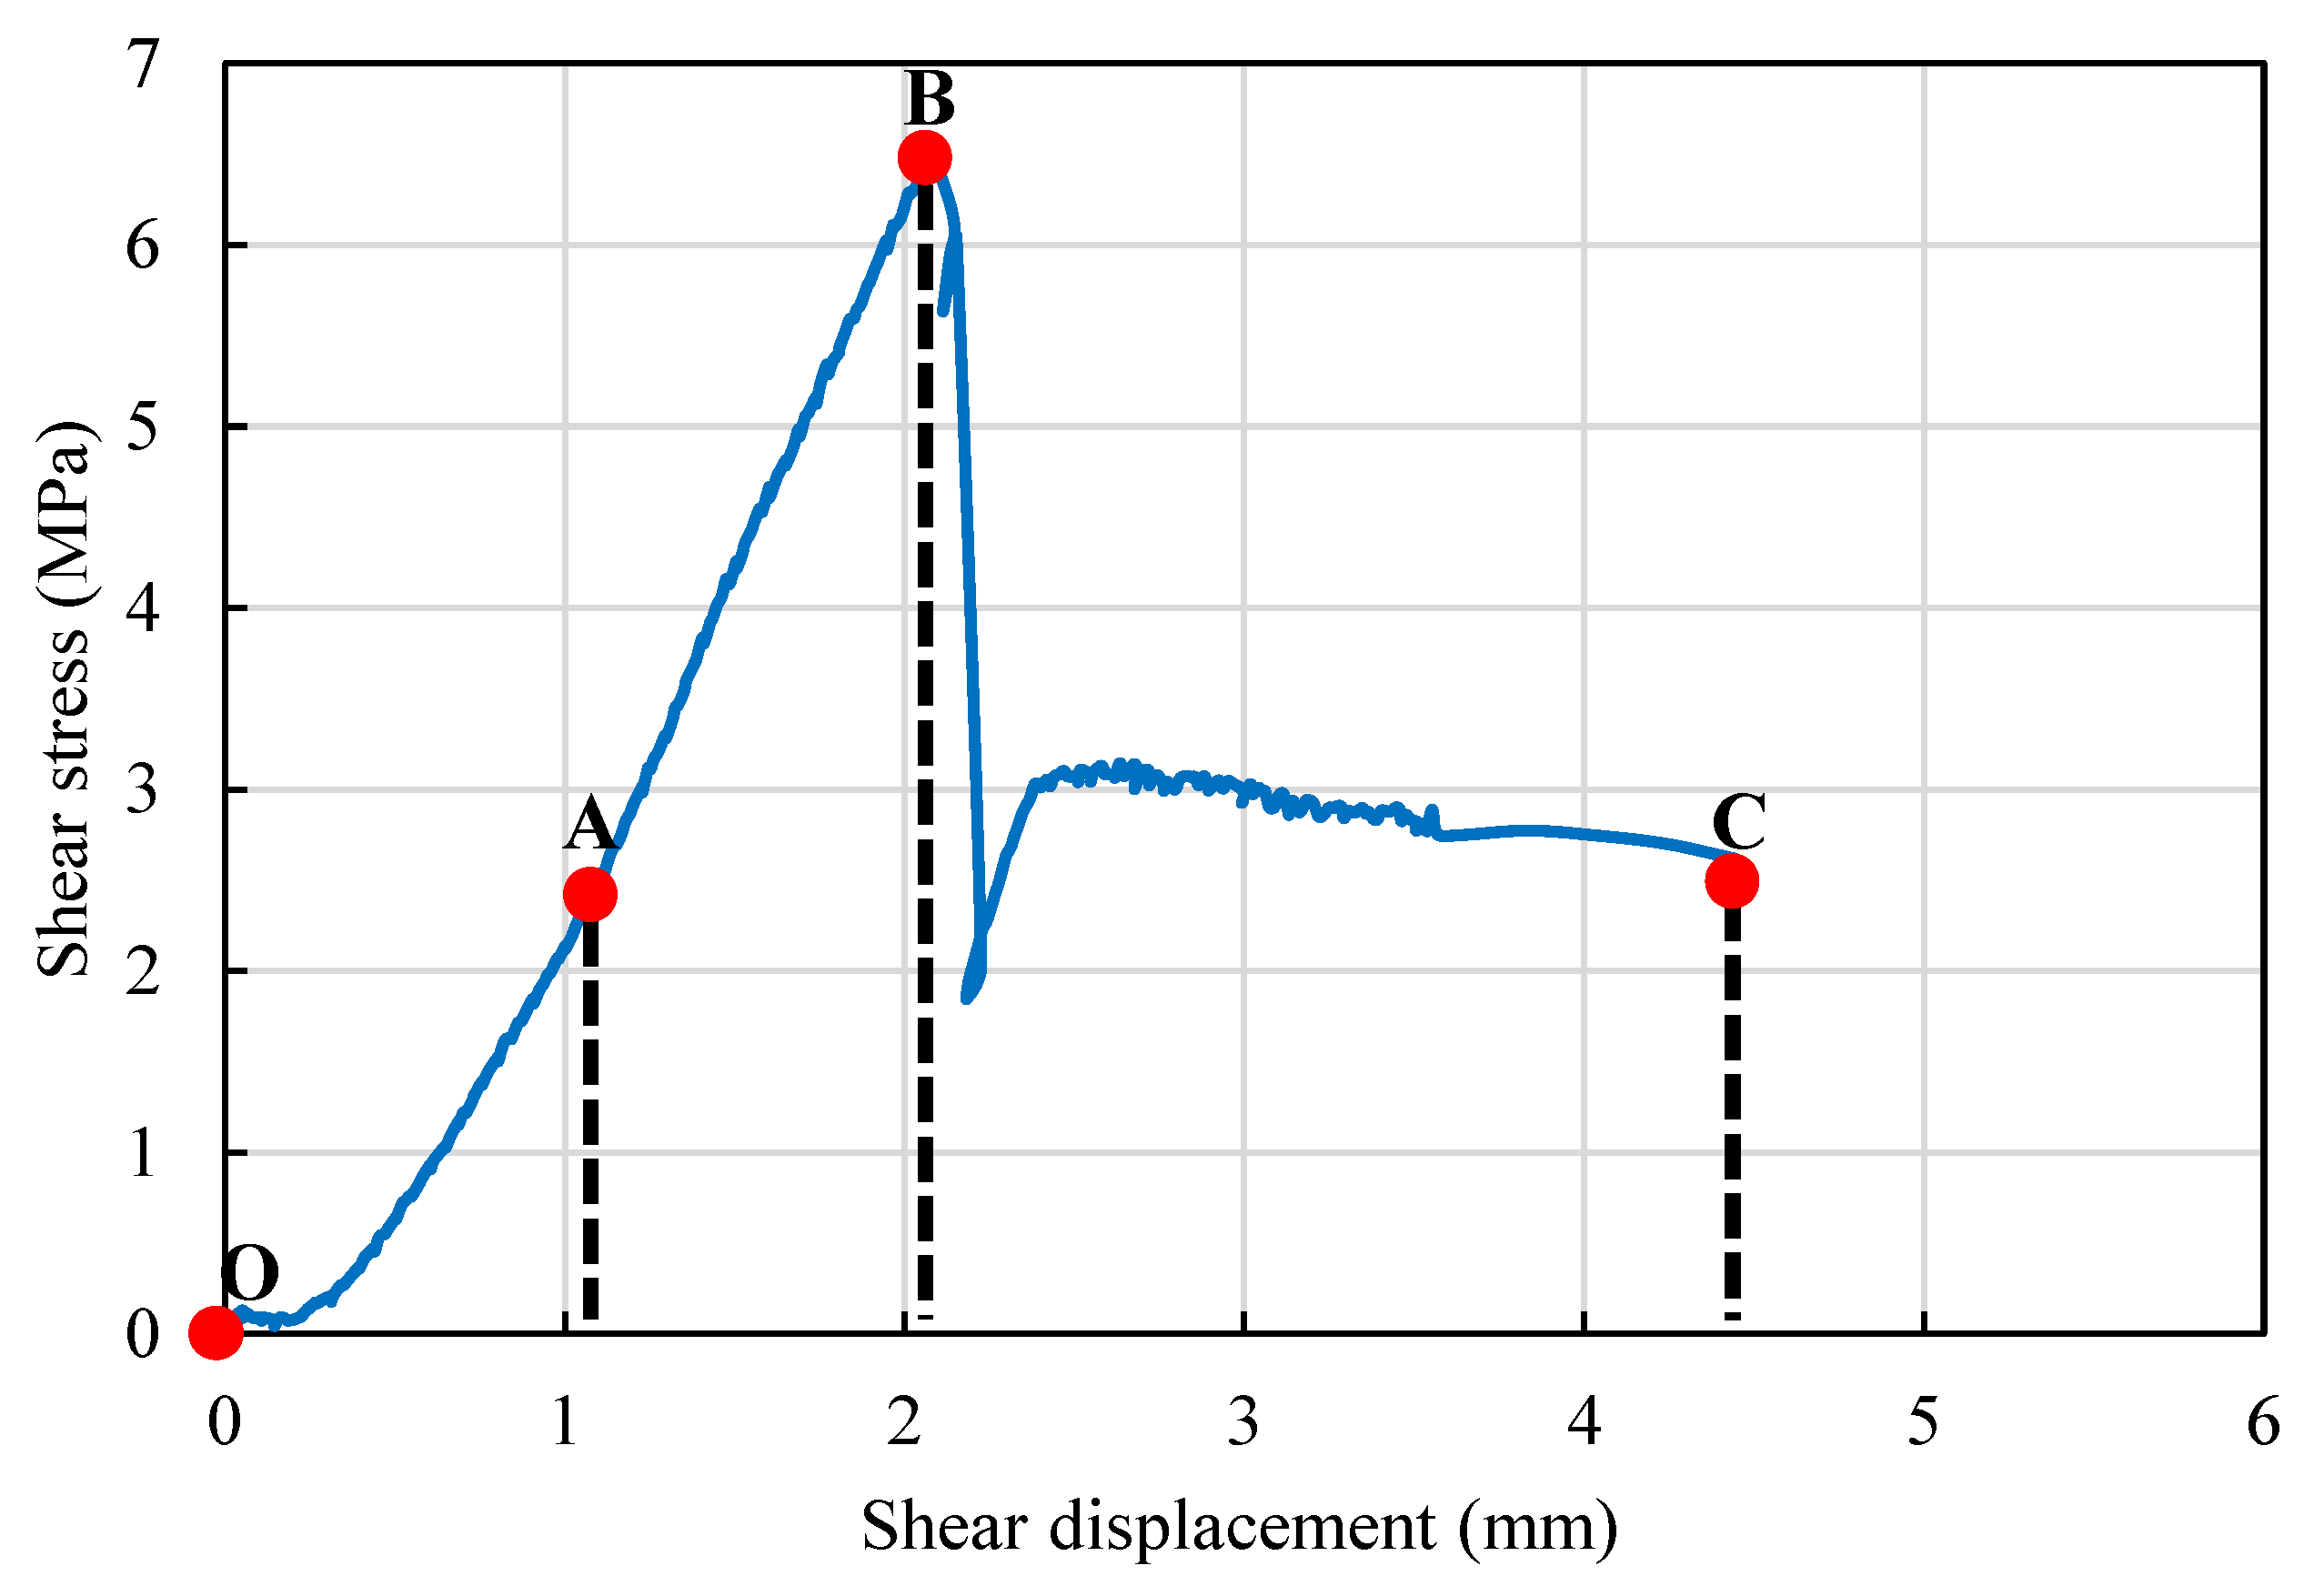
Figure 7.
Photographs of shale samples with different bedding angles after experiments: (a) 0°; (b) 30°; (c) 45°; (d) 60°.
Figure 7.
Photographs of shale samples with different bedding angles after experiments: (a) 0°; (b) 30°; (c) 45°; (d) 60°.

Figure 8.
Shear fracture zone traces of shale samples and their influence areas: (a) 0°; (b) 30°; (c) 45°; (d) 60°.
Figure 8.
Shear fracture zone traces of shale samples and their influence areas: (a) 0°; (b) 30°; (c) 45°; (d) 60°.

Figure 9.
Types of cracks in shear fracture zones for shale samples with bedding angles of (a) 0°, (b) 30°, (c) 45°, and (d) 60°.
Figure 9.
Types of cracks in shear fracture zones for shale samples with bedding angles of (a) 0°, (b) 30°, (c) 45°, and (d) 60°.
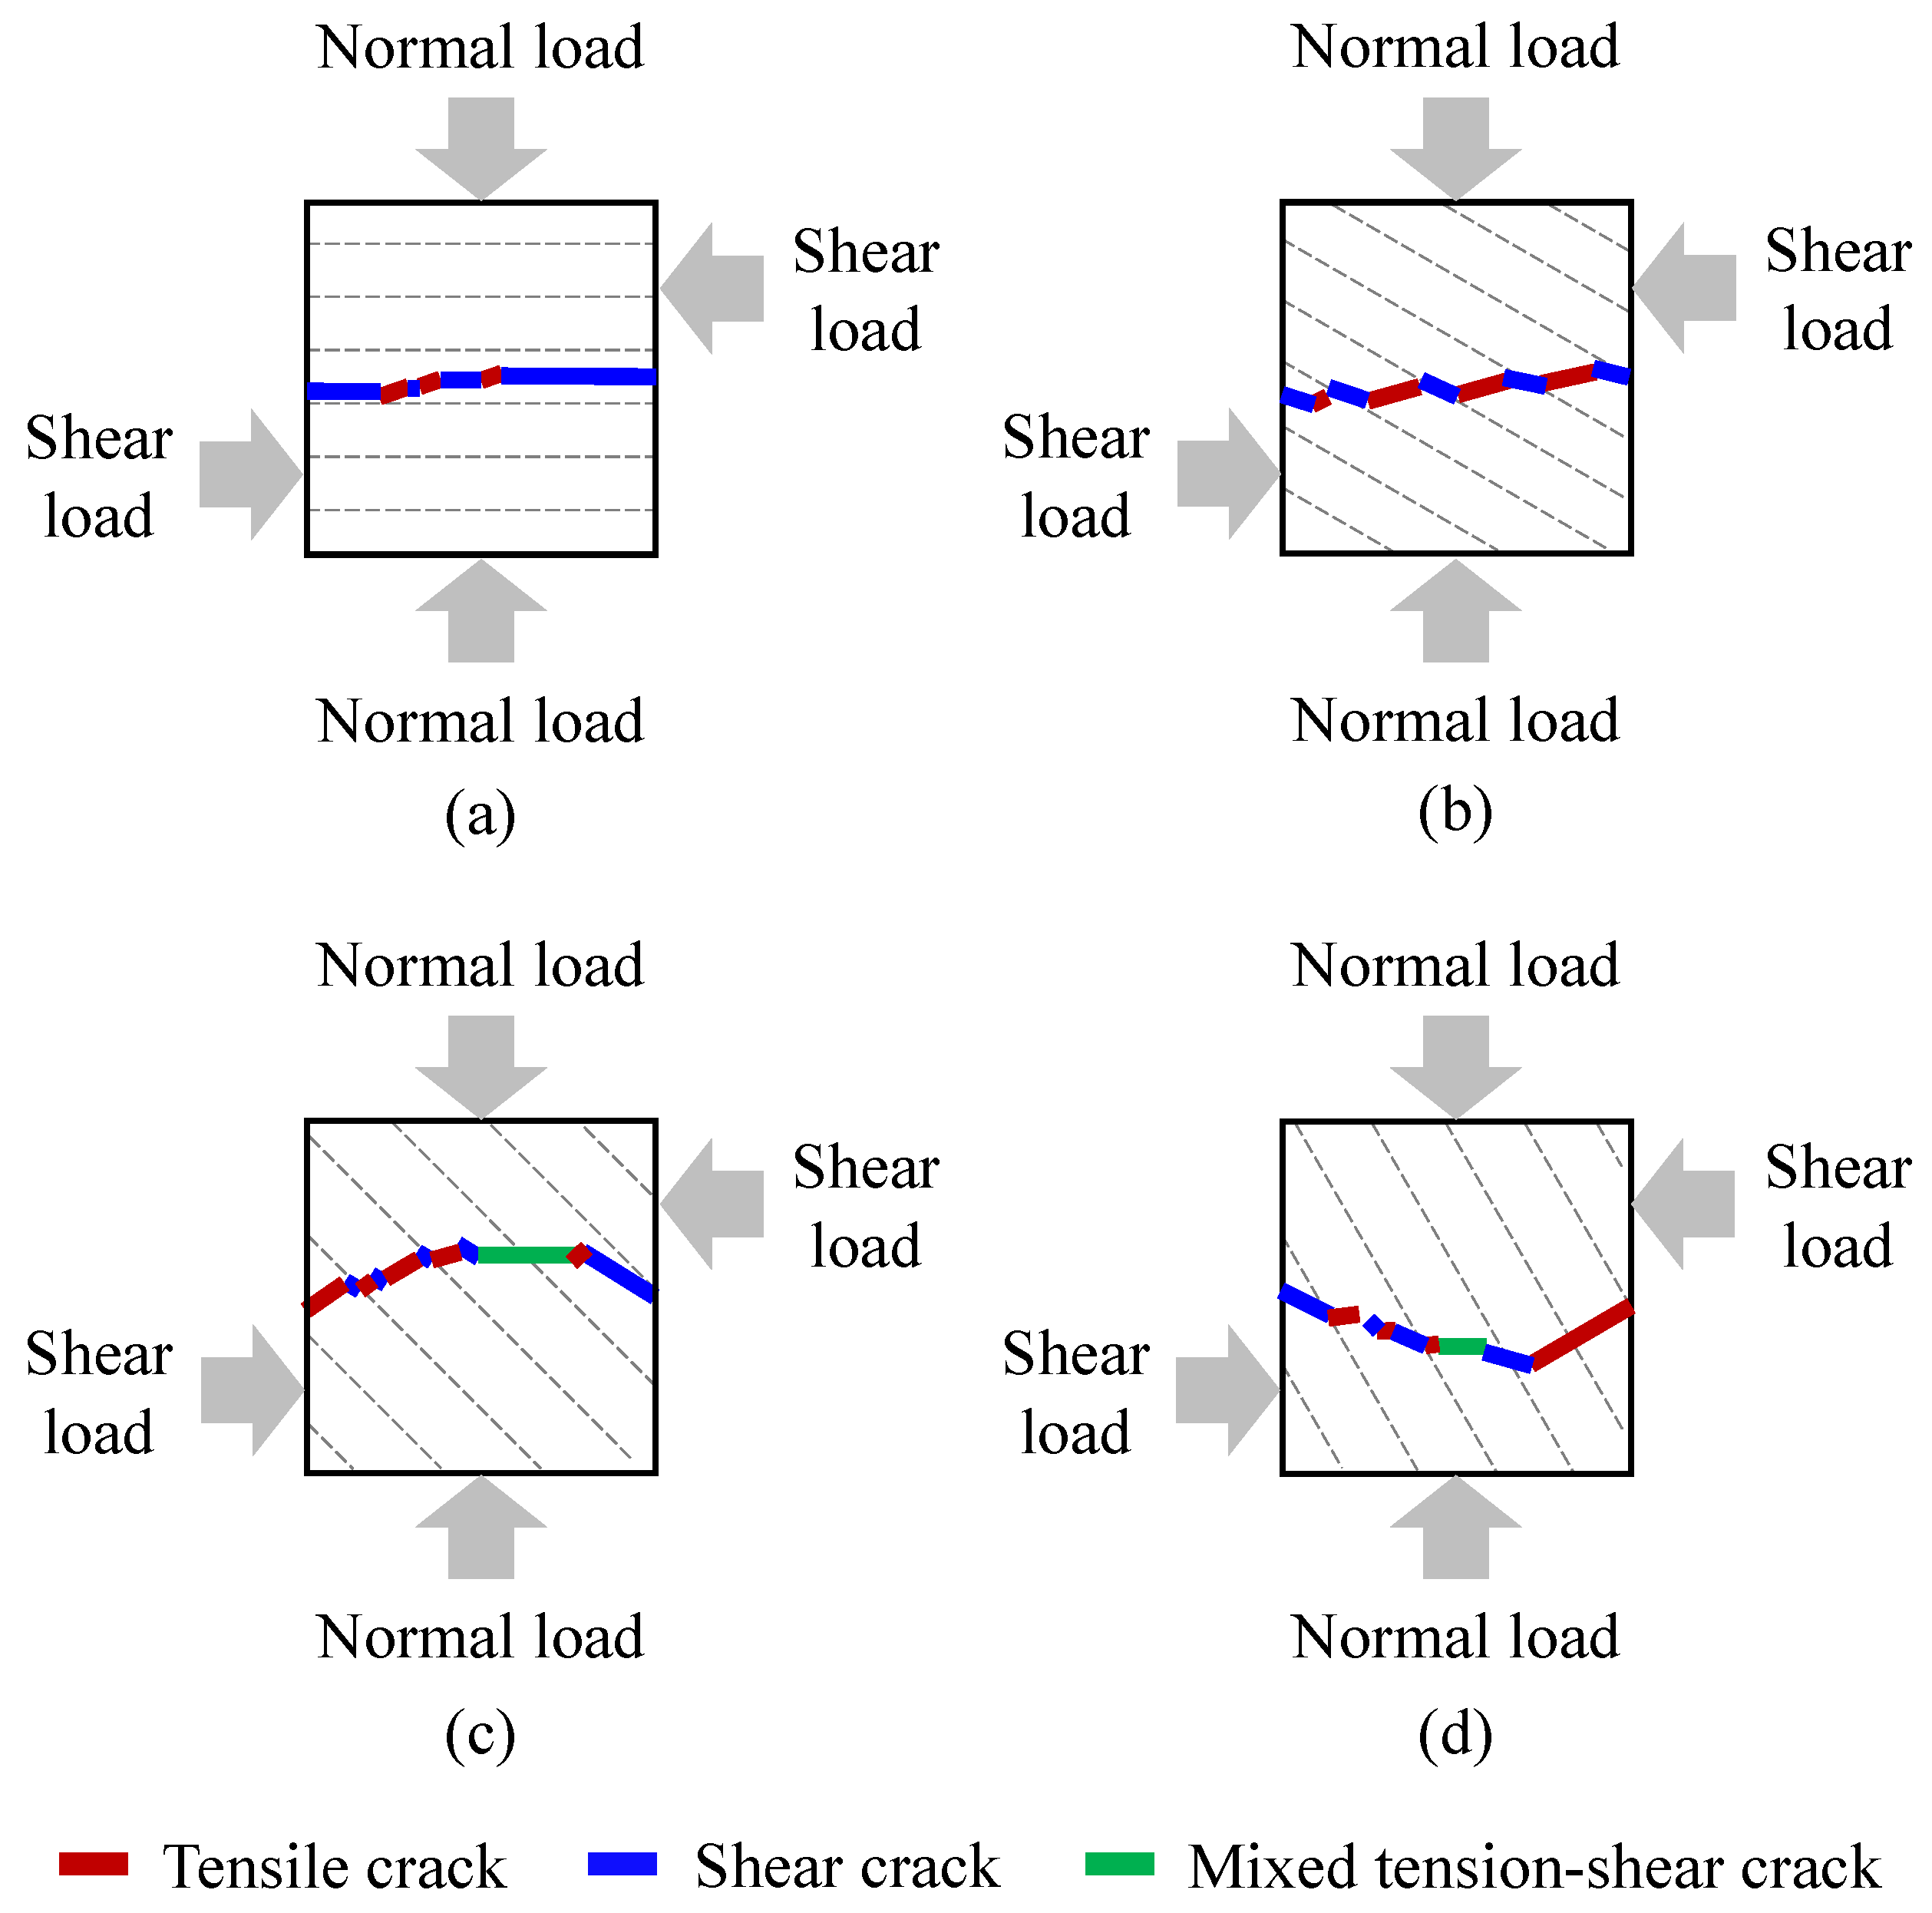
Figure 10.
Scanned and calculated areas of the shear fracture surface: (a) scanned areas; (b) calculated areas.
Figure 10.
Scanned and calculated areas of the shear fracture surface: (a) scanned areas; (b) calculated areas.
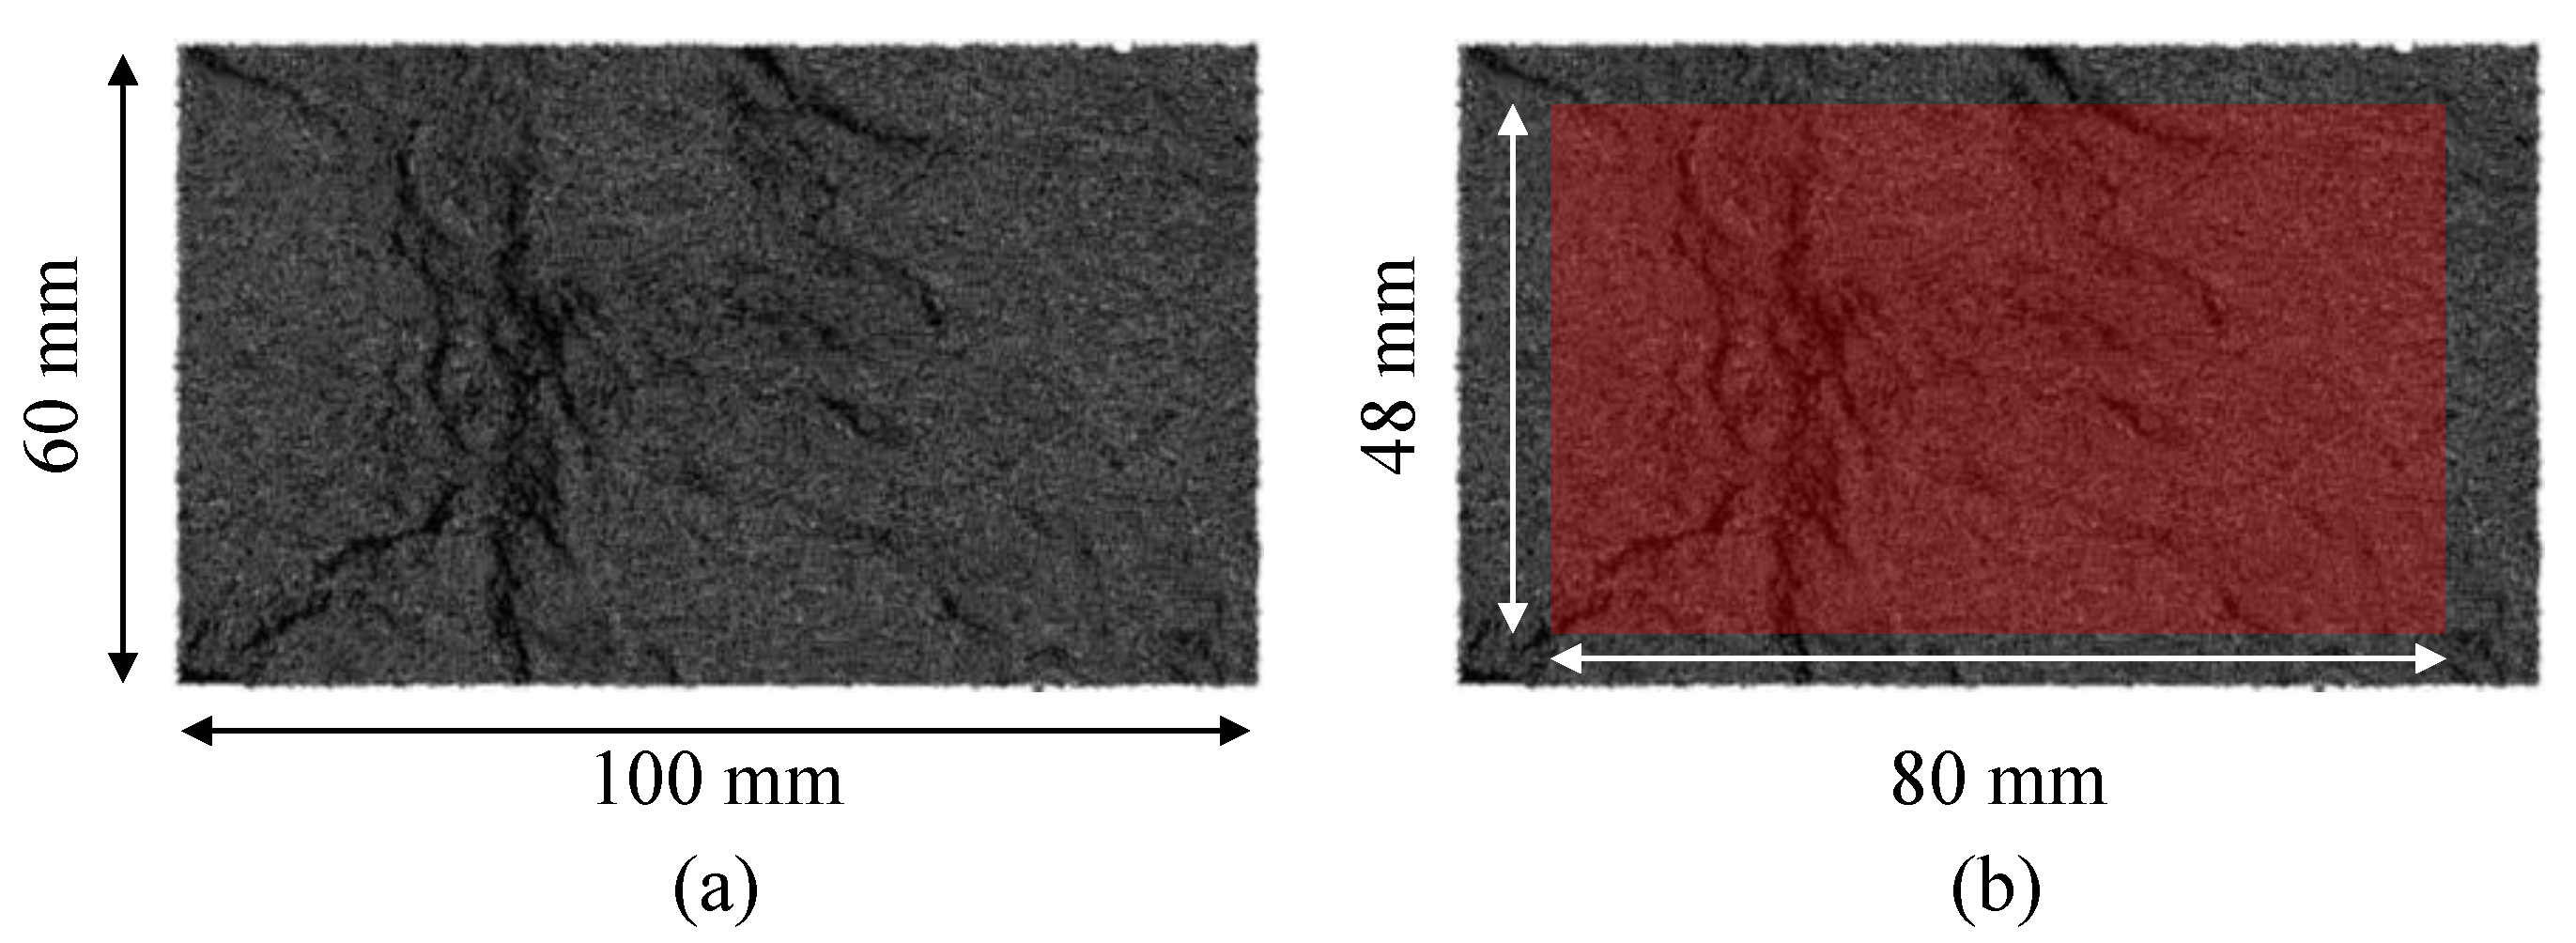
Figure 11.
Fractal dimension of the shear fracture surface morphology for the upper and lower shear fracture planes.
Figure 11.
Fractal dimension of the shear fracture surface morphology for the upper and lower shear fracture planes.

Figure 12.
Peak shear displacement, peak shear strength, and shear stiffness of shale samples with different bedding angles.
Figure 12.
Peak shear displacement, peak shear strength, and shear stiffness of shale samples with different bedding angles.
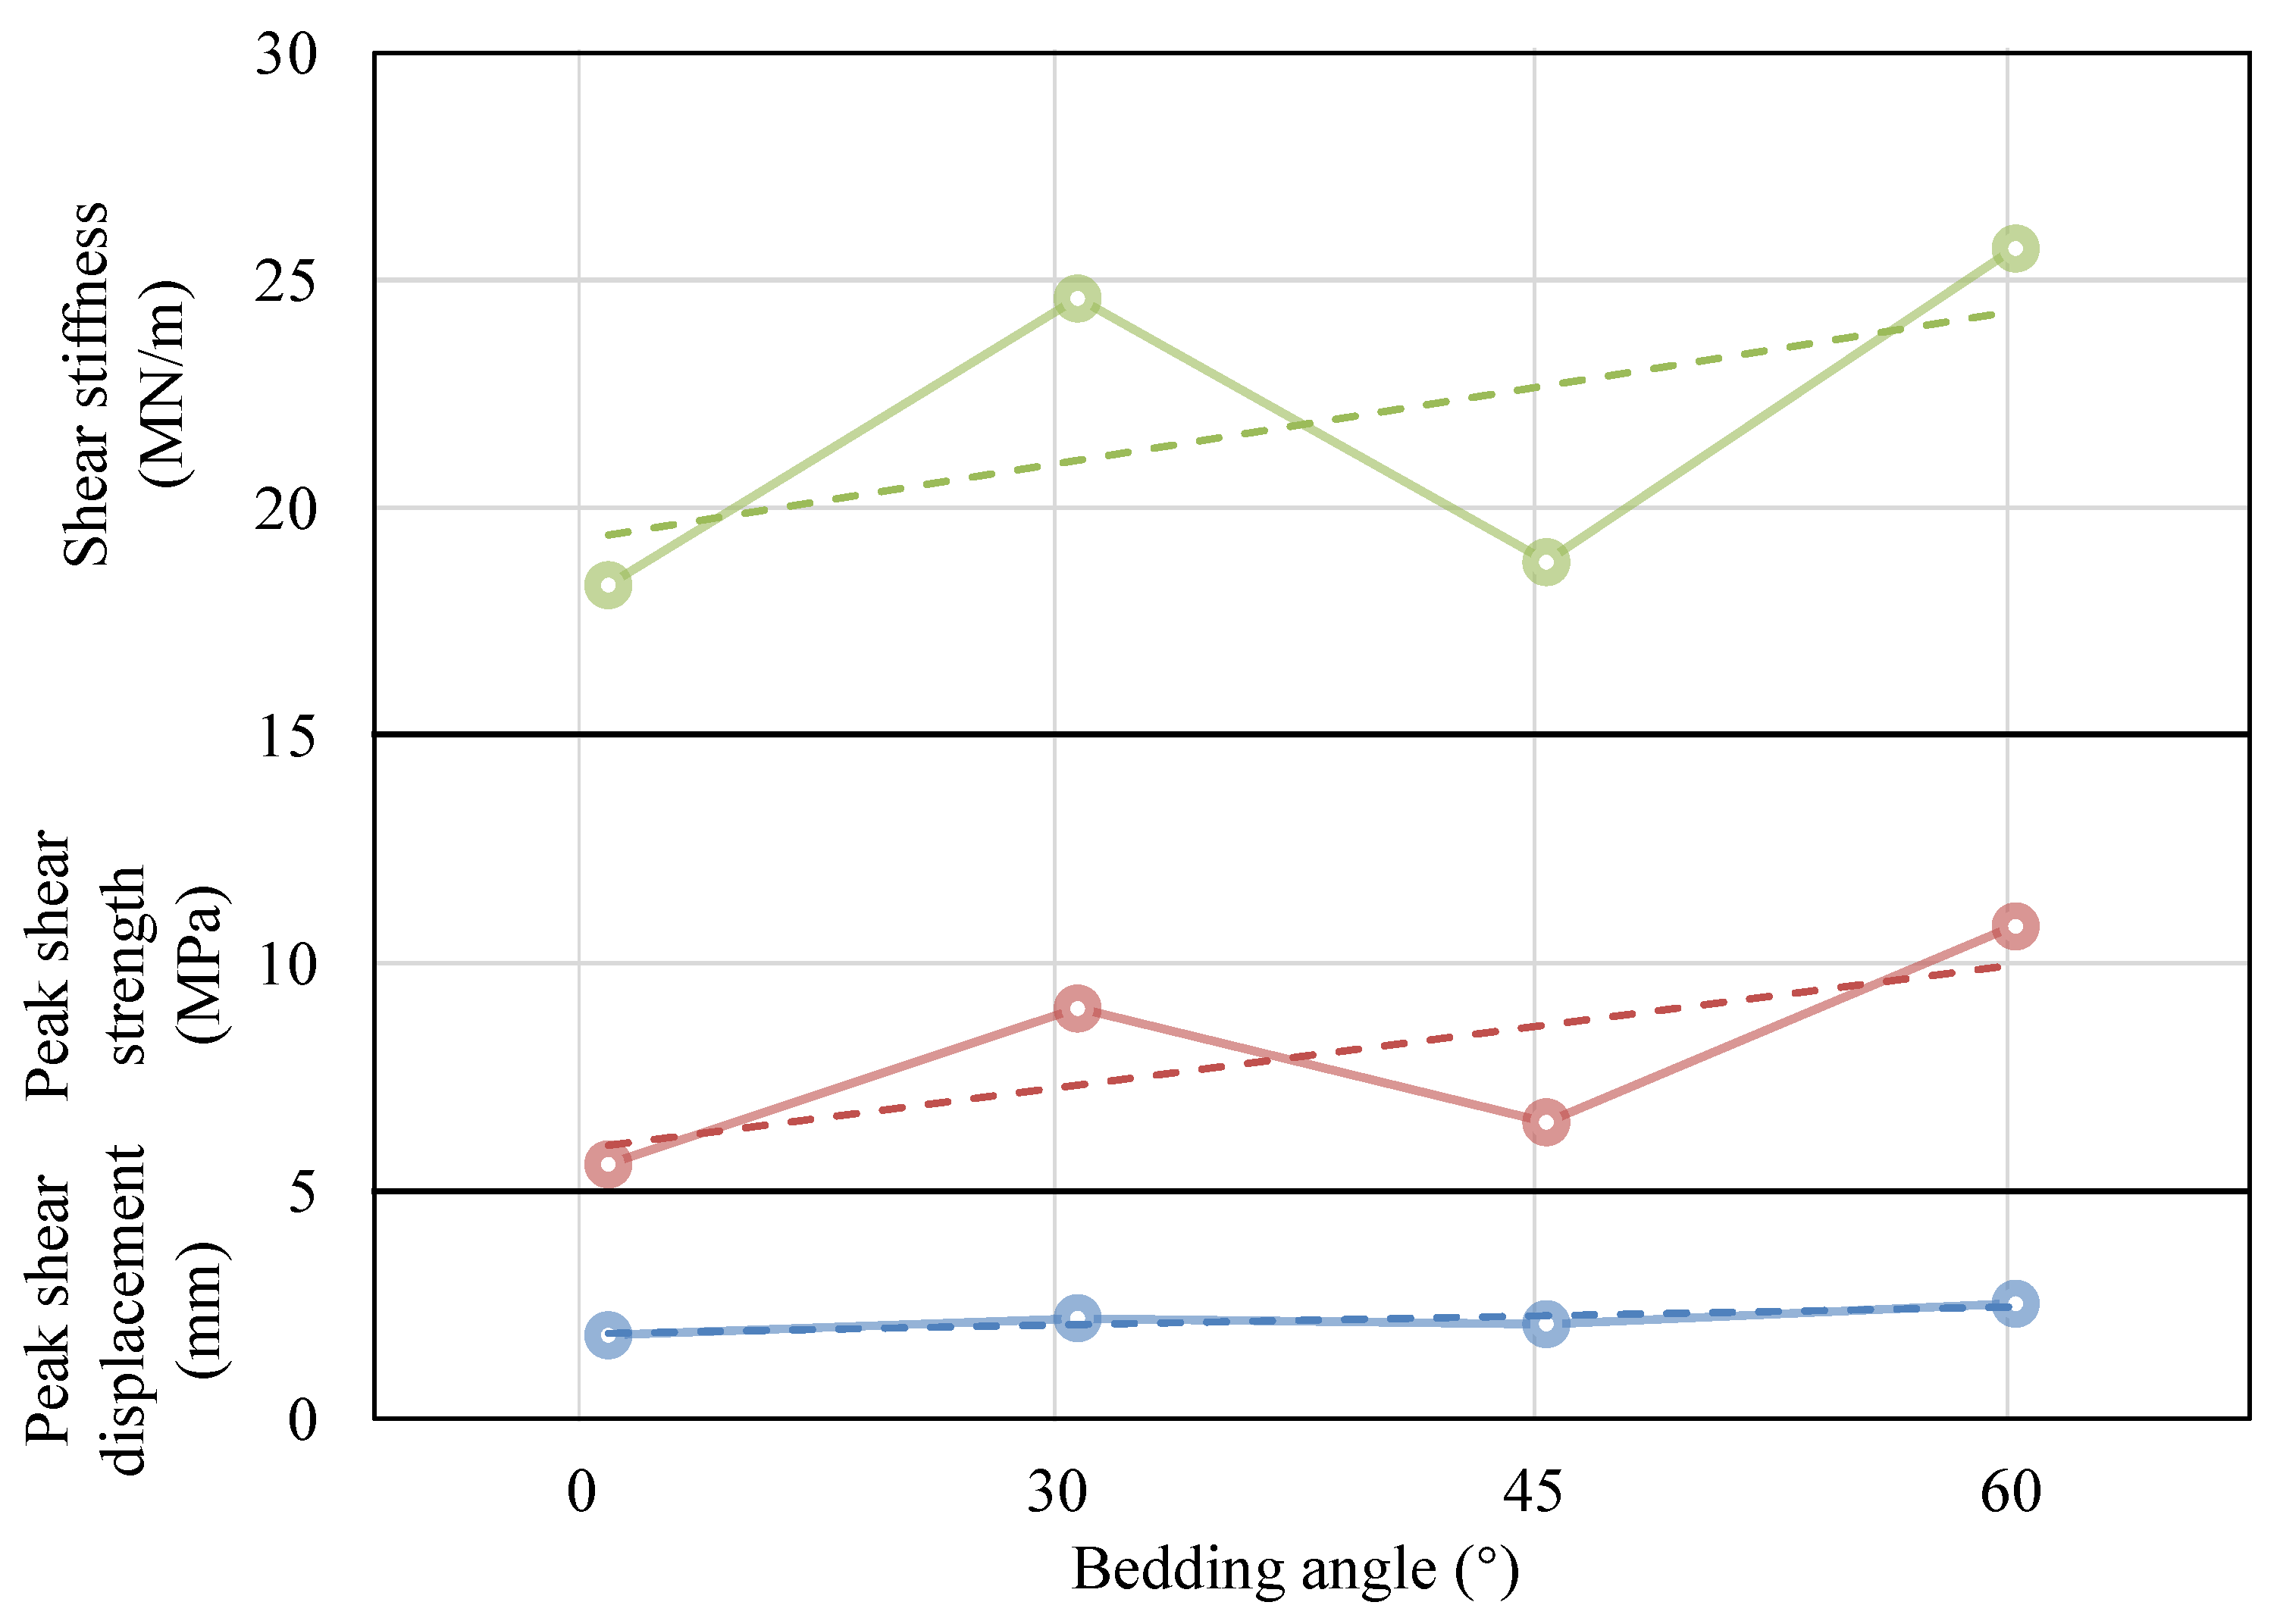
Figure 13.
Peak shear strength of shale samples with different bedding angles under different shear strain rates.
Figure 13.
Peak shear strength of shale samples with different bedding angles under different shear strain rates.

Figure 14.
Diagram of stress state around shear plane during the direct shear test (σn: normal stress; τ: shear stress; σ1: maximum principal stress; σ3: minimum principal stress; α: angle between maximum principal stress and normal stress).
Figure 14.
Diagram of stress state around shear plane during the direct shear test (σn: normal stress; τ: shear stress; σ1: maximum principal stress; σ3: minimum principal stress; α: angle between maximum principal stress and normal stress).
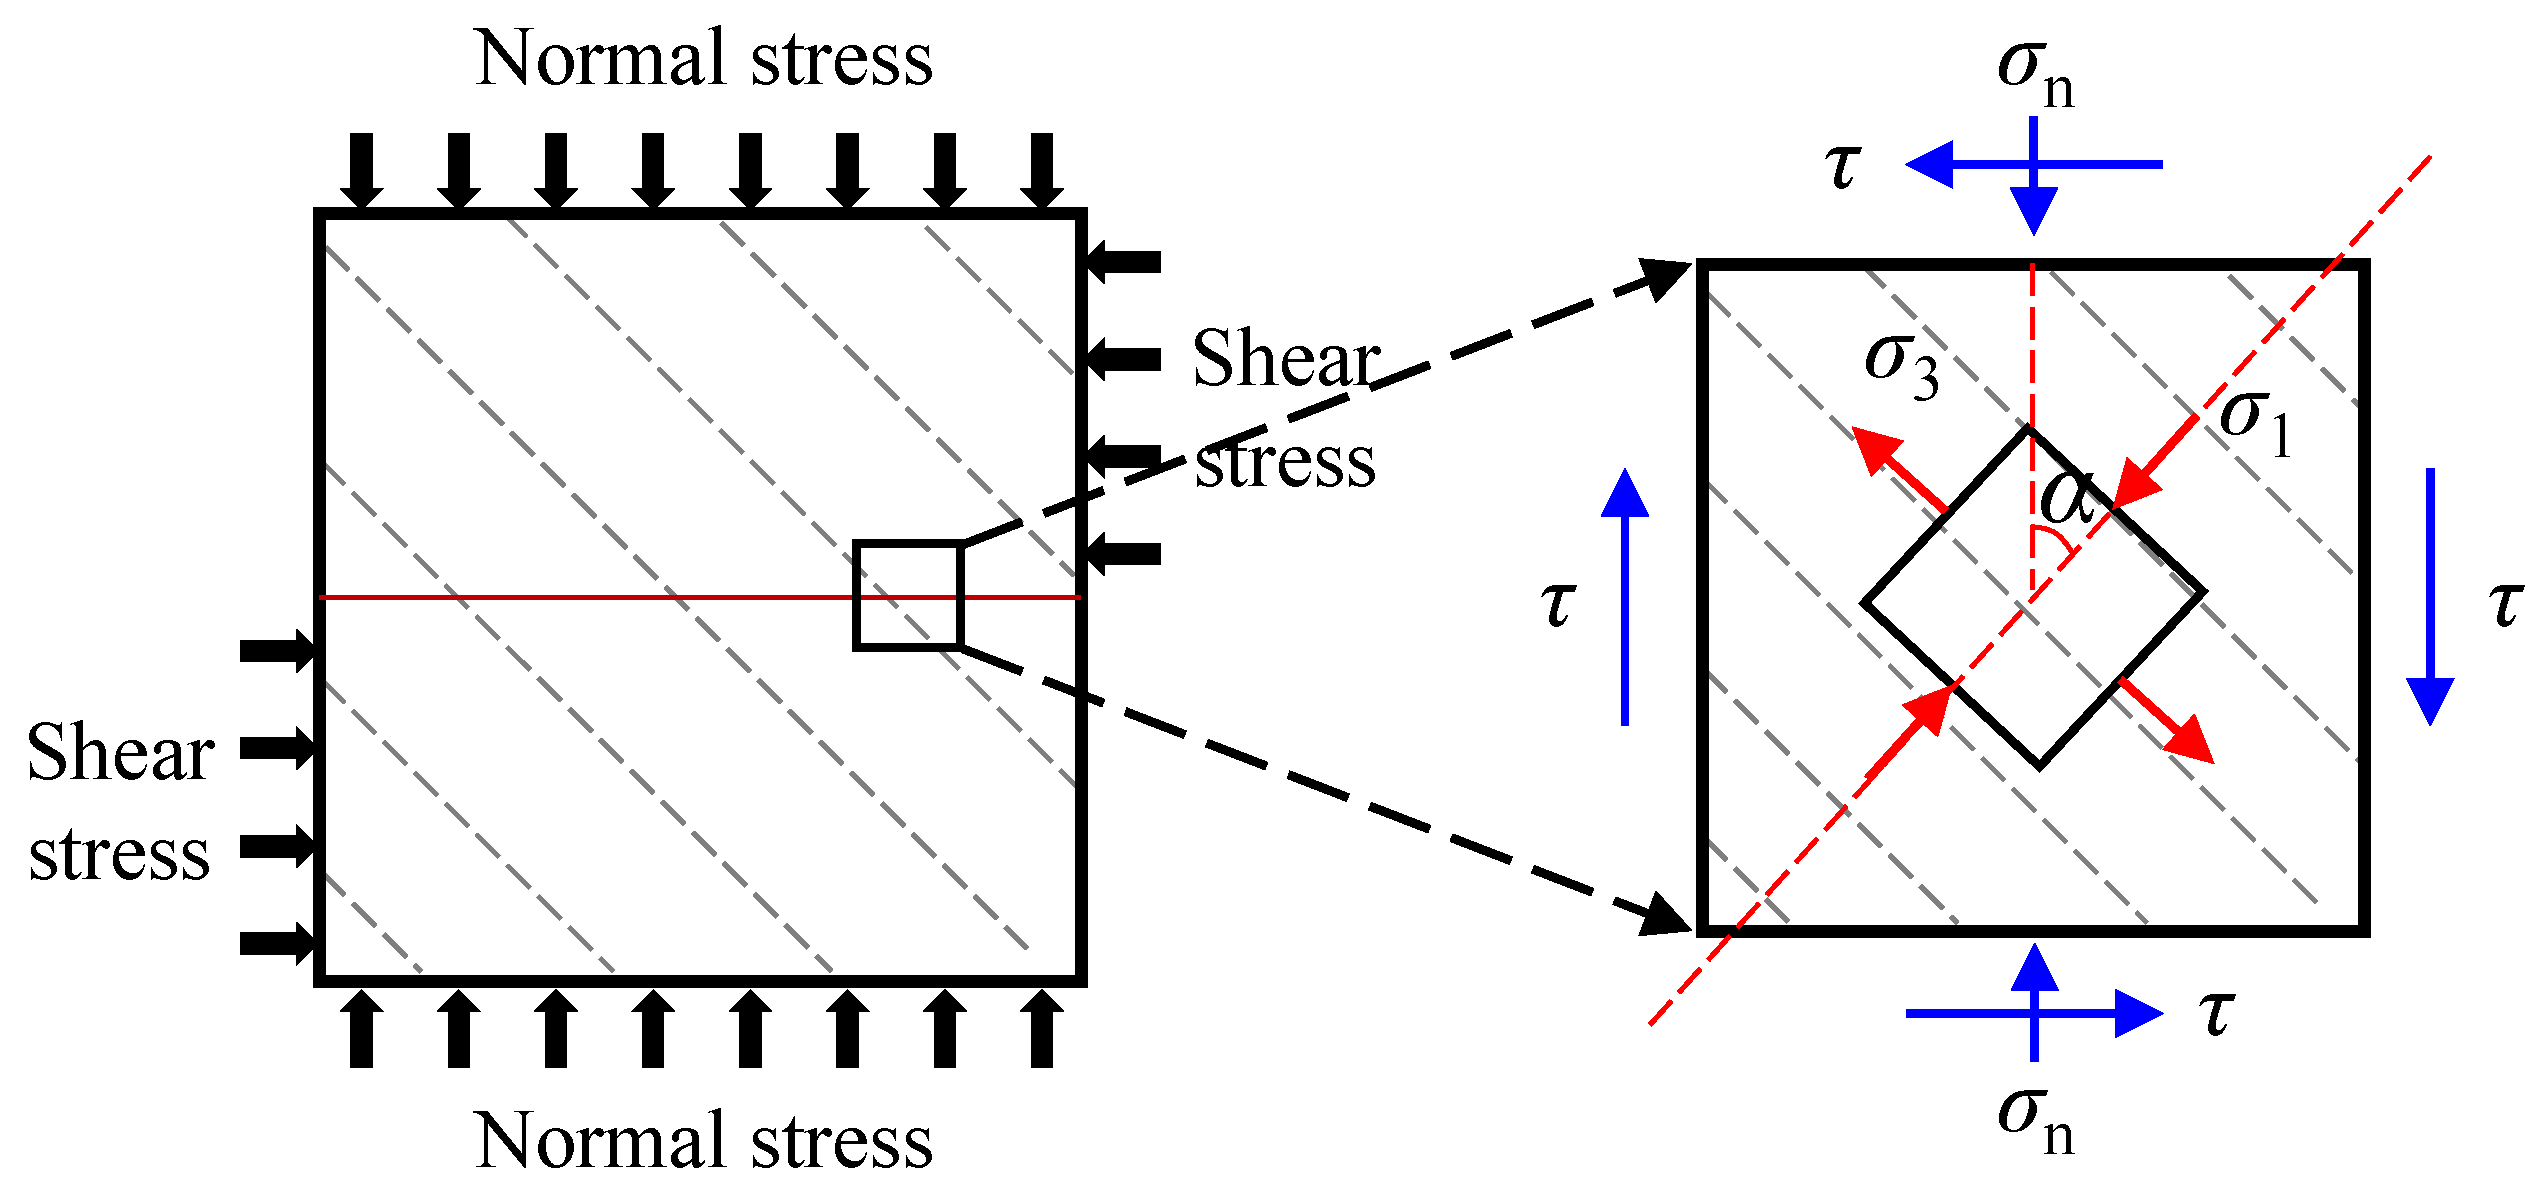
Figure 15.
Stress state around shear plane and cracks in shear fracture zones for shale samples with bedding angles of (a) 0°, (b) 30°, (c) 45°, and (d) 60°.
Figure 15.
Stress state around shear plane and cracks in shear fracture zones for shale samples with bedding angles of (a) 0°, (b) 30°, (c) 45°, and (d) 60°.

Figure 16.
Fractal dimension of the shear fracture surface morphology in different experiments from this work and [20].
Figure 16.
Fractal dimension of the shear fracture surface morphology in different experiments from this work and [20].

Figure 17.
Peak shear strength of shale samples with different bedding angles in different experiments from this work and [20,22,33].

Figure 18.
Diagram of stress states around shear plane for different shear modes.

Table 1.
Loading conditions of shale samples.
| Bedding Angle (°) | Normal Loading Condition | Normal Loading Rate (N/s) | Normal Stress (MPa) | Shear Loading Condition | Shear Loading Rate (mm/s) | Shear Strain Rate (/s) |
|---|---|---|---|---|---|---|
| 0, 30, 45, 60 | Constant normal load (CNL) | 50 | 1 | Constant shear rate (CSR) | 0.01 | 0.0001 |
Table 2.
Peak shear strength of shale samples under the normal stress of 1 MPa (σn: normal stress; τp: shear stress).
Table 2.
Peak shear strength of shale samples under the normal stress of 1 MPa (σn: normal stress; τp: shear stress).
| Bedding Angle (°) | Peak Shear Strength Formula | Normal Stress (MPa) | Calculated Peak Shear Strength (MPa) | Reference |
|---|---|---|---|---|
| 0 | τp = 0.648·σn + 19.488 | 1 | 20.136 | [20] |
| 30 | τp = 0.723·σn + 22.896 | 23.619 | ||
| 60 | τp = 0.595·σn + 31.165 | 31.760 | ||
| 90 | τp = 0.512·σn + 31.151 | 31.663 | ||
| 0 | τp = σn·tan (22.538°) + 12.114 | 12.529 | [33] | |
| 30 | τp = σn·tan (20.606°) + 12.820 | 13.196 | ||
| 45 | τp = σn·tan (26.565°) + 10.489 | 10.989 | ||
| 60 | τp = σn·tan (22.782°) + 17.393 | 17.813 |
Table 3.
Peak shear strength of shale samples with different bedding angles.
| Sample Shape/ Sample Size (mm) | Shear Rate (mm/s)/ Shear Strain Rate (/s) | Normal Stress (MPa) | Bedding Angle (°) | Reference | |||
|---|---|---|---|---|---|---|---|
| 0 | 30 | 45 | 60 | ||||
| Peak Shear Strength (MPa) | |||||||
| Cubic/ Length: 50 | 0.0003/ 6 × 10⁻⁶ | 1 | 20.14 | 23.62 | -- | 31.76 | [20] |
| Cylinder/ Diameter: 50 | 0.002/ 4 × 10⁻⁵ | 12.53 | 13.20 | 10.99 | 17.81 | [33] | |
| Cubic/ Length: 100 | 0.01/ 1 × 10⁻⁴ | 5.59 | 9.01 | 6.51 | 10.83 | This paper | |
Disclaimer/Publisher’s Note: The statements, opinions and data contained in all publications are solely those of the individual author(s) and contributor(s) and not of MDPI and/or the editor(s). MDPI and/or the editor(s) disclaim responsibility for any injury to people or property resulting from any ideas, methods, instructions or products referred to in the content. |
© 2024 by the authors. Licensee MDPI, Basel, Switzerland. This article is an open access article distributed under the terms and conditions of the Creative Commons Attribution (CC BY) license (https://creativecommons.org/licenses/by/4.0/).
Share and Cite
MDPI and ACS Style
Zheng, B.; Qi, S.; Guo, S.; Liang, N.; Luo, G.; Zhang, X.; Lu, W.; Jin, C.; Li, Y.; Yu, X.; et al. Experimental Study of Direct Shear Properties of Anisotropic Reservoir Shale. Energies 2024, 17, 1977. https://doi.org/10.3390/en17081977
AMA Style
Zheng B, Qi S, Guo S, Liang N, Luo G, Zhang X, Lu W, Jin C, Li Y, Yu X, et al. Experimental Study of Direct Shear Properties of Anisotropic Reservoir Shale. Energies. 2024; 17(8):1977. https://doi.org/10.3390/en17081977
Chicago/Turabian StyleZheng, Bowen, Shengwen Qi, Songfeng Guo, Ning Liang, Guangming Luo, Xiaohui Zhang, Wei Lu, Chao Jin, Yongchao Li, Xin Yu, and et al. 2024. "Experimental Study of Direct Shear Properties of Anisotropic Reservoir Shale" Energies 17, no. 8: 1977. https://doi.org/10.3390/en17081977
Note that from the first issue of 2016, this journal uses article numbers instead of page numbers. See further details here.