
Investigation on Pollution-Induced Flashovers of In-Service Insulators in Ethiopian Power Transmission Lines

1
Faculty of Electrical and Computer Engineering, Bahir Dar Institute of Technology, Bahir Dar University, Bahir Dar P.O. Box 26, Ethiopia
2
School of Electrical and Computer Engineering, Addis Ababa Institute of Technology, Addis Ababa University, Addis Ababa P.O. Box 385, Ethiopia
3
Department of Electrical Engineering, Chalmers University of Technology, 412 96 Gothenburg, Sweden
*
Author to whom correspondence should be addressed.
Energies 2024, 17(9), 2007; https://doi.org/10.3390/en17092007
Submission received: 10 February 2024
/
Revised: 14 March 2024
/
Accepted: 21 March 2024
/
Published: 24 April 2024
(This article belongs to the Special Issue Electrical Engineering, High Voltage and Insulation Technology)
Abstract
:Power transmission lines in Ethiopia are experiencing an alarmingly high frequency of unexplained outages triggered by environmental factors, which significantly undermine the reliability of the country’s power system. This paper presents investigations aiming to identify those among the unexplained fault records that have been caused by pollution induced flashovers. An identification method is developed, which associates the contextual fault features, such as information about the characteristics of the fault, fault location, and time of day, as well as month of its occurrence with local meteorological/climatic and environmental conditions. A total number of 4231 unexplained faults, recorded between 2015 and 2022, were analyzed. Among them, 1045 faults (24.7%) were identified as being most likely caused by pollution induced flashovers. The entire network suffered from more than 130 pollution-induced flashovers annually with a frequency of about 0.8 faults/100 km/year. The fault frequency strongly differed among the grid regions, being highest in the Northeast and lowest in the Southwest region. Moreover, the performed analyses also concentrated on the evaluation of the pollution performance of various insulator types employed in the network. The results indicate that porcelain insulators have the highest pollution-induced flashover intensity of 1.47 faults/year/1000 units, followed by silicone rubber polymeric composite insulators and glass insulators with the respective intensities of 1.21 and 0.83 faults/year/1000 units. These results indicate that despite the high expectations towards the pollution performance of silicone rubber polymeric insulators, their use in the Ethiopian climatic and environmental conditions appears to be unsatisfactory.
1. Introduction
Overhead transmission lines of Ethiopian national grid are subject to a variety of environmental factors that influence their performance, including lightning, pollution, and various climatic conditions. Inadequate design and maintenance in response to environmental influences can lead to a deterioration in power system reliability, resulting in significant financial consequences [1,2]. Therefore, conducting an in-depth analysis of transmission line faults is crucial, as it aids in identifying the primary causes of line outages and devising preventive measures.
The 132, 230, and 400 kV HVAC lines owned and managed by the Ethiopian Electric Power company (EEP) spans a total length of 16,875 km, as of 2022 [3]. The insulation of these lines is based on standard porcelain and glass cap-and-pin insulators strings as well as on long-rod polymeric composite insulators made of silicone rubber. A high number of outages caused by external factors have occurred on these lines, mainly in the form of single line-to-ground faults.
Our previous study [4] has shown that out of the total of 8891 unplanned interruptions that occurred between 2015 and 2022, 4231 (47%) were of unexplained origin. This fault intensity significantly compromises the reliability of the system. Each such incident results in the frequent operation of circuit breakers and induces transients into the network, leading to the premature wear of the system components, power delivery stops, and resulting financial losses [5,6,7,8]. This situation calls for the need to identify the root causes of these faults and for implementing suitable corrective measures.
The EEP transmission network covers various climatic regions and is thus subject to varying environmental conditions, which are thought to be the main factors affecting the line performance. These include various rainfall patterns, lightning intensity, pollution accretion severity, fire occurrence, and others. Lines that are adequately designed for a specific region may not fit well with the other region conditions, where different fault mechanisms dominate [1,9,10]. The pollution type and its severity also vary across the regions. Unfortunately, the understanding and information about pollution-induced faults on insulators is very limited within EEP. It is not listed in the EEP transmission line fault-cause categories and not considered as a possible cause for outages occurring in its transmission systems. Until now, EEP has not had any regular procedure for monitoring pollution severity that could provide information for proper selection and testing of line insulation. Thus, the site pollution severity is often not adequately considered, which consequently results in the inappropriate choice of insulator type and size and yields poor pollution flashover performance of insulators in service [1,11,12].
This work focuses on detailed analyses of the unexplained faults to identify pollution-induced flashovers (PFO) and investigate their geographical and temporal distribution in the Ethiopian power grid. The aim is to identify the regions (location) which are the hotspots for this type of outage, as well as to find the lines that suffer from them the most. Moreover, this work attempts to evaluate the performance of various insulator types installed in the network in terms of their trip-out intensity. This knowledge will further impact the EEP’s policy in selection and dimensioning of outdoor insulation for new transmission lines. Additionally, it will enable the establishment of suitable monitoring, maintenance, and inspection procedures for existing lines [12,13,14,15].
2. Method for Identifying Pollution Induced Line Faults
It is not always straightforward to identify line faults resulting from pollution flashovers. However, specific contextual characteristic patterns exist to aid in their identification [2,13,14,16,17]. To identify them from the records of unexplained faults, the verification procedure used in this work focused on identifying patterns that could indicate or agree with the recognized characteristic features of pollution-induced faults. These include contextual fault details such as the time and season of occurrence and geographical location of the fault, in addition to climatic and environmental conditions of the affected region [2,9,15,16,17]. Moreover, information extracted from the voltage and current records during the fault, like the fault duration, success of reclosure events, and operational history, can provide valuable insights [2,15,16,17,18].
2.1. Characteristic Patterns and Conditions of Pollution Flashovers
2.1.1. Time-of-Day of Fault Occurrence
For the fault data to align with those expected for pre-deposited pollution and wetting-induced flashover (referred to as a type A pollution flashover process) [11], the fault incidents should be predominantly concentrated between the hours of midnight and the early morning, extending up to 08:00, coinciding with the likelihood of light rain, dew, or mist formation [2,5,9,19]. As nighttime humidity rises, instances of pollution flashovers become more frequent, reaching their highest intensity just before sunrise, around 06:00. Notably, such faults are virtually absent during daytime hours [2,5,9,20]. On the other hand, bird streamer-related flashovers, a particular case of type B pollution (instantaneous pollution flashover) [11], typically exhibit two peaks linked to the bird’s digestive cycle. One peak occurs early in the evening, around 22:00, while the other is observed in the morning at 06:00 [2,6,19]. Studies conducted in Florida, Estonia, and South Africa have reported similar patterns of these faults [2,7,13,19].
2.1.2. Seasonal Patterns of Fault Occurrence
Regarding fault occurrences in connection with the time of year, the majority of pollution-induced outages happen during hot and drier periods, attributed to condensation and moisture absorption during cooler nights. Additionally, these outages are prevalent during seasonal transitions when fog and light rains occur after the hot and dry season [1,5,11,12]. Bird streamer faults exhibit a seasonal pattern linked to the presence of birds or their feeding habits, with their frequency tending to rise during spring [2,6,13,19].
2.1.3. Geographical Location of Faults
The geographical distribution of faults can also aid in determining their underlying causes [14,15,18]. In this context, pollution-induced faults are expected to occur within regions having sources of salty dust from desert and semi-arid areas, as well as pollution from industrial and intensive agricultural activities, busy roadways, and proximity to coastal areas [1,5,11,12,20]. Moreover, in locations supporting birdlife with ample water and food resources, bird streamer faults may also take place [6,7,19,21,22]. Therefore, knowing the geographic position of a fault is instrumental in determining its cause [1,2,11,14].
2.1.4. Climatic and Meteorological Conditions
Several research investigations have indicated the influence of meteorological factors like temperature, rainfall, wind direction and speed, and relative humidity in facilitating the accumulation of pollutants on the surface of insulators and their wetting [1,2,11,13,14]. In this regard, main rainy/wet seasons are characterized by the highest number of days in a month with heavy precipitation (greater than 10 mm). Frequent heavy rainfall washes insulators and reduces the chance of pollution accumulation. In contrast, periods with light rains (rainfall between 1 mm and 10 mm) can contribute to wetting the pollution layer and facilitate flashovers. During dry seasons with a longer number of consecutive days without rain (more than 5–10 days without rain), the accretion of pollutants on the surface of the insulator is high [1,5,13,23].
Moreover, warm day-time temperatures greater than 5 °C are assumed to be favorable for pollution accumulation. Strong winds also contribute to the uneven accumulation of pollutants on insulator surfaces. Elevated humidity levels and/or morning dew, coupled with strong sea winds, establish optimal conditions for rapid accumulation of pollution layers and increase the flashover risk [1,5,13,23].
This study involved determining the geographic coordinates of every transmission line tower across the entire network of Ethiopia. Using ArcGIS 10.5 software, meteorological parameters were assigned to them, and an average of these parameters for all the towers was thereafter computed to denote the meteorological conditions along the entire line under consideration. For very long lines, the average was estimated for shorter sections between substations.
2.1.5. Contextual Characteristics of Line Faults
Voltage and current magnitudes during the fault, the involved phases, duration of the fault, success of reclosure, and other protection data help to suggest the probable reasons behind the fault’s origin [6,7,16,17,24]. The fault features extracted from the fault voltage and current waveforms are easily affected by the pre-fault operating state of the system, and there is no direct link between their characteristics and external causes. On the other hand, other contextual fault characteristics, such as time stamps (season, day/night, month, hour), geographic location, meteorological and environmental data, and other information related to service experience are directly relevant to various external line-fault causes such as lightning, pollution, fire, wind, etc. [16,17]. The pollution flashover fault should usually appear as a transient single line to ground fault with a high rate of successful reclosure. Moreover, it should rather occur under normal operating conditions with steady-state voltages and currents, which ensures that it is not preceded by any lightning or switching overvoltage event or by a drop/distortion of the voltage or increase in the current. The faulted phase voltage should not immediately drop to zero after the fault starts, and the fault current should be low, as the fault resistance is usually high (not solid/metallic short circuiting) [6,7,24].
This set of characteristic patterns and other conditions described above form the basis for classification of grid region and formulating the criteria for assigning the reason of unexplained faults to the pollution flashover category.
2.2. Classification of Grid Regions
The interaction between the meteorological and environmental conditions of Ethiopia, in terms of pollution accumulation, wetting, and natural cleaning ability is used to derive a classification of grid regions. Identifying the season in each grid region that exhibit similar patterns in accumulating a high level of pollution on the insulator surface, conducive for critical wetting and favorable for self-cleaning and an overall reduction in pollution accumulation, is the base for the classification. This facilitates the classification of the country’s territory into distinct groups of grid regions and offers a convenient structure for examination of unexplained faults in more detail. Accordingly, the grid management regions of the EEP are classified into four grid region groups. The North, Northwest, Addis Ababa, and Central grid regions of EEP are classified as Group 1 (G1), the West and Southwest regions are classified as Group 2 (G2), the South region is classified as Group 3 (G3), and the East and Northeast regions are classified as Group 4 (G4). Figure 1 shows the geographical location of these grid regions with the indicated annual average rainfall of the Ethiopian territory.
The climatic and meteorological information do not provide any information on the pollution severity. They can, however, indicate when the weather is favorable for the accumulation of pollutants on insulator strings and critical for wetting of the pollutants [1,13]. Given that Ethiopia’s climate is predominantly tropical, its weather conditions exhibit distinct wet and dry seasons, each characterized by varying levels of rainfall and temperature patterns [25,26,27]. Thus, to have an insight into the meteorological conditions representing the different Groups, four representative sites are considered to evaluate the weather and environmental conditions that are suitable for the appearance of pollution flashovers. It can be assumed that different areas in each Group encounter comparable regional meteorological/climatic conditions as their respective representatives [1]. Figure 2 depicts the variations in specific meteorological conditions for Group 1 (Addis Ababa), Group 2 (Assosa), Group 3 (Gode) and Group 4 (Semera). A detail description of climatic and meteorological information in Ethiopia and respective analyses of the conditions for pollution accretion in each grid region, including their estimated site pollution severity class, can be found in our previous works [4,10].
The descriptions of the environmental and meteorological conditions of each group are as follows:
Group 1 comprises the North, Northwest, Addis Ababa, and Central grid regions of EEP. They cover a large geographic area, and the major sources of pollution in these regions come from highways, construction sites, transportation, natural dust from local soils, and industrial as well as agricultural activities. These regions are characterized as having a mixture of desert, industrial, and agricultural environments with mainly type A pollution, and their estimated site pollution severity (SPS) class is medium to heavy, according to IEC 60815-1:2008 [10,11].
The meteorological conditions for Group 1 areas, as shown in Figure 2a, are predominantly dry from October to February of the next year, while the period from March to May is a short rainy season. The average monthly rainfall is about 6.4 mm during these periods and pollution accumulation on insulators is expected to be relatively high. Periods with less than 20 mm rain begin at the end of March and continue to the end of May, and periods with less than 10 mm rain begin at the end of September and continue to the end of March the following year. Average rainfall from June to September (the main rainy season) is about 170 mm. Hence, the pollution layer accumulated on insulator surfaces is washed away during this period. On average, there are 20 rainy days from June to September in this group. The monthly average relative humidity in this group is above 55% throughout the year and above 77% in July and August. The monthly average maximum temperature within the group during the low-rain and hot season is about 27 °C and decreases to 24 °C in the other seasons. The prevailing wind direction during the dry period is from the east and the average wind speed of the group ranges from 1.7 to 2.7 m/s.
Thus, for regions in this group, the atmospheric accumulation and wetting of pollution on the insulator surface, and consequently the flashover risk, are expected to be significantly higher from October to February of the next year and from March to May, and lower between June and September.
Group 2 comprises the Southwest and West grid region of EEP, stretching from the southwest through to the west of Ethiopia. The major sources of pollution in these regions are from agricultural and mining activities and are mainly of type A with the estimated site pollution severity (SPS) class of light to medium [10,11].
As shown in Figure 2b, the period spanning from October to February of the next year is mainly dry. The average monthly rainfall during this period is 6.7 mm. Moreover, periods with less than 20 mm rain are in March and November, whereas periods with less than 10 mm rain begin in December and continue to the end of February. During the primary rainy season from March to September, the monthly average rainfall reaches 200 mm and secures natural washing of insulator surfaces.
The group has an average relative humidity of above 65% from May to October and the monthly average maximum temperature in the low rain and hot season is less than 34 °C and decreases to 31 °C in the other periods. The dominant wind direction during the dry period is southeast with an average wind speed from 1.8 to 2.3 m/s. Therefore, for regions in this group, the climatic and meteorological conditions from October to February of the next year allow for the accumulation and wetting of pollution on insulator surfaces. Thus, the flashover risk is expected to be significantly higher during this period than from March to September.
Group 3 comprises the South grid region of EEP and covers the south and southeast part of Ethiopia. The major sources of pollution are mainly dust from semi-arid areas, highways, construction sites, mining, industrial, and agricultural sources. The regions are characterized as having mixture of agricultural and industrial types of environments [10], with type A pollution accumulation and have an estimated site pollution severity (SPS) class of medium to heavy [11].
As shown in Figure 2c, the main dry season in regions of Group 3 is from June to September and from December to February of the next year, while from October to November there is a short rainfall season. During the former periods, the average monthly rainfall is low, respectively, 17 mm and less than 10 mm. During March to May (the main rainy season), the weather is moist, and the average rainy days and average monthly rainfall reach 10 days and 44 mm. The natural washing of insulators by rain increases in this period.
Regions in this group have an average relative humidity of above 50% from April to October, which can humidify the pollution on the insulators. The monthly average maximum temperature of the region in the main dry and short rainfall season is about 31 °C and increases to 33.5 °C in the main rainy season. The prevailing wind direction during the dry period is from the southeast, with the average wind speed of the region ranging from 2 to 3.5 m/s. Consequently, for regions in this group, the pollution flashover risk is expected to be significantly higher from June to September and October to February of the next year and lower from March to May.
Group 4 includes the East and Northeast regions of EEP covering the eastern part of the country. They receive very little or no rainfall at any time of the year [24,25,26]. The major sources of pollution in these regions are from highway transportation, salty soils, sandy dust storms from the desert, and direct salt sprays originating from the coastal area, as well as from agricultural and mining activities. The regions are characterized by a mixture of desert, coastal, and agricultural types of environments with a combination of type A and type B pollutions [10]. The estimated site pollution severity (SPS) class in the regions is heavy to very heavy [11].
As shown in Figure 2d, the periods from October to February of the next year and from March to May are the main dry seasons. During these periods, the average monthly rainfall is low, around 27 mm. Moreover, less than 20 mm rain periods are during January and June, and less than 10 mm rain periods begin in November and December. During June to September (the main rainy season), the weather is moist, but the rainfall is usually light. Most of the rainy days are continuous drizzle or scattered rains, and the average monthly rainfall reaches 45 mm. Hence, the washing effect during this period is minimal.
This group has a low average relative humidity of 46% throughout the year, and it only exceeds 50% in the months of December and January. The monthly average maximum temperature of the group during the main dry season is less than 31 °C and increases to 34 °C in the other seasons. The dominant wind direction during the dry period is from the east, with the average speed ranging from 2.2 to 3.5 m/s.
Therefore, for regions in this group, the climatic and meteorological conditions occurring at any time of the year are considered as favorable for pollution accumulation and wetting, and the expected risk for flashovers seems to be high throughout the year. As some areas within the group might also encounter direct salt sprays originating from the Red Sea and the Gulf of Aden, there is a high likelihood of dew with salt content forming on insulator surfaces, and rapid pollution accumulation and increased flashover risk are characteristic of them.
2.3. Criteria for Evaluating Unexplained Fault Data
As indicated in [16,17], a high accuracy in classifying the root causes of transmission line faults can be attained by exclusively utilizing contextual fault features. Information about the characteristics of the fault, the time of day and month of the year the fault occurred, fault location, and the climatic/meteorological and environmental conditions (represented by the grid region Groups) are used to develop the criteria to classify the fault origin. It is believed that the criteria outlined in Table 1 below represent the necessary and sufficient conditions expected to be fulfilled by faults related to pollution-initiated flashovers.
The implementation of these criteria can best be demonstrated through the flowchart depicted in Figure 3. The criteria and the procedure described in the flowchart serve as a general guideline for evaluating the roots of unexplained faults. The first decision block checks whether an unexplained fault fulfils the characteristics criteria outlined in Section 2.1.5. If the unexplained fault does not satisfy this criterion, then this fault is not considered as pollution caused and categorized as “Not Consistent with PFO”. Otherwise, the process continues, and information on the fault location (Grid Region), month, and time of its appearance is extracted. The subsequent decision blocks in the flow chart use the criteria presented in Section 2.1 and Section 2.2 as well as in Table 1.
In the following steps, after assigning the right grid region group to the fault, it is tested for the month and time-of-the-day criteria. If the conditions are fulfilled, then the fault is categorized as “Consistent with PFO”. If only one of the criteria is fulfilled, then it becomes difficult to assign it as PFO because other possible environmentally induced causes of unexplained fault may also exhibit similar characteristics. So, such cases are “Inconclusive” and need further investigations to assign their possible causes. Moreover, if it fails to fulfill both criteria, then it is not considered as pollution-induced flashover and hence assigned as “Not Consistent with PFO”.
3. Statistics of Spatiotemporal Distribution of Pollution-Induced Flashover Faults
The entire dataset of unexplained outages was evaluated for consistency with the criteria outlined in Section 2.3. A total of 4231 unexplained faults were examined, and it appeared that 1045 (24.7%) faults were found to be Consistent with PFO, and 2222 (52.5%) events were assigned as Inconclusive, out of which 1649 (39%) did not meet the time-of-the-day criterion and 573 (13.5%) did not meet the month criterion. The remaining 964 (22.8%) were found to be Not Consistent with PFO and could be attributed to other causes occurring in the daytime and early evening hours [9,29]. However, the Inconclusive category might also include PFO incidents that took place outside of their typical characteristic trends [2,19,30].
This result reveals that pollution-induced flashovers contributed for a substantial portion of the unexplained interruptions in services observed within the EEP transmission network. The result was studied further to demonstrate statistical distributions of the flashovers over the years, time of year, time of day, and across grid regions and voltage levels. The rate of occurrences of faults for individual transmission lines were also calculated to evaluate their performance and the results are discussed in the following subsections.
3.1. Geographical Distribution of Pollution-Induced Flashovers across EEP Grid Regions
The distribution of pollution-induced faults in each grid region of EEP between 2015 and 2022 is presented in Figure 4. Among these regions, the Northeast region suffered 290 (27.8%) faults, the highest frequency of interruptions with 3.1 faults/100 km/year, followed by the Northwest region which endured 155 (14.8%) faults and 1.1 faults/100 km/year. The Addis Ababa, East, Central and South grid regions also experienced a higher number of interruptions during this period with more than 100 faults and 0.55 faults/100 km/year each. The Southwest region suffered 23 (2.2%) faults, the lowest number of incidents with 0.2 faults/100 km/year.
Furthermore, to facilitate comparisons and analyze the geographical distribution of pollution-induced faults, the centroids of each transmission line circuit were utilized to allocate a geographical position to each incident and to estimate the prevalence of PFO faults in terms of faults per unit length and unit time. For each circuit, the number of faults per 100 km of transmission line per year was calculated. These data were then incorporated into the GIS database, and centroids were determined for each circuit using ArcGIS software to generate a national-level map illustrating spatial trends. Figure 5 shows the transmission grid in Ethiopia (132–400 kV) as of 2022 (indicated by grey lines), alongside the average number of pollution-induced faults recorded per 100 km of line per year for each circuit. This representation is shown using circles with radii that vary proportionally [4].
Pollution flashover faults were found in 152 circuits, with an average of 3.0 faults per 100 km per year. In terms of geographical variations, the majority of these circuits were concentrated in the Northeast, Eastern, and Central part of Ethiopia as shown in Figure 5.
Typically, standard requirements for high-voltage transmission lines permit the occurrence of 1–2 unexplained faults per 100 miles (equivalent to 0.62–1.24 unexplained faults per 100 km per year) [6,13]. This range of acceptable numbers depends on the line’s significance and location. In most European nations, a rate of approximately one flashover per 150 km of line per year (equivalent to 0.67 faults per 100 km per year) is generally considered acceptable [7]. In this respect, the Ethiopian (132–400 kV) power grid experiences an unacceptably higher frequency of disturbances that are related to line insulator flashovers. It is found that the transmission lines suffered during the years 2015 to 2022 from more than 130 pollution-related faults per year, resulting in a fault frequency of 0.81/100 km/year. This is an unacceptably high rate of outages and evidently indicates that pollution-induced problems appear more often than presumed by the EEP. Instances of fault frequencies for underperforming EEP’s 132, 230, and 400 kV lines from 2015 to 2022 are listed in Table 2.
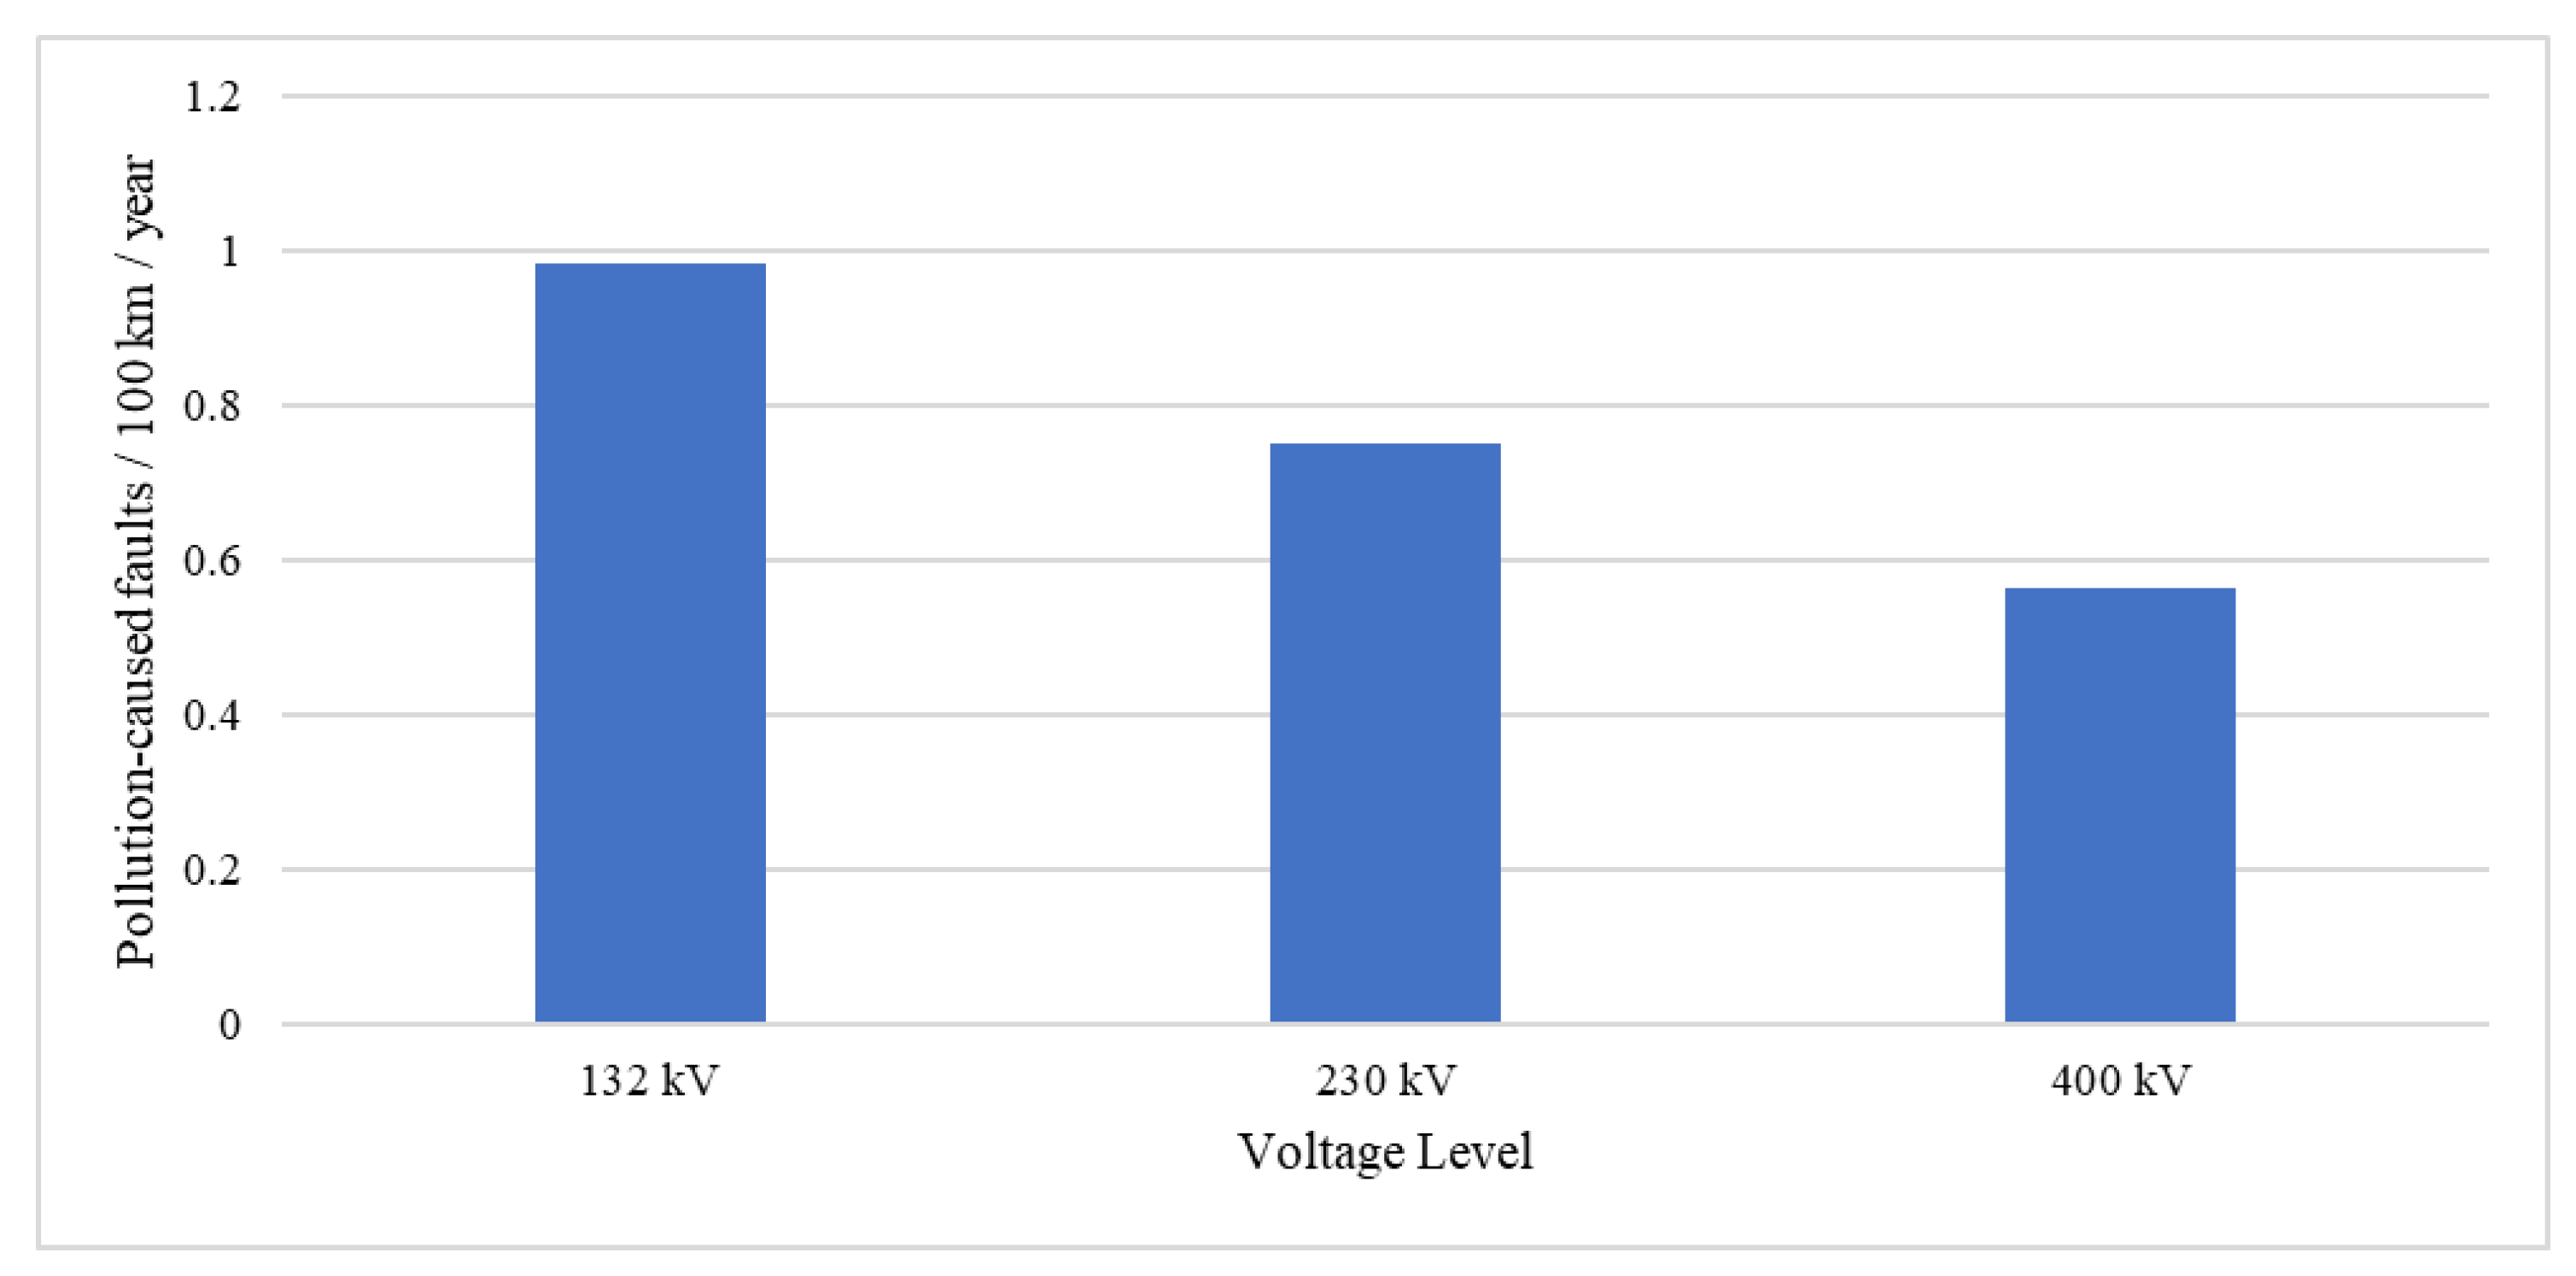
The distribution of pollution-induced fault frequency for the primary-voltage-level lines is illustrated in Figure 6. When the frequency of faults is evaluated separately, 132 kV lines suffered the highest fault frequency at 0.98 faults/100 km/year, and the faults experienced by 230 kV lines amounts to 0.75 faults/100 km/year. These poor performances are in accordance with the service experiences reported by EEP experts. Almost half of the 132 and 230 kV lines were built prior to 2005, and their underperformance could, in addition to the environmental and climatic factors, be attributed to the aging of the line infrastructure. In contrast, 400 kV lines display a lower fault frequency of about 0.57/100 km/year.
3.2. Time-of-Day and Seasonal Examination of Pollution-Induced Faults
Scrutiny of the identified pollution-induced faults revealed that yearly trends in their appearance varied from one year to another—it had an increasing trend, peaking in 2018, as shown in Figure 7. Since 2019, it has become constant due to pollution saturation (an equilibrium condition between the pollution deposit rate and insulator cleaning rate) [1]. The reason for the increasing trend could be attributed to changes in environmental and meteorological conditions, issues related to the selection and dimensioning of insulators, infrastructure aging, and ineffective maintenance procedures. Further study is required to elucidate the reason for this trend and develop strategies to mitigate future fault occurrences.
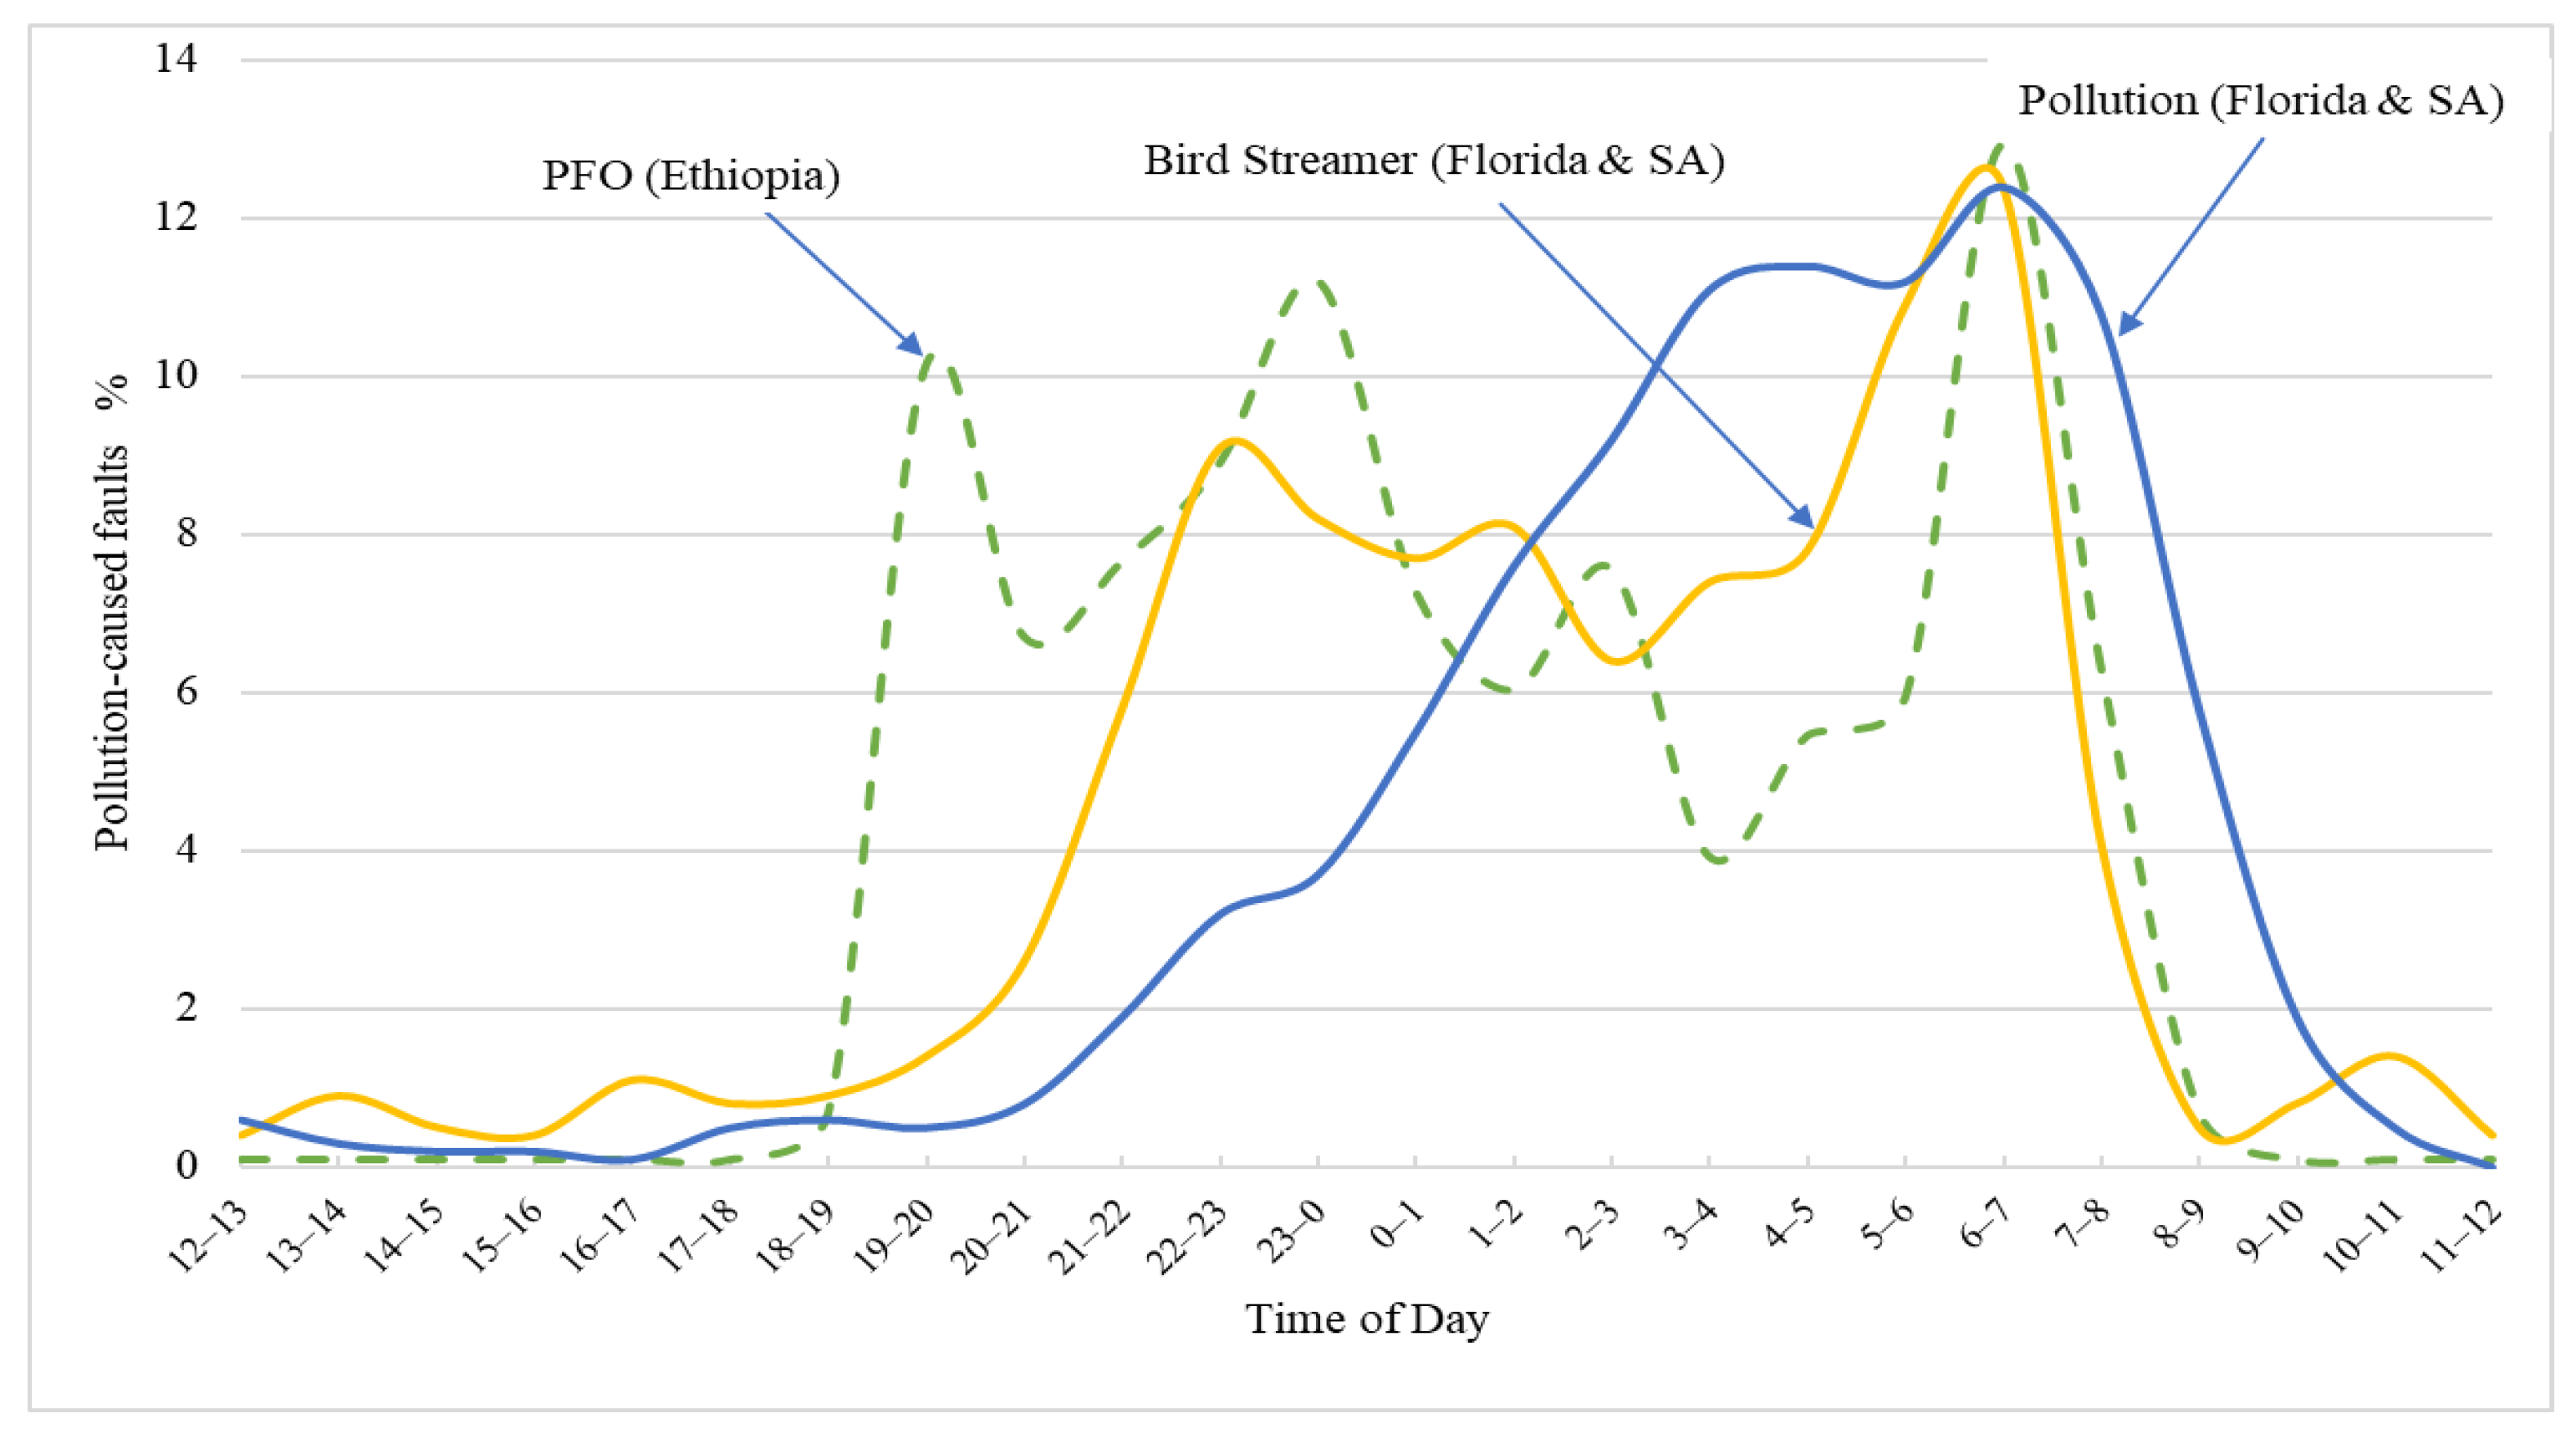
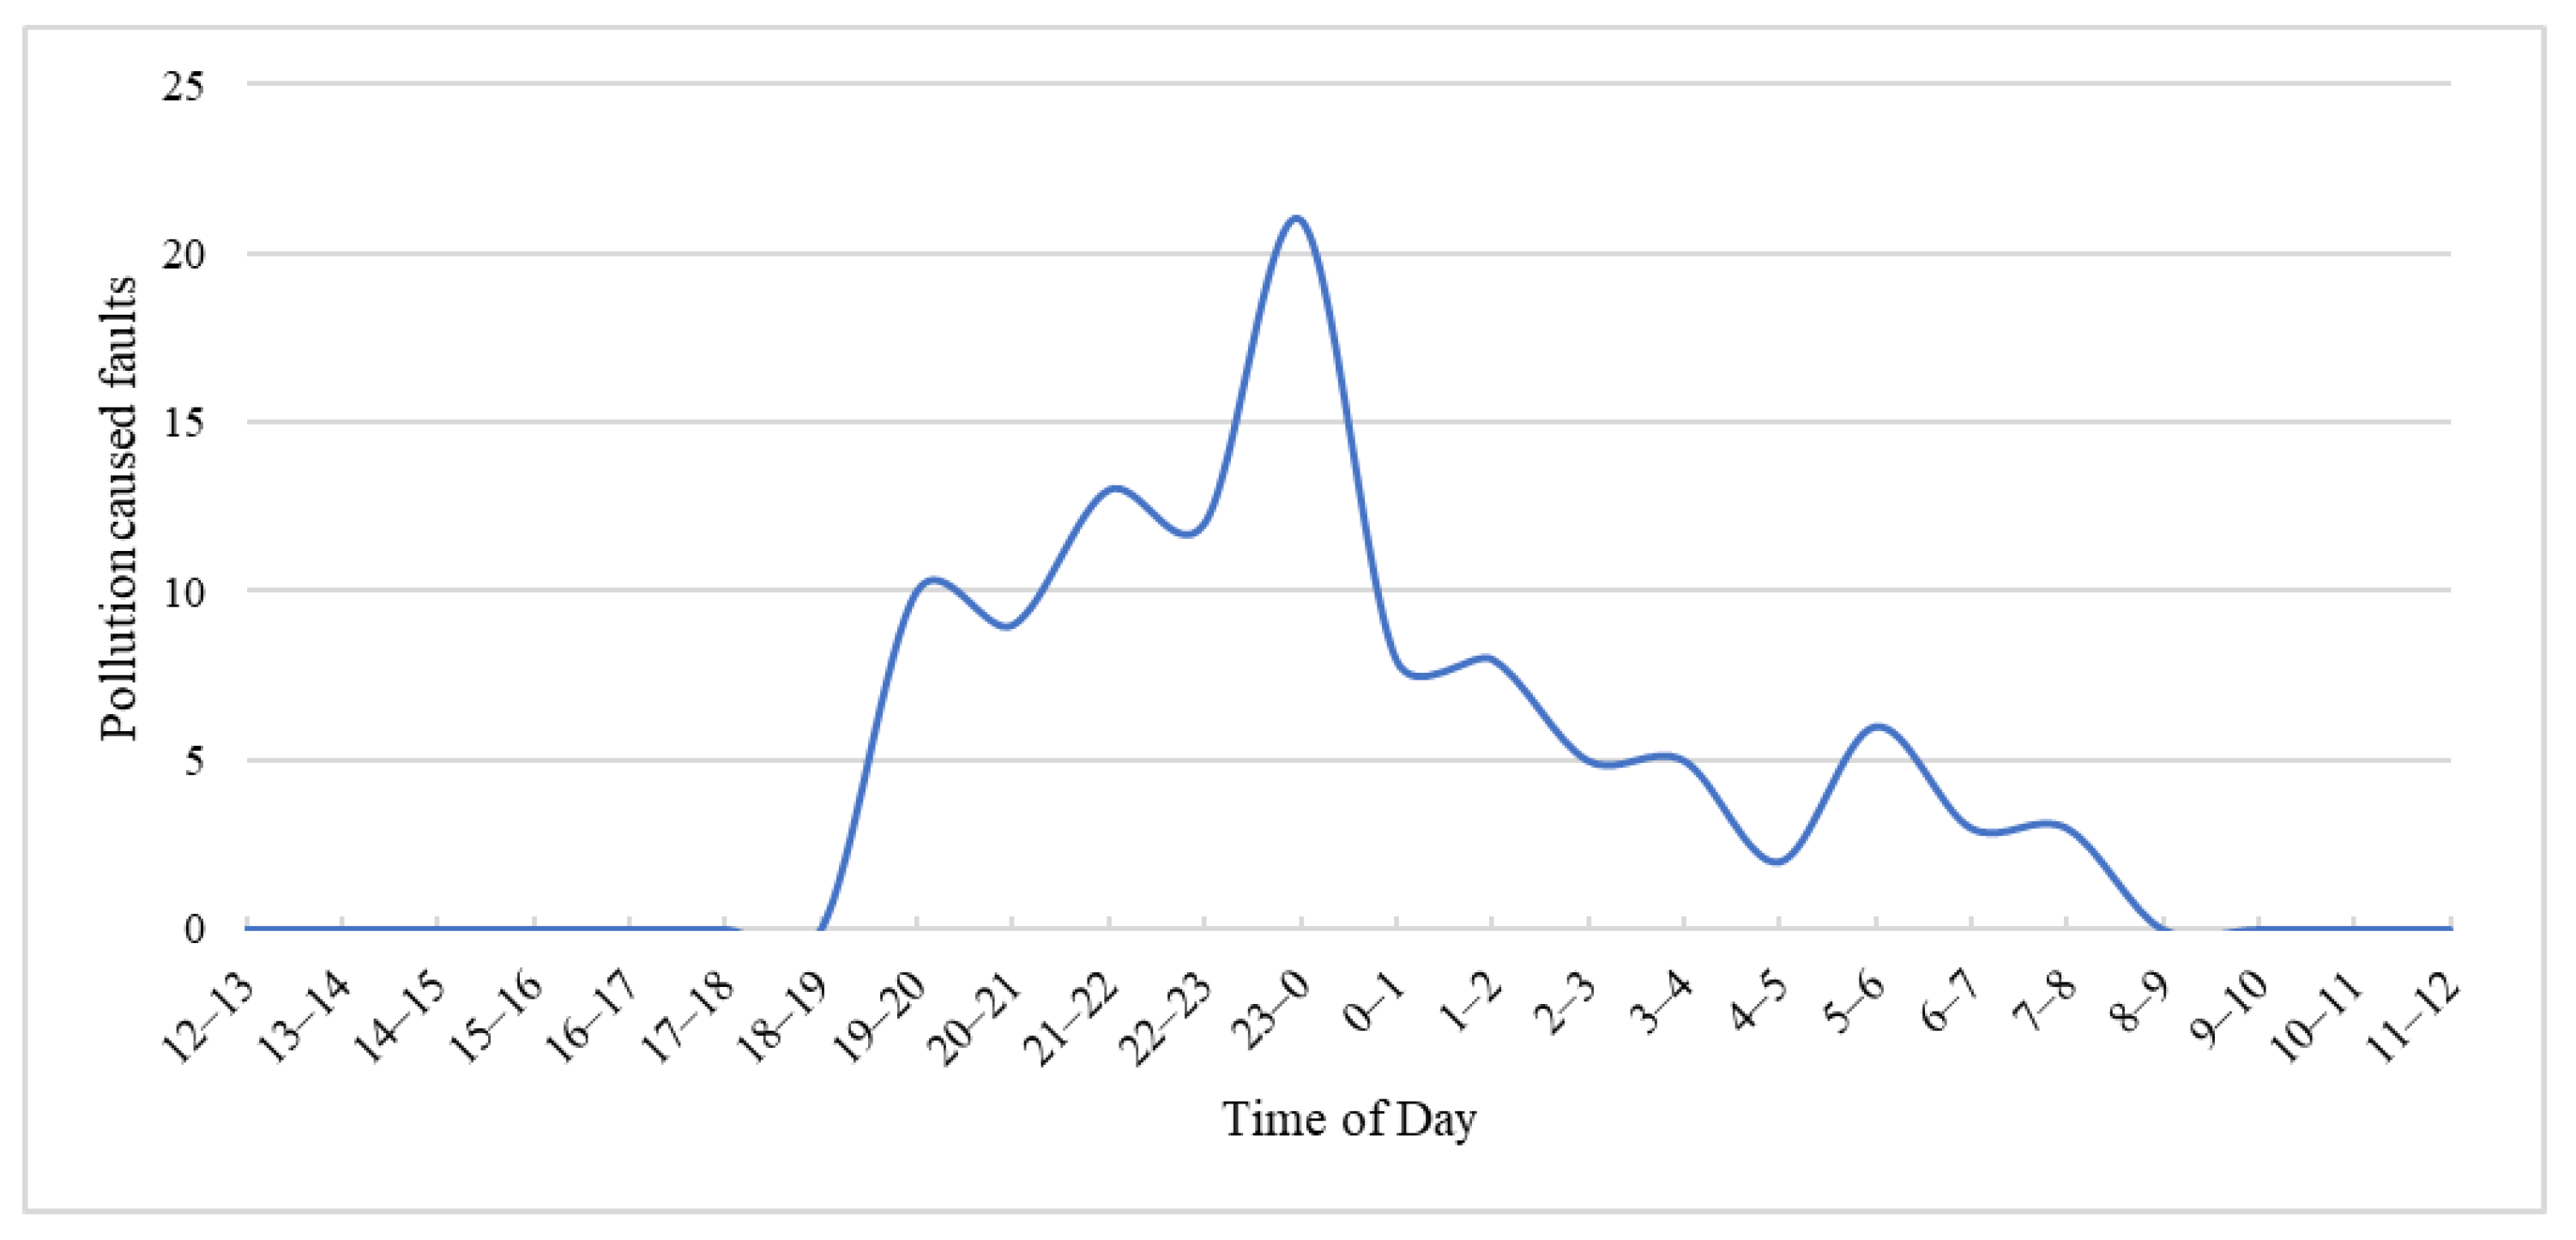
The time-of-the-day curve of pollution induced faults (PFO) is shown in Figure 8. It exhibits a pattern characterized by three peaks. The number of faults rises quickly after sunset between 19:00–20:00, and after showing a decrease, it again rises around midnight, mainly due to pollution wetting that can be associated with light precipitation, dew formation, and moisture adsorption during the night. At around 06:00 in the early morning, there is again a rapid increase in the fault number, likely due to a combination of wetting and bird steamers, the latter usually occurring during the spring season in areas populated by large birds. Thereafter, the number of faults drops close to zero and remains at this level practically for the whole day. This pattern has a good correlation with the patterns for bird streamer and pollution-caused faults in Florida and in South Africa, as shown in Figure 8.
The seasonal pattern of fault incidence is depicted in Figure 9, exhibiting a maximum fault during the dry months of October to February and March to May, peaking in December and April. A relatively lower number of faults occur from May to September, except for August, which falls during the main rainy season in most parts of Ethiopia. The seasonal trend of fault occurrence follows the rainfall patterns in the country.
4. Analysis of Pollution-Induced Flashover Faults by Type of In-Service Insulator
Pollution flashover performance of insulators has observable trends when examined from the viewpoint of its type (cap-and-pin strings or long rod), waveform of energization (i.e., AC or DC), and its material (glass, porcelain or polymeric) [1,11,12]. In this section, the identified pollution-induced faults were further analyzed to investigate how the different materials of in-service-used insulator arrangements impact on the intensity of pollution-induced flashover faults. For this analysis, the number of faults that occurred on a specific line is allocated to the specific insulator type of the line. The analysis was performed in terms of pollution flashovers intensity, involving the number of pollution flashovers allocated to a certain insulator type (porcelain and glass cap-and-pin strings or silicone rubber polymeric composite long rods) for a given period and system voltage and the number of insulator strings assembled from these insulators normalized for 1000 units [24].
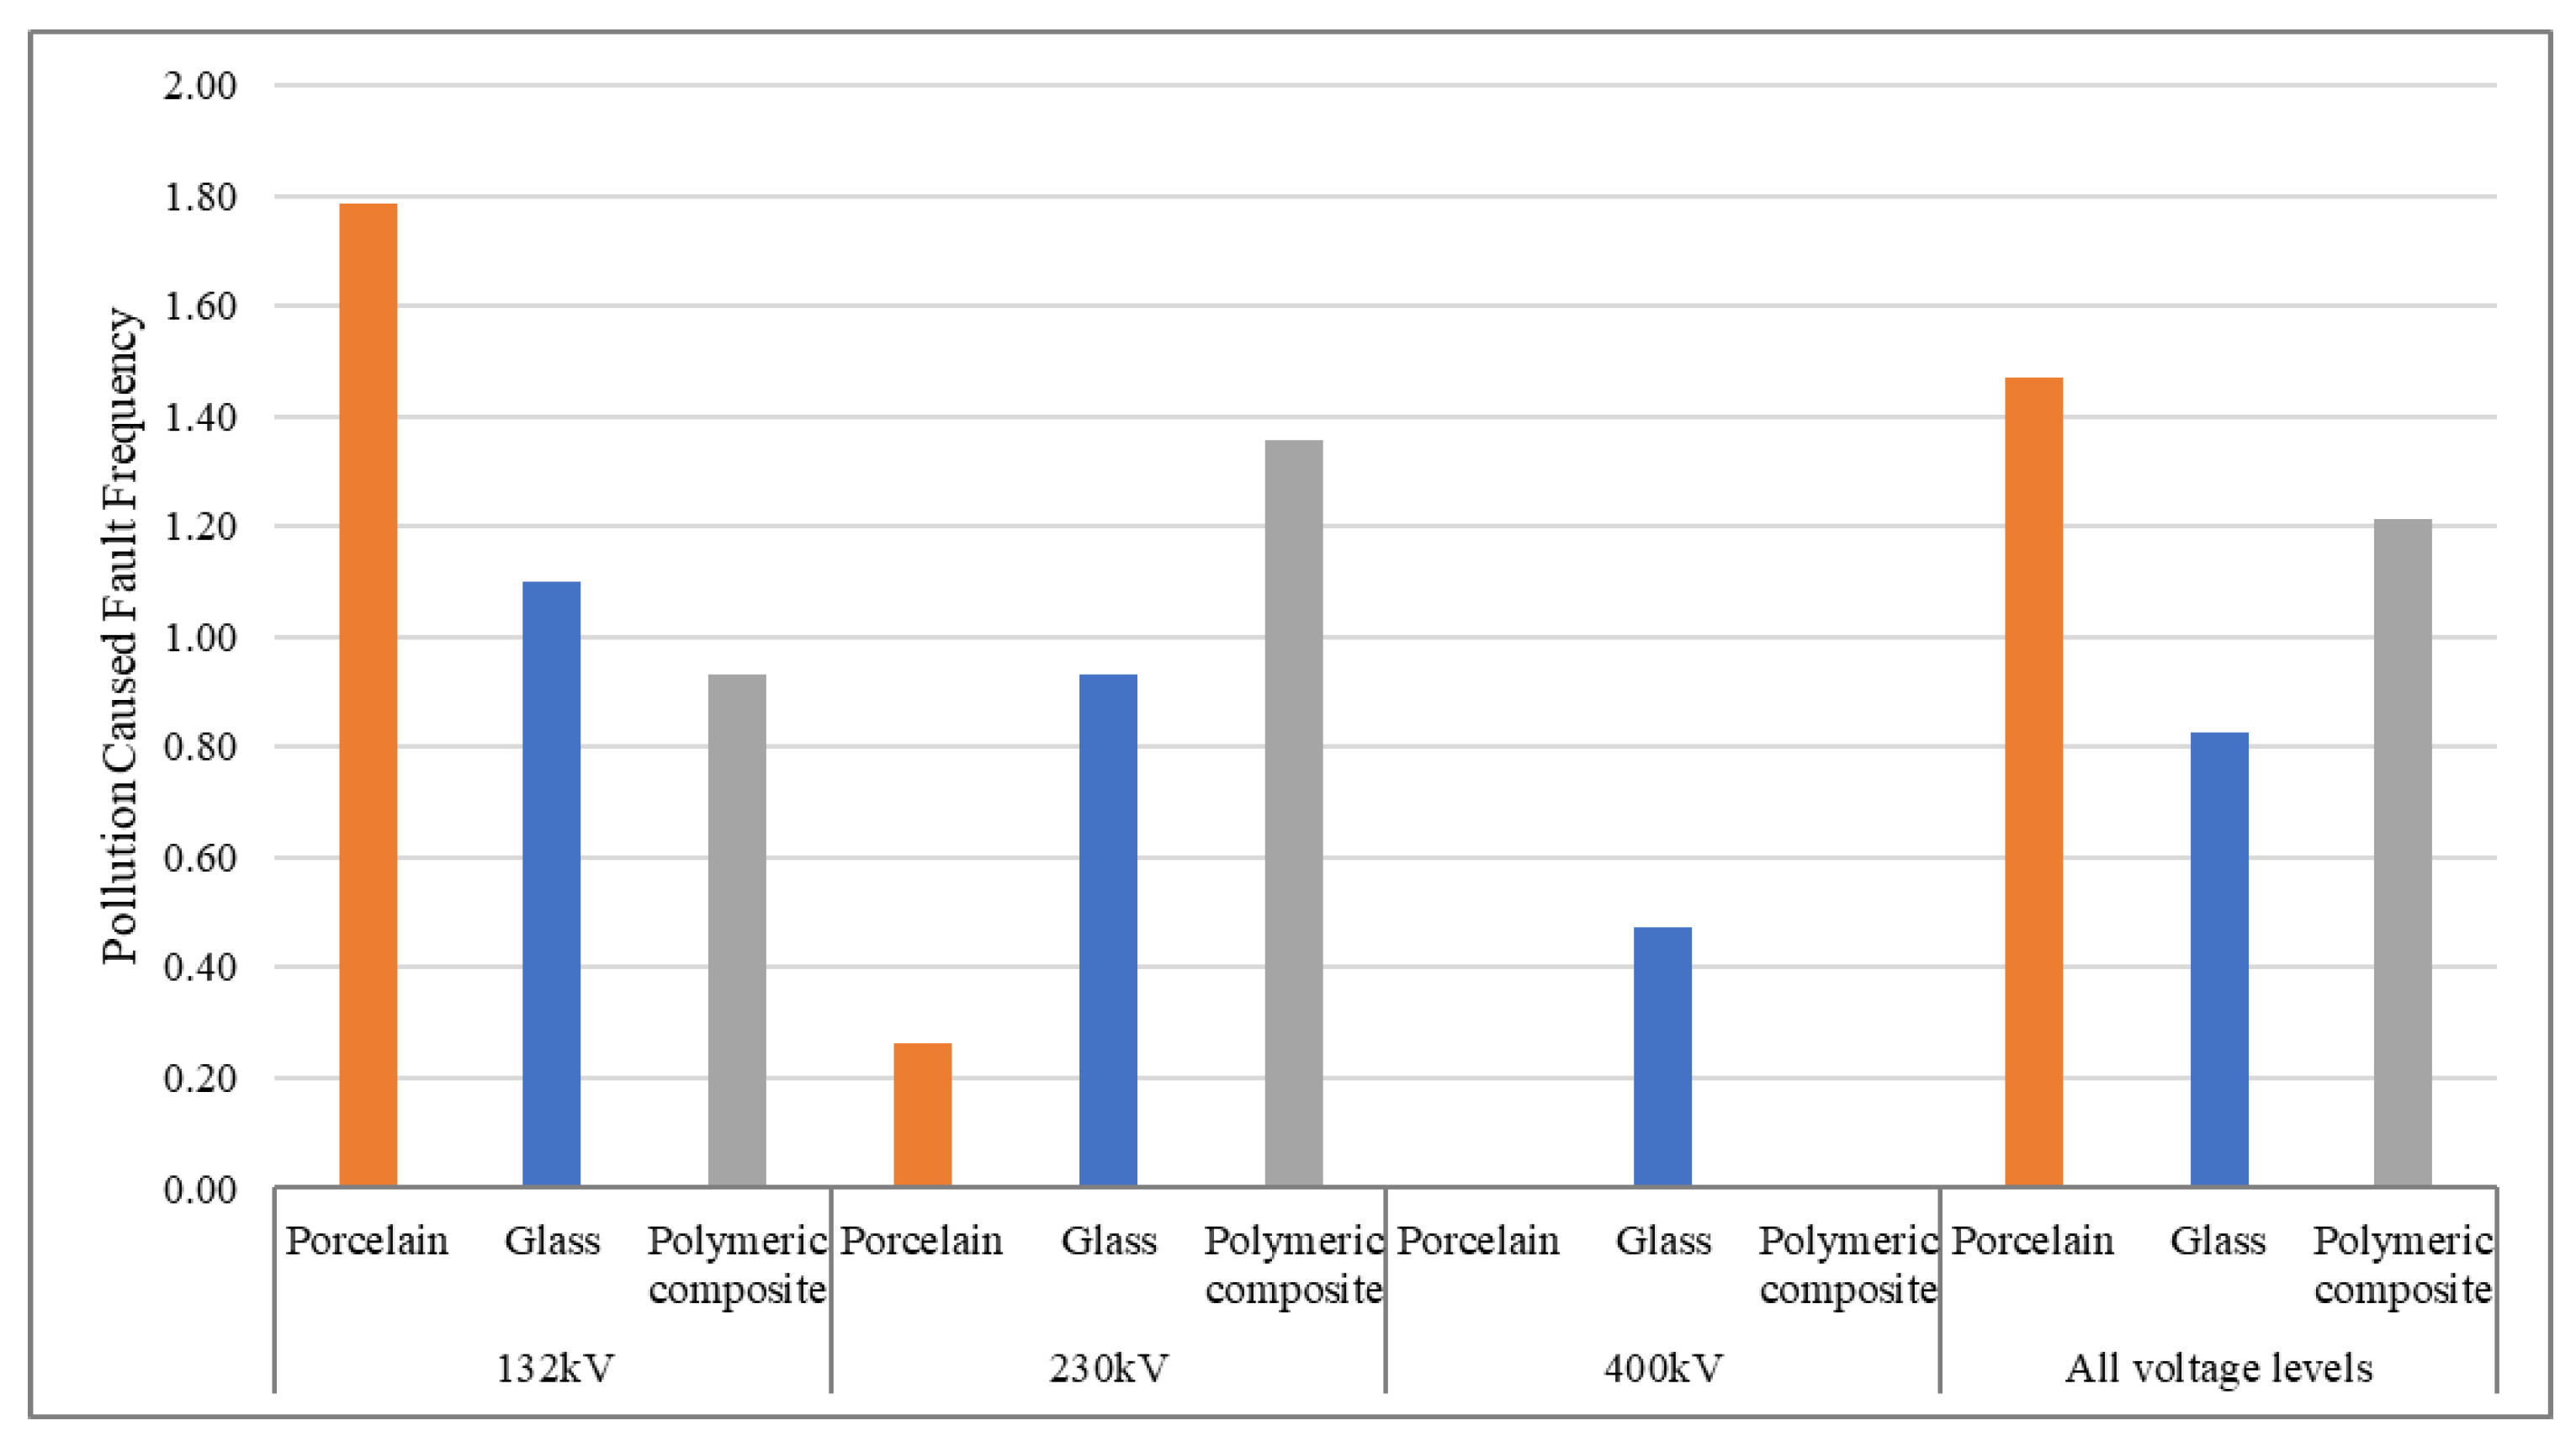
The analysis result indicates that, out of the total 1045 pollution-induced faults, 77 (7.3%) occurred on porcelain strings, 542 (51.9%) on glass strings, and the remaining 426 (40.8%) occurred on polymeric composite long rods. Most of the faults occurred on glass and polymeric insulators which, respectively, represent 61% and 34% of the total insulators installed in the system, while porcelain insulators strings represent only 5%. Figure 10 compares the pollution flashover intensity for each voltage level and for insulator types, covering eight consecutive years from 2015 to 2022. For 132 kV lines, the intensity of pollution-induced flashovers was highest on strings assembled from porcelain cap-and-pin insulators, with the intensity of 1.79 faults/year/1000 units, followed by glass insulator strings with 1.10 faults/year/1000 units and polymeric long rod insulator, which suffered the least number of faults with less than 0.93 faults/year/1000 units. For 230 kV lines, the intensity of pollution-induced flashovers was highest on strings of polymeric composite insulators with the intensity of 1.36 faults/year/1000 units and followed by glass insulator strings with 0.93 faults/year/1000 units. Here, porcelain insulators had the lowest intensity of faults with less than 0.26 faults/year/1000 units. In 400 kV lines, glass insulator strings are exclusively used and experienced the fault intensity of 0.47 faults/year/1000 units.
For the three voltage levels, porcelain insulator strings had the highest pollution-induced flashover intensity of 1.47 faults/year/1000 units, followed by polymeric composite long rod insulators with an intensity of 1.21 faults/year/1000 units and glass insulator strings with the lowest fault intensity of 0.83 faults/year/1000 units. The percentage distributions of individual insulator types and a comparison to the intensities of pollution-induced flashovers for all voltage levels are summarized in Table 3.
As already indicated, the combined intensity of pollution flashovers was highest on strings assembled from ceramic (porcelain and glass) insulators, mainly due to their hydrophilic surface properties. Moreover, the other reason which additionally contributes to the poor pollution performance of these insulators can be attributed to aging, as these lines were built 30–40 years ago. Various environmental stresses erode and degrade their end fittings and surfaces. These include exposure to high-temperature variations during long, dry periods and vandalism. This conclusion is also supported by the reported service experience.
High-temperature-vulcanized (HTV) silicone rubber (SR) polymeric insulators installed on 132 and 230 kV lines also suffered from a significant number of pollution-induced flashovers, even though these insulators are relatively newly installed in the system. Despite these types of composite insulators being generally known to have superior pollution performance due to their hydrophobic properties, their performance in the Ethiopian climatic and environmental conditions appears to be not so satisfactory.
Polymeric composite insulators were introduced into the EEP network in 2008, specifically on 132 and 230 kV lines. To assess their impact on improving pollution flashover performance of the network, the total number of pollution-induced flashovers on these lines was compared. This involved comparing older lines, insulated with glass or porcelain before 2008, with newer lines insulated by silicone composite insulators. Analysis of data from 2015 to 2022 revealed 869 pollution-induced flashovers on 132 and 230 kV lines. Among these, 426 faults were observed on lines insulated with silicone composite insulators, while the remaining 443 faults occurred on lines insulated with glass or porcelain. This suggests that the use of SR polymeric insulators for 132 and 230 kV lines did not significantly improve the pollution flashover performance of the network. Moreover, there is concern that their performance may deteriorate as they approach 30–40 years of service, like the older glass or porcelain-insulated lines.
Many factors can contribute to this effect. One of them may be traced to improper practices or policies during the design and dimensioning stage of the line design. Usually, the climatic and environmental stresses to which the insulators will be subjected during operation are not properly taken into consideration. It especially refers to not considering or incorrectly assuming site pollution severity (SPS values) for line locations. In addition, the pollution level in some line locations might appreciably change (mainly increase) since the initial assumptions were made, which results in difficulty in selecting and dimensioning the appropriate insulator type and size that best fit the local climatic and environmental conditions and possibly yields under- or over-dimensioned insulation [10].
Another factor that should be considered is the exposure of silicone rubber composite insulators to intense UV radiation and high temperature during dry and hot periods from October to May in most parts of Ethiopia. This results in the formation of micro-cracks and surface degradation of the rubber and severely reduces the hydrophobic property of the insulator’s surface and contributes to the collection of more pollution than the smooth surface does. Polymeric insulators are also more vulnerable to biological growths in the humid subtropical highland climatic conditions of Ethiopia, which may further reduce their hydrophobic properties. Such service induced changes in the housing material properties compromise the hydrophobicity and resistance to tracking, which lead to greatly degraded pollution flashover performance and premature failure [1,11,12].
Moreover, the quality of materials and production processes which affect the overall behavior of the insulator is also an important factor one should consider [1]. This can also be one of the reasons for the poor performance of polymeric insulators in the Ethiopian power network. During construction of new lines and maintenance of existing ones, the laboratory tests to verify the electrical properties of candidate insulators do not usually include pollution flashover performance tests. Even if such a test were to be carried out, there is no reference pollution monitoring activity or pollution severity map for the country to select the proper pollution parameters such as ESDD and NSDD and to set up the adequate test environment. The documentation for respective projects lacks clear descriptions of test methods or acceptance criteria for assessing insulator suitability. Moreover, these documents do not include any reports on service experience records or field measurements aimed at estimating site pollution severity [10]. This results in using under or over dimensioned insulators with lower quality, which is uneconomical for EEP and has a huge impact on their overall performance during operation.
These days, there is a significant increase in replacing porcelain and glass insulator sets with polymeric composite types on towers where a line suffers a high rate of outages due to unexplained outages (possibly PFO). But this again is carried out without detailed study of the root causes and assessment of the environmental pollution severity level. The trend is to simply use the same insulator type and parameters which were used for other lines in projects that have different environmental conditions and pollution severity levels. This yields large investments, which might not solve the problem and can yield a large financial loss.
In general, this poor performance of in-service insulator appears to be the result of the policies and procedures of the EEP concerning the selection and dimensioning of present and future insulators, which lack consistent guidelines that take into consideration the particular application needs and environmental factors in which the insulators will be deployed.
We therefore recommend that EEP improves its practice towards selection and dimensioning of outdoor insulators by defining guidelines for monitoring, maintenance, and inspection procedures for new and existing lines. One of the major uncertainties when selecting outdoor insulators can be linked with estimation of the actual values of the pollution severity level of installation sites. Field monitoring of pollution severity at critical line locations and establishing test stations for carrying intensive measurement campaigns is a prerequisite for improving the present state. Ultimately, creating a comprehensive pollution severity map covering the entire country can provide invaluable information for optimal insulator selection. Moreover, pollution performance tests and acceptance criteria should be included as requirements in the purchase specifications for outdoor insulators.
In addition, EEP should implement scheduled maintenance plans and palliative practices to compensate for the design failures, thereby reducing maintenance costs and mitigating premature failures of outdoor insulators. These plans should be based on detailed evaluations of environmental factors, alongside considerations of technical, economic, and logistical viability. Potential maintenance and preventative strategies to mitigate pollution flashover-caused outages include washing substation and line insulators, using creepage extenders, replacing hydrophilic insulators with hydrophobic alternatives, and application of RTV silicone coatings. The selection of these measures should depend upon their economic and technical feasibility [1,2,12,14].
5. Case Studies: Analyses of Underperforming Lines
This section provides case studies for two transmission lines that encountered unacceptably high rates of pollution-caused outages from 2015 to 2022. This can be considered as verification of the results obtained by the above presented method. Local climatic and meteorological data along the lines’ routes, coupled with historical field experience are used to assess their consistency with the typical conditions conducive to pollution-induced flashovers.
5.1. Combolcha II—Semera—Dicheto 230 kV Line
The Combolcha II—Semera—Dicheto 230 kV line stretches 241 km from Combolcha II substation through Semera to the Dicheto substation in the northeast part of Ethiopia, which has a desert and semi-arid climatic conditions, characterized by having limited rainfall throughout the year. It is near the Danakil desert and Red Sea and is exposed to direct salt sprays, salty dusts, and salty fog carried by strong winds. It also is exposed to mining contamination from the desert and saline lakes in the region and is thus subject to a combination of type A and type B pollutants. The line is insulated with long-rod HTV silicone rubber composite insulators and is known from service experience to have poor performance. A total of 105 pollution-induced flashovers were identified on this line from 2015 to the end of 2022, an average of 13.1 faults per year. Figure 11 shows the monthly average meteorological parameters across the entire length of the line. The line receives an average rainfall of less than 48 mm from March to August. The yearly average values of relative humidity (above 42%), temperature (above 27 °C), and windspeed (2.5 m/s) fit the conditions for pollution accumulation and wetting.
Figure 12 and Figure 13 indicate that the pollution-induced faults mainly occurred on the line during the night from 19:00 to early morning (5:00–6:00), peaking at midnight (23:00–1:00) and especially in April and August. This is the rainy season in the region, having relatively low rainfall levels, when insulator surfaces are wetted by light precipitation during the evening hours and dew formation at sunrise.
Both forms of pollution flashover mechanisms, namely type A and type B, are highly likely to occur on this line. The region is not a favorable place for large birds to live due to its climate, thus bird streamer-caused faults seem unlikely to occur.
The presented data show a good correlation between the temporal distributions of the identified pollution-induced faults and the climatic conditions. Moreover, the reason for the greatly degraded pollution performance of the silicone rubber composite insulators installed on the line can be attributed to their exposure to sandstorms (the local desert sand contains calcium and sodium salts) as well as intense UV radiation and high temperatures, which contribute to the formation of micro-cracks and drastically reduced the hydrophobicity on insulator surfaces.
5.2. Bahir Dar II—Debre Markos—Sululta 400 kV Line
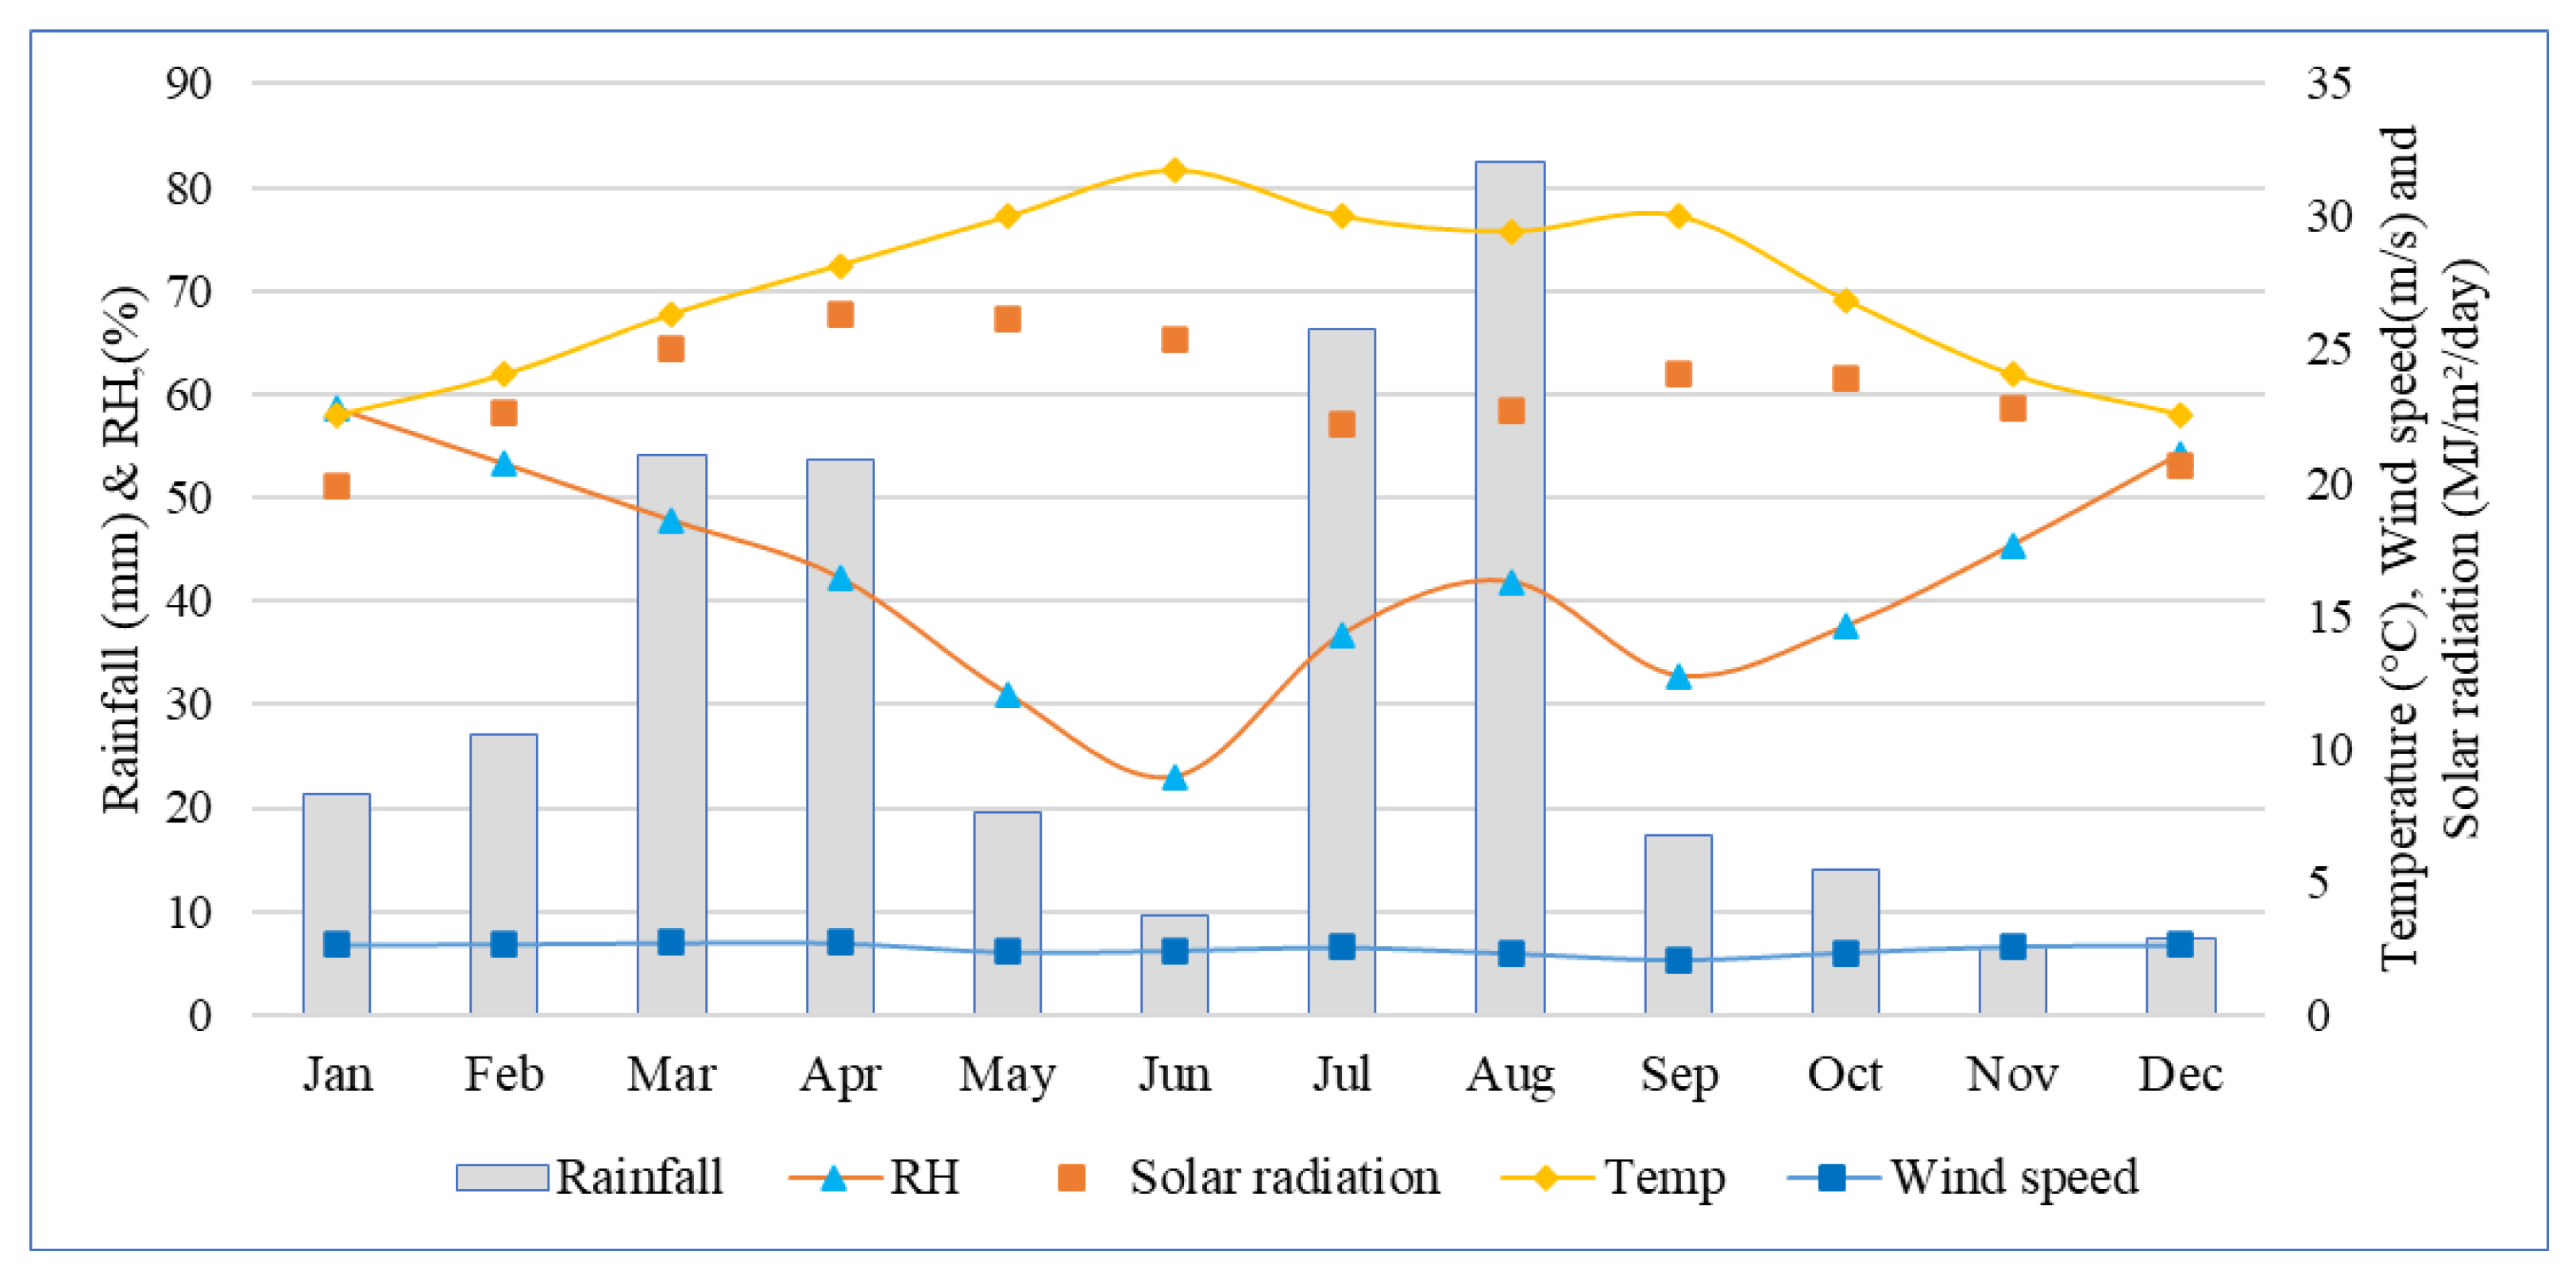
The Bahir Dar II—Debre Markos—Sululta 400 kV line spans 410 km, extending from the northwestern highlands of Ethiopia to Addis Ababa, crossing subtropical highland and tropical savanna climatic conditions. The environmental conditions along the route of the line are characterized by a mixture of desert, industrial, and agricultural pollutants. The main sources of pollution in the area are from transportation, construction, quarry sites, naturally occurring dust from local soils, cement factories, and agricultural activities such as ploughing, fertilizers, crop spraying, and harvesting. The line is insulated with glass-cap and pin strings. The line is known for having a high number of unexplained outages, and the performed analysis identified a total of 72 pollution induced faults on it for the period between 2015 to 2022, an average of 9 faults per year. Figure 14 shows the monthly average meteorological parameters across the entire length of the line. The line receives an average rainfall of about 270 mm from June to September and an average relative humidity above 58%, temperature above 17 °C and windspeed 1.8 m/s for the whole year.
The time-of-the-day curve depicted in Figure 15 reveals that most of these faults occurred close to midnight, from 22:00 to 23:00, and early in the morning, between 6:00 to 7:00. Figure 16 indicates that the majority of faults occurred between November and February, attributed to dew formation on the glass insulator surface, and from March to May (due to light precipitation), respectively, corresponding to the dry and light rainfall seasons in the area. Most faults were concentrated during spring ploughing, winter crop harvesting, and burning. The bird streamer mechanism may contribute to the faults occurring in October and November, during the autumn season. The described conditions are consistent with type A and type B pollution-flashover mechanisms.
Moreover, the reduction in flashover voltage (above 10%), because of the lowered air density by high altitude (~2000 m) and nearly constant temperature along the route of the line, could also contribute to the increased outage rate [1]. Therefore, there is a good correlation between the meteorological pattern, environmental conditions, reported service experiences, and the identified pollution-induced faults.
6. Conclusions
Unexplained fault records from Ethiopian transmission lines, which took place between 2015 to 2022, were analyzed with the aim of identifying among them the faults caused by pollution induced flashovers. This was achieved by developing a method considering information about the characteristics of the fault, the time of day and time of the year (month) the fault occurred, the location of the fault, and the climatic/meteorological and environmental conditions at the fault location.
The results have indicated that the lines excessively suffer from pollution-induced outages that embrace a significant part of all interruptions in the Ethiopian power system. Their frequency appears much higher compared to the international acceptable outage rates. The Ethiopian Electric Power company should therefore intensify work on minimizing these outages and ensuring the highest possible reliability of its power transmission lines.
Moreover, the analyses concerning the type of insulators installed at the lines of all the voltage levels indicate that the pollution performance of silicone rubber composite long-rod insulators appeared to not be as good as one could expect based on the available literature data on this subject. This clearly indicates that proper selection and dimensioning of the composite insulator in Ethiopia remain problematic and should be based on paying more attention to the local climatic and environmental conditions. Further detailed work is also required to evaluate the severity of these conditions as an input for the development of the pollution map for the whole country, which will become a starting point to further tackle the problem and to assist design practices for present and future insulator selection.
Author Contributions
Conceptualization, B.Z.D., M.M.W. and S.M.G.; methodology, B.Z.D.; formal analysis, B.Z.D. and S.M.G.; investigation, B.Z.D.; resources, M.M.W. and S.M.G.; data curation, B.Z.D.; writing—original draft preparation, B.Z.D.; writing—review and editing, M.M.W. and S.M.G.; visualization, B.Z.D.; supervision, M.M.W. and S.M.G.; project administration, M.M.W.; funding acquisition, M.M.W. All authors have read and agreed to the published version of the manuscript.
Funding
This research was funded by the Swedish International Development Cooperation Agency (Sida)—Ethiopia Bilateral Program, contribution number 51080124.
Data Availability Statement
The data presented in this study are available on request from the corresponding author. The data are not publicly available due to privacy restrictions.
Acknowledgments
The authors gratefully acknowledge the financial contribution made by the Swedish International Development Cooperation Agency (Sida)—Ethiopia Bilateral Program and the support provided to our research activities by the Department of Electrical Engineering of Chalmers University of Technology and its dedicated staff. We would like also to thank the Ethiopian Electric Power company for providing access to the 8-year fault data in its power network.
Conflicts of Interest
The authors declare no conflicts of interest. The funders had no role in the design of the study; in the collection, analyses, or interpretation of data; in the writing of the manuscript; or in the decision to publish the results.
References
- CIGRE Taskforce 33.04.01. Polluted Insulators: A Review of Current Knowledge; CIGRE Technical Publication 158; CIGRE: Paris, France, 2000. [Google Scholar]
- Macey, R.; Vosloo, W.; de Tourreil, C. Environmental considerations. In The Practical Guide to Outdoor High Voltage Insulators; Eskom Power Series; Crown Publications: Johannesburg, South Africa, 2004; Volume 3. [Google Scholar]
- Ethiopian Electric Power. EEP Operational and Fault Data from 2015 to 2022.
- Berhanu, Z.D.; Mengesha, M.W.; Stanislaw, M.G. Analyses of Unexplained Faults in Transmission Lines in the Power Grid of Ethiopia. Electr. Power Syst. Res. 2024, 231, 110293. [Google Scholar] [CrossRef]
- Major, M. Investigation of Contamination Flashover as a Possible Cause for Unexplained Faults on the Montana Power Company’s 500 kV Transmission Lines. Master’s Thesis, Montana St. University, Bozeman, MT, USA, November 1993. [Google Scholar]
- Maehl, D.R. Investigation of Bird Induced Outages on Montana Power Company’s 500 kV Transmission Lines. Master’s Thesis, Montana State University, Bozeman, MT, USA, 1996. [Google Scholar]
- Taklaja, P.; Oidram, R.; Niitsoo, J.; Palu, I. Causes of indefinite faults in Estonian 110 kV overhead power grid. Oil Shale 2013, 30, 225–243. [Google Scholar] [CrossRef]
- Herman, R.; Gaunt, T. Probabilistic interpretation of customer interruption cost (CIC) applied to South African systems. In Proceedings of the 2010 IEEE 11th International Conference on Probabilistic Methods Applied to Power Systems, Singapore, 14–17 June 2010; pp. 564–568. [Google Scholar] [CrossRef]
- Bekker, H.J.J.; Hoch, D.A. Analysis of factors contributing to unexplained transmission line faults on a high voltage transmission network. In Proceedings of the IEEE AFRICON—6th Africon Conference in Africa, George, South Africa, 2–4 October 2002; Volume 2, pp. 655–660. [Google Scholar] [CrossRef]
- Zelalem, B.; Mamo, M. Assessment of external insulation problems related to pollution and climatic conditions in Ethiopia. IEEE Electr. Insul. Mag. 2020, 6, 36–46. [Google Scholar] [CrossRef]
- IEC/TS 60815-1; Selection and Dimensioning of High-Voltage Insulators Intended for Use in Polluted Conditions—Part 1: Definitions, Information and General Principles. International Electrotechnical Commission: Geneva, Switzerland, 2008.
- CIGRE Working Group C4.303. Outdoor Insulation in Polluted Conditions: Guidelines for Selection and Dimensioning—Part 1: General Principles and the a.c. Case; CIGRE Technical Publication 361; CIGRE: Paris, France, 2008. [Google Scholar]
- Sandhu, K.S. A Joint Utility Investigation of Unexplained Transmission Line Outages; EPRI Publication EL-5735 Research Project 2335-1; Sierra Pacific Power Company: Reno, NV, USA; National Rural Electric Cooperative Association: Arlington, VA, USA; Electric Power Research Institute: Washington, DC, USA, 1988. [Google Scholar]
- Peter, L.; Vajeth, R. Strategies for bating environmental influences on overhead lines to improve quality of supply. In Proceedings of the 2005 IEEE Power Engineering Society Inaugural Conference and Exposition in Africa, Durban, South Africa, 11–15 July 2005; pp. 80–87. [Google Scholar] [CrossRef]
- Vosloo, H.F. The Need for and Contents of a Life Cycle Management Plan for Eskom Transmission Line Servitudes. Master’s Thesis, University of Johannesburg, Johannesburg, South Africa, 2009. [Google Scholar]
- Minnaar, U.J.; Nicolls, F.; Gaunt, C.T. Automating Transmission-Line Fault Root Cause Analysis. IEEE Trans. Power Deliv. 2016, 31, 1692–1700. [Google Scholar] [CrossRef]
- Jian, S.; Peng, X.; Yuan, H.; Lai, C.S.; Lai, L.L. Transmission Line Fault-Cause Identification Based on Hierarchical Multiview Feature Selection. Appl. Sci. 2021, 11, 7804. [Google Scholar] [CrossRef]
- Minnaar, U.J.; Gaunt, C.T.; Nicolls, F. Characterisation of power system events on South African transmission power lines. Electr. Power Syst. Res. 2012, 88, 25–32. [Google Scholar] [CrossRef]
- Burnham, J.T. Bird streamer flashovers on FPL transmission lines. IEEE Trans. Power Deliv. 1995, 10, 970–977. [Google Scholar] [CrossRef]
- Kleinhans, K. Investigation into Possible Mechanisms of Light Pollution Flashover of 275 kV Transmission Lines as a Cause of Unknown Outages. Master’s Thesis, University of Stellenbosch, Stellenbosch, South Africa, April 2005. [Google Scholar]
- Moreira, F.; Martins, R.C.; Aguilar, F.F.; Canhoto, A.; Martins, J.; Moreira, J.; Bernardino, J. Long-term management practices successfully reduce bird-related electrical faults in a transmission grid increasingly used by white storks for nesting. J. Environ. Manag. 2023, 327, 116897. [Google Scholar] [CrossRef] [PubMed]
- Tena, G.M.; Hernández, R.; Montoya, J.I. Failures in outdoor insulation caused by bird excrement. Electr. Power Syst. Res. 2010, 80, 716–722. [Google Scholar] [CrossRef]
- Wesley, R.; Garcia, S. Using Environmental Parameters to Create Pollution Maps for Power Utilities: Experience in Brazil. In Proceedings of the INMR World Congress 2022, Berlin, Germany, 16–19 October 2022. [Google Scholar]
- Sklenicka, V. Investigating Unexplained Reclosures on Power Grid; INMR: Kelowna, BC, Canada, 2023; Available online: https://www.inmr.com/analyzing-unexplained-reclosures/ (accessed on 21 October 2023).
- Abebe, D. Future Climate of Ethiopia from PRECIS Regional Climate Model Experimental Design Ethiopia. Presented Climate Strategies Forum, November 2010. Available online: https://www.metoffice.gov.uk/binaries/content/assets/metofficegovuk/pdf/research/applied-science/precis/precis_experimental_design_dawit.pdf (accessed on 18 April 2022).
- Seleshi, Y.; Zanke, U. Recent changes in rainfall and rainy days in Ethiopia. Int. J. Climatol. 2004, 24, 973–983. [Google Scholar] [CrossRef]
- McSweeney, C.; New, M.; Lizcano, G. UNDP Climate Change Country Profiles Ethiopia. 2012. Available online: http://country-profiles.geog.ox.ac.uk/ (accessed on 10 May 2023).
- Climate Forecast System Reanalysis (CFSR). Global Weather Data. Available online: https://globalweather.tamu.edu/ (accessed on 12 April 2023).
- Chen, B. Fault statistics and analysis of 220-kV and above transmission lines in a southern coastal provincial power grid of China. IEEE Open Access J. Power Energy 2020, 7, 122–129. [Google Scholar] [CrossRef]
- Hu, Y. Analysis on operation faults of transmission line and countermeasures. Gaodianya Jishu/High Volt. Eng. 2007, 33, 1–8. [Google Scholar]
Figure 1.
Map of annual average rainfall of Ethiopia showing the grid regions of EEP.

Figure 2.
Illustrations of annual variations in meteorological parameters (derived from 30 years of data [28]) for four representative sites in Ethiopia. (a) Addis Ababa; (b) Assosa; (c) Gode; (d) Semera.
Figure 2.
Illustrations of annual variations in meteorological parameters (derived from 30 years of data [28]) for four representative sites in Ethiopia. (a) Addis Ababa; (b) Assosa; (c) Gode; (d) Semera.

Figure 3.
Procedure for application of criteria for identifying pollution flashover-induced faults.

Figure 4.
Distribution of pollution-induced flashover faults across EEP grid regions from 2015–2022.
Figure 4.
Distribution of pollution-induced flashover faults across EEP grid regions from 2015–2022.

Figure 5.
Geographical distribution of pollution induced faults across Ethiopia from 2015–2022.

Figure 6.
Frequency of pollution-induced faults for 132 kV, 230 kV, and 400 kV lines.

Figure 7.
Annual variation in pollution-induced faults in Ethiopian power grid.

Figure 8.
Pollution-induced faults within the Ethiopian network, in comparison with the typical time-of-day fault profiles attributed to pollution and bird streamers observed in Florida, USA, and South Africa [2,19].

Figure 9.
Seasonal trend of pollution-induced flashover faults in the Ethiopian power network.

Figure 10.
Distribution of PFO intensity by type of insulator (2015 to 2022).

Figure 11.
Monthly average meteorological parameters across the entire length of the Combolcha II—Semera—Dicheto 230 kV line [28].
Figure 11.
Monthly average meteorological parameters across the entire length of the Combolcha II—Semera—Dicheto 230 kV line [28].

Figure 12.
Daily distribution of pollution-induced faults of the Combolcha II—Semera—Dicheto 230 kV line.
Figure 12.
Daily distribution of pollution-induced faults of the Combolcha II—Semera—Dicheto 230 kV line.

Figure 13.
Monthly distribution of pollution-induced faults of the Combolcha II—Semera—Dicheto 230 kV line.
Figure 13.
Monthly distribution of pollution-induced faults of the Combolcha II—Semera—Dicheto 230 kV line.

Figure 14.
Monthly average meteorological parameters across the entire length of the Bahir Dar II—Debre Markos—Sululta 400 kV line [28].
Figure 14.
Monthly average meteorological parameters across the entire length of the Bahir Dar II—Debre Markos—Sululta 400 kV line [28].

Figure 15.
Daily distribution of pollution-induced faults of the Bahir Dar II—Debre Markos—Sululta 400 kV line.
Figure 15.
Daily distribution of pollution-induced faults of the Bahir Dar II—Debre Markos—Sululta 400 kV line.

Figure 16.
Monthly distribution of pollution-induced faults of the Bahir Dar II—Debre Markos—Sululta 400 kV line.
Figure 16.
Monthly distribution of pollution-induced faults of the Bahir Dar II—Debre Markos—Sululta 400 kV line.


Table 1.
Criteria used to identify pollution caused unexplained faults.
| Conditions | Time of the Day | Month of the Year | Grid Region Classification (Groups) |
|---|---|---|---|
| Condition 1 | 19:00–8:00 | October–February | Group 1, Group 2, Group 3, and Group 4 |
| Condition 2 | 19:00–8:00 | March–May | Group 1 and Group 4 |
| Condition 3 | 19:00–8:00 | June–September | Group 3 and Group 4 |
Table 2.
Pollution-induced fault frequencies of specific EEP 132, 230, and 400 kV lines between 2015 and 2022.
Table 2.
Pollution-induced fault frequencies of specific EEP 132, 230, and 400 kV lines between 2015 and 2022.
| Transmission Lines | Grid Region | Line Length (km) | Number of Towers | In-Service Year | System Voltage (kV) | Type of Insulator Material | Number of Insulator Strings | Total Pollution-Induced Faults | Number of Faults per 100 km per Year |
|---|---|---|---|---|---|---|---|---|---|
| Combolcha II—Semera | North East | 174.8 | 391 | 2011 | 230 | Polymeric composite | 1275 | 78 | 5.6 |
| Combolcha II—Legetaffo | North East and Addis Ababa | 276.3 | 608 | 2012 | 230 | Polymeric composite | 2106 | 53 | 2.4 |
| Bahir Dar II—Debre Markos | North West | 193.8 | 427 | 2011 | 400 | Glass | 2562 | 46 | 3.0 |
| Bahir Dar II—Alamata | North West and North East | 344.5 | 792 | 1998 | 230 | Glass | 2544 | 33 | 1.2 |
| Combolcha I—Akista | North East | 82.0 | 191 | 2006 | 132 | Polymeric composite | 669 | 28 | 4.3 |
| Semera—Dicheto | North East | 65.9 | 131 | 2017 | 230 | Polymeric composite | 414 | 27 | 6.8 |
| Debere Berhan—Showarobit | North East | 57.5 | 206 | 1985 | 132 | Porcelain | 636 | 27 | 5.9 |
| Debre Markos—Sululta | Central and North West | 432.0 | 464 | 2011 | 400 | Glass | 5568 | 26 | 0.8 |
| Alamata—Combolcha II | North East | 170.5 | 362 | 2010 | 230 | Polymeric composite | 1200 | 25 | 1.8 |
Table 3.
Distribution of PFO intensity by type of insulator for 132 kV, 230 kV, and 400 kV system voltage (2015 to 2022).
Table 3.
Distribution of PFO intensity by type of insulator for 132 kV, 230 kV, and 400 kV system voltage (2015 to 2022).
| Voltage Level | Type of Insulator | |||||
|---|---|---|---|---|---|---|
| Porcelain | Glass | Polymeric Composite | ||||
| Percent of Insulator Strings | Pollution Flashover Intensity (%) | Percent of Insulator Strings | Pollution Flashover Intensity (%) | Percent of Insulator Long Rods | Pollution Flashover Intensity (%) | |
| 132 kV | 10 | 46.8 | 59.2 | 28.8 | 30.8 | 24.4 |
| 230 kV | 2.7 | 10.3 | 38.6 | 36.5 | 58.7 | 53.2 |
| 400 kV | 0 | 0 | 100 | 100 | 0 | 0 |
| All voltage levels | 4.9 | 41.9 | 61.2 | 23.6 | 33.9 | 34.5 |
Disclaimer/Publisher’s Note: The statements, opinions and data contained in all publications are solely those of the individual author(s) and contributor(s) and not of MDPI and/or the editor(s). MDPI and/or the editor(s) disclaim responsibility for any injury to people or property resulting from any ideas, methods, instructions or products referred to in the content. |
© 2024 by the authors. Licensee MDPI, Basel, Switzerland. This article is an open access article distributed under the terms and conditions of the Creative Commons Attribution (CC BY) license (https://creativecommons.org/licenses/by/4.0/).
Share and Cite
MDPI and ACS Style
Desta, B.Z.; Wogari, M.M.; Gubanski, S.M. Investigation on Pollution-Induced Flashovers of In-Service Insulators in Ethiopian Power Transmission Lines. Energies 2024, 17, 2007. https://doi.org/10.3390/en17092007
AMA Style
Desta BZ, Wogari MM, Gubanski SM. Investigation on Pollution-Induced Flashovers of In-Service Insulators in Ethiopian Power Transmission Lines. Energies. 2024; 17(9):2007. https://doi.org/10.3390/en17092007
Chicago/Turabian StyleDesta, Berhanu Zelalem, Mengesha M. Wogari, and Stanislaw M. Gubanski. 2024. "Investigation on Pollution-Induced Flashovers of In-Service Insulators in Ethiopian Power Transmission Lines" Energies 17, no. 9: 2007. https://doi.org/10.3390/en17092007
Note that from the first issue of 2016, this journal uses article numbers instead of page numbers. See further details here.