4.3.1. Descriptive Statistics
The survey posited wind farms at different distances: 1.5 km from the coast, 10 km, 22 km, and too far out to see (which we refer to here as “out of sight”). We present the results in tabular and in graphic form,
Table 6 and
Figure 1, respectively.
Table 6.
Reported visitation at varying wind farm distances (n = 983).
Table 6.
Reported visitation at varying wind farm distances (n = 983).
| Respondent beach choice | 1.5 km | 10 km | 22 km | Out of sight |
|---|
| Same beach | 55.3% | 73.9% | 93.7% | 99.4% |
| Different beach in Delaware | 35.0% | 18.9% | 4.3% | 0.3% |
| No Delaware beach | 9.7% | 7.2% | 2.0% | 0.3% |
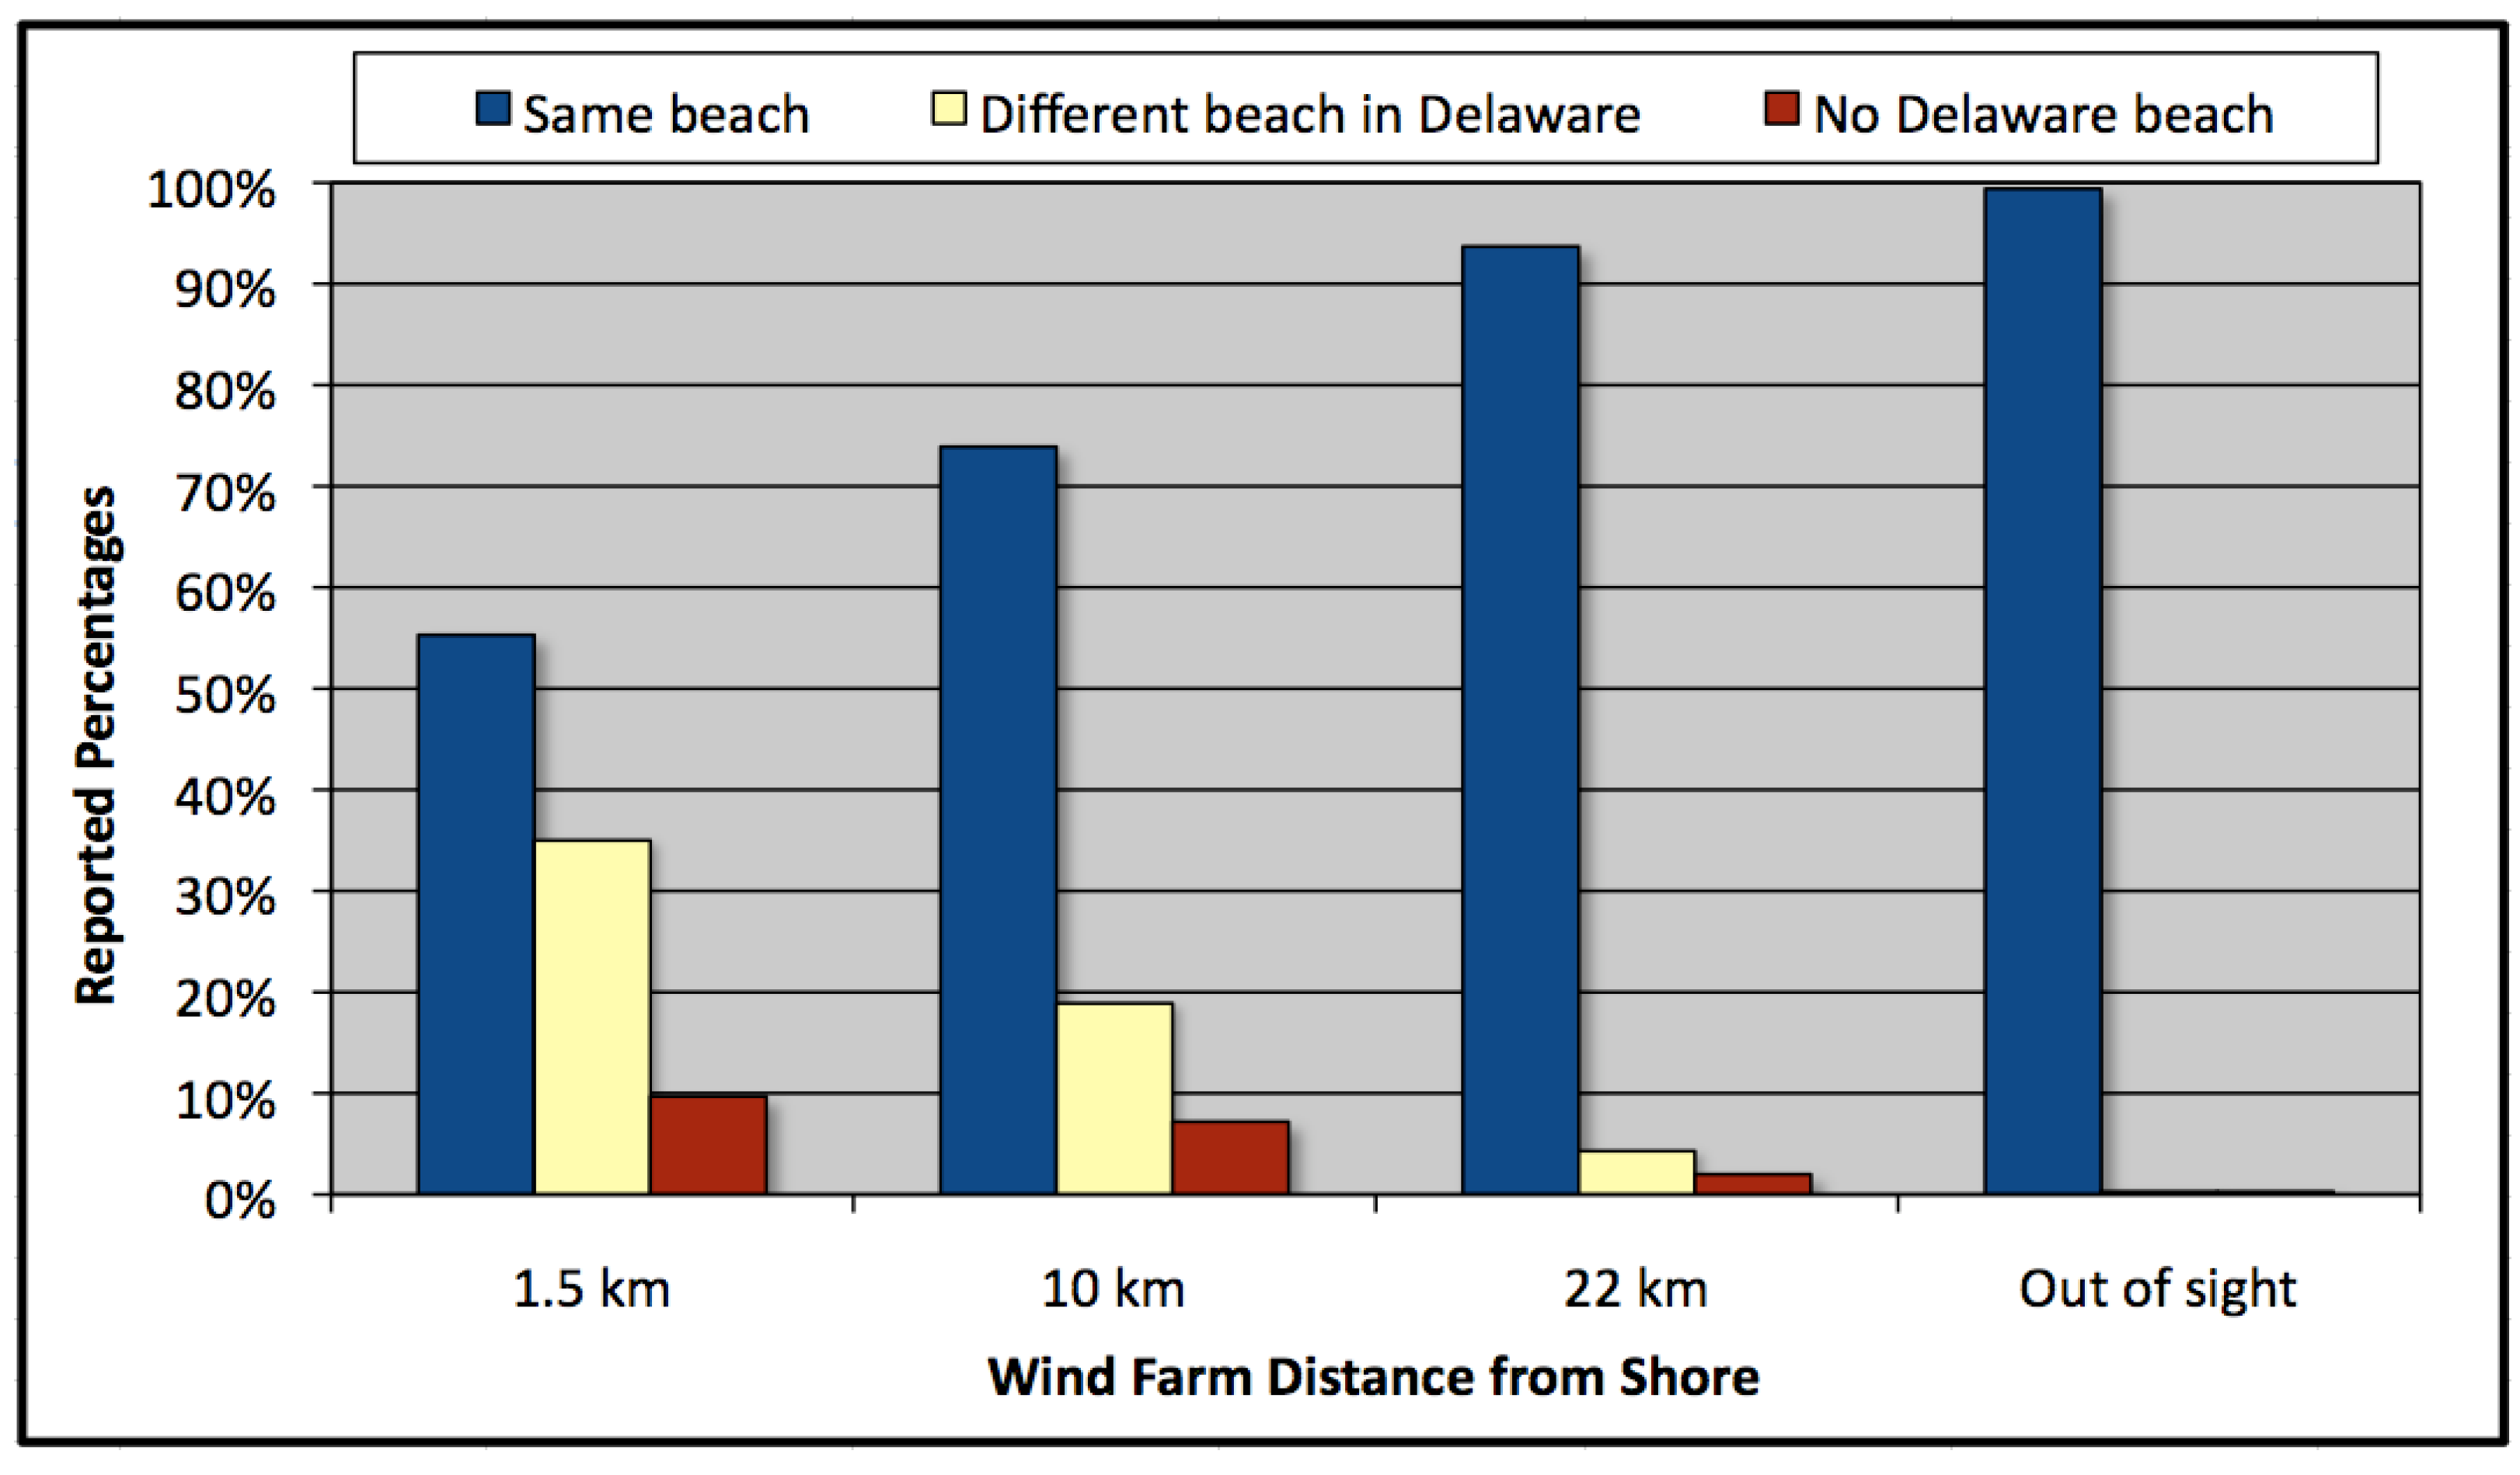
Figure 1.
Reported visitation at varying wind farm distances (n = 983).
Figure 1.
Reported visitation at varying wind farm distances (n = 983).
The reported loss of tourism at the closest distance (1.5 km) is substantial, with almost 45% stating they would switch to another Delaware beach or not go to a Delaware beach at all. With increasing wind farm distances from shore, however, progressively fewer respondents report diversion from Delaware beaches. These results are consistent with those of Krueger [
15], and are also predictable considering that visual impact is one source of opposition to wind power [
45] and that the ocean view is presumably one amenity sought by beachgoers given advertisements for and higher prices of accommodations with an ocean view. Some diversion to another beach, albeit marginal, is still reported when the turbines are “out of sight,” suggesting reasons for opposing offshore wind other than visual aesthetics.
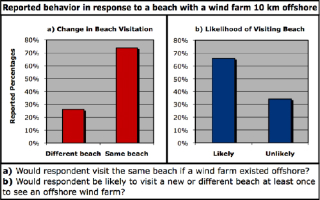
A 2006 survey asked Delaware residents a similar question regarding the potential effect of a wind farm situated 10 km offshore on their beachgoing behavior [
8]. Here we compare responses to questions across these two surveys, which used the same visualizations, but with slightly different wording (500 versus 200 turbines; and asking respondents to recall their most recent beach visit versus the present one).
Almost identical percentages of out-of-state beachgoers (93%) and Delaware residents (94%) indicate that they would continue to visit a beach in Delaware if a wind farm existed 10 km from shore. However, a smaller percentage of out-of-state beachgoers (74%) than Delaware residents (89%) reported that they would have gone to the same Delaware beach. Of those saying they would either move to another beach in Delaware or to a beach in another state, a greater percentage of Delaware residents (51%) report that they would likely switch to a different Delaware beach than out-of-state tourists (28%) [
8]. These findings make sense. First, presumably, Delaware residents are more likely to take more frequent and shorter trips to local beaches due to their closer proximity to them than out-of-state beachgoers. Typically traveling greater distances, those from out-of-state are more likely to plan less frequent, but longer trips, and may therefore be more selective when choosing their annual holiday beach location. Second, switching to non-Delaware beaches may present more of an economic hardship in terms of additional travel costs (measured in time and out-of-pocket outlays) for Delaware residents than, for example, Maryland, Pennsylvania or New Jersey residents. Third, Delaware residents also may have a sense of greater fealty to Delaware beaches than out-of-state visitors. Finally, although both residents and tourists are exposed to the perceived visual disamenity, local residents stand to benefit from employment at a nearby wind farm or from the profit-sharing venture of allowing wind turbines to operate on their property, whereas temporary residents or tourists, who tend to be financially independent of the region, do not [
26,
27].
For each of these beach amenity characteristics, denoted above in
Table 3, we conducted a difference-of-means test between those who would go to a Delaware beach with an offshore wind farm and those who would switch to an out-of-state beach. None of the means were significantly different from each other except for the desirability of vehicle access on the beach. Those who would continue visiting a Delaware beach with an offshore wind farm value vehicle access on the beach significantly more than those who would not continue visiting a Delaware beach. This finding is reasonable; respondents who desire vehicle access understandably would be more amenable to additional uses of the coast, such as offshore wind development, compared to those looking for a more pristine beach not subject to multiple uses. Additionally, there may not be good substitutes for beaches with vehicle access in neighboring states.
Furthermore, stated visitation if there were an offshore wind farm, and the attitudes toward and perceived effects of offshore wind power (presented in
Table 4) are positively and significantly correlated (at the 1% level) with each other. These findings are intuitive, illustrating that as wind power attitudes and perceived effects among respondents become more positive, reported visitation at Delaware beaches with offshore wind development increases as well.
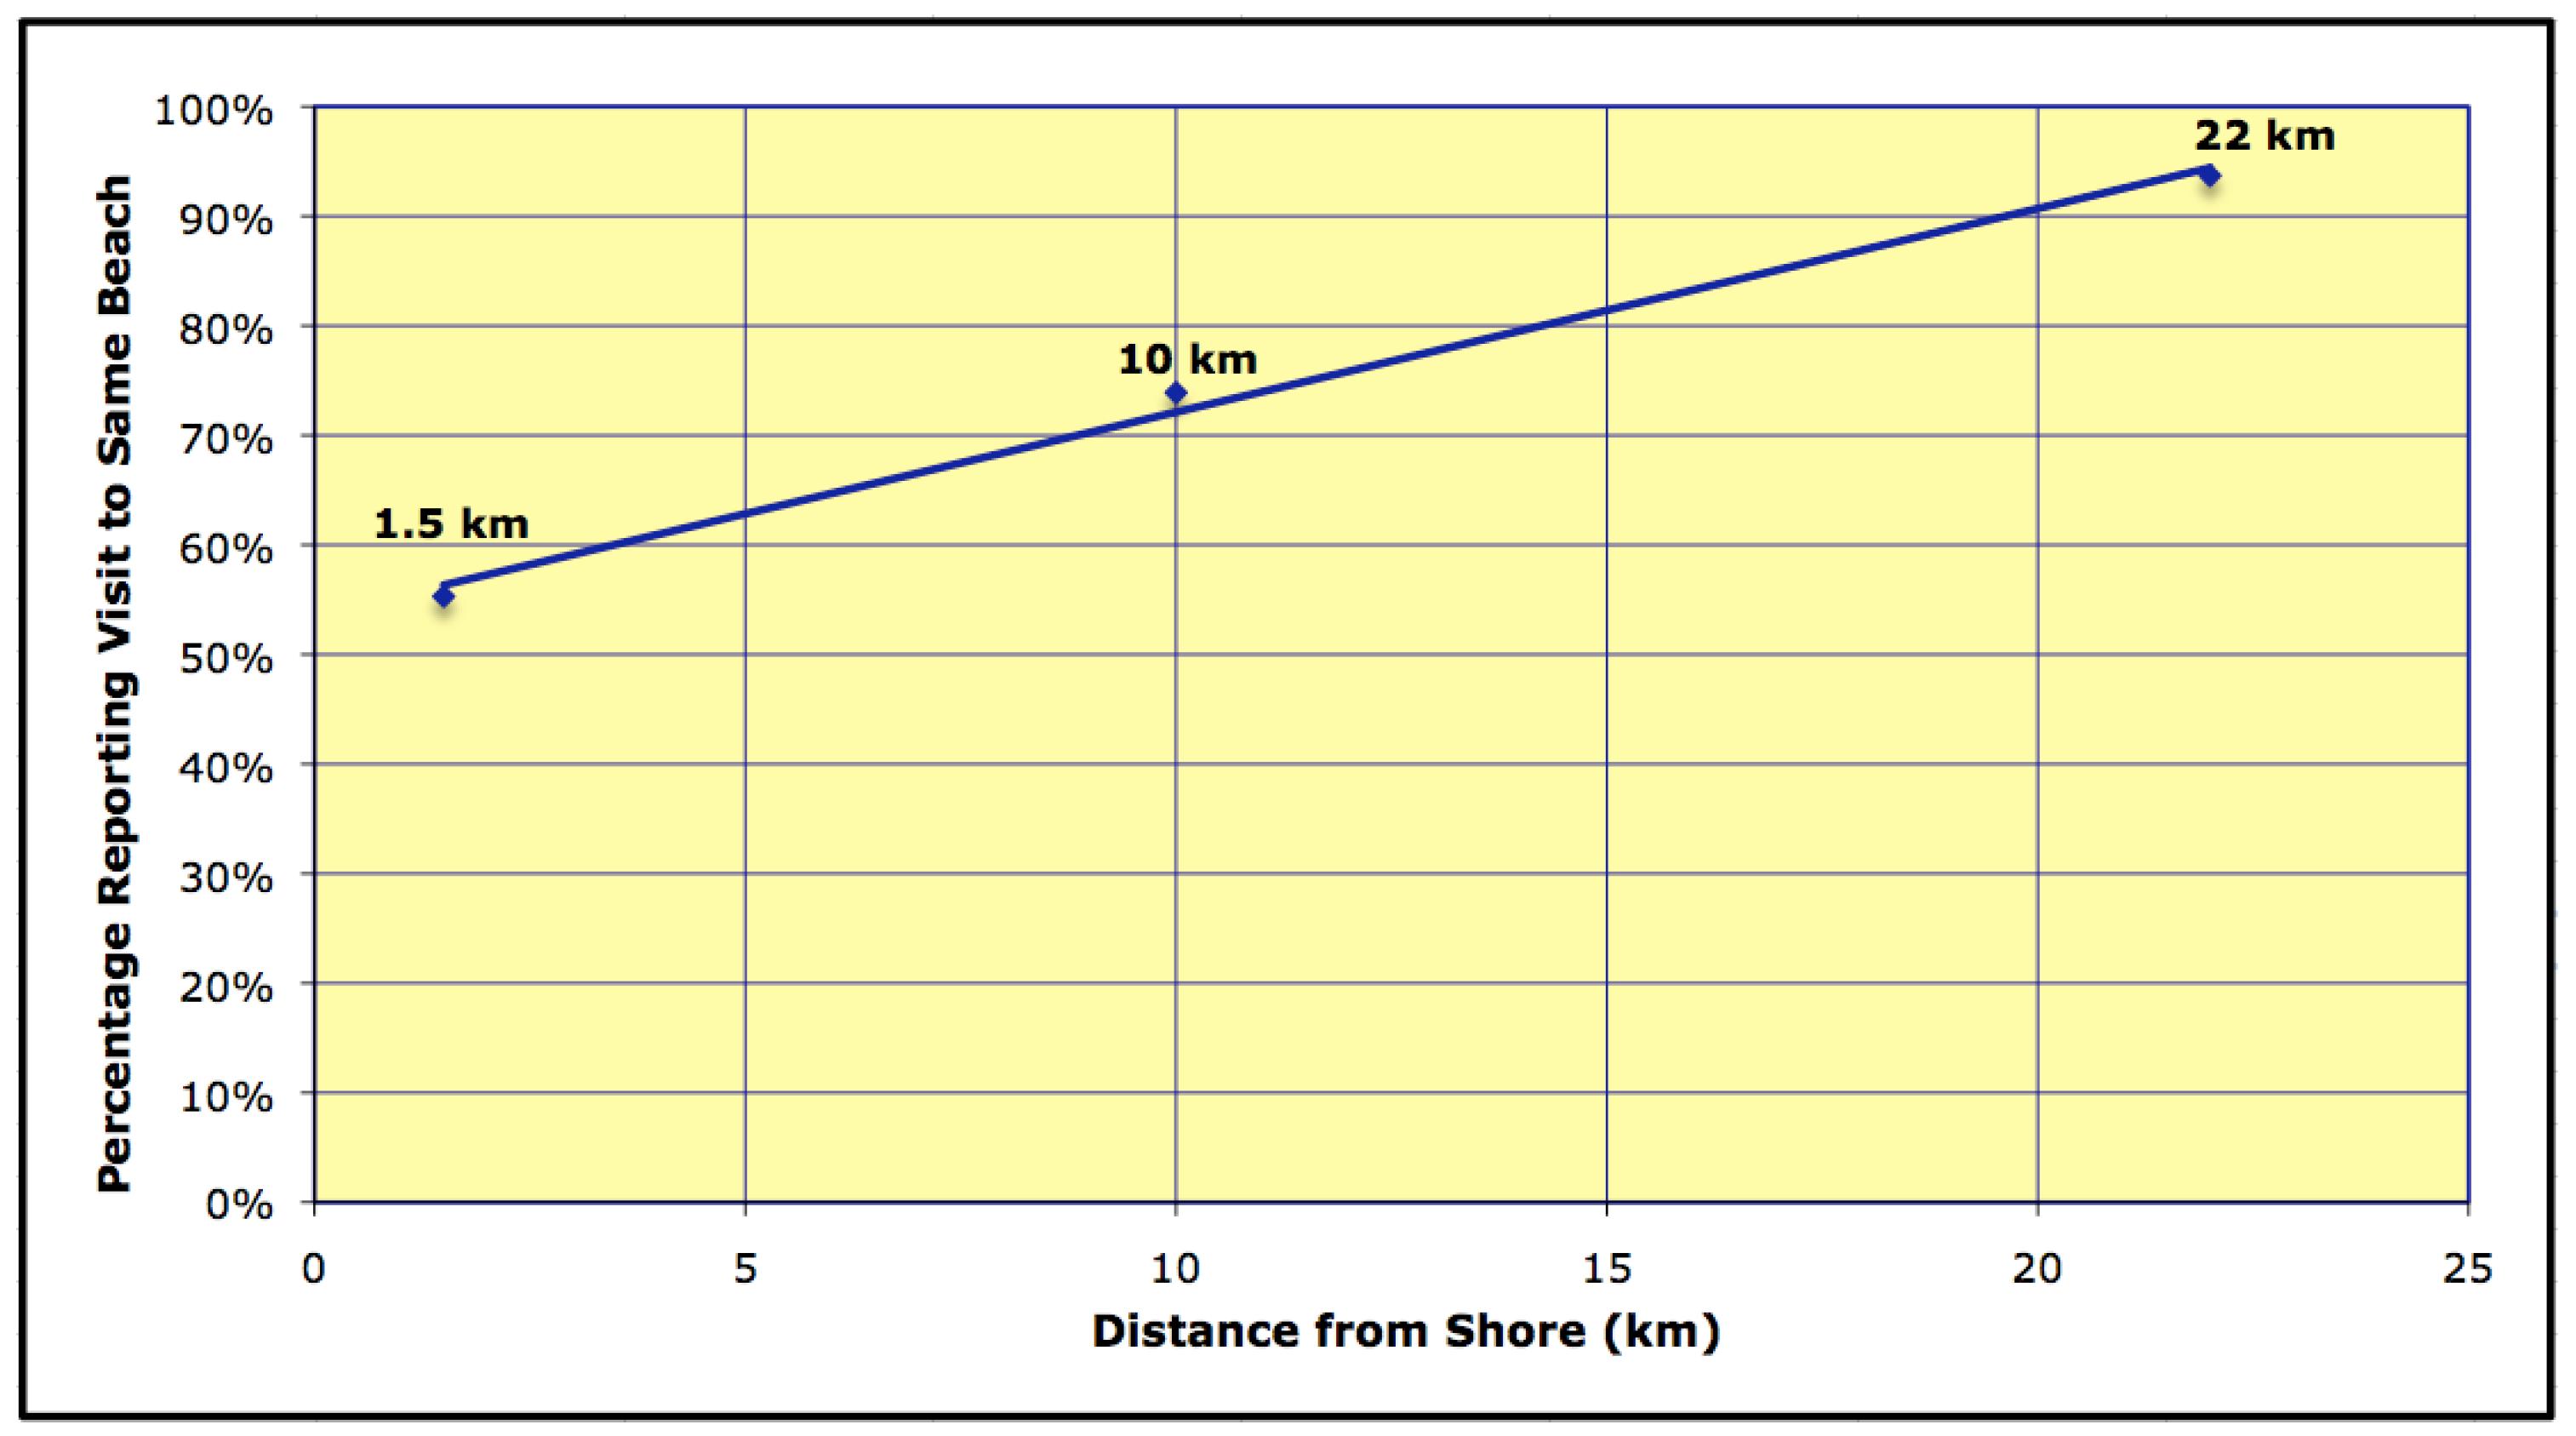
Figure 2 graphs the percentage of respondents choosing “same beach” as a function of distance when wind turbines are in view. It can thus be used to predict the number of tourists who would report switching at any given distance within the range. For example, at 22 km offshore (the approximate distance proposed for Delaware’s Bluewater Wind, LLC development) an estimated 8% would report that they would switch to another beach if shown a similar simulated view at that distance, although a much smaller percentage (~2%) would shift out-of-state. This estimate is high, however, because the Bluewater wind farm will be further than 22 km from some beaches, and indeed, will not be visible from some. According to
Figure 2, an offshore wind farm constructed 16 km from shore would result in 17% of beachgoers visiting another beach, although again, the majority of these shifts would occur within, rather than beyond, Delaware. This estimate is likewise high, given that the data upon which it is based assumes that the wind farm would be located adjacent to each Delaware beach.
Figure 2.
Acceptance of offshore wind in view.
Figure 2.
Acceptance of offshore wind in view.
Although the surveys of Delaware residents [
46] and tourists indicate that wind farms present visual disamenities, the decision of whether to locate a new wind farm cannot be made in isolation but must consider the tradeoffs among various means of generating electricity [
47,
48]. When respondents were presented with two different beach visit scenarios—(1) a wind farm located 10 km from shore; and (2) a coal or natural gas power plant located the same distance inland—73.6% stated they would visit the same beach with the wind farm, whereas 61.1% stated they would visit the same beach with the coal plant. It is worth noting that a large coal power plant exists approximately 14.5 km from the Delaware coast [
8]. Even though the wind farm would be more intrusive on the ocean view, the posited coal or natural gas power plant thus reduces visitation by 12.5% more than does the hypothetical offshore wind farm. This difference in beach avoidance is statistically significant. These results account for respondents who may have known about the nearby coal plant and chose to visit the beach anyway, whereas other beachgoers, not sampled in this survey, may have visited another beach to avoid it. Thus, the coal-plant diversion effect may be greater than 61.1%.
An alternative explanation of this inconsistency—whereby people say they would avoid a beach with a nearly coal plant, even though they were on such a beach when interviewed—is that some fraction of respondents use this type of visitation question to “vote” against various types of energy development. If the “voting” explanation is correct, then our finding can be interpreted as meaning that more people are opposed to a nearly coal plant they cannot see than are opposed to a wind development in their ocean view.
4.3.2. Contingent Behavior Modeling
The following multivariate logistic regression model predicts a given tourist’s reported likelihood of visiting a Delaware beach with a wind farm 10 km from shore, based on trip-related and demographic factors. Due in part to Delaware’s small coastline, state policy regarding the tourism effects of offshore wind power is likely to consider any tourism loss statewide, rather than in-state tourism losses or shifts. Thus, we model whether or not a visitor is likely to switch to an out-of-state beach. More specifically, the dependent variable is assigned a “1” if a tourist reported he or she is likely to visit either the same beach or another beach in Delaware and a “0” if otherwise. Given that there is more variation in the dependent variable at 10 km than at 22 km, and 10 km represents a reasonable distance at which development might occur, we model this question based on responses at 10 km.
Table 7 presents the model’s coefficient estimates and other regression statistics.
Table 7.
Logit regression of the likelihood of visiting a Delaware beach if a 10-kilometer wind farm existed off the coast of sampled tourist destination.
Table 7.
Logit regression of the likelihood of visiting a Delaware beach if a 10-kilometer wind farm existed off the coast of sampled tourist destination.
| Variable | Coefficient | Odds ratio | Standard error | p-value |
|---|
| No lodging cost | –0.055 | 0.946 | 1.313 | 0.966 |
| Mean lodging cost (natural log) | –0.216 | 0.805 | 0.183 | 0.237 |
| Mean income (natural log)* | –0.923 | 0.397 | 0.508 | 0.069 |
| Own property | –0.991 | 0.371 | 0.867 | 0.253 |
| Age below30** | 2.221 | 9.215 | 0.869 | 0.011 |
| Have seen wind turbine before | 0.356 | 1.427 | 0.537 | 0.508 |
| Surveyed on a boardwalk*** | 2.298 | 9.950 | 0.842 | 0.006 |
| Surveyed at Cape Henlopen** | 2.065 | 7.889 | 0.995 | 0.038 |
| 16 or 17 year old in group** | 1.238 | 3.450 | 0.620 | 0.046 |
| Constant** | 13.838 | | 5.498 | 0.012 |
| N | 542† | | |
| Chi-square | 48.71 | | |
| P value | 0.0000 | | |
| Pseudo R2 | 0.1581 | | |
The model fits the data well, with a likelihood ratio statistic significant at the 0.0001 level. Excluding the constant, the model has one significant variable at the 1% level, three at the 5% level, and one borderline significant at the 10% level.
We generated histograms for expenditures (lodging cost—a proxy for trip expenditures) and income to examine whether those measures’ probability distributions are more log normal or linear normal. We found lodging expenditures to be bimodal in distribution due to a large component of sampled tourists who spent no money for lodging on their beach trip. When this zero-expenditure group is excluded, the lodging-cost distribution appears log normal. Income likewise appears log normal. We therefore logged the variables for income and lodging expenditures and included them in the model, with a dummy variable to control for those who did not spend any money on lodging (day-trippers). The negative yet insignificant coefficients on the ‘No lodging cost’ and ‘Mean lodging cost’ variables imply the lack of an effect of trip expenditures on the likelihood of continuing beach visits. Higher income, however, may reduce that likelihood, as the effect is borderline significant (p = 0.069). Interestingly, logistic modeling results (not presented here) further reveal that beachgoers with higher income are significantly less likely (p = 0.041) to visit a beach not typically or never before visited, to see a wind farm. Thus, individuals who have higher incomes are less likely to visit both familiar and unfamiliar beaches with offshore wind farms, all else constant.
The variable measuring whether a respondent has previously seen a wind turbine (land or sea-based) has a positive yet insignificant coefficient. The odds of continuing to visit a Delaware beach increase significantly, by a factor of 9.2 (since the logit is the log of the odds, the exponential of the logit provides the odds of the outcome—in this case, a visit to either the same beach or another beach in Delaware—and thus exp (2.221) = 9.2 [
49]), when the respondent is below 30 years of age, holding all else constant. In a survey examining the visual impacts of offshore wind turbines, Bishop and Miller [
37] found a similar age effect, with the youngest age group having significantly more positive responses than the oldest. This effect may be attributable to the overall negative correlation between increasing age and environmental concern [
50]. Younger generations also may not have as much of an attachment to place, and further, may be more willing to embrace, or at least be less risk averse to, new technology.
The boardwalk survey variable is the most significant and influential predictor in the model, with the odds of continuing to visit a Delaware beach increasing by a factor of about ten if the respondent was sampled on the boardwalk, as opposed to on the beach (Cape Henlopen State Park, discussed next, is the only exception). This finding is intuitive, considering that tourists on the boardwalk presumably tend to be less focused on the seascape than those on the beach, and instead more focused on other beach area attractions such as shops and restaurants.
Similarly, the odds of visiting a Delaware beach significantly increase by a factor of about eight if the respondent was sampled at Cape Henlopen State Park rather than at the other beach locations, all else constant. Given that out-of-state visitors to Delaware’s three state parks (Cape Henlopen, Delaware Seashore, and Fenwick Island) seek more natural beach characteristics than those found at more developed Delaware beaches (for example, Rehoboth, Bethany, and Dewey beaches) we analyzed the routes that tourists most likely traversed from their points of origin to reach Cape Henlopen, Delaware’s northernmost state park. If distance traveled affected the beach choice decision, Delaware Seashore State Park could serve as a convenient substitute for Cape Henlopen. Cape Henlopen, however, differs from Delaware Seashore (and Fenwick Island) State Park in that those visiting it are less likely doing so solely for the beach experience. Compared to the other Delaware state parks, Cape Henlopen offers a more diverse range of outdoor activities for visitors, including hiking and biking along forest trails and ponds, whereas the other state parks, primarily (if not exclusively) attract tourists who visit specifically to sunbathe, swim, surf fish, etc. The significantly greater likelihood of visiting Cape Henlopen if a wind farm was built 10 km offshore, compared to the other Delaware beaches, may therefore be attributable to the lack of adequate, proximate substitutes to Cape Henlopen, given its unique and diverse natural amenities.
Last, for each additional 16 to 17 year-old in a family, the odds of visiting either the same beach with turbines 10 km from shore or another beach in Delaware increase by a factor of 3.45, all else held constant. Contrastingly, neither the number of children (from 0 to 15 years) nor the presence of any children (yes or no) in a given household was significant (neither variable was included in the final model). Older teenagers may have strong beach preferences irrespective of whether a wind farm is present (for example, they may have preferences for non-beach amenities in the adjacent town or their teenage friends may vacation in the beach/town they are visiting) and their parents may not wish to override those preferences.
4.3.3. Excluded Variables and Diagnostics Employed
Neither sex nor education significantly influenced the likelihood of visiting a Delaware beach with a wind farm 10 km from shore. Similarly, due to their insignificance, none of the variables measuring either the frequency of beach visits (number of days spent visiting a US beach in the past year, number of days spent at a Delaware beach in the past year, and number of trips made to Delaware that included a beach visit in the past 5 years) or the duration or timing of the present trip (number of days, number of nights, and weekend trip) were included in the model presented. Given Ladenburg’s finding that attitude formation toward offshore wind power is closely associated with the frequency and type of beach visits [
25], this finding may at first appear surprising. However, his study examined attitudes among Danish residents toward existing offshore wind farms, whereas none of the out-of-state tourists in this study have had any experience with offshore wind turbines, at least not along Delaware’s coast.
Finally, a number of variables measuring attitudes toward and perceived effects of wind power were not included in the beach visitation model because those variables were endogenous. Endogeneity occurs when the relationship between the dependent variable and the specified independent variables is bidirectional, or simultaneous; in such cases, the variables in the model are jointly, or mutually, determined [
51]. Additional endogenous variables excluded from the model are those measuring the desirability of beach amenities or features (presented in
Table 3) as well as the perceived effect of wind power on climate change.
The VIF (Variance Inflation Factor) diagnostic was used to formally test for multicollinearity among the explanatory variables specified in the offshore wind beach visitation model. None was found.


