Article

Kaolinite and Silica Dispersions in Low-Salinity Environments: Impact on a Water-in-Crude Oil Emulsion Stability

1
Department of Geology and Geophysics/Dept. 3006, 1000 E. University Ave., University of Wyoming, Laramie, WY 82071, USA
2
Department of Chemical and Petroleum Engineering/Dept. 3295, 1000 E. University Ave., University of Wyoming, Laramie, WY 82071, USA
*
Author to whom correspondence should be addressed.
Energies 2011, 4(10), 1763-1778; https://doi.org/10.3390/en4101763
Submission received: 11 August 2011 / Revised: 17 October 2011 / Accepted: 19 October 2011 / Published: 24 October 2011
(This article belongs to the Special Issue Advances in Petroleum Engineering)

Abstract

:
This research aims at providing evidence of particle suspension contributions to emulsion stability, which has been cited as a contributing factor in crude oil recovery by low-salinity waterflooding. Kaolinite and silica particle dispersions were characterized as functions of brine salinity. A reference aqueous phase, representing reservoir brine, was used and then diluted with distilled water to obtain brines at 10 and 100 times lower Total Dissolved Solid (TDS). Scanning Electron Microscope (SEM) and X-ray Diffraction (XRD) were used to examine at the morphology and composition of clays. The zeta potential and particle size distribution were also measured. Emulsions were prepared by mixing a crude oil with brine, with and without dispersed particles to investigate emulsion stability. The clay zeta potential as a function of pH was used to investigate the effect of particle charge on emulsion stability. The stability was determined through bottle tests and optical microscopy. Results show that both kaolinite and silica promote emulsion stability. Also, kaolinite, roughly 1 μm in size, stabilizes emulsions better than larger clay particles. Silica particles of larger size (5 µm) yielded more stable emulsions than smaller silica particles do. Test results show that clay particles with zero point of charge (ZPC) at low pH become less effective at stabilizing emulsions, while silica stabilizes emulsions better at ZPC. These result shed light on emulsion stabilization in low-salinity waterflooding.

1. Introduction

Pickering or particle-stabilized emulsions were reported for the first time at the dawn of the 20th century [1]. This type of emulsions is stabilized by the attachment of fine particles at the water-oil interface. A variety of particles, including clays and silica, can be used to stabilize this type of emulsions. The same holds for foams, as particles can accommodate at the water-gas interface [2]. Pickering emulsions are of interest in numerous industries [3,4]. This type of emulsions exhibit interesting rheological properties as well as considerable kinetic stability. Arditty et al. [3] show that silica particles with surfaces that have been treated for wettability alteration can be used to stabilize either O/W (partially hydrophobized silica) or W/O (hydrophobized silica) emulsions. As a rule of thumb, the continuous phase of the emulsion is normally the one in which the particles are preferentially dispersed [4]. The rheology of high concentration emulsions reflects the rigidity of the interface, which is not controlled by interfacial tension [3]. A number of factors impact the stability of Pickering emulsions [2,5,6], including composition of the oil phase, particle type, phase volume fraction, salinity, pH and temperature, among others.
Solid-stabilized emulsions represent a challenge during the production of bitumen from the Canadian Athabasca oil sands [7]. Clays, mainly montmorillonite and kaolinite, have been identified as significant contributors to the stability of bitumen emulsions. Liu et al. [7] used zeta potential distribution measurements to study the interaction between bitumen and clay in aqueous solutions. In the absence of calcium, a mixture of bitumen emulsion and montmorillonite or kaolinite clay suspensions shows a bimodal zeta potential distribution. This is an indicator of the weak interaction between the two and a poor drop coating. Calcium suppresses the zeta potential for all the three components. When calcium is added to a mixture containing up to 1 mM calcium concentration, the potential distribution became unimodal, as opposed to results for kaolinite.
Yan and Masliyah [8] studied the effect of pH on attachment and detachment of clay particles at oil-water interface. Kaolinite clay particles treated with asphaltenes were used for this purpose. Under similar emulsification conditions, higher pH of the brine results in larger diameter of the oil droplet. At pH 7, the creamed emulsions were redispersed into the aqueous phase. The clays desorbed from the oil surface at pH > 6, but adsorbed onto the oil droplet surface at pH < 6. Micropipette experiments demonstrate the formation of a viscoplastic skin on the surface of bitumen droplets in aqueous environments with dispersed clays [9]. Increased interfacial plasticity is prominent in deionized water with montmorillonite and calcium present. Process water for the same clay and high concentration of calcium does not lead to the same plastic behavior of the drop skin. A modified micropipette experiment was used to evaluate the interfacial rheology in similar bitumen systems [10,11]. The plastic behavior observed in previous experiments is confirmed in these rheological tests.
Ngai et al. [12] used stimulus-sensitive microgel particles as an emulsifier. The resulting emulsions were responsive to pH, ionic strength and temperature changes which lead to changes in particles charge and hydrophobicity. Stable oil-in-water (octanol in water) emulsions were generated at high pH, while lowering pH to below 6.0 led to continuous coarsening of the emulsions. Tight packing of the particles at the highly charged oil-water interface suggests capillary attraction, as suggested in the literature [13]. In microgel dispersions, high salt concentration reduces particle activity at the interface, leaving oil droplets unprotected. On the other hand, Ngai et al. [12] argue that reduced average emulsion drop size caused by increased concentration of microgel particles can be explained by the augmented coverage of the surface.
Yang et al. [14] studied the stability of paraffin-water emulsions, stabilized with positively-charged plate-like layered double hydroxides particles. They determined the effect of pH on the stability of this type of Pickering emulsions. They argue that the attachment of particles at interfaces may be controlled by adjusting the electrostatic interaction between particles and the interface without changing hydrophobicity, which is thought to be a main controlling factor of emulsion type and stability. Electrostatic interactions are altered by changes in pH of the continuous phase, by addition of concentrated aqueous solutions of either NaOH or HCl under a N2 atmosphere. Zeta potential measurements were carried out as characterization of the surface charge of the particles. Based on arguments of reduction of interfacial energy [ Energies 04 01763 i001], the so-called attachment energy, it was argued that a reduction in particle surface charge (or zeta potential) would lead to flocculation and therefore would increase attachment energy. The little observed influence of this is due to the kinetic control of the attachment process. Increased stability with increased particle concentration is due to better surface coverage, according to Yang et al.
Sztukowski and Yarraton [6] studied W/O emulsion stability with clays. They used heptane, toluene, asphaltenes as model fluids and native solids extracted from oilfield operations. They found that a combination of asphaltene and fine solids (submicron scale) coverage produced the most stable emulsions. They argue that fine solids compete with asphaltenes to adsorb at the interface and that a coverage of the interface by asphaltenes between 60 to 80% and the remaining area covered by fine solids leads to the greatest stability. Coarser solids (above 1 µm) can indeed stabilize emulsions, but only if they are in sufficiently high concentration. Apparently, asphaltene coverage does not contribute to stability in the case of coarse solids. Coarse solids tend to form bridges between droplets, particularly when they are present at high concentration.
Formation of particle networks has been determined by X-ray microscopy [15]. These networks can indeed alter the rheology of the continuous phase, but this is probably insufficient to justify the stability of emulsions in these environments. The structure and strength of particle networks are very sensitive to ionic strength and pH of the solution. A combination of surface coverage by solid particles and hindrance of drop coalescence by these networks (and likely increase in viscosity of the continuous phase) may lead to better stability of emulsions.
The main objective of this work is to evaluate the conformation of kaolinite dispersions, a clay commonly found in sandstone, in conditions typical of low-salinity waterflooding. Silica particles of various sizes were also dispersed in similar aqueous phases for comparison purposes. To evaluate the impact of surface charge density, pH was adjusted to sweep a broad range from acid to alkaline solutions. A proposed mechanism in low-salinity water-flooding has been associated with the detachment of clays and other colloids. One potential mechanism is the formation of Pickering emulsions, which can reduce water mobility by pore-throat plugging. In order to prove this, emulsion stability must be determined as per the influence of suspended particles. Emulsions can act as mobility control agents and hence contribute to enhanced oil recovery. The impact of these dispersions on a water-in-oil emulsions stability is investigated in this work through bottle tests. Although the particles are not purposely conditioned in the reservoir native state, the results of this work should shed light on the impact of suspended particles in low-salinity environments. If conditions in bottle tests are akin to those in porous media, then the feasibility of stabilizing emulsions in porous media can be a viable contributing mechanism in low-salinity water injection.

2. Experimental Section

2.1. Materials

Two sources of clay, kaolinite, and one of silica, with three different diameters, were used in experiments. The first type of kaolinite was purchased from Ward’s Natural Science. The presentation of this clay is as a block of material that we subjected to grinding to produce a micro-particulate, with average grain size of 6 µm. Preliminary dispersion experiments in brine yielded average particle size of 5–8 µm. Kaofine, a commercial kaolinite, was purchased from Thiele Kaolin Company. The product is delivered as a powder with 98% in diameter smaller than 2 µm. Spherical silica beads (Polysciences, Inc.) were purchased in three average sizes: 1, 3 and 5 µm in diameter. The silica particles come suspended in distilled water to keep them dispersed. Upon arrival, the silica is dried according to a standard procedure specified by the vendor:
  • Centrifuge for 5 min to form a tight pellet
  • Draw off supernatant and resuspend in 25% solvent/75% water
  • Repeat with 50, 70 and 100% solvent solutions
  • Heat in an oven at 70 °C for 24 h, after which crush the pellet and dry again
The synthetic brine (MLB), resembling brine from a Minnelusa reservoir in Wyoming, is prepared with analytical-grade reagents and distilled water. Weight fractions of salts dissolved in distilled water, used to prepare the brine, can be found in Table 1. The total dissolved solid (TDS) concentration is 38,651 ppm. The brine was diluted 10 and 100 times, and labeled 0.1MLB and 0.01MLB accordingly (1MLB stands for the originally prepared brine).
Table 1. Synthetic brine composition.
SpeciesFraction (ppm)
NaCl29,803
CaCl22104
Na2SO45903
MgSO4841
TDS38,651
Filtered Gibbs field crude oil (MLO) was used as the oil phase in all tests. Its viscosity and density are 73.5 cp @ 25 °C and 0.9211 g/mL @ 22 °C, respectively. The crude oil asphaltene content is ~9–10%.

2.2. Experimental Procedures

Solids are suspended in brine followed by dispersion using an ultrasonic probe at 50% of the maximum power delivery capacity of the probe (500 watt) for 2 min. The clays are observed using Scanning Electron Microscope (SEM) to infer the shape of the clay particles and X-ray Diffraction (XRD) is used to determine their chemical composition. Particle size distribution for the solids in aqueous media is measured using a size distribution analyzer (Microtrac S3500) based on light diffraction. Zeta potential is measured using a Malvern Zetasizer using electrophoresis to estimate changes in surface charge.
Emulsions are prepared by adding a predetermined amount of oil to a volume of brine with or without dispersed particles in it to attain a desired water-to-oil ratio. Then a homogenizer (Ultra Turrax T 25 basic, IKA WERKE) at 6500 rpm for 3 min is used to generate the emulsion. The initial tests were carried out using an 18 mm dispersion tool, which was later replaced with a 10 mm in diameter tool to limit bubble generation and to allow for lower liquid volumes. The smaller dispersion tool reduces fluid losses on the surface of the tool and in the channel between stator and rotor by almost 2/3. Most experiments with solid particles suspended are carried out at 1-to-1 oil-to-water ratio. This ratio was selected to prepare Pickering emulsions, because the stability of emulsions with particles is moderate under these conditions, which means they can be broken using a centrifuge.

2.2.1. Procedure for PH Alteration

To determine the ZPC of particle dispersion, pH of brine is adjusted from 2 to 11 by dripping 10% HCl or 10% NaOH solution with a pipette while keeping pH probe in the brine and manually carefully shaking the bottle to accelerate dissolution of HCl or NaOH.

2.2.2. Bottle Test

Emulsion stability is determined by measuring the resolved volume (resolution) of the dispersed phase (typically water) separated from the emulsion as a function of time, which is called bottle test [16]. This determination reflects stability with respect to phase separation driven by gravitational segregation. This method has been shown to be consistent with electrorheology (ER) [17,18] and drop-size distribution through optical microscopy [19]. In ER, the critical electric field (CEF) expresses stability through the value of electric field that causes current percolation and irreversible changes to the emulsion structure. Time evolution of the drop-size distribution also reflects the relative stability of emulsions [19].

3. Results and Discussion

3.1. Solids Characterization

SEM images of the particles are shown in Figure 1. On the left portion of the figure, 3 µm-in-average silica particles can be seen (the micrograph was provided by the vendor). The particles are quite round and monodispersed, which was confirmed by particle-size analysis. Kaolinite (central micrograph in Figure 1) exhibits the plate-like shape typical of naturally occurring kaolinite, but the sheets of the aluminosilicate are flocculated, probably due to the ionic strength of the aqueous phase used to prepared the material for SEM. Kaofine (fine kaolinite) material is shown on right portion of Figure 1. Although not as evident as kaolinite, kaofine appears to consist of fine plate-like grains. Intense flocculation probably occurs during dispersion of kaofine in distilled water. Figure 2 shows the XRD spectra, including the reference (in blue), which confirms that the two minerals are similar in chemical composition typically Al2Si2O5(OH)4.
Figure 1. SEM image of a silica (left), kaolinite (center) and Kaofine (right).
Energies 04 01763 g001
Figure 2. XRD spectra for kaolinite (top) and Kaofine (bottom). Reference is in blue.
Energies 04 01763 g002

3.2. Zeta Potential

Due to excessive polarization of the electrodes at high salinity, results for zeta potential are presented for 0.1MLB and 0.01MLB brines only. Each zeta potential measurement was repeated 3 times to determine reproducibility. The error bar, representing standard deviation with respect to mean value, is typically smaller than the symbols in the plots.
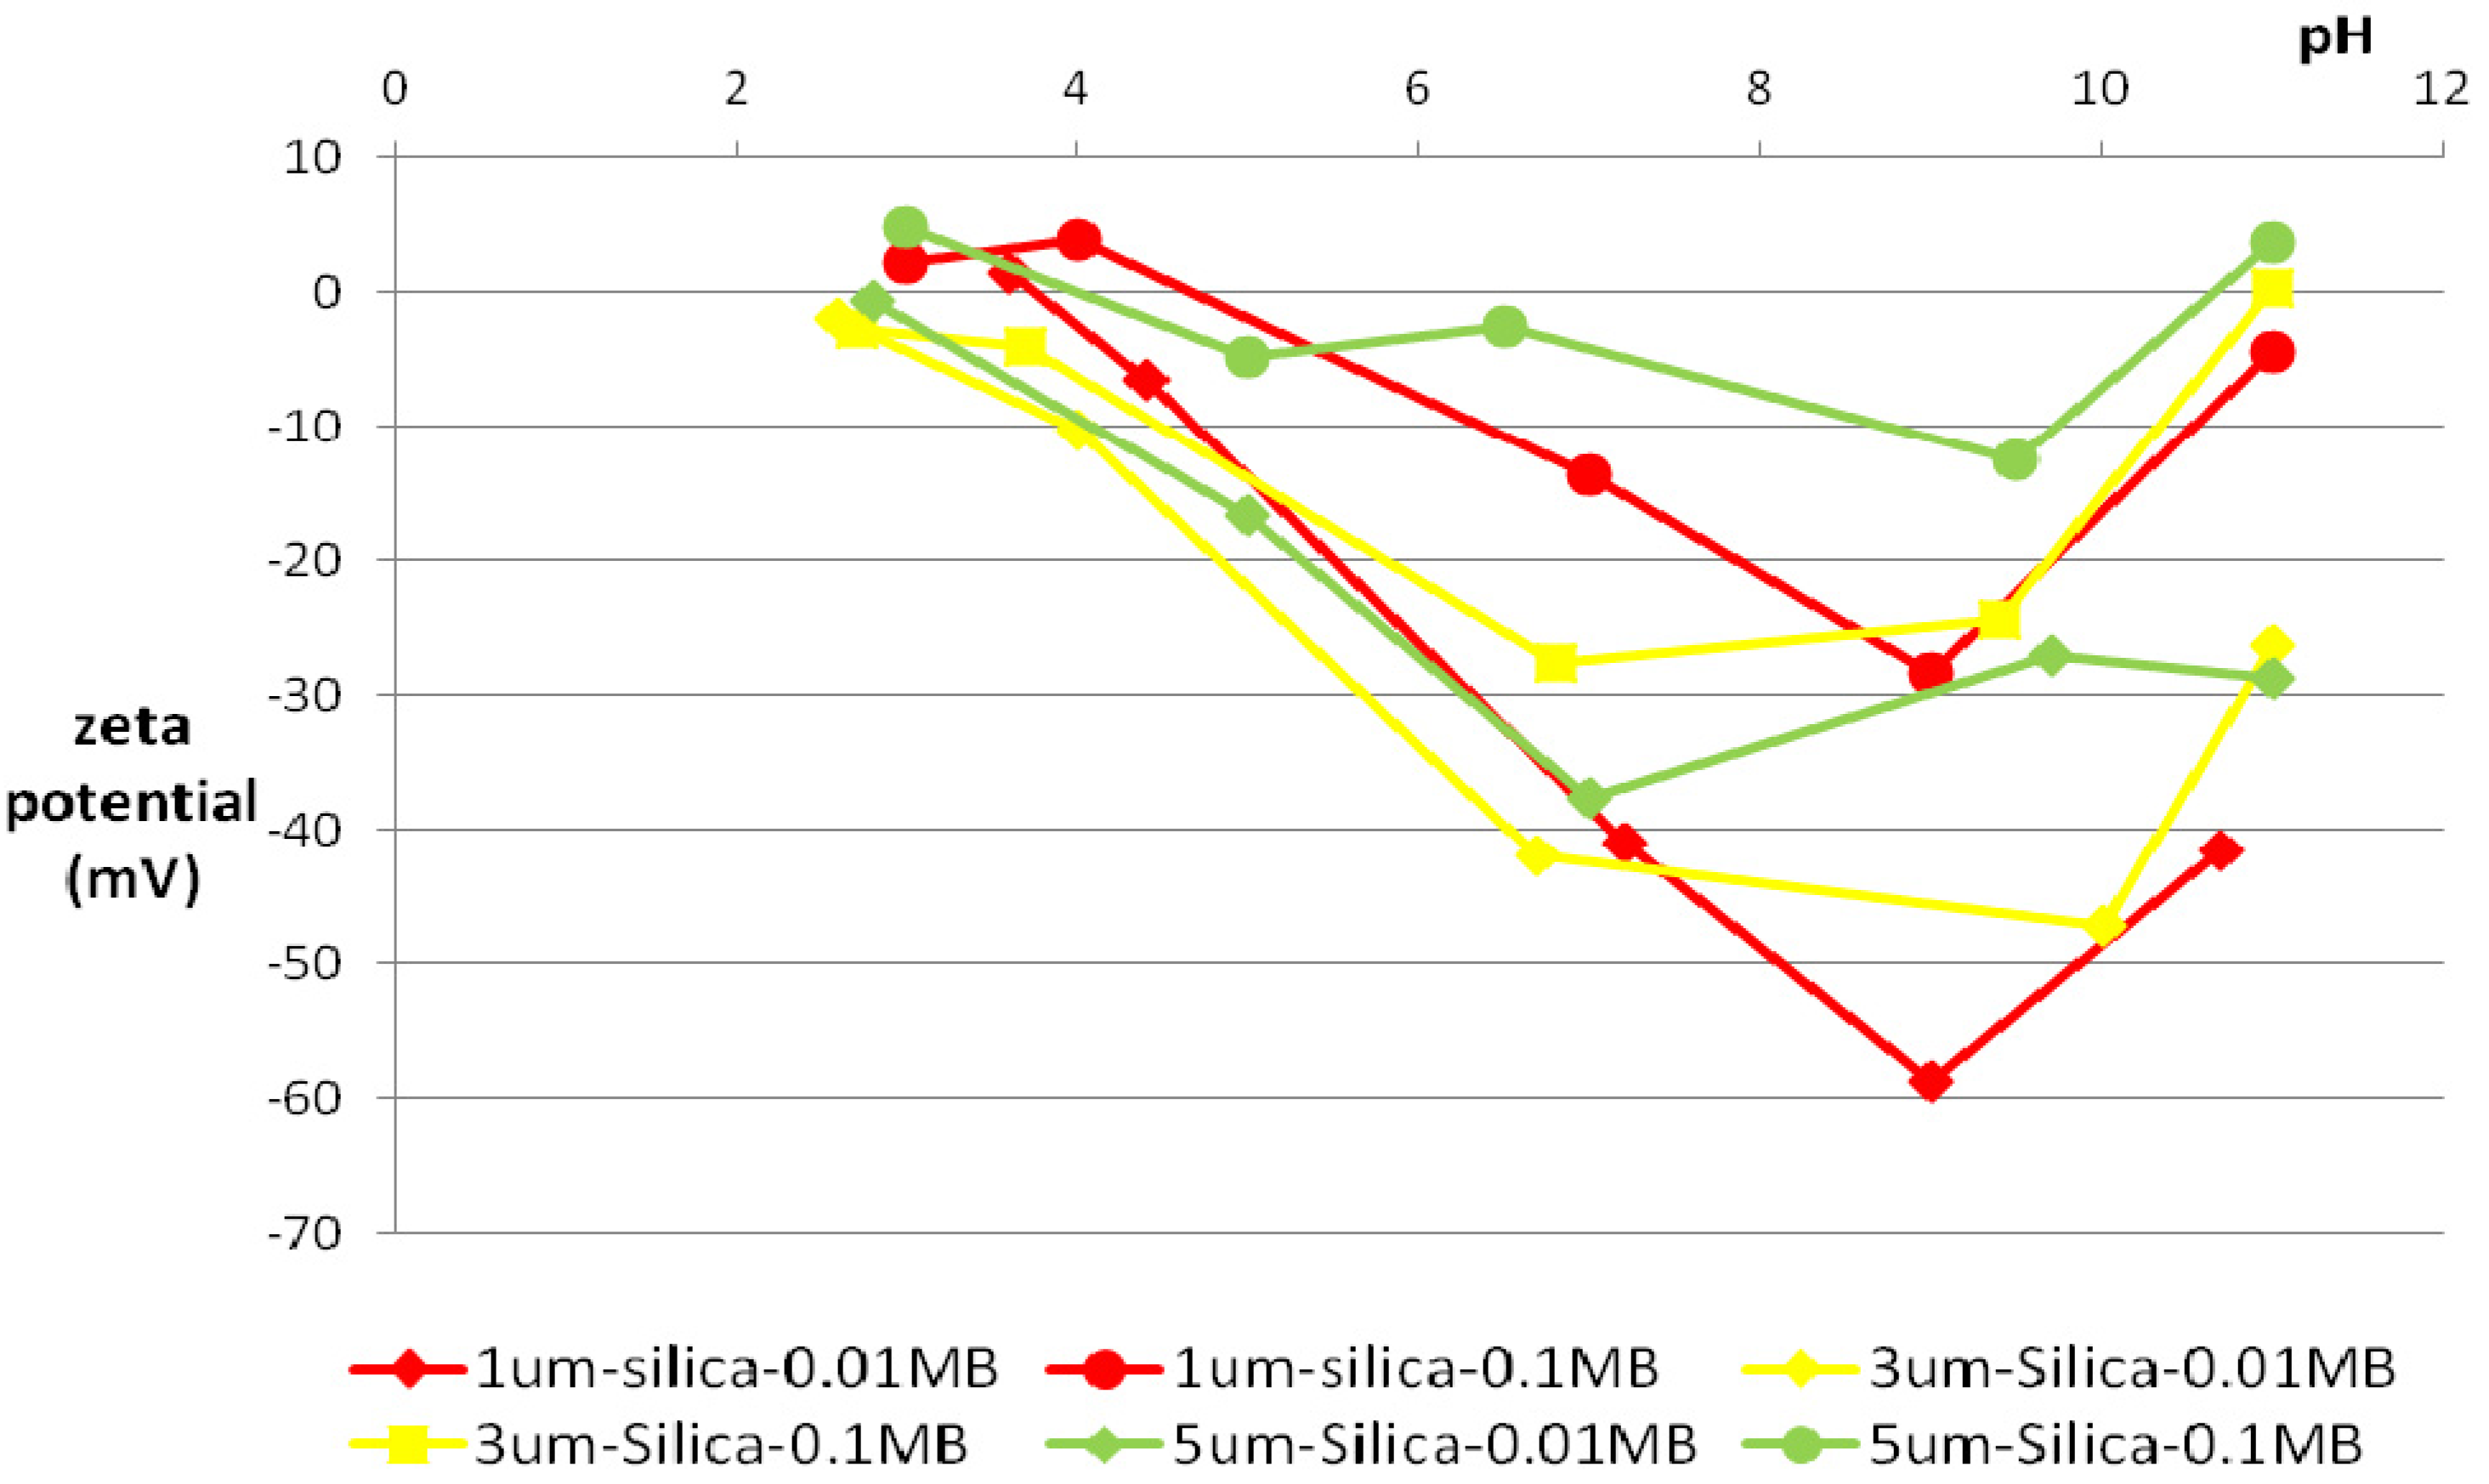
Experimental results show that clay concentration did not have a significant effect on zeta potential and size distributions (Figure 3). Either 0.02 g kaolinite or 0.04 g silica was suspended in 50 mL 0.01MLB, forming dispersion with 0.04 wt% or 0.08 wt% particle concentrations, respectively. Zeta potential for clay particles was measured as a function of pH, as shown in Figure 4 and for silica in Figure 5. It may be easily seen that particles in the brine with the lowest salinity have larger negative zeta potentials, which is a result of lower ionic strength available to suppress the electrical double layer of the dispersed solids.
Figure 3. The effect of kaoline wt% in 0.01MLB on zeta potential and size distribution.
Energies 04 01763 g003
Figure 4. Zeta potential of Kaofine and kaolinite particles as a function of pH.
Energies 04 01763 g004
Figure 5. Zeta potential of silica particles in aqueous solution for different particle radii.
Energies 04 01763 g005

3.3. Particle-Size Distribution

Due to the impact of particle size and structure in suspension, analysis of the particle size at several pH values is presented. Zeta potential results were used to guide the choice of pH values to capture the behavior of the suspensions at the zero-point of charge (ZPC) or isoelectric point (IEP), and also at the most negative surface charge value.
Figure 6 shows the size distribution for kaolinite dispersed in brine at pH~7 for 1MLB and 0.01MLB. The particle size density function appears somewhat more poly-dispersed for the 0.01MLB brine, which is at much lower salinity. The insets in the figure are optical micrographs of particle suspension samples taken immediately (initially) after preparation of the suspension and then 1 day later.
Figure 6. Particle size distribution of kaolinite at pH~7. (a) 1MLB; (b) 0.01MLB.
Energies 04 01763 g006aEnergies 04 01763 g006b
Perhaps the apparent larger polydispersity is more related to the initial dispersion of particles, rather than an effect of salinity. Brines were prepared in contact with atmosphere, and therefore, slight changes in pH were observed as a function time. The effect of these changes was mitigated by preparing fresh brine frequently and by sealing the containers.
Figure 7 depicts particle size distributions for Kaofine at pH~7. The distributions are significantly narrower than those for kaolinite.
Figure 7. Particle-size distribution of Kaofine at pH~7. (a) 1MLB; (b) 0.01MLB.
Energies 04 01763 g007aEnergies 04 01763 g007b
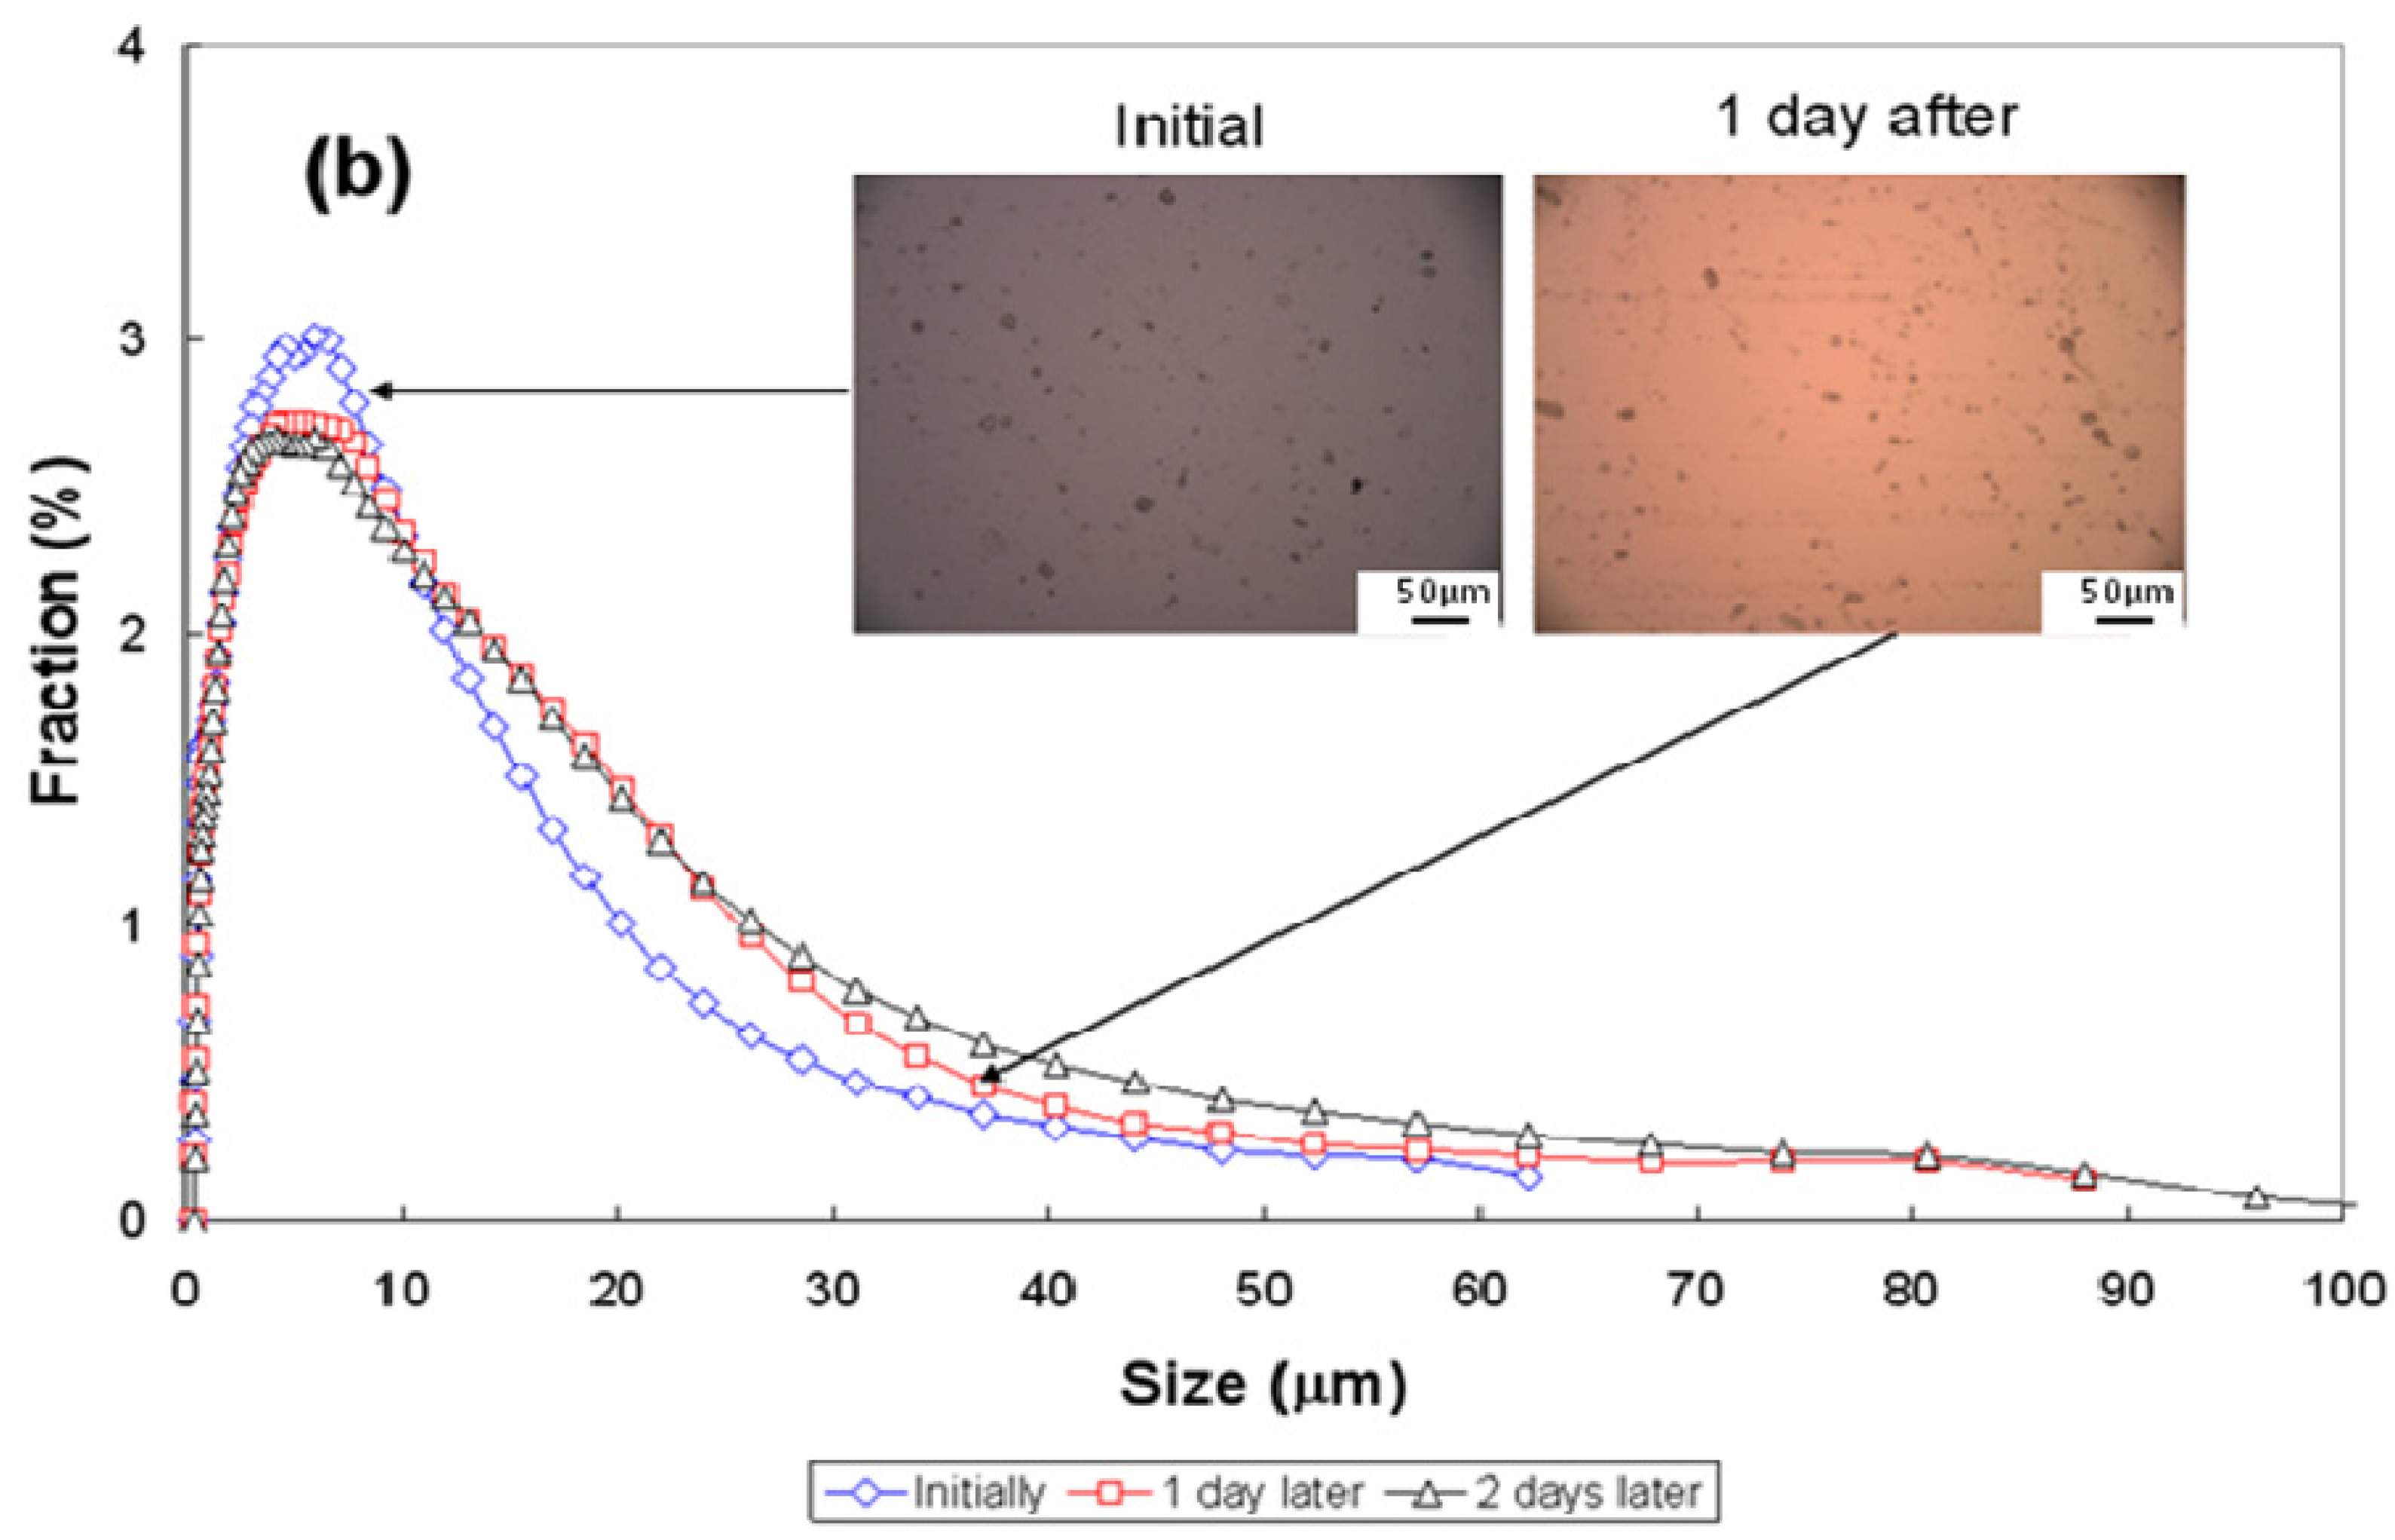
What is somewhat surprising is that particle aggregates are observed from the micrographs at the initial conditions in Figure 7a, corresponding to 1MLB can be clearly observed, despite the relatively small size reflected in light diffraction measurements. Perhaps this result is a matter of sampling. The particle size distribution in the case of kaofine widens somewhat at 1MLB after 1 and 2 days, but the majority of the particles appear to be under 5 µm in size. For the most diluted brine, the size distribution appears to be almost invariable. Figure 8 shows the results of particle size distribution for 3 µm silica at pH~7 for two values of brine salinity.
Figure 8. Particle size distribution of 3 µm silica at pH~7. (a) 1MLB; (b) 0.01MLB.
Energies 04 01763 g008aEnergies 04 01763 g008b
In this case, the silica aggregates can be identified in the insets, particularly at 1 day after the initial preparation of the suspension. Under these conditions, silica has a mild tendency to aggregate. Results from zeta potential measurements would indicate a negative value of this potential at this pH, at least from values of salinity of 0.1MLB and 0.01MLB. Interestingly, the initial dispersion of silica in both 1MLB and 0.01MLB have a more unimodal distribution, while after 1 day and 2 days, they apparently change to a bimodal distribution, which was not observed for clay dispersion.
Table 2 contains the results for average particle size for 3 values of pH~2.5, 7 and 11. As before, measurements were taken immediately after preparing the suspensions and then 1 and 2 days later.
Table 2. Average particle size determined through light diffraction.
ConditionspH~2.5pH~7pH~11
Initial (µm)1 day (µm)2 days (µm)Initial (µm)1 day (µm)2 days (µm)Initial (µm)1 day (µm)2 days (µm)
Kaofine 0.01MLB1.752.152.291.171.551.341.061.211.62
Kaofine 0.1MLB1.852.112.24---1.624.443.43
Kaofine 1MLB2.551.701.840.811.251.295.157.937.72
Kaolinite 0.01MLB5.8611.377.856.387.778.367.328.919.48
Kaolinite 0.1MLB5.2710.598.63---7.48.4610.16
Kaolinite 1MLB4.968.429.515.147.997.78.3510.0512.58
3 µm Silica 0.01MLB2.983.113.122.863.523.623.113.723.74
3 µm Silica 0.1MLB3.163.353.5---3.697.986.77
3 µm Silica 1MLB3.033.33.362.863.233.414.6513.6417.84
In general, for all the three particles investigated, it is observed that the particle aggregates are larger in brine of higher salinities, which corresponds to a lower absolute value of zeta potential. In other words, zeta potential measurements agree well with size distribution change as a function of brine salinities and pH. Notice that silica remains at about 3 μm in average size, except for pH~11, value at which increasing salinity leads to very large silica aggregates. Similar results are found for kaofine and kaolinite at the same pH value. At this pH, zeta potential measurements seem to indicate either a flip in surface charge or very small surface charge at higher salinity values, which could explain the tendency to aggregate.

3.4. Solid-Stabilized Emulsions

3.4.1. Clay-Stabilized Emulsions

The effect of brine pH on emulsions stabilized by kaolinite and Kaofine at pH~2 and pH~7 are presented in this section. The oil-to-water ratio was 1-to-1. From the bottle test, at pH~2, the emulsion resolved 9 mL of water out of 10 mL total used to prepare the emulsion, as shown in Figure 9 for the case of Kaofine. The viscosity of the W/O emulsion was 93.1 cp, which was somewhat higher than the viscosity of oil, 73.5 cp. On the other hand, at pH~7, only 5.5 mL of water were resolved. The viscosity varied according to the location of the aliquot taken. The upper part of oil phase exhibited a viscosity value of 75.4 cp, which indicates that the top portion of the fluid was pure oil, while the lower part, close to the oil and water interface, exhibited a very high viscosity value of about 293 cp (Figure 9). The optical microscopic image at 400× magnification shows the emulsion at pH~7 is tighter than the one at pH~2.
Figure 9. Kaofine stabilized emulsions. On the left, optical micrograph of the W/O emulsion at pH~2. On the right, micrograph of the W/O emulsion at pH~7.
Energies 04 01763 g009
At pH~7, the zeta potential of kaofine (−44 mV) is much higher than that at pH~2, which is close to the ZPC. At ZPC, the particles easily flocculate due to the lack of electrical repulsion and the flocculated clay particles are not as efficient as smaller ones in stabilizing emulsions. The bottle test results of emulsions stabilized by kaolinite and kaofine, both at 0.04 wt%, are compared at pH~2 and pH~7 (Figure 10). Kaofine, with a significantly smaller particle size, appears to exhibit a better capacity for emulsifying water into the oil phase, i.e., less water resolved to the bottom.
Particles can help to improve the stability of crude oil emulsions. As can be easily observed in Figure 11, emulsions with kaolinite are more stable than those without kaolinite for the brine tested (1MLB and 0.01MLB).
Figure 10. Bottle test of clay stabilized emulsions at pH~2 and pH~7.
Energies 04 01763 g010
Figure 11. Comparison between emulsions with and without kaolinite at pH~7. Normalized water content is calculated dividing the amount of water in the emulsion by the total amount of water available. (a) 1MLB; (b) 0.01MLB.
Energies 04 01763 g011

3.4.2. Silica Stabilized Emulsion

Bottle tests were also completed for silica stabilized emulsions at pH~11 and pH~3 (Figure 12). It is apparent that silica with the largest size (5 µm) can stabilize emulsions better than smaller ones (1 µm and 3 µm). For water-in-oil emulsion, strong hydrophilic silica will mostly be immersed into the water droplets, with only an edge left in the oil phase (Figure 13b). Silica, indeed, would tend to disrupt the stability of W/O emulsions, if access to the water-oil interface is gained. In this sense, silica particles with 1 µm and 3 µm in diameter will not be large enough to form steric barriers between the droplets to prevent coalescence, which would be the only stabilizing mechanism. Perhaps at a higher concentration of silica particles, it may be possible to produce enough coverage of the interface.
From Figure 12, it can be seen that silica stabilizes better emulsions at pH~3 than pH~11, as opposed to the results of kaolinite stabilized emulsion. From results of zeta potential measurements, silica with 3 µm in diameter in 0.01 MLB at pH~11 has a higher zeta potential in absolute value (−26.23 mV) than at pH~3 (−1.88 mV), which is close to ZPC [20].
Figure 12. Bottle test results of silica stabilized emulsion at pH~11 and at pH~3.
Energies 04 01763 g012

4. Closing Remarks

Stability studies were successfully carried out through analysis of bottle tests and optical microscopy for the three particle systems used in this work. Zeta potential results are a good predictor of solid particles flocculation as a function of brine salinity and pH. The presence of particles increases the stability of emulsions in general. For kaolinite, smaller size particles stabilize emulsions better. Neutral conditions are more favorable to formation of stable emulsion than acid conditions. It is found that the edges of the kaolinite are positively charged, which may adsorb negatively charged carboxylate components of the oil and turn that portion of clay solids partially oil-wet [20,21]. As Figure 13a shows, the clay particles are simply depicted as round and most of it is in the continuous phase (oil) due to their hydrophobicity. At the same wt%, smaller kaolinite (kaofine) possesses larger specific surface area, and larger coverage on the water droplets occurs, thus kaolinite with smaller size can stabilize water-in-oil emulsions better. For silica-stabilized emulsions, larger silica particles (and flocculates) are better stabilizing agents than smaller ones. This result is likely due to the stabilizing mechanism via steric repulsion in particle dispersion as depicted in Figure 13b. This might explain why silica stabilizes emulsions better at acid pH than at neutral pH conditions, as opposed to systems stabilized with kaolinite particles. This can be attributed to the fact that aggregation of silica favors the interfacial resistance to rupture of water droplets, as Friberg [22] points out in studying emulsion stabilization by solid spherical particles: “Such aggregated particles would be more efficient as emulsion stabilizers than individual and independent particles”. Also, at pH~3, the acid favors the asphaltene adsorption to the particles resulting in changing its hydrophobicity towards more oil-wet, and asphaltenes can also adhere to the droplets interface together with silica to stabilize the emulsions at this condition.
The reservoir pH is expected to be neutral or higher. If the observations in this work are extrapolated to reservoir conditions, we infer that kaolinite indeed would help to stabilize emulsions at least for the condition when the watercut is approximately 50%.
Figure 13. Schematic mechanisms of kaolinite and silica stabilized emulsion.
Energies 04 01763 g013

Acknowledgments

The authors would like to thank Norman Morrow for providing oil samples and access to an optical microscope. Financial support was provided by the University of Wyoming through startup funding. This material is based upon work supported by the University of Wyoming School of Energy Resources through its Graduate Assistantship program. We would like to acknowledge the Enhanced Oil Recovery Institute at the University of Wyoming for financial assistance.

References

  1. Pickering, S.U. Emulsions. J. Chem. Soc. 1907, 91, 2001–2021. [Google Scholar] [CrossRef]
  2. Hunter, T.N.; Pugh, R.J.; Franks, G.V.; Jamenson, G.J. The role of particles in stabilizing foams and emulsions. Adv. Colloid Interf. 2008, 137, 57–81. [Google Scholar] [CrossRef]
  3. Arditty, S.; Schmitt, V.; Giermanska-Kahn, J.; Leal-Calderon, F. Materials based on solid-stabilized emulsions. J. Colloid Interf. Sci. 2004, 275, 659–664. [Google Scholar] [CrossRef]
  4. Binks, B.P. Particles as surfactants—similarities and differences. Curr. Opin. Colloid Int. 2002, 7, 21–41. [Google Scholar] [CrossRef]
  5. Tambe, D.E.; Sharma, M.M. Factors controlling the stability of colloid-stabilizd emulsions. J. Colloid Interf. Sci. 1993, 157, 244–253. [Google Scholar] [CrossRef]
  6. Sztukowski, D.M.; Yarranton, H.W. Oilfield solids and water-in-oil emulsion stability. J. Colloid Interf. Sci. 2005, 285, 821–833. [Google Scholar] [CrossRef]
  7. Liu, J.; Zhou, Z.; Xu, Z.; Masliyah, J. Bitumen-clay interactions in aqueous media studied by zeta potential distribution measurement. J. Colloid Interf. Sci. 2002, 252, 409–418. [Google Scholar] [CrossRef]
  8. Yan, N.; Masliyah, J.H. Effect of pH on adsorption and desorption of clay particles at oil-water interface. J. Colloid Interf. Sci. 1996, 181, 20–27. [Google Scholar] [CrossRef]
  9. Tsamantakis, C.; Masliyah, J.; Yeung, A.; Gentzis, T. The behaviour of micro-bitumen drops in aqueous clay environments. J. Colloid Interf. Sci. 2005, 288, 129–139. [Google Scholar] [CrossRef]
  10. Moran, K.; Yeung, A.; Masliyah, J. The viscoplastic properties of crude oil-water interfaces. Chem. Eng. Sci. 2006, 61, 6016–6028. [Google Scholar] [CrossRef]
  11. Tsamantakis, C.; Masliyah, J.; Yeung, A.; Gentzis, T. The Investigation of the interfacial properties of water-in-diluted-bitumen emulsions using micropipette techniques. J. Colloid Interf. Sci. 2005, 284, 176–183. [Google Scholar] [CrossRef]
  12. Ngai, T.; Auweter, H.; Behrens, S.H. Environmental responsiveness of microgel particles and particle-stabilized emulsions. Macromolecules 2006, 39, 8171–8177. [Google Scholar] [CrossRef]
  13. Kruglyakov, P.M.; Nushtayeva, A.V. Investigation of the influence of capillary pressure on stability of a thin layer emulsion stabilized by solid particles. Colloids Surface A 2005, 263, 330–335. [Google Scholar] [CrossRef]
  14. Yan, F.; Niu, Q.; Lan, Q.; Sun, D. Effect of dispersion pH on the formation and stability of pickering emulsions stabilized by layered double hydroxides particles. J. Colloid Interf. Sci. 2007, 306, 285–295. [Google Scholar] [CrossRef]
  15. Thieme, J.; Abend, S.; Lagaly, G. Aggregation in pickering emulsions. Colloid Polym. Sci. 1999, 277, 257–260. [Google Scholar] [CrossRef]
  16. Wang, X.; Alvarado, V. Effects of aqueous-phase salinity on water-in-oil emulsion stability: bottle test determination. J. Dispers. Sci. Technol. 2011. [Google Scholar] [CrossRef]
  17. Wang, X.; Alvarado, V. Direct current electro-rheological stability determination of water-in-oil emulsions. J. Phys. Chem. B 2009, 113, 13811–13816. [Google Scholar] [CrossRef] [PubMed]
  18. Wang, X.; Brandvik, A.; Alvarado, V. Probing interfacial water-in-crude oil emulsion stability controls using electrorheology. Energy Fuels 2010, 24, 6359–6365. [Google Scholar] [CrossRef]
  19. Moradi, M.; Alvarado, V.; Huzurbazar, S.V. Effect of salinity on water-in-crude oil emulsion stability: evaluation of drop-size distribution proxy. Energy Fuels 2011, 25, 260–268. [Google Scholar] [CrossRef]
  20. Jiang, T.; Hirasaki, G.J.; Miller, C.A.; Ng, S. Effects of clay wettability and process variables on separation of diluted bitumen emulsion. Energy Fuels 2010, 25, 545–554. [Google Scholar] [CrossRef]
  21. Jiang, T.; Hirasaki, G.J.; Miller, C.A. Characterization of kaolinite potential for interpretation of wettability alteration in diluted bitumen emulsion separation. Energy Fuels 2010, 24, 2350–2360. [Google Scholar] [CrossRef]
  22. Friberg, S.E. Emulsion stabilization by solid particles-A two-layer approach: Spherical particles. J. Dispers. Sci. Technol. 2005, 26, 647–654. [Google Scholar] [CrossRef]