1. Introduction
Solar greenhouses have recently become a quite popular solution in temperate climates to improve the energy behavior of the building envelope. As well known, they are a solar passive system constituted by a southward oriented external room, made mostly by transparent walls. The greenhouse has the effect (in winter time) of constituting a buffer zone between the house and the external environment, allowing the entrance of a large quantity of solar radiation [
1]. To avoid summer overheating, sunspaces have to be equipped with shading devices or they have to be opened.
In temperate climates, many national and regional legislations have favored the use of sunspaces, allowing incentives or extra building volumes, and therefore there is a need to develop more accurate simulation and design tools for these systems.
The effect of solar greenhouses in the energy balance of a building during the heating period can be evaluated with different approaches: among the stationary procedures, the “Method 5000” [
2] and the calculation process described in the Standard EN ISO 13790 [
3] were analyzed in the present work. Furthermore, a dynamic simulation was conducted by means of the software TRNSYS [
4], at the aim of understanding the behavior of the greenhouse space with unsteady meteorological data. The dynamic simulation was also useful for a comparison with the stationary methods, which obviously make use of simplifying hypotheses. Since the introduction of a greenhouse decreases the amount of direct sun radiation incident on the exterior wall adjacent to this room (partition wall),a thermal balance on the wall with and without this solar passive system is necessary, in order to define more precisely the energetic contribution of the solution.
The Umbria Region in Italy has recently financed through various public tenders the construction of more than 200 flats inspired to the principles of bio-architecture; many of these flats are equipped with a sunspace, but solar collectors and PV panels, as well as heat pumps, natural insulating materials, rain water recovery and other solutions are also present. The University of Perugia is in charge of monitoring and verifying the quality of the built environment of some representative flats, and in particular of assessing the real energy savings and the thermal comfort of the occupants of the buildings. One of these flats, equipped with a sunspace, was chosen as case-study in the present paper.
After the analysis of a greenhouse alone, the behavior of the entire flat was simulated, according to the indications of the Italian Standards UNI/TS 11300 [
5], comparing the different methods previously cited. The same building was also examined with the dynamic code ENERGY PLUS [
6], linked with the unsteady simulation of the greenhouse. Finally, the real energy consumptions of the flat were compared with the results obtained with the different methodologies.
2. Literature Review
Many authors have recently analyzed the behavior of solar greenhouses from different points of views. Oliveti
et al. numerically evaluated the solar contribution for building-attached sunspaces in the Italian climate [
7]. They studied several configurations with simple geometry made up of a glazed box in front of a room. They found that the collecting capacity of solar energy of a volume depends mostly on the ratio of the glazed to opaque area and on the optical properties of the surface. Oliveti
et al. [
8] also proposed a simplified model for the evaluation of the solar energy absorbed by a sunspace using an effective absorption coefficient defined as the ratio of the solar energy absorbed and the solar energy entered. They concluded that the proposed simplified model can adequately estimate the absorbed solar energy.
More recently, Oliveti
et al. [
9] calculated the solar gains of the sunspace and the adjacent spaces for some Italian localities varying the exposure, the optical properties and the thermal capacity of the opaque surfaces, the amount of ventilation and the shading device.
In other theoretical and experimental studies simulation models of the thermal behavior of attached sunspaces have been proposed and validated. In particular Mottard and co-workers [
10] considered radiation exchanges in the long infrared and the distribution of solar radiation in the sunspace, while Roux [
11], by means of a sensitivity analysis, evaluated the parameters which mainly influence the thermal behavior of the sunspace.
Bakos and Tsagas discussed the thermal analysis and economic performance of an attached sunspace located in northern Greece [
12]. Mihalakakou investigated the heating/cooling potential of a sunspace as a function of different climatic conditions in several locations throughout Europe [
13]. He showed that sunspaces can be an appropriate and effective system all over Europe during the winter. Alfredo Fernandez-Gonzalez studied the thermal performance of five different passive solar test-cells (Direct Gain, Trombe-wall, Water wall, Sunspace, and Roof pond) and a control test-cell during the 2002–2003 heating season in Muncie (IN, USA) [
14].
Finally, Bataineh
et al. evaluated the thermal performance of sunspace technology for the weather in Jordan [
15]; six configurations that differ by the ratio of glazed surface area to opaque surfaces area were studied. A novel configuration was proposed to increase the solar energy absorbed during the winter and minimize the solar energy entering during the summer.
3. Energy Analysis of Solar Greenhouses
The aim of the energy analysis performed in the present paper is to define the influence of the sunspace on the partition wall, separating the heated volume from the sunspace itself. As a matter of fact, in wintertime, if on one side the sunspace has a function of capturing and storing solar radiation, on the other side it causes a reduction of the solar radiation hitting the wall. To evaluate these contributions, it is necessary to focus on the wall itself, studying its behavior with and without the greenhouse, scenario “0” and scenario “1” respectively, including heat gains and dispersions.
Direct solar gains without the green house were evaluated thanks to the standard UNI TS 11300-1 [
5], which contains the evaluation of solar direct contribution for both transparent and opaque walls, according to the quasi-steady method of EN ISO13790. Dispersions were calculated thanks to the thermal properties of the materials, the geometry of the building and the internal and external temperatures (climatic data).With the greenhouse, as previously mentioned, the solar heat gains were evaluated thanks to two different methodologies: the “Method 5000” and the solar heat gains of sunspaces methodology reported in Annex E.2 of the standard EN ISO 13790.
Both methodologies use average monthly climatic data and calculate the daily energy (kWh/day) for each month that the sunspace inputs inside the flat, as a function of incident solar radiation. In any case it is necessary to evaluate the heat dispersions through the wall towards the greenhouse, which are reduced due to the fact that the greenhouse is a buffer between the internal and the external environment.
3.1. “Method 5000”
This methodology, developed in France in 1982 to evaluate solar passive systems within the public tender “5000 Maisons Solaires”, is still one of the most used.
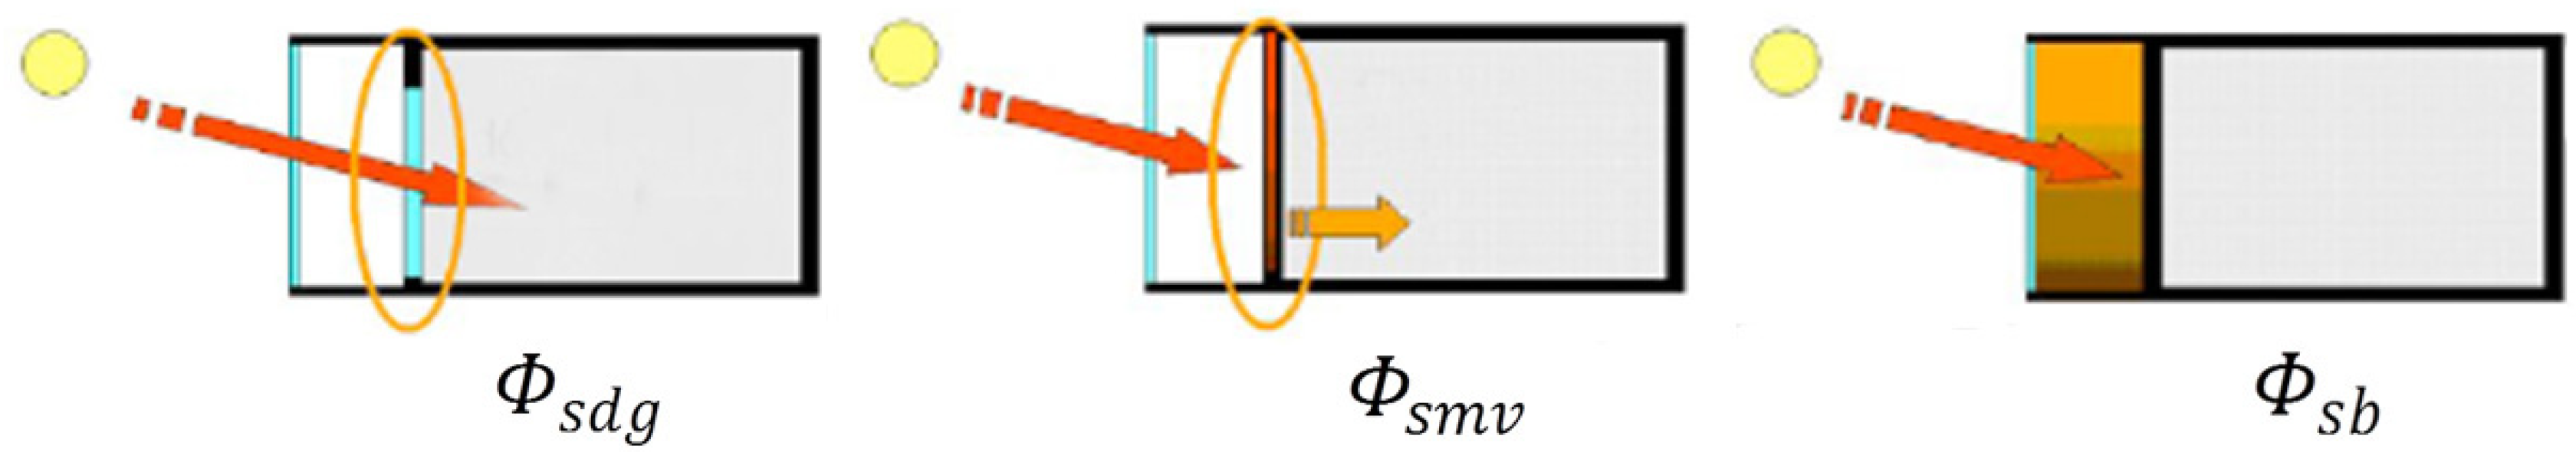
The methodology divides the overall energy contribution of the sunspace to the heating of an adjacent room into four different solar gains [
2] and in particular (
Figure 1):
the solar radiation that penetrates directly into the room through its window, after having passed through the sunspace (ϕsdg);
the thermal radiation stored in the partition wall between the room and the sunspace, due to the solar radiation incident on the wall, which is reduced by the presence of the sunspace (ϕsmv);
“the buffer effect” due to the warm air contained in the sunspace (ϕsb);
the pre-heating of ventilating air, that passing through the sunspace increases its temperature (ϕsa), even if it is disregarded in the present work.
The total solar heat gain of the sunspace ϕ5000 (kWh/day) is the sum of all contributions:
Figure 1.
Solar contributions according to “Method 5000”.
Figure 1.
Solar contributions according to “Method 5000”.
3.2. EN ISO 13790 Standard Method
The standard gives a calculation methodology to evaluate the energy demand for winter heating and summer cooling of both residential and office buildings. The Annex E of the standard deals with heat gains of sunspaces.
The solar heat gains due to the sunspace entering the heated space
ϕ13790 are the sum of the direct heat gains through the partition wall
ϕsd and the indirect heat gain due to each wall of the sunspace heated by solar radiation
ϕsi:
Direct heat gains
ϕsd are the sum of the contributions through opaque (
p) and transparent (
w) surfaces of the partition wall (see the list of symbols):
The presence of the sunspace influences the calculation of direct heat gains through the reducing factor ge. The ratio Hp,tot/Hp,e takes into account a higher absorption rate of the partition wall as a consequence of a higher value of surface thermal resistance due to the presence of the sunspace.
Indirect heat gains
ϕsi are calculated adding the solar heat gains of each
j-th absorbing area in the sunspace and subtracting the heat gains through the opaque surface in the partition wall (see the list of symbols):
In Equation (4) the term btr defines, on the basis of global heat exchange coefficients, the quantity of heat absorbed by the sunspace surfaces entering the heated zone. The 13790 standard considers only the solar radiation entering the sunspace through the transparent surfaces.
4. Comparison between Steady-State Methods and Dynamic Simulations
With the aim of comparing the two methodologies described in
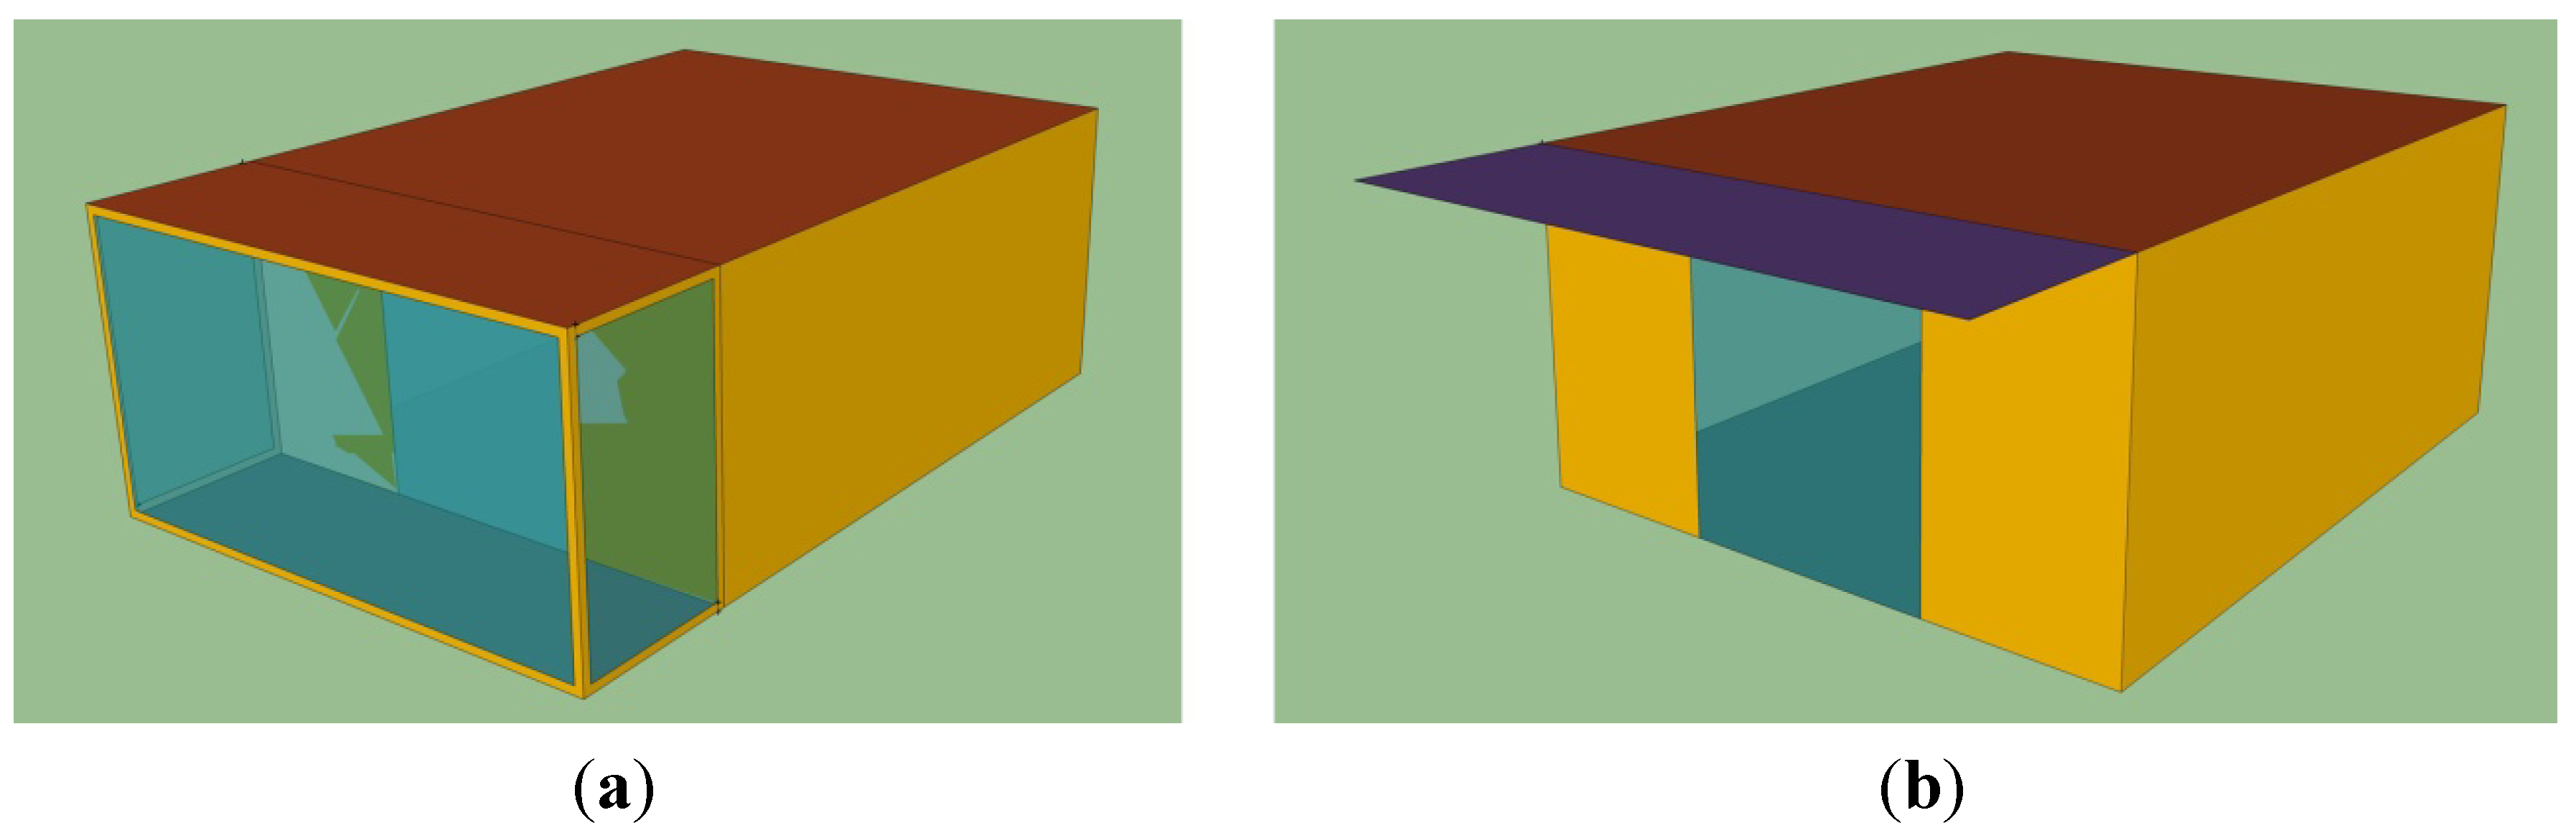
Section 3, and at the same time to dispose of a third model to simulate the real behavior of the sunspace, TRNSYS code was used too. The implemented geometry is represented in
Figure 2, with and without the sunspace (scenario “0” and “1” respectively). It has to be underlined that the situation without the sunspace is characterized by a horizontal overhang that causes a shading factor on the wall. The thermal and geometrical characteristics of the sunspace and of the partition wall are reported in
Table 1. The sunspace is located in Perugia (central Italy).
Figure 2.
Geometrical model in TRNSYS scenario “0” (a) and scenario “1” (b).
Figure 2.
Geometrical model in TRNSYS scenario “0” (a) and scenario “1” (b).
Table 1.
Thermal and geometrical characteristics of the sunspace and the wall of the model used for the dynamic simulation.
Table 1.
Thermal and geometrical characteristics of the sunspace and the wall of the model used for the dynamic simulation.
| Sunspace | A [m2] | U [W/m2 K] | g [-] |
|---|
| Transparentsurface | 22.1 | 1.41 | 0.586 |
| Partition wall | A [m2] | U [W/m2 K] | g [-] |
| Transparentsurface | 4.4 | 1.70 | 0.605 |
| Opaque surface | 9.1 | 0.27 | |
The heated volume was modeled considering heat exchange only through the partition wall; all the other walls of the heated volume were considered adiabatic.
The sunspace was modeled considering three vertical transparent surfaces, while the floor and the roof were considered opaque. The partition wall is characterized during wintertime by different shading factors in both scenarios. Climatic data (external temperature, solar radiation) and shading factors were taken from TRNSYS and inserted as input data in the two steady-state models, to calculate ϕ5000 and ϕ13790 with homogeneous conditions.
The energy balance of the wall, considering heat gains and dispersions, in both scenarios and with the above mentioned calculation methodologies was performed. The balance, which was conducted supposing the heated volume at the constant temperature of 20 °C, gives the surplus net heat gain given to the heated volume by the sunspace. In TRNSYS, working in dynamic conditions, this surplus energy is evident from observations of the temperature increase in the heated volume. If one wants to evaluate the surplus energy, in TRNSYS a constant temperature of 20 °C has to be fixed and, according to instant conditions, the heating or cooling demand has to be calculated (it is necessary to cool the room when solar heat gains are bigger than dispersions).
The overall balance of the wall, which gives the energy exceeding the energy demand of the heated space, is therefore evaluated as the difference between the cooling and the heating demand to maintain the heated space at the constant temperature of 20 °C during all the heating period. It can be easily understood that the influence of the sunspace on the wall can be determined thanks to this surplus energy given by the sunspace itself to the heated volume.
For the two steady-state methodologies, the influence of the sunspace can be calculated as the difference between the energy balance on the wall evaluated on both scenarios; the dynamic code requires a more detailed modeling configuration, but is able to reproduce more accurately the real behavior of the building.
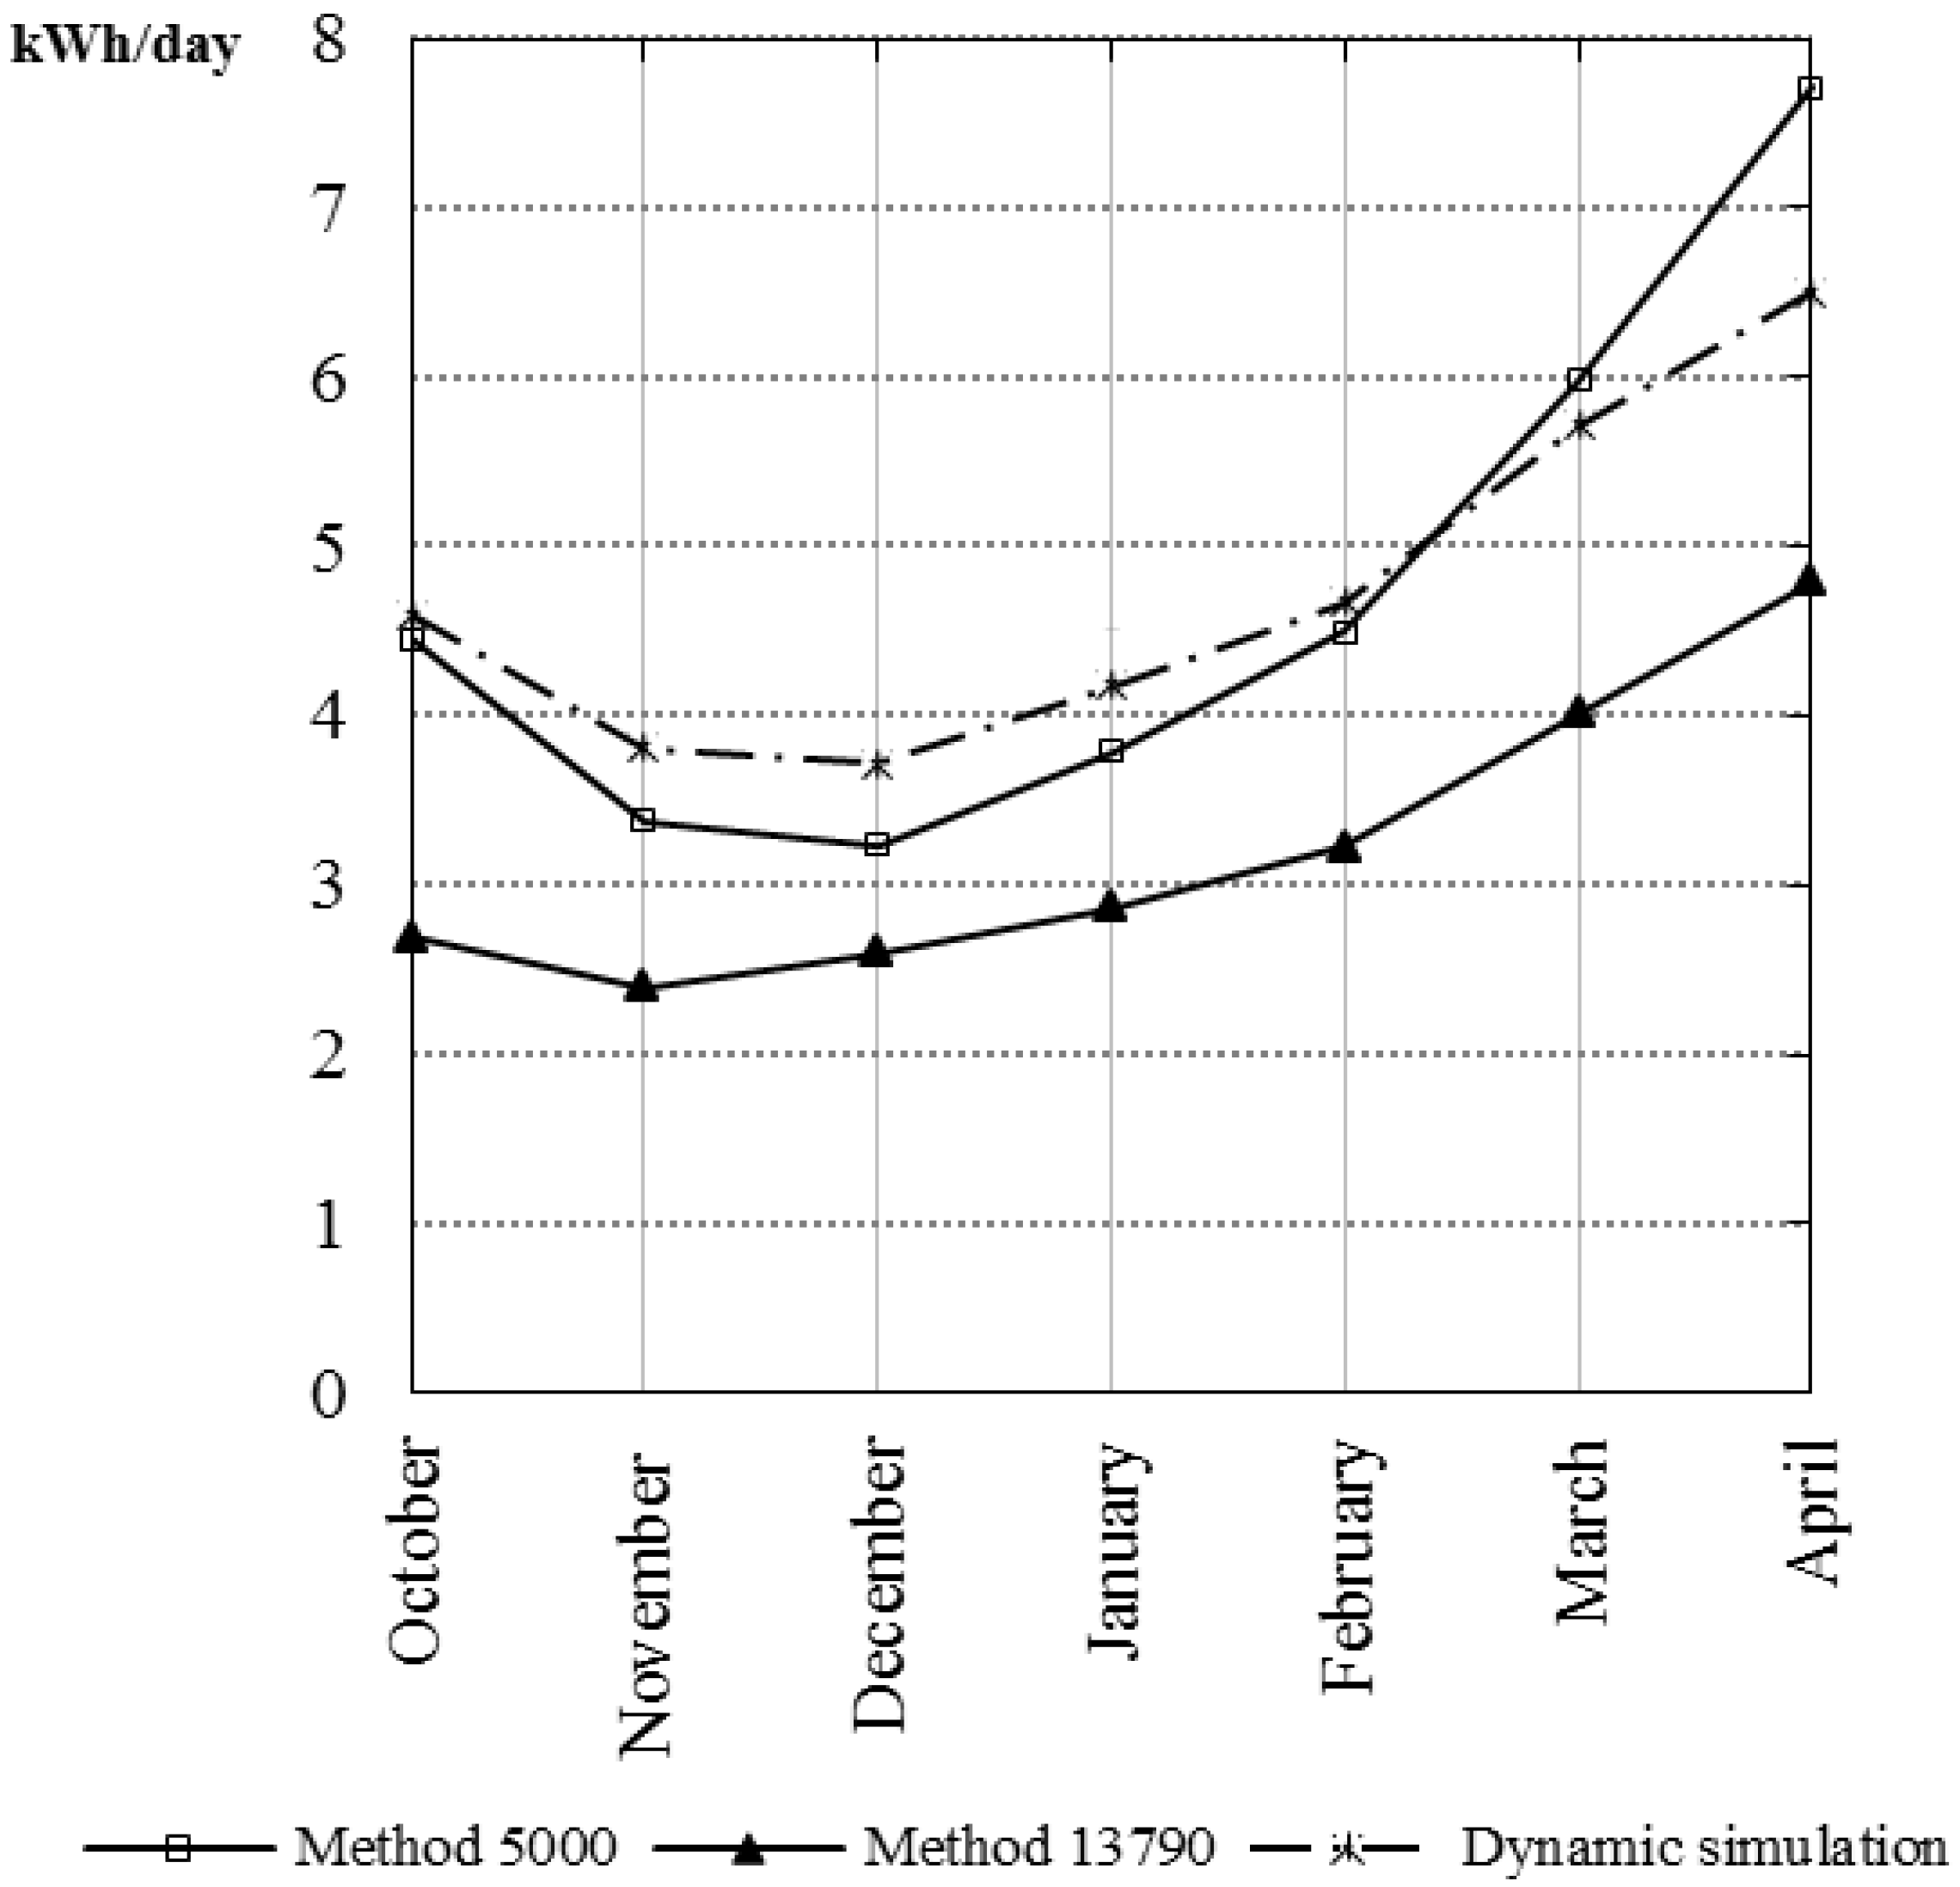
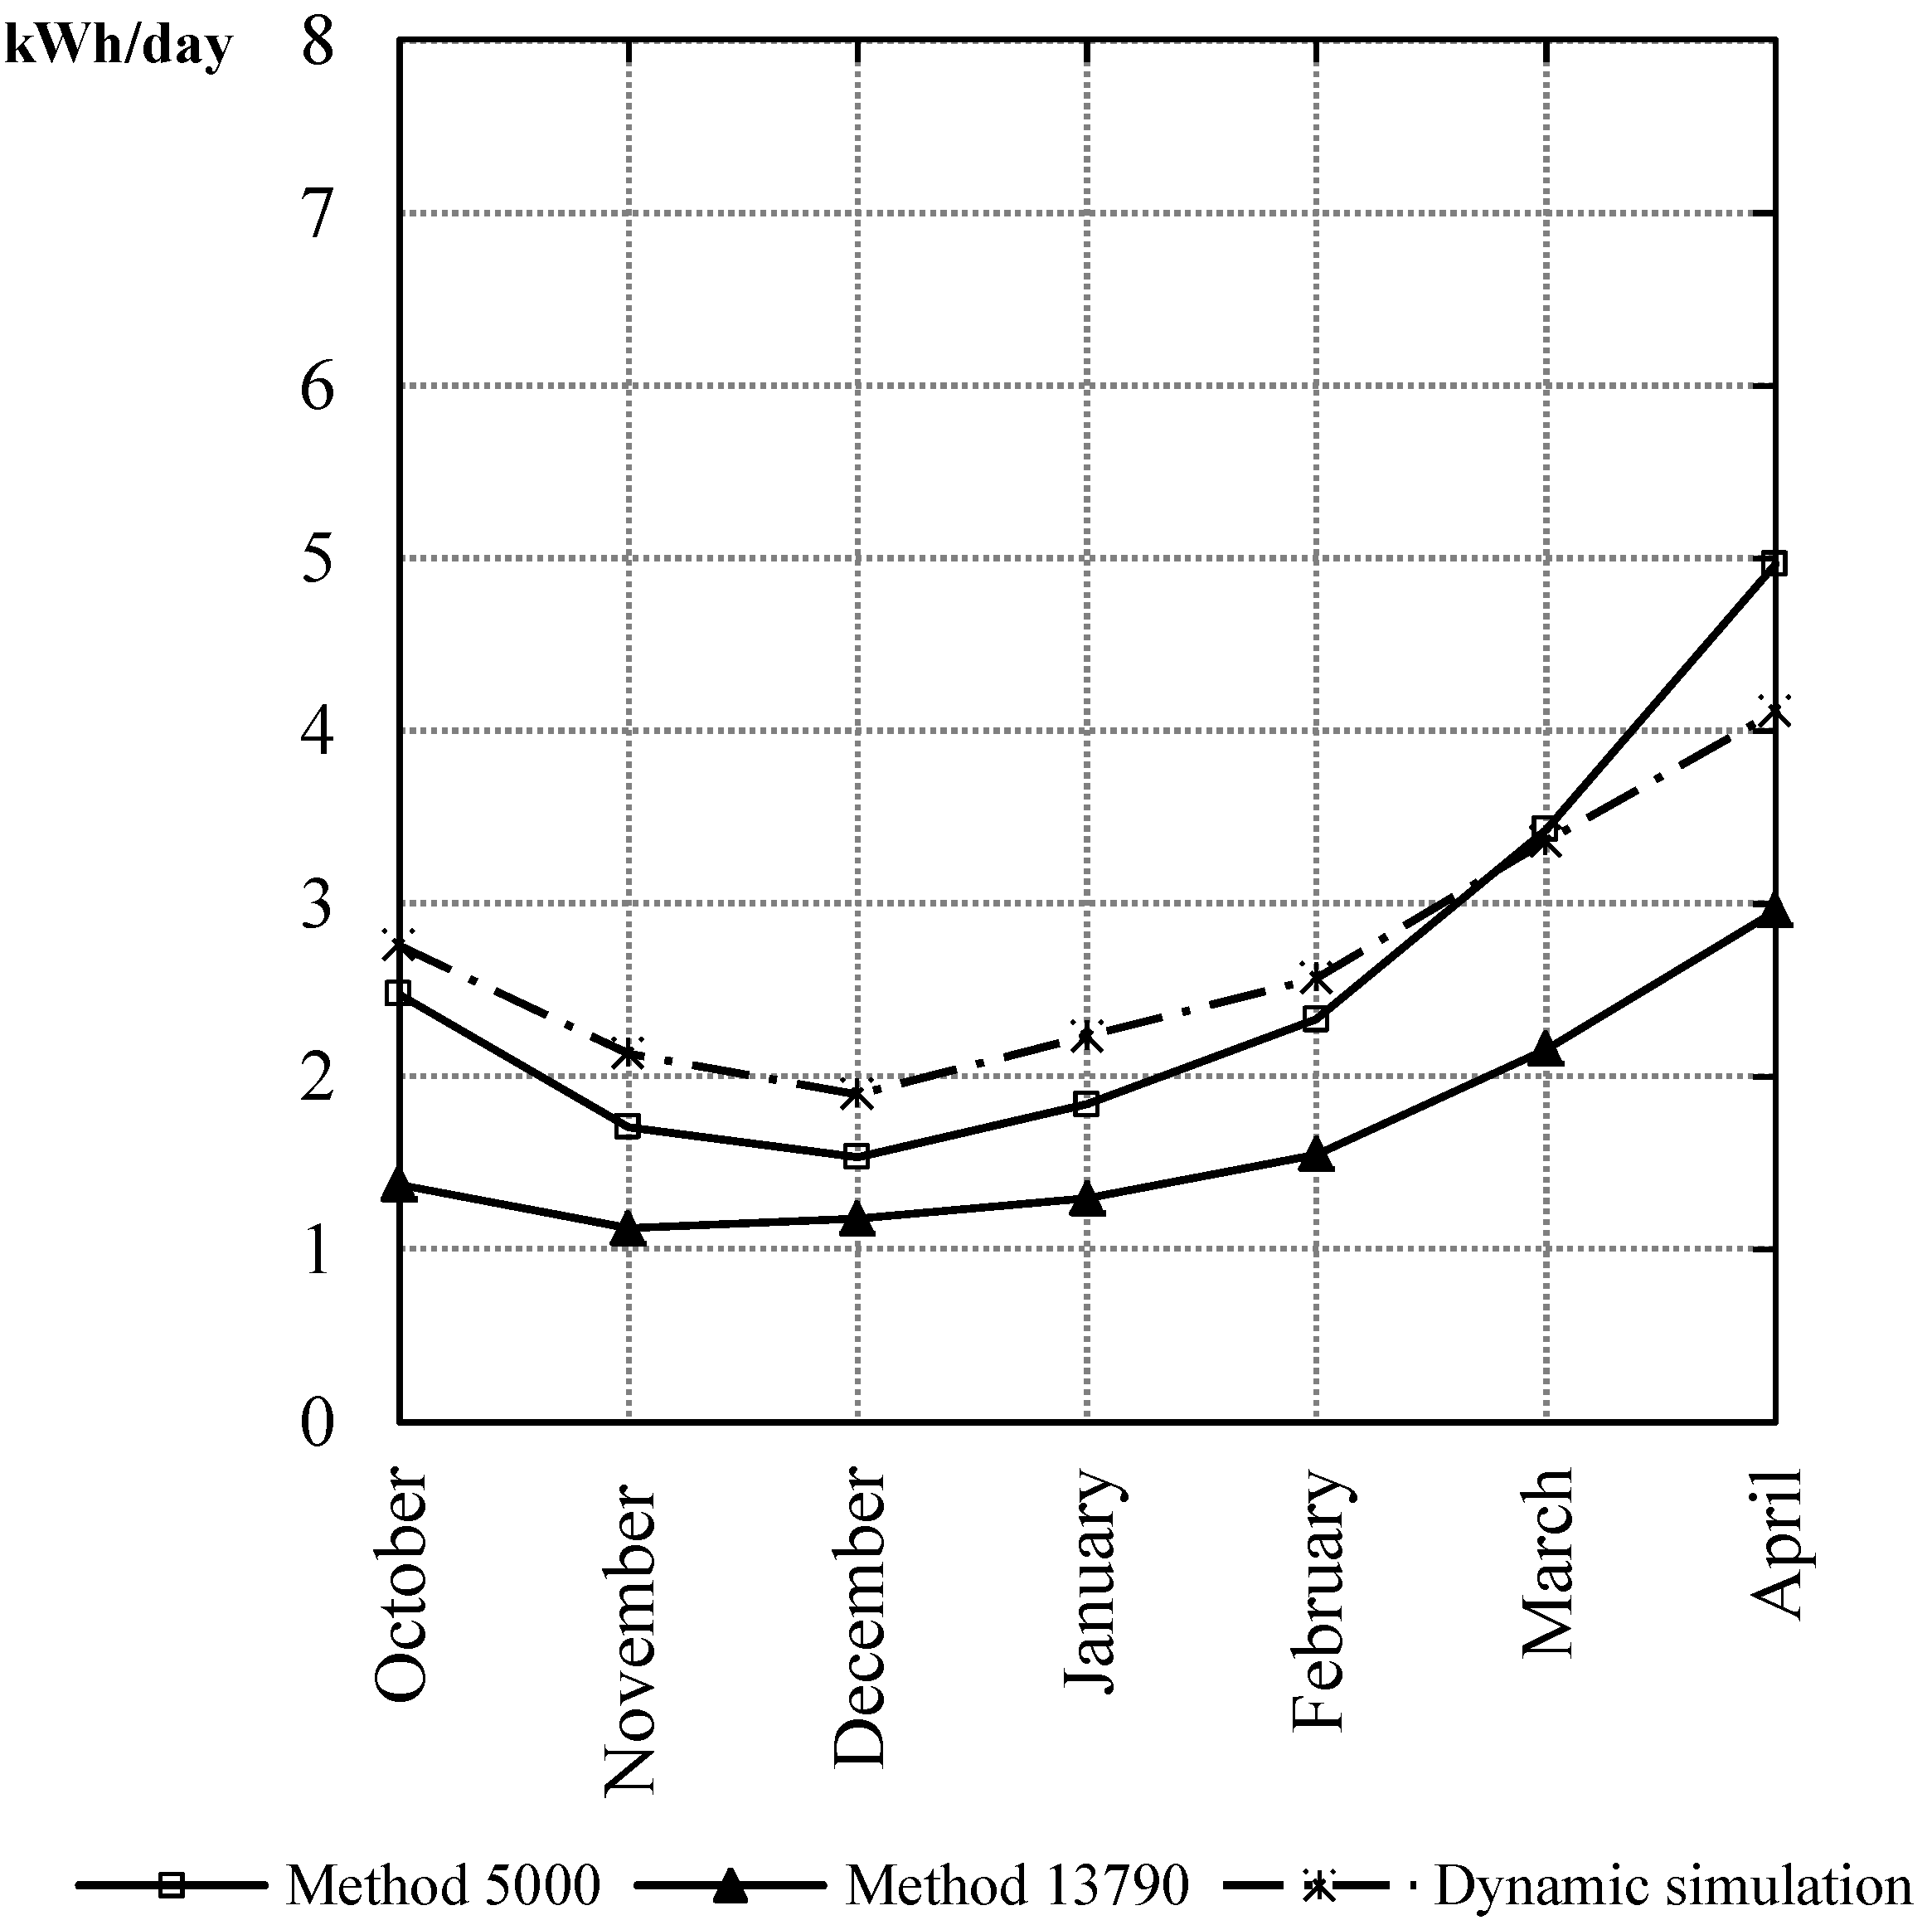
Figure 3 plots the results of the influence of the sunspace, in kWh/day, for the various months of the heating period, for the three calculation methodologies. Since TRNSYS is a dynamic tool that calculates hourly values, an average day for each month was calculated and reported in
Figure 3.
Looking at the results from dynamic simulations, it can be observed that TRNSYS tends in most cases to slightly overestimate the influence of the sunspace particularly in the months with higher irradiance values.
It has to be noticed that the two steady-state methods evaluate the influence of the sunspace in a different way. The gap between the results obtained with the “Method 5000” and the ones with the ISO 13790 standard method, which is more evident in the months with higher solar radiation, is mainly caused by different ways to calculate the solar heat gains from sunspace buffer effect. In order to calculate the energy “trapped” in the sunspace, the “Method 5000” uses the following equation [
16]:
The two coefficients, a
1 and a
2, evaluated for different geometries and climatic conditions [
17], take into account the solar energy losses through the floor of the greenhouse and by multiple reflections within the sunspace. In the present work the values of 0.74 and 0.91 were respectively assumed.
Figure 3.
Influence of the sunspace evaluated according to the three methodologies during the heating period (global heat transfer coefficient of the partition wall 9.89 W/K).
Figure 3.
Influence of the sunspace evaluated according to the three methodologies during the heating period (global heat transfer coefficient of the partition wall 9.89 W/K).
On the other hand the EN standard evaluates an average solar absorption factor of each absorbing area in the sunspace [Equation (4)] that in this case is equal to 0.6 for the floor and the opaque part of the partition wall and 0.12 when considering the glazed part of the partition wall contribution.
Moreover, according to the “Method 5000”, the energy “trapped” in the sunspace is calculated considering solar irradiance on the vertical surfaces of the greenhouse, whereas ISO 13790 standard evaluates the solar irradiance on each surface absorbing solar radiation inside the sunspace; the latter is therefore reduced by shading factors due to the overhang and the fins.
Simulations were carried out also to evaluate the influence of the global heat transfer coefficient of the partition wall, varying the transmittance of the opaque surface and of the window [
18].
Figure 4 shows the results obtained with a value of the global heat transfer coefficient of the partition wall of 15.75 W/K instead of 9.89 W/K as shown in
Figure 3. It is worth noting that the difference between the two methods is higher and that in this case the Method 5000 tends to overestimate in certain months the influence of the sunspace. This is mainly due to the fact that the two methods—as mentioned before—have two different ways of calculating solar gains through the opaque part of the partition wall.
Finally, comparing the results of
Figure 3 and
Figure 4, it can be noticed that the contribution of the sunspace is significantly affected by the thermal characteristics of the wall. As expected, a higher value of the global heat transfer coefficient of the partition wall corresponds to an increased influence of the sunspace.
Figure 4.
Influence of the sunspace evaluated according to the three methodologies during the heating period (global heat transfer coefficient of the partition wall 15.75 W/K).
Figure 4.
Influence of the sunspace evaluated according to the three methodologies during the heating period (global heat transfer coefficient of the partition wall 15.75 W/K).
5. Description of the Case Study
The flat used as a case-study is part of a block of flats, with a rectangular base, three/four floors above ground, made up of 19 apartments whose surface varies from 62 to 90 m
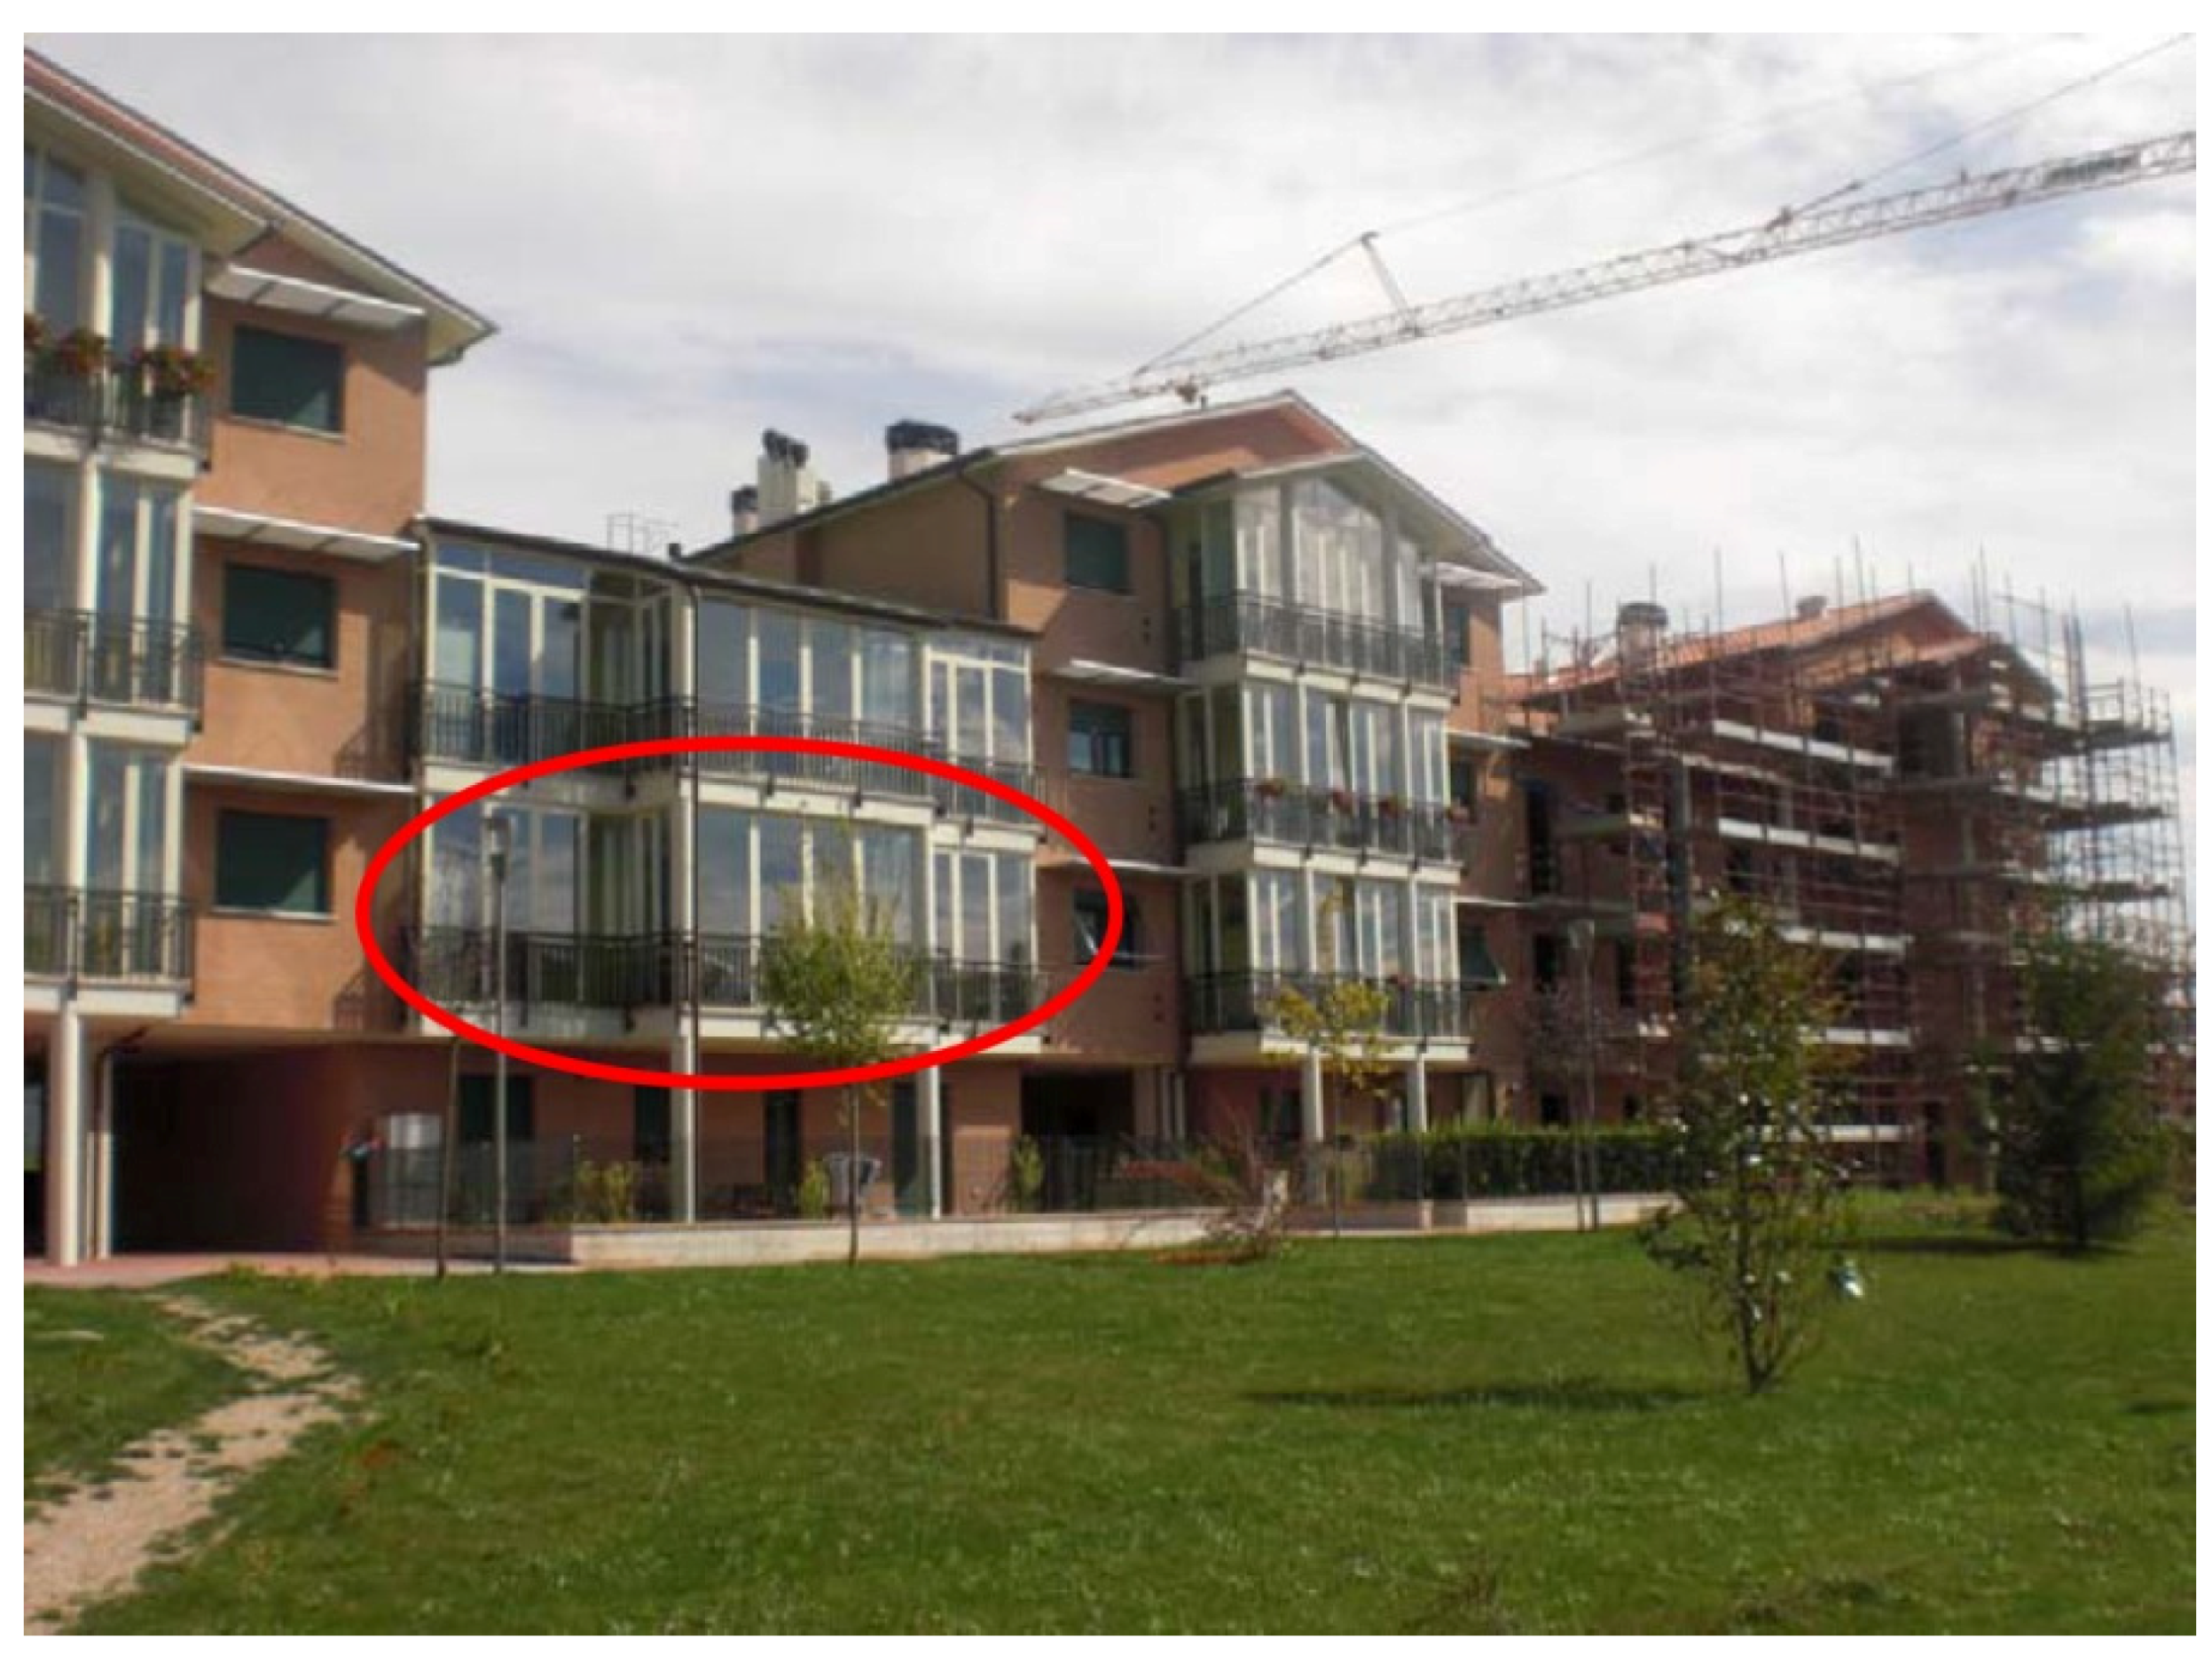
2. External wall claddings are partly made of bricks and partly of plaster; unconditioned sunspaces are adjacent to the south west façade, the other windows in the same façade are equipped with shading devices for solar protection (
Figure 5). Among energy efficient solutions here adopted, it is worth mentioning the central heating systems and solar collectors on the roof for hot water and electricity production.
Figure 5.
View of the south-west façade of the building, with the flat used as case study.
Figure 5.
View of the south-west façade of the building, with the flat used as case study.
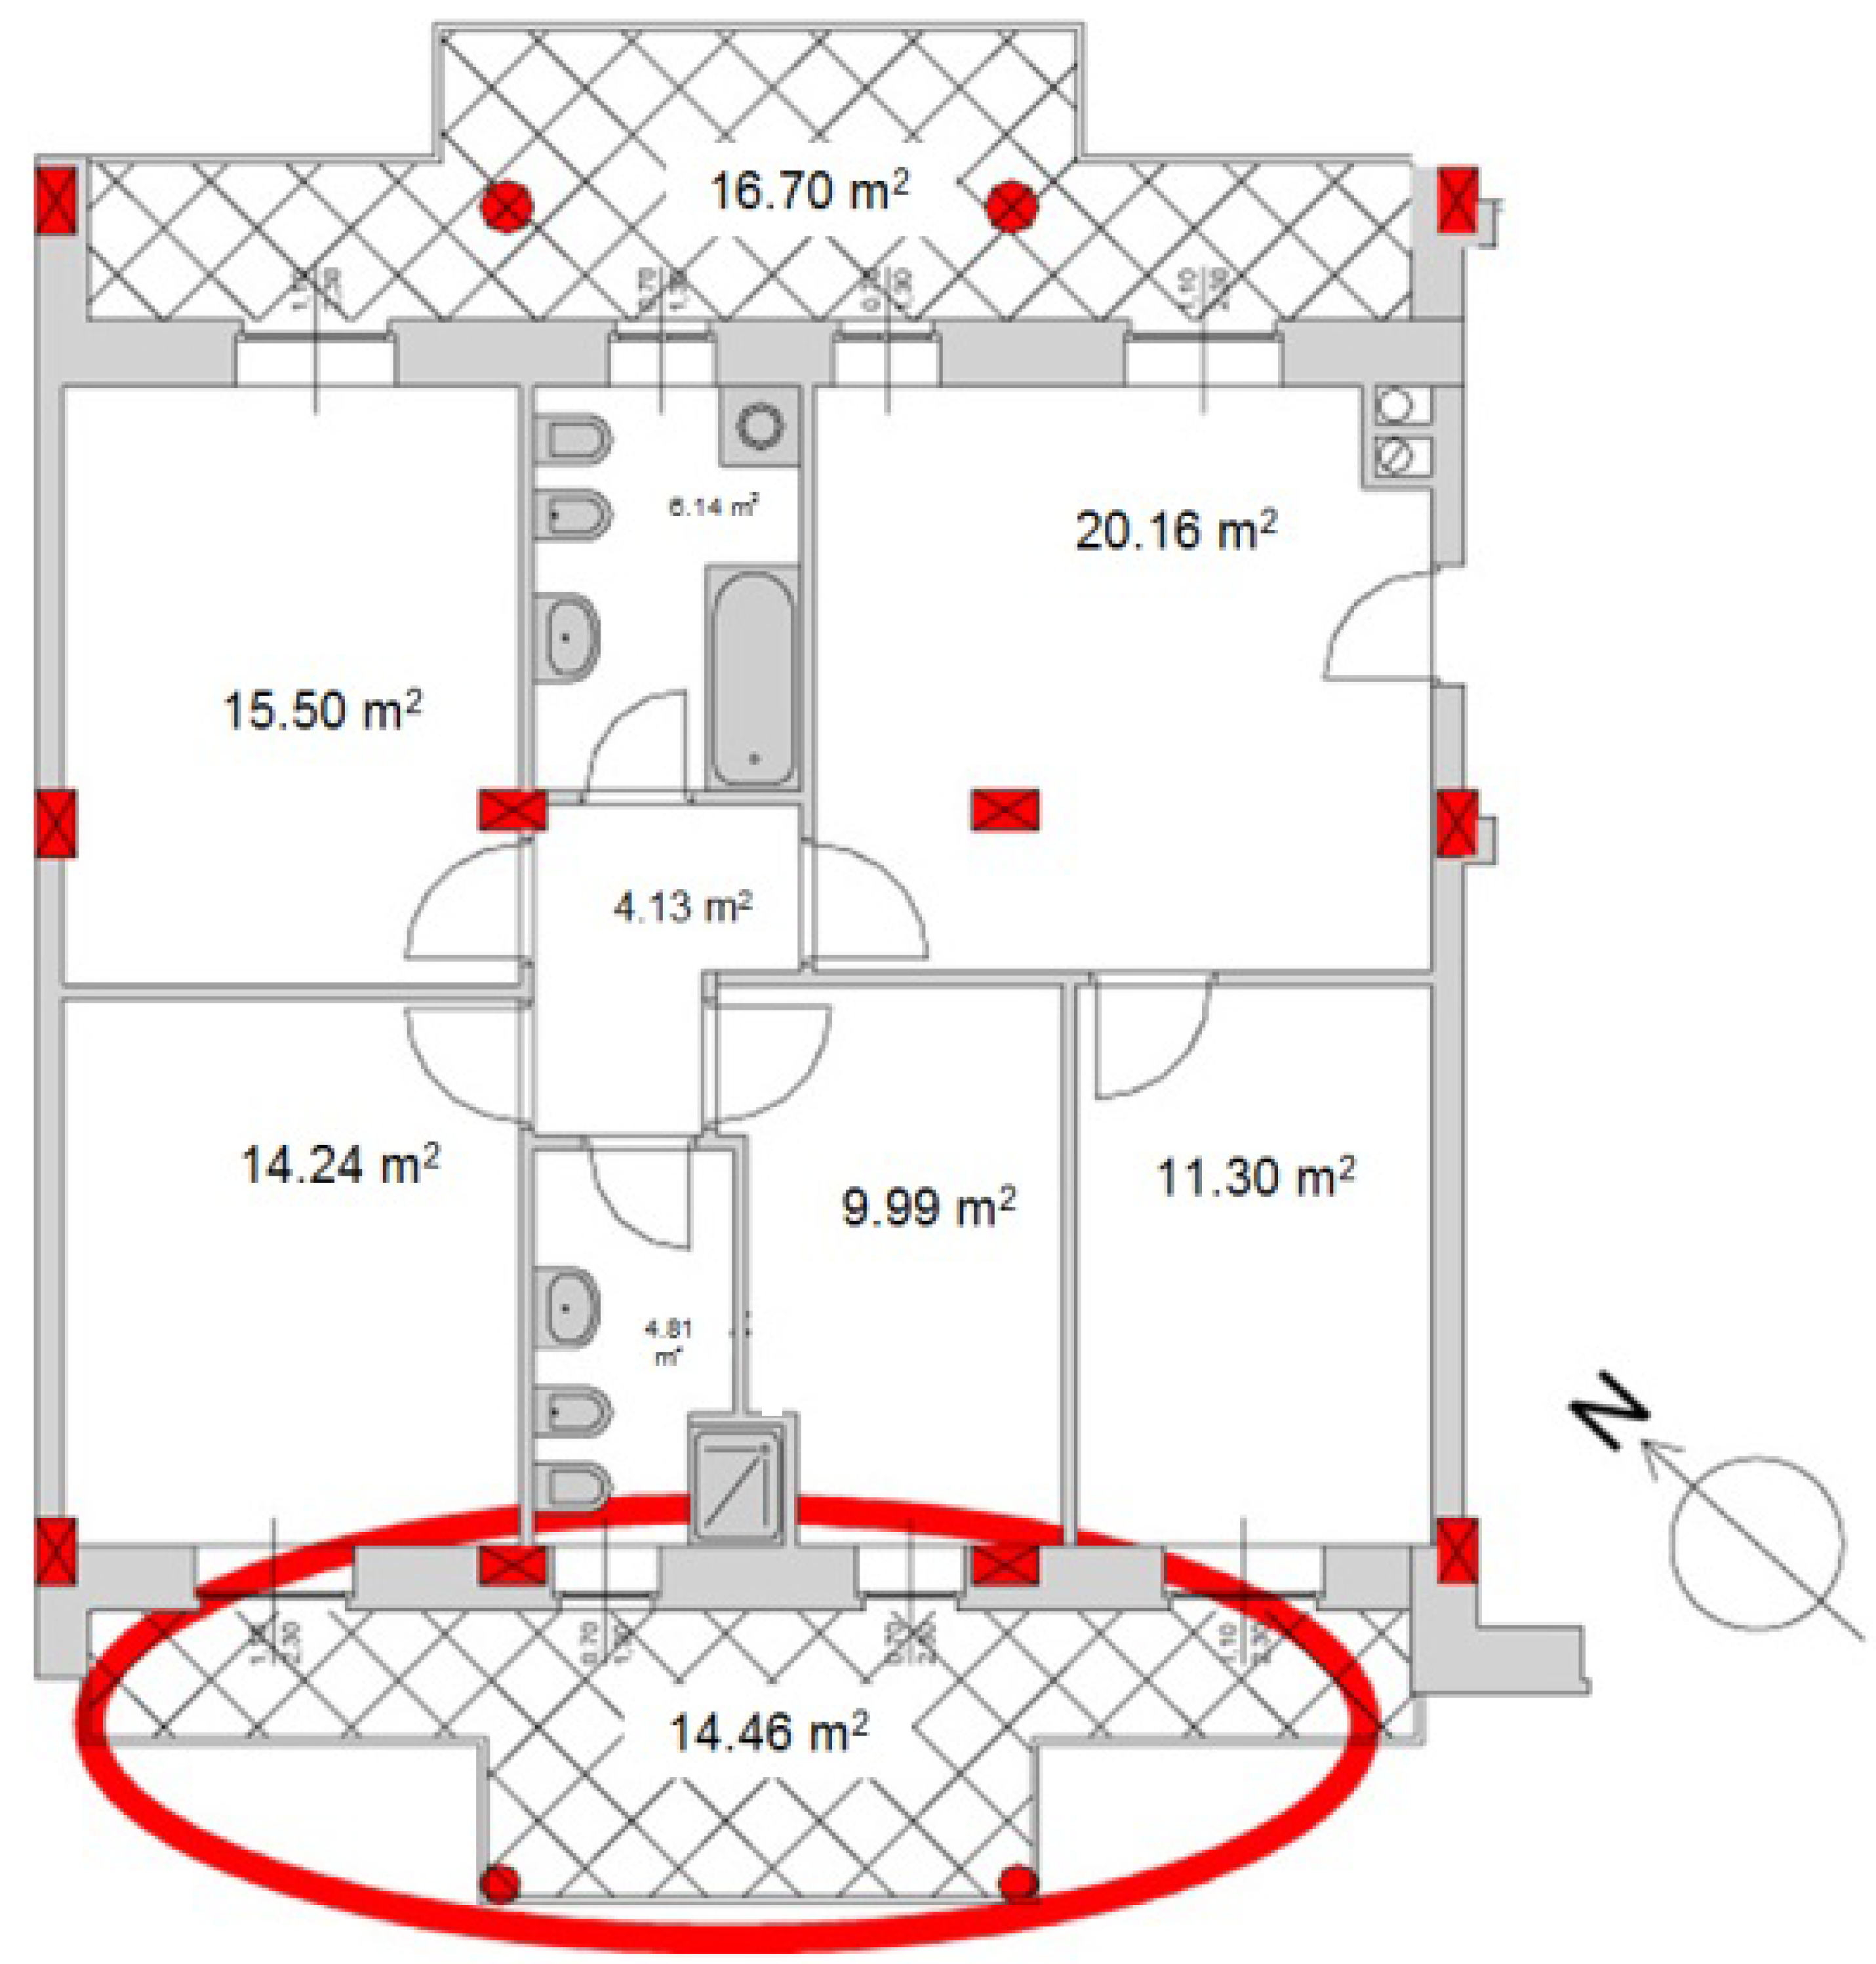
The considered flat is on the first floor and has a surface of 89 m
2; it consists of three bedrooms, two bathrooms, one kitchen and a living-room; it is north-east/ south-west oriented (
Figure 6). The south-west façade is equipped with a sunspace (
Figure 5).
Table 2 and
Table 3 show the main geographical and geometric features of the building and of the flat being studied.
Figure 6.
Plan of the flat used as case study with the sunspace.
Figure 6.
Plan of the flat used as case study with the sunspace.
Table 2.
Main geographic-related characteristics.
Table 2.
Main geographic-related characteristics.
| Climate and geographic data | Città di Castello Perugia, Italy |
|---|
| Altitude | 288 m | Heating Degree Days a | 2.347 |
| Latitude | 43.48° | Climate zone a | E |
| Longitude | 12.23° | Conventional heating period a | 183 days |
Table 3.
Main features of the building and of the flat considered as case-study.
Table 3.
Main features of the building and of the flat considered as case-study.
| Building | Multi-dwelling (19 flats) residential building |
|---|
| Year of construction | 2010 |
| No. of floors | 3/4 |
| Elevation per floor [m] | 2.70 |
| Structure | Reinforced concrete |
| Net area building | 1388 m2 |
| External walls | Bricks with thermal insulating materials in the space, internal plaster and external plaster and bricks |
| Windows | Aluminum windows |
| Roof | Sloped insulated roof |
| Orientation | Longitudinal axis of the building NO-SE oriented |
| Heating and cooling | Central heating boiler |
| Flat | |
| Net area flat | 88.64 m2 |
| Gross heated volume | 336.16 m3 |
| External skin surfaces S | 109.93 m2 |
Shape factor [S/V]
coefficient [1/m] | 0.33 |
| Window to wall ratio | 0.28 |
6. Steady-State Simulations of the Analyzed Flat
For steady-state calculation for the evaluation of the energy need in winter time, the internal temperature was put equal to 20 °C. This value is assumed to be constant through the whole day, during the period fixed at national level. According to the Italian legislation [
19], for the Province of Perugia, the heating season begins on 15October and ends on 15 April.
The energy analysis of the flat was conducted by means of the commercial code MC4 [
20] that implements UNI TS/11300-1 [
5] quasi-steady state (the dynamic effects are taken into account by introducing correlation factors) approach; the sunspace, in this case, was not included in the geometric model since, as stated before, its contribution was calculated with a separate algorithm and then added to the results provided by the software, with the aim of evaluating the solar heat gains entering the heated space from the sunspace through the two above mentioned steady-state procedures, it is necessary to define a virtual partition wall between the greenhouse and the heated space. According to UNI TS 11300-1 and using data shown in
Table 4 the adjustment factor for the adjacent non-heated space (
btr) was evaluated: the value of 0.77 was obtained.
Table 4.
Thermal and geometrical features of the sunspace and of the partition wall.
Table 4.
Thermal and geometrical features of the sunspace and of the partition wall.
| Sunspace | A [m2] | U [W/m2 K] | g [-] |
|---|
| Transparentsurface | 34.5 | 2.20 | 0.53 |
| Partition Wall between the Flat and the Sunspace | A [m2] | U [W/m2 K] | g [-] |
| Transparentsurface | 5.06 | 2.73 | 0.63 |
| Opaque surface | 20.15 | 0.343 | (-) |
The solar heat gains entering the heated space from the greenhouse have to be added to the gains provided by the solar radiation entering into the flat through windows and opaque walls (evaluated through the steady state monthly methods) after deducting the solar heat gains incident on the virtual partition wall. The monthly solar shading reduction factors for the external obstacles (ground of the upper floor sunspace and vertical opaque walls between the adjoining sunspaces) were calculated as shown in
Table 5.
Table 5.
Shading factors due to the opaque obstacles of the solar greenhouse.
Table 5.
Shading factors due to the opaque obstacles of the solar greenhouse.
| Oct. | Nov. | Dec. | Jan. | Feb | Mar. | Apr. |
|---|
| 0.74 | 0.80 | 0.80 | 0.83 | 0.75 | 0.69 | 0.58 |
Thus, the resulting energy need for heating is equal to 25.6 kWh/m2 per year and 28.1 kWh/m2 per year respectively applying the “Method 5000”and the method provided by EN ISO 13790.
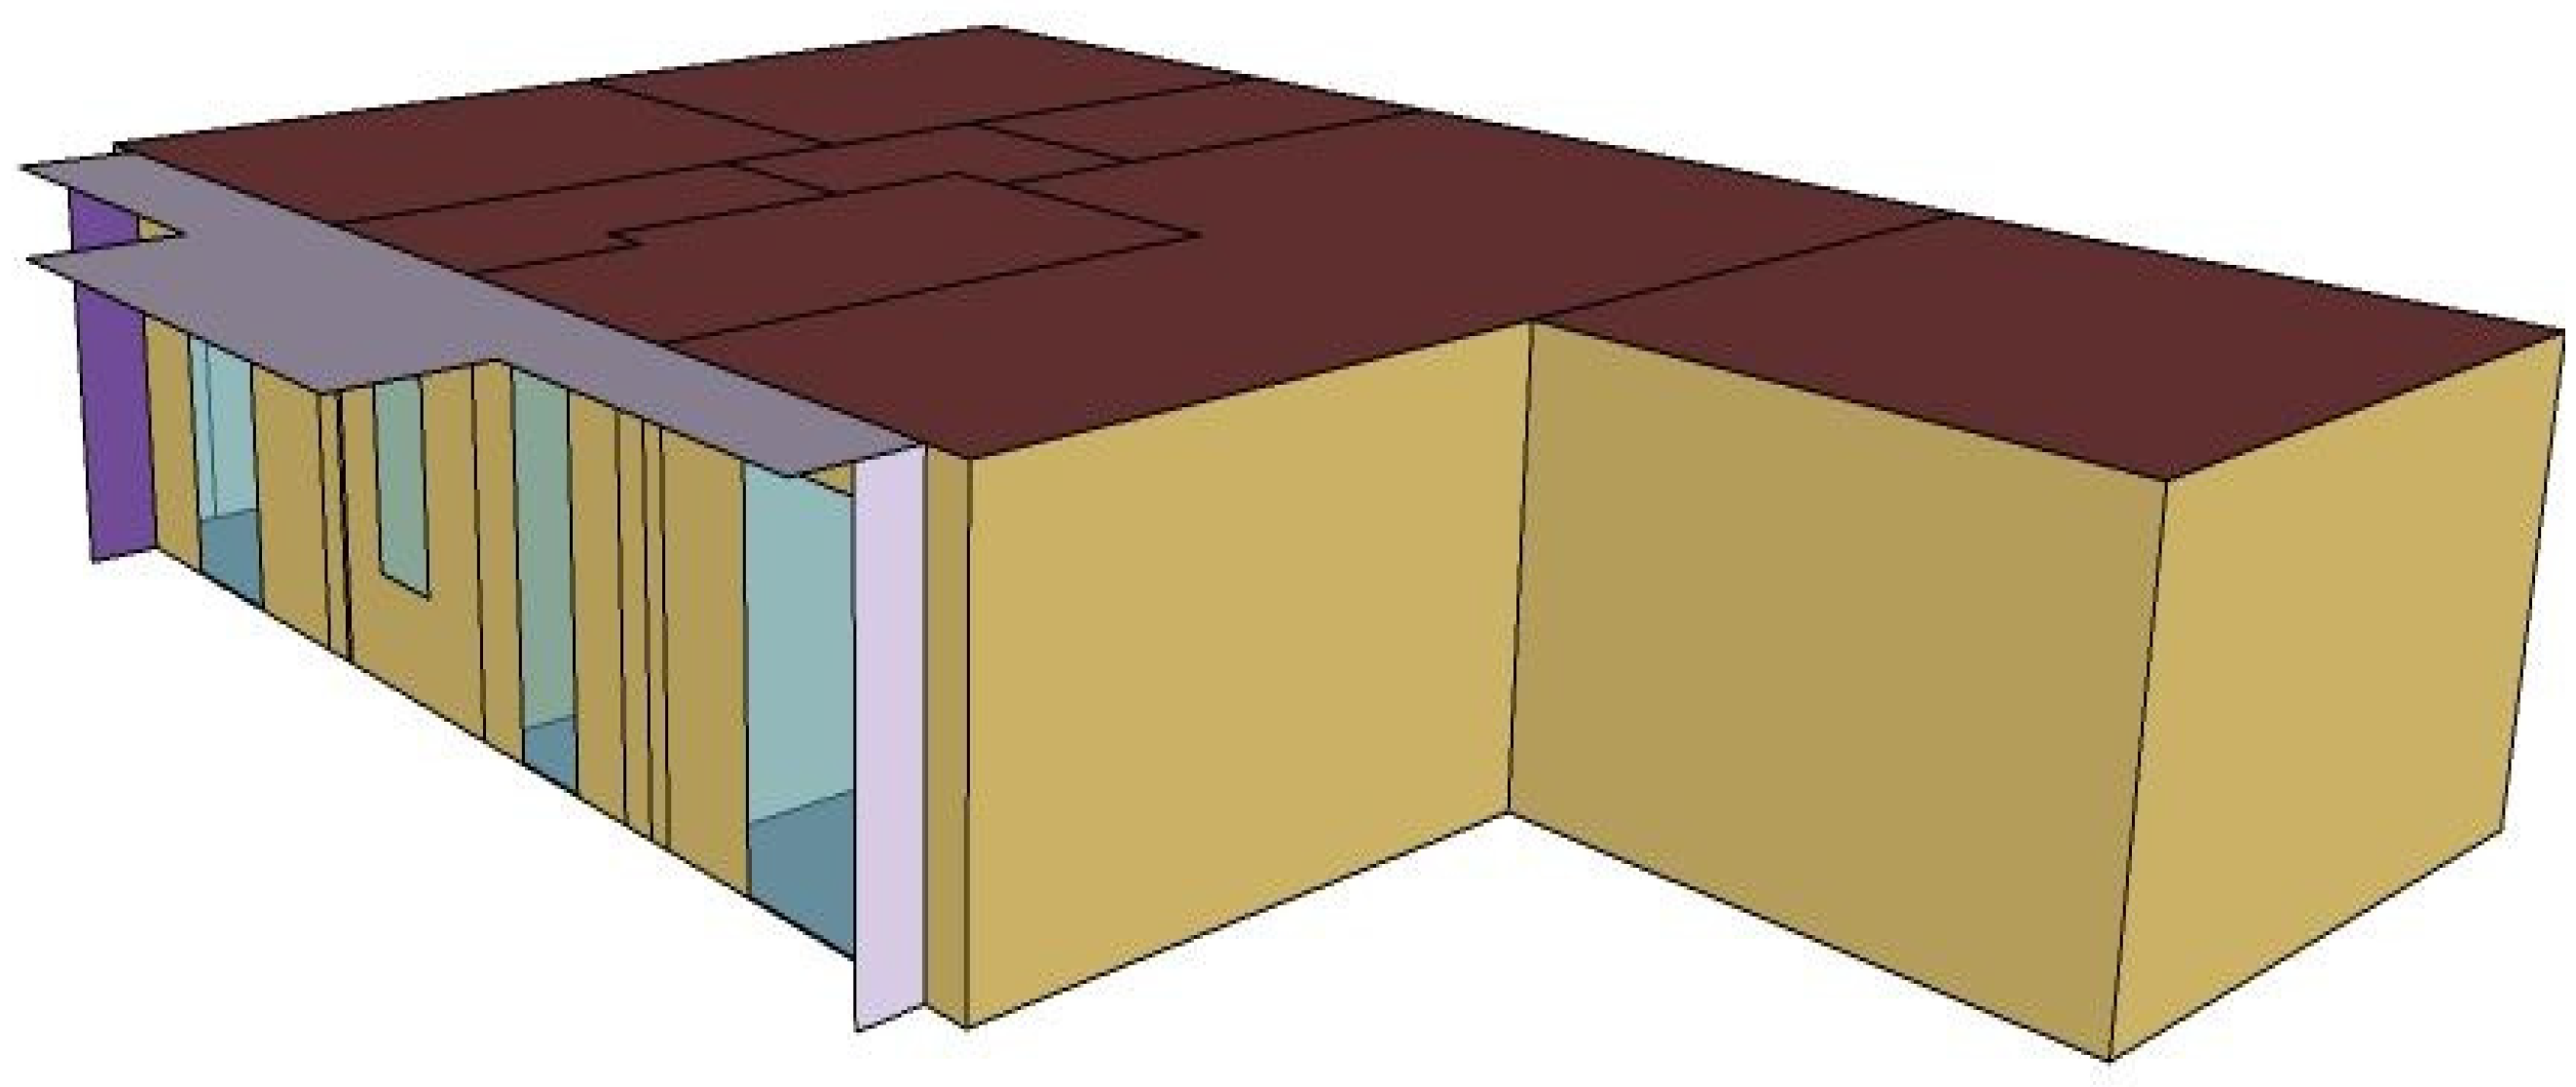
7. Dynamic Simulations of the Analyzed Flat
The dynamic simulations were implemented using Energy Plus [
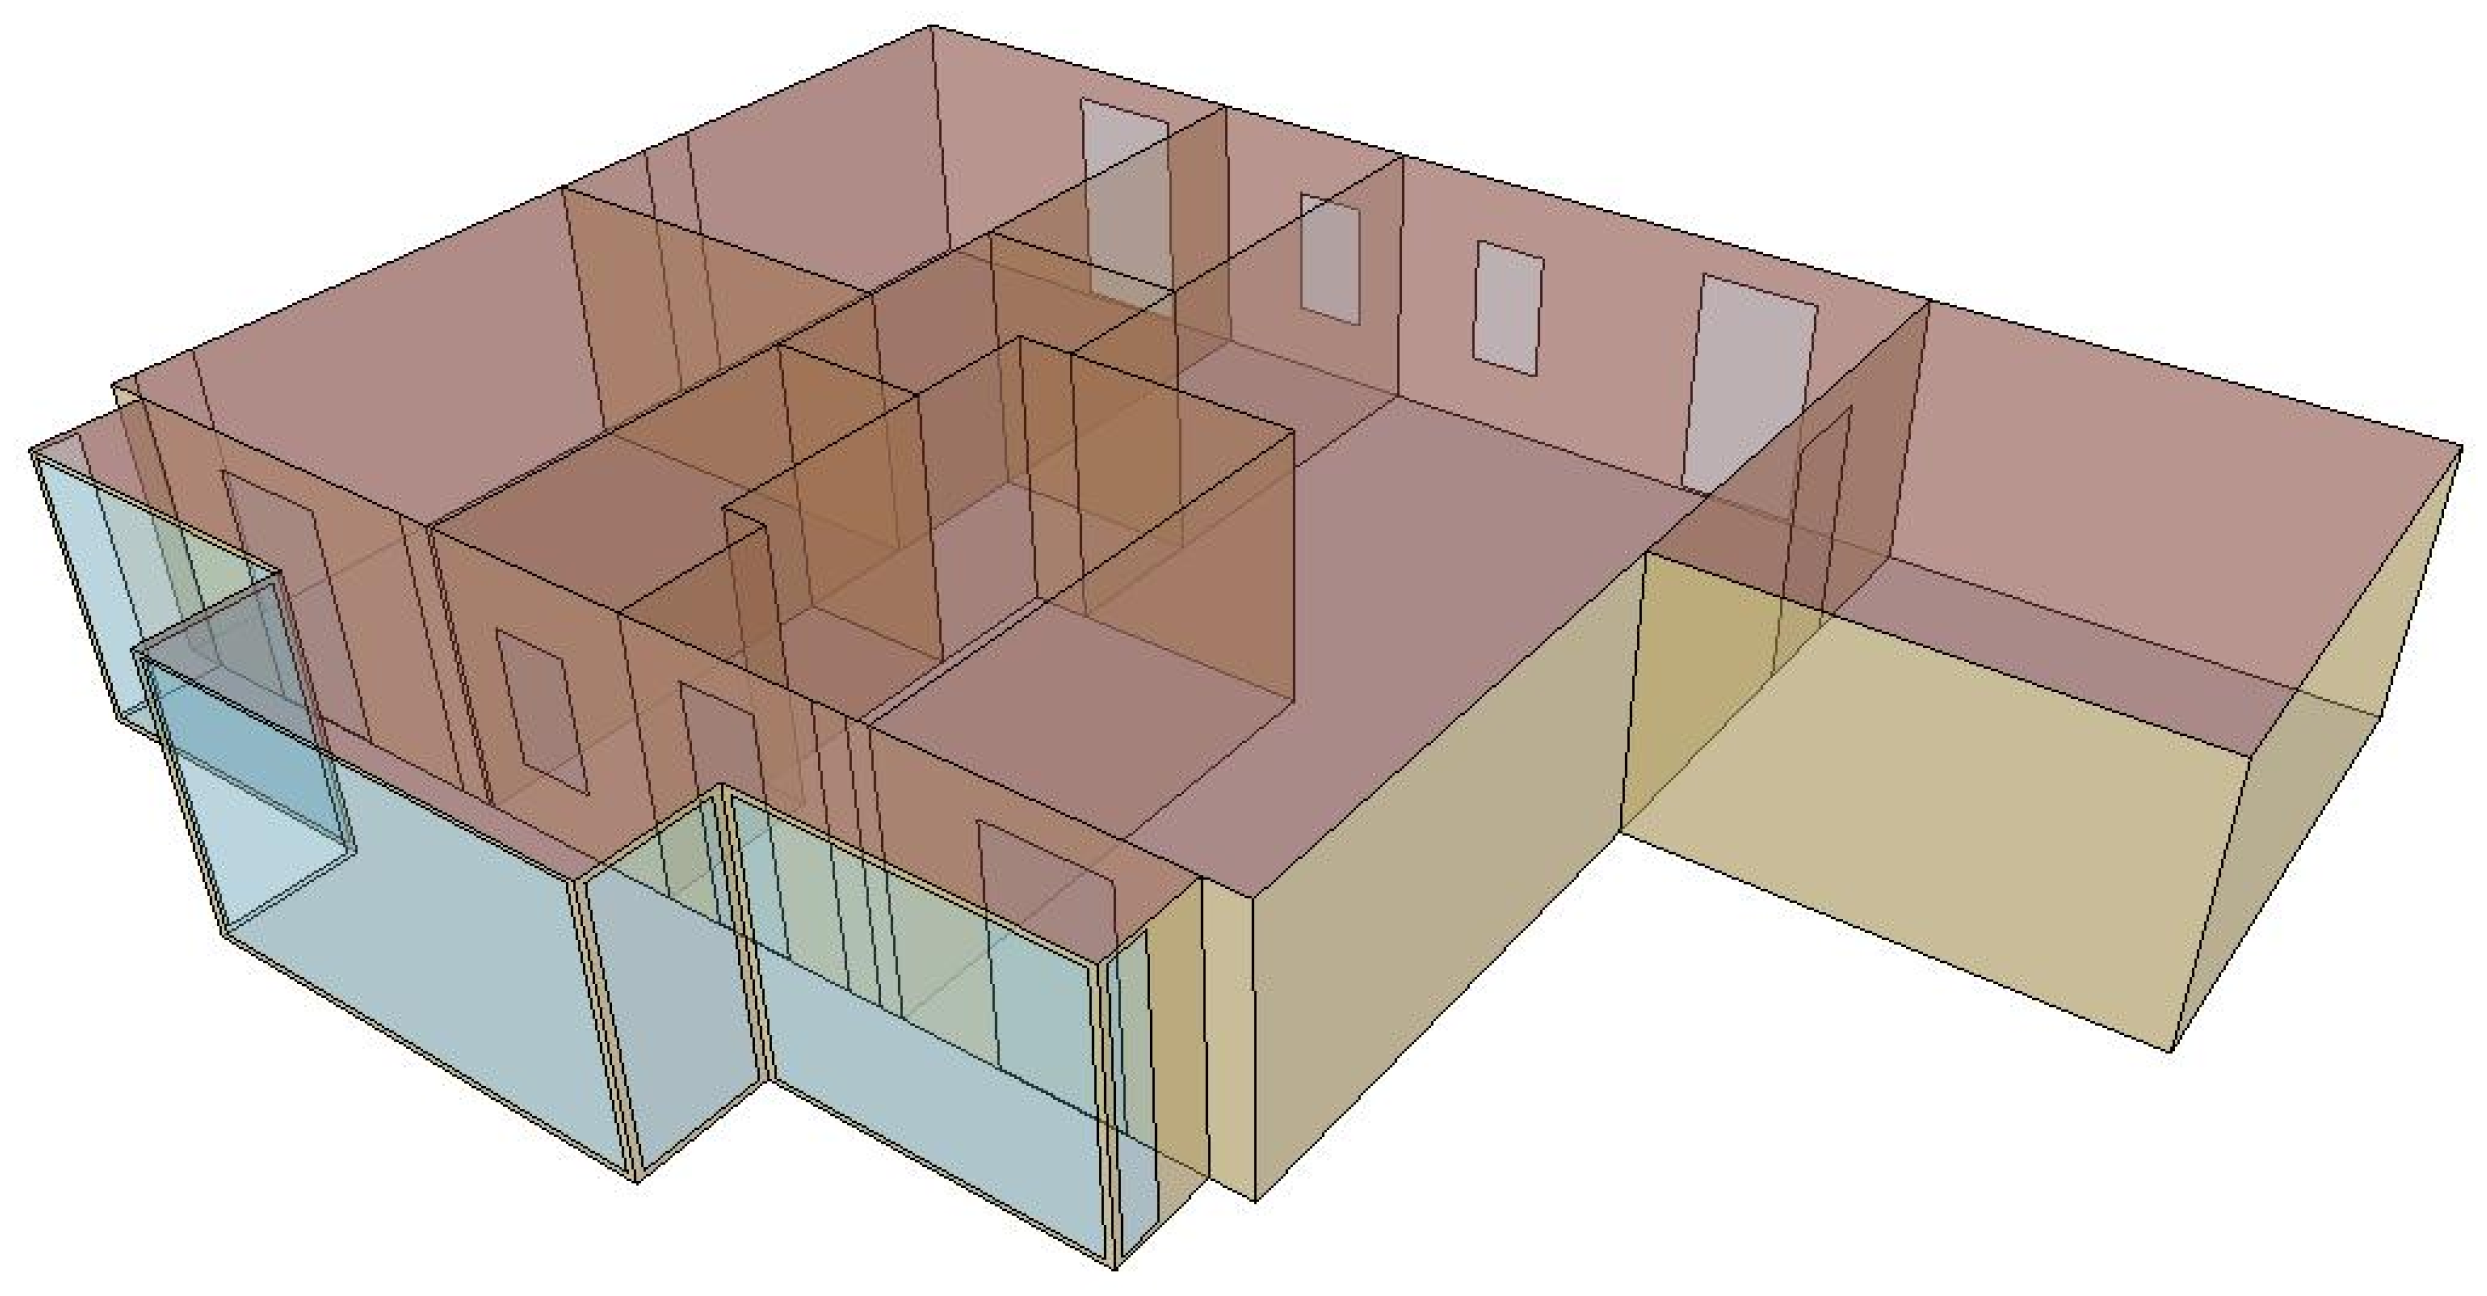
6], developing the flat three-dimensional geometry (
Figure 7) with a graphic platform (Open Studio [
21]), creating two thermal zones: the heated space and the solar greenhouse. Internal heat flow rate is supposed to be equal to 0.5 W/m
2 and the value of 0.3 m
3/h is assumed for the air exchange flow (natural ventilation) as assumed in the steady-state simulations, whereas the effect of the inefficiencies heating plant is disregarded both in steady-state and dynamic simulations.
Figure 7.
Three-dimensional model of the flat with the sunspace.
Figure 7.
Three-dimensional model of the flat with the sunspace.
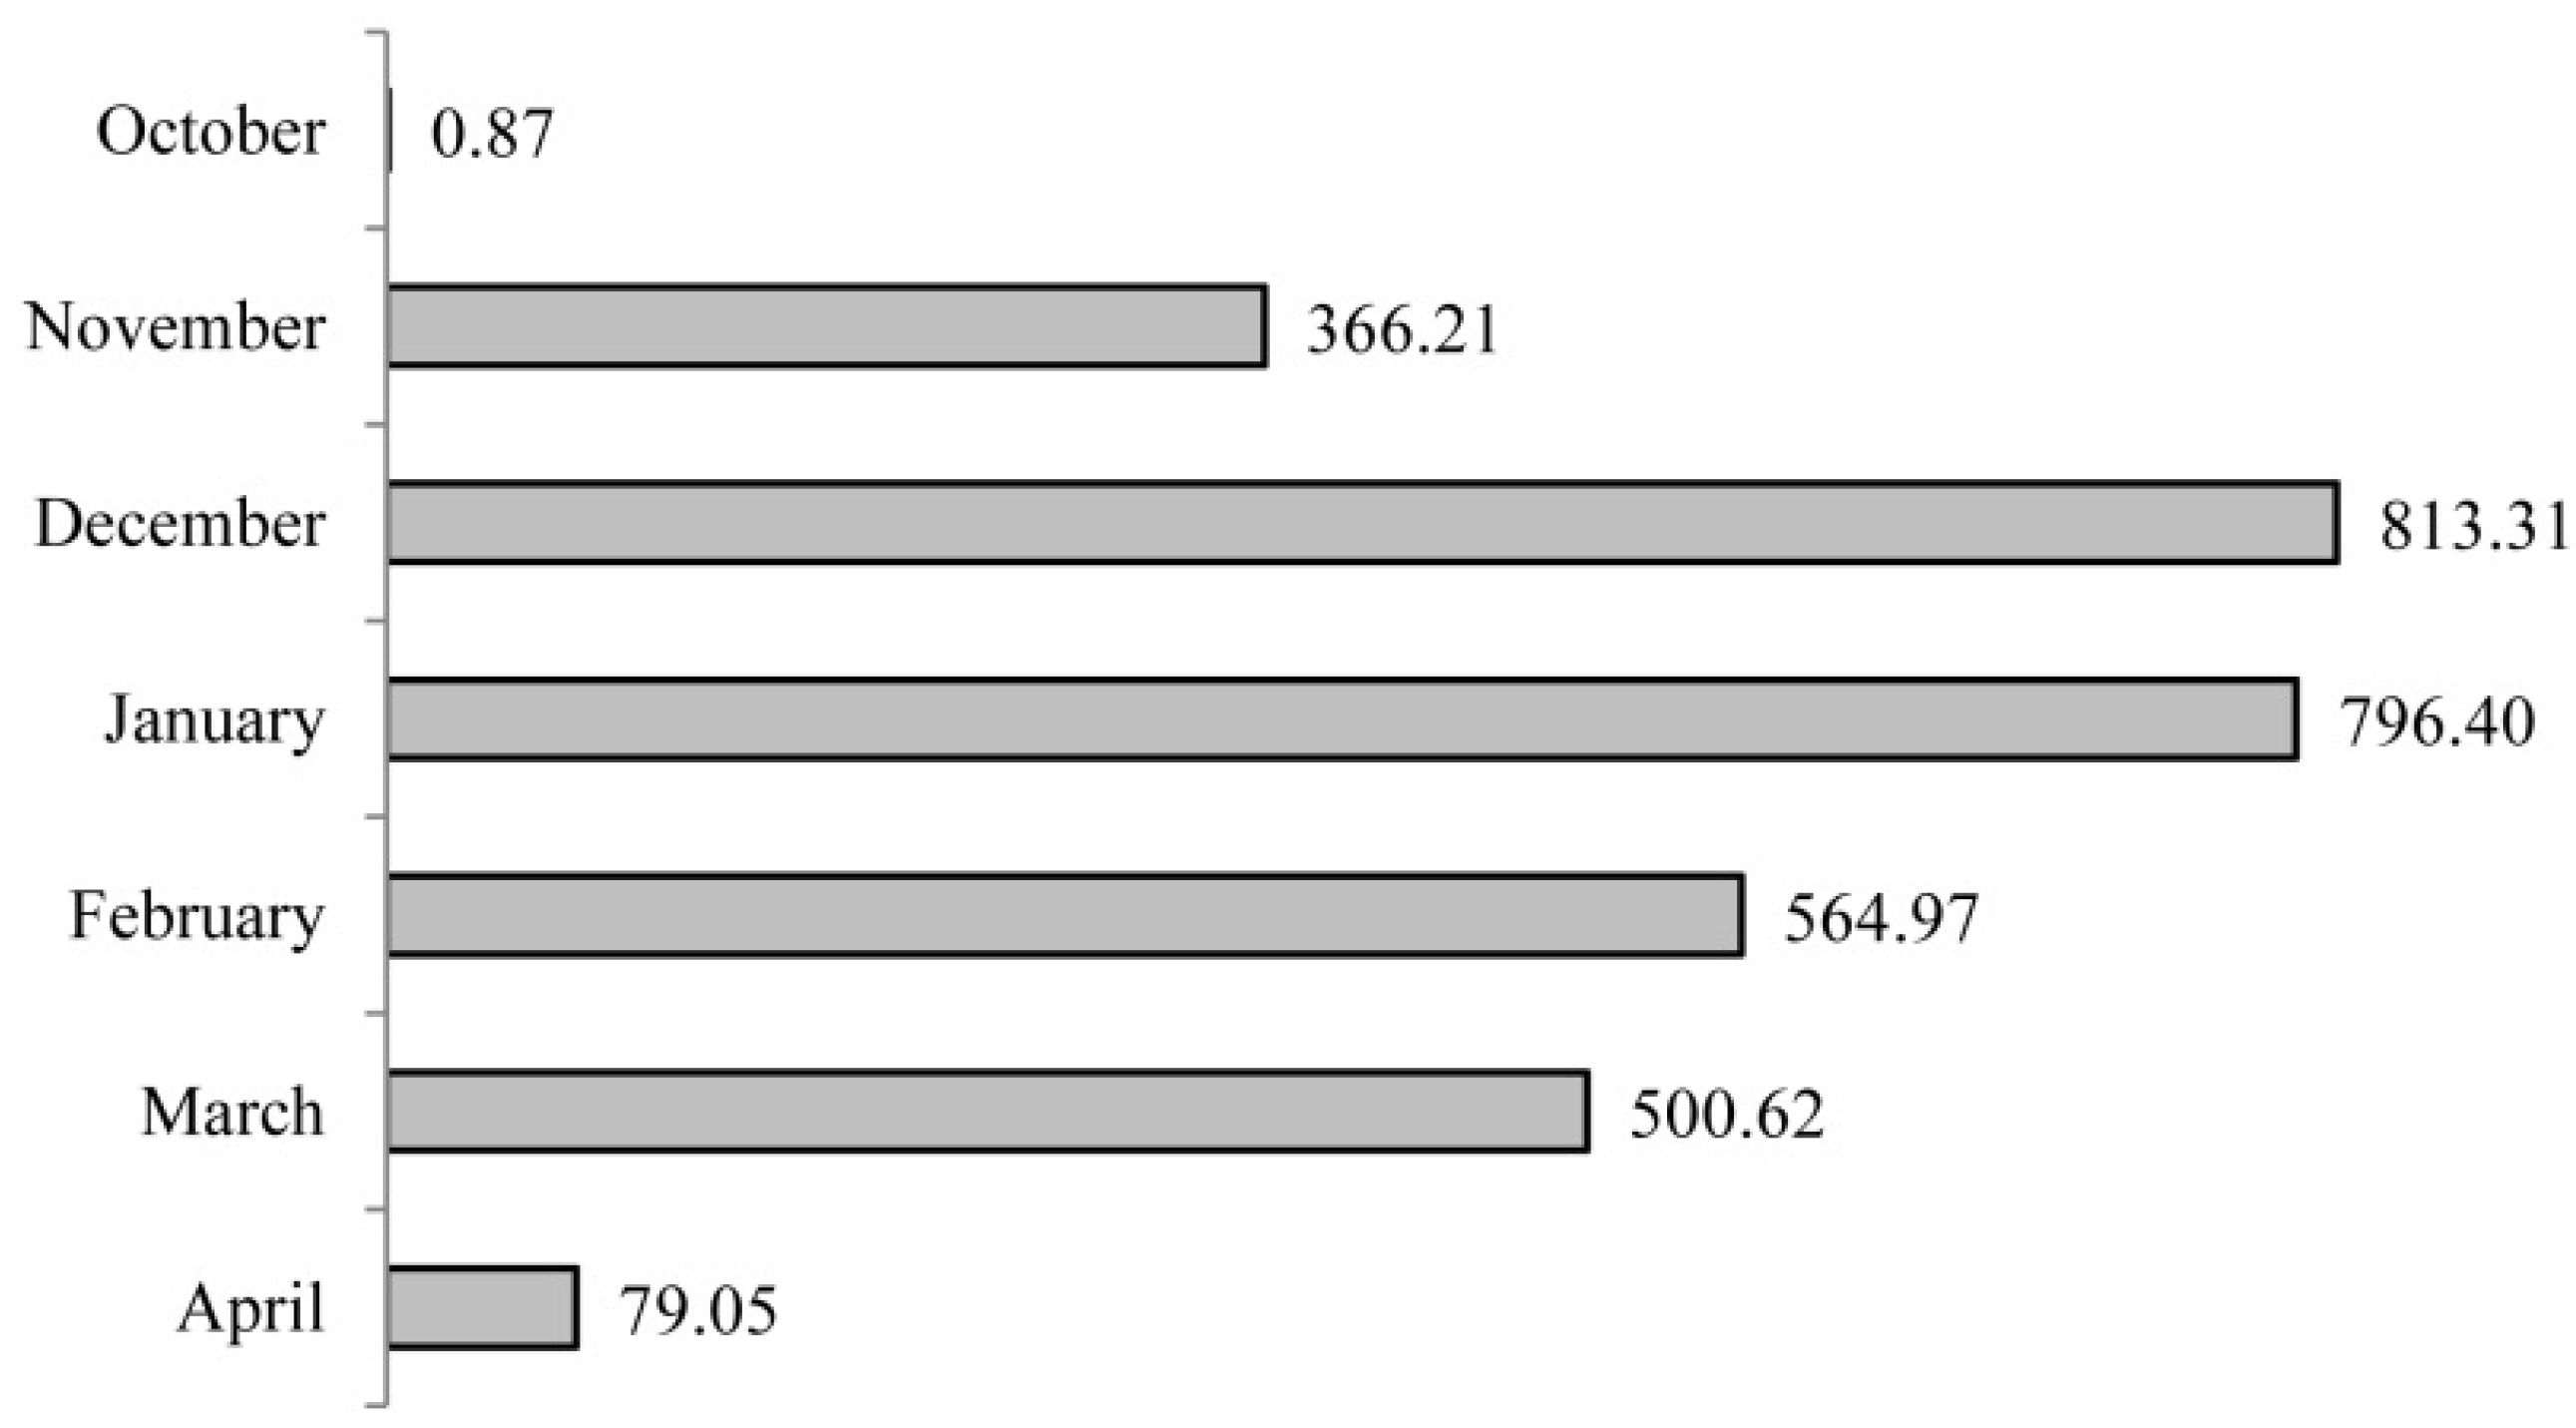
Among the possible output available from the software, it was chosen the one giving the energy required to maintain the set-point temperature (20 °C); in
Figure 8 the results are shown for the heating period as previously defined.
As expected, the higher energy need occurs during the colder months, while in October, also thanks to the presence of the sunspace, there is practically no need for heating. The yearly-based energy requirement is therefore equal to 28.8 kWh/m2 per year.
Figure 8.
Flat energy need for heating (monthly average, kWh).
Figure 8.
Flat energy need for heating (monthly average, kWh).
8. Evaluation of the Solar Greenhouse Energy Contribution and Comparison between the Real Consumption and the Simulation Results
The greenhouse effect evaluation was conducted starting from the definition of the energy need due to the envelope dispersions of the flat without the greenhouse itself (
Figure 9).
Figure 9.
Three-dimensional model of the flat without the sunspace.
Figure 9.
Three-dimensional model of the flat without the sunspace.
Afterwards, the simulations were extended considering also the contribution of the greenhouse with three different methods.
Table 6 summarizes all the results, reporting the energy requirements (in kWh/m
2 per year) of the flat without and with the green house and the influence (in %) of the greenhouse itself.
The simulations without the greenhouse give a slightly higher energy need for the dynamic approach (Energy Plus) respect to the steady-state method (MC4). The main reason that explains this difference has to be found in the meteorological data: in Energy Plus, the monthly average temperatures result lower than those used in the MC4 code, so decreasing the envelope dispersions towards the external environment.
Table 6 shows that, considering the three different methods, the average reduction of the winter energy demand due to the greenhouse is about 20%, according to data found in literature for similar configurations [
8,
9].
Table 6.
Greenhouse energy contribution: simulation results (envelope dispersions).
Table 6.
Greenhouse energy contribution: simulation results (envelope dispersions).
| Flat without the greenhouse | Energy requirements [kWh/m2 per year] |
|---|
| MC4 | 32.0 |
| Energy Plus | 34.7 |
| Flat with the greenhouse | Energy requirements [kWh/m2 per year] |
| MC4 + method 5000 | 25.6 |
| MC4 + EN 13790 | 28.1 |
| Energy Plus | 28.8 |
| Greenhouse influence | % |
| MC4 + method 5000 | 25 |
| MC4 + EN 13790 | 14 |
| Energy Plus | 20 |
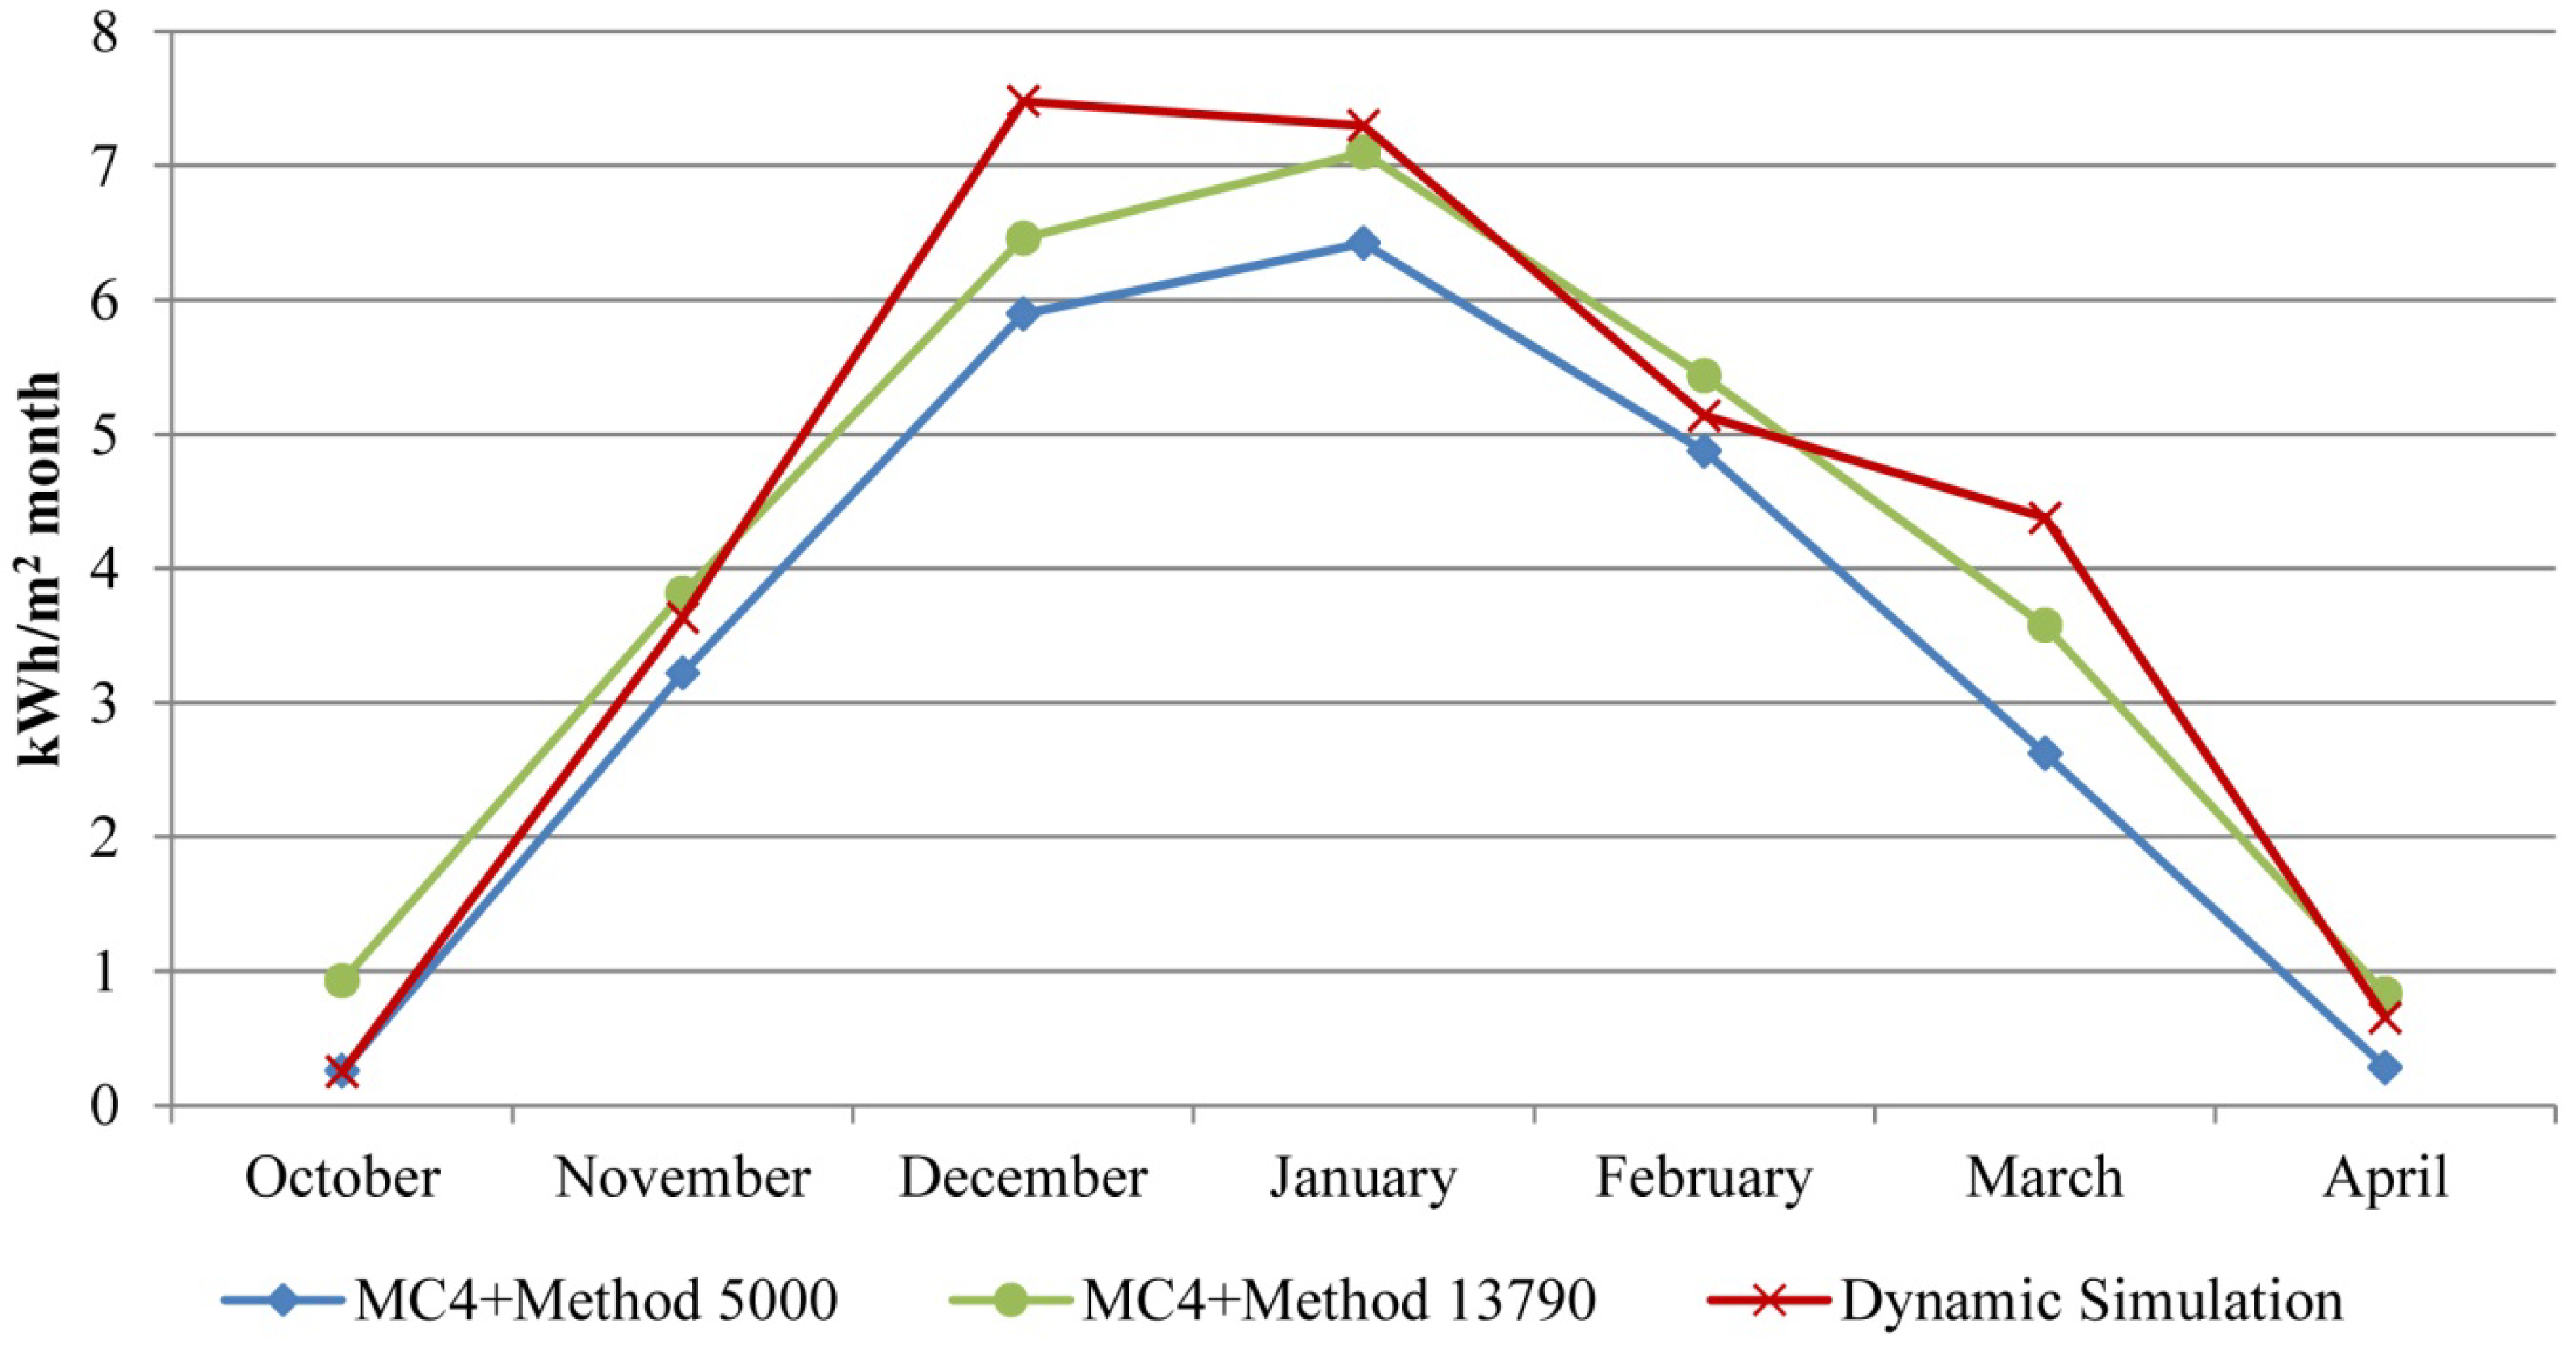
Focusing on the simulations including the greenhouse, the method 5000 seems to slightly overestimate the contribution of the solar passive system, while the dynamic simulations give results close to the ones derived from EN ISO 13790, as also testified by
Figure 10, where the monthly need of the flat with the greenhouse is reported for the methods 5000, EN ISO 13790 and dynamic.
Figure 10.
Monthly trend of the flat+ sunspace energy need for heating, evaluated with three different methods.
Figure 10.
Monthly trend of the flat+ sunspace energy need for heating, evaluated with three different methods.
The real flat was monitored foran entire heating season, to assess the actual consumptions to be compared with the simulation results. In particular, the flat’s gas meter was checked every week from October to April and the real consumptions (gas cubic meters) were registered; the results are showed in
Table 7.
Table 7.
Real heating energy consumptions for the flat analyzed.
Table 7.
Real heating energy consumptions for the flat analyzed.
| Monitoring period | Total annual consumption | Flat area | Total annual consumption per area unit | Total annual consumption per inhabitant |
|---|
| [kWh per year] | [m2] | [kWh/m2 per year] | [kWh/inhabitant per year] |
|---|
| from 21/10/2010 to 10/03/2011 | 3172.4 | 88.6 | 35.8 | 1586.2 |
With the aim of comparing results of the real energy need with simulated ones, it is necessary for the latter to take into account the heating plant losses, since data reported in
Table 6 refer only to the envelope. The code MC4 gives the possibility to assess, month by month, the efficiencies of the production, distribution, emission and regulation subsystems, so allowing the possibility to go back up to the primary energy consumption (
Table 8).
Table 8.
Primary energy need for the analyzed flat: real values and results of the three simulation methods.
Table 8.
Primary energy need for the analyzed flat: real values and results of the three simulation methods.
| Method | Primary energy need [kWh/m2 per year] |
|---|
| Real consumption | 35.8 |
| MC4 + method 5000 | 29.0 |
| MC4 + EN 13790 | 32.0 |
| EnergyPlus | 32.8 |
It may be concluded that all the methodologies produce results reasonably close to the real ones; the Method 5000 seems to be the one which slightly overestimates the contribution of the sunspace, while, as expected, the dynamic tool (Energy Plus) produces the closest results to the real ones.
9. Conclusions
The paper presents an evaluation of the effect of solar greenhouses in the energy balance of a building, using two different stationary procedures, along with a dynamic simulation tool (TRNSYS).
These solar passive systems are becoming more and more popular, especially in temperate climates, and therefore there is a need to develop more accurate simulation tools. The effect of a typical solar greenhouse on the energy balance of a building was first of all evaluated with two stationary procedures (Method 5000 and EN ISO 13790) and with a dynamic tool (TRNSYS). The analysis was useful to understand the strengths and the weaknesses of the various methods; furthermore the results put in evidence that the contribution of the sunspace to winter energy savings is significantly affected by the thermal characteristics of the partition wall between the sunspace itself and the heated volume of the building.
After the analysis of the greenhouse alone, the behavior of an entire, real flat, equipped with a sunspace, was simulated, according to the indications of the Italian Standards UNI/TS 11300 and using both a semi-stationary tool and a dynamic one. The different methods previously cited for the simulation of the sunspace were used. A flat equipped with a sunspace, recently built thanks to public contributions provided by the Umbria Region in Italy to widespread bio-climatic architecture, was taken as case-study.
Finally, the real energy consumptions of the flat were compared with the results obtained with the different methodologies. The results show that the average reduction of the winter energy demand due to the greenhouse is about 20%, and that all methodologies are in good agreement with real energy consumptions data. Among the various methods, the Method 5000 seems to slightly overestimate the contribution of the sunspace.


