1. Introduction
Compressed Air Energy Storage (CAES) and Pumped Hydro Energy Storage, air and water being the most inexpensive fluids, are likely to be the most reliable and technologically sound options for massive energy storage [
1,
2], even if other alternatives are proposed [
3].
Pumped Hydro Energy Storage systems require two reservoirs at different elevation and a pump/turbine for storing/recovering energy in form of water head. Their high energy efficiency (60%–78% [
1]) has gained them widespread use, but development of new Pumped Hydro Energy Storage is often constrained by localization difficulties. In many situations where cost-effective and environmentally acceptable sites are unavailable, alternative technologies may be useful.
CAES systems replace water basins with underground storage volumes (caverns in salt or rock formations, porous rocks, depleted natural gas fields) which are used as reservoirs for pressurized air (60–70 bar). Normally, for a given capacity, a CAES uses less land surface than a PHES and does not require an elevated reservoir.
When natural storage volumes are scarce or too distant from the energy grid, artificial storage volumes can be developed in form of high-pressure vessels or underground pipes. Artificial storage is typically more expensive than a natural one. It has been shown [
4] that an increase in the storage pressure (>100 bar) can decrease the material cost of the vessels. In any case, high storage pressure makes the compression/expansion train more complex.
It is likely that artificial storage CAES would be preferable on a small scale (1–10 MW), whenever the convenience of a given site overcomes the lack of a natural reservoir. Incidentally, an artificial storage is easier to control in terms of air contaminants at turbine inlet.
Existing CAES plants are all gas fuelled, compressed air being heated in a combustion chamber ahead of the turbine during the expansion phase. Hence, these systems combine energy storage within a power plant. The first 290 MW plant built at Huntdorf (Germany) in 1978 is very simple [
5]: no attempt was made to recover any thermal energy at turbine exhaust or at compressor exit, before storage in the cavern. The main purpose of this earlier plant was to transfer energy produced by nuclear or coal plants from low to peak demand hours.
A second plant, McIntosh-Alabama (U.S.A.) [
6], has a recuperator between the hot turbine exhaust and the cold air stream coming from the cavern, in order to reduce the fuel consumption. Many refined schemes have been proposed [
7,
8], with notable energy efficiency improvements or using alternative fuels [
9].
A significant breakthrough is the so-called “Adiabatic CAES” (ACAES) [
10,
11] that has been prompted by the increasing market share of renewable, intermittent energy sources. This configuration gets rid of the combustion chamber and takes full advantage of the thermal recovery from the hot, compressed air to raise the air temperature before expansion. If compression is performed in a common radial or axial machine,
i.e., it is practically adiabatic, the recoverable thermal energy at compressor exit is of the same order of magnitude of compression work. Being compression and expansion performed in different phases, a Thermal Energy Storage is necessary. Expected benefits of this configuration are:
improved energy efficiency,
avoidance of a connection to the natural gas grid or any other fuel distribution,
elimination of pollutant emissions,
lower turbine operating temperature.
The second point may be useful if the CAES is thought as an addendum to a wind farm or any other remote energy source. According to the economic analysis presented in [
10], ACAES may be useful as:
centralized plants—size around 300 MW—in countries with high spread between base and peak energy price;
decentralized plants—size around 150 MW—near large windfarms in order to increase full load operation, peak price sales and utilization of the power lines;
remote island solutions—size around 30 MW—integrated with wind power, aimed at increase of full load operation of wind turbines and savings of grid connection costs or fuel consumption.
When designing the heat recovery, storage and reclaim system, the simplest option is to introduce one or more heat exchangers on the compression and on the expansion train. Heat storage medium can be liquid or solid or phase change material. In principle, the optimum thermodynamic design should pursue a quasi-isothermal compression/expansion. In the limit of isothermal transformations, the work consumed per unit mass of compressed air would be minimum and the same amount would be returned during expansion,
i.e., energy recovery would be complete. In this case, the TES would be ambient air itself and hence would have infinite thermal capacity at no cost. The energy recovery efficiency is hence expected to increase with the number of stages (compressor plus cooler or heater plus turbine) as demonstrated in [
12].
In practice, when the compression/expansion is divided in a large number of stages in order to approximate an isothermal behavior, concentrated losses in the connections between stages and heat exchangers become predominant. A compromise, accounting for system complexity and cost, must be pursued. In any case, increasing the number of stages reduces the maximum temperature of the TES during compression and hence simplifies its design. For example, if the TES temperature is kept below 100 °C, the storage medium can be liquid water at moderate pressure.
All components of a CAES plants are commercially available: compressors, heat exchangers, large volume vessels for high pressure (in case of artificial storage), radial expanders, insulated water reservoirs. Variable Inlet Guide Vanes may be used to adapt the compressors/expanders at the variable storage pressure. Variable configurations of the compression/expansion train have been shown in [
4,
12] to extend the operating range. Reciprocating compressors may be integrated in the train for the last stages, when the storage pressure approaches its maximum.
Some caution must be used when comparing ACAES energy efficiency with gas fuelled CAES. For example, the ACAES efficiency (electrical energy output divided by electrical input) should not be matched against the “round trip efficiency” of a non-adiabatic CAES [
13], where a significant part of the energy is produced from a primary fossil source right at the time of peak demand. The two systems are different as they use different energy sources; moreover, the fossil fuel itself is used as a chemical storage backup. From this point of view, ACAES only can qualify—depending on the input electricity primary energy mix—as a fully-green storage device.
Plant Description and Mode of Operation
The plant described hereafter represents an option currently proposed for storage of electricity to utilities and grid operators. The authors apologize for not being allowed to provide some confidential data.
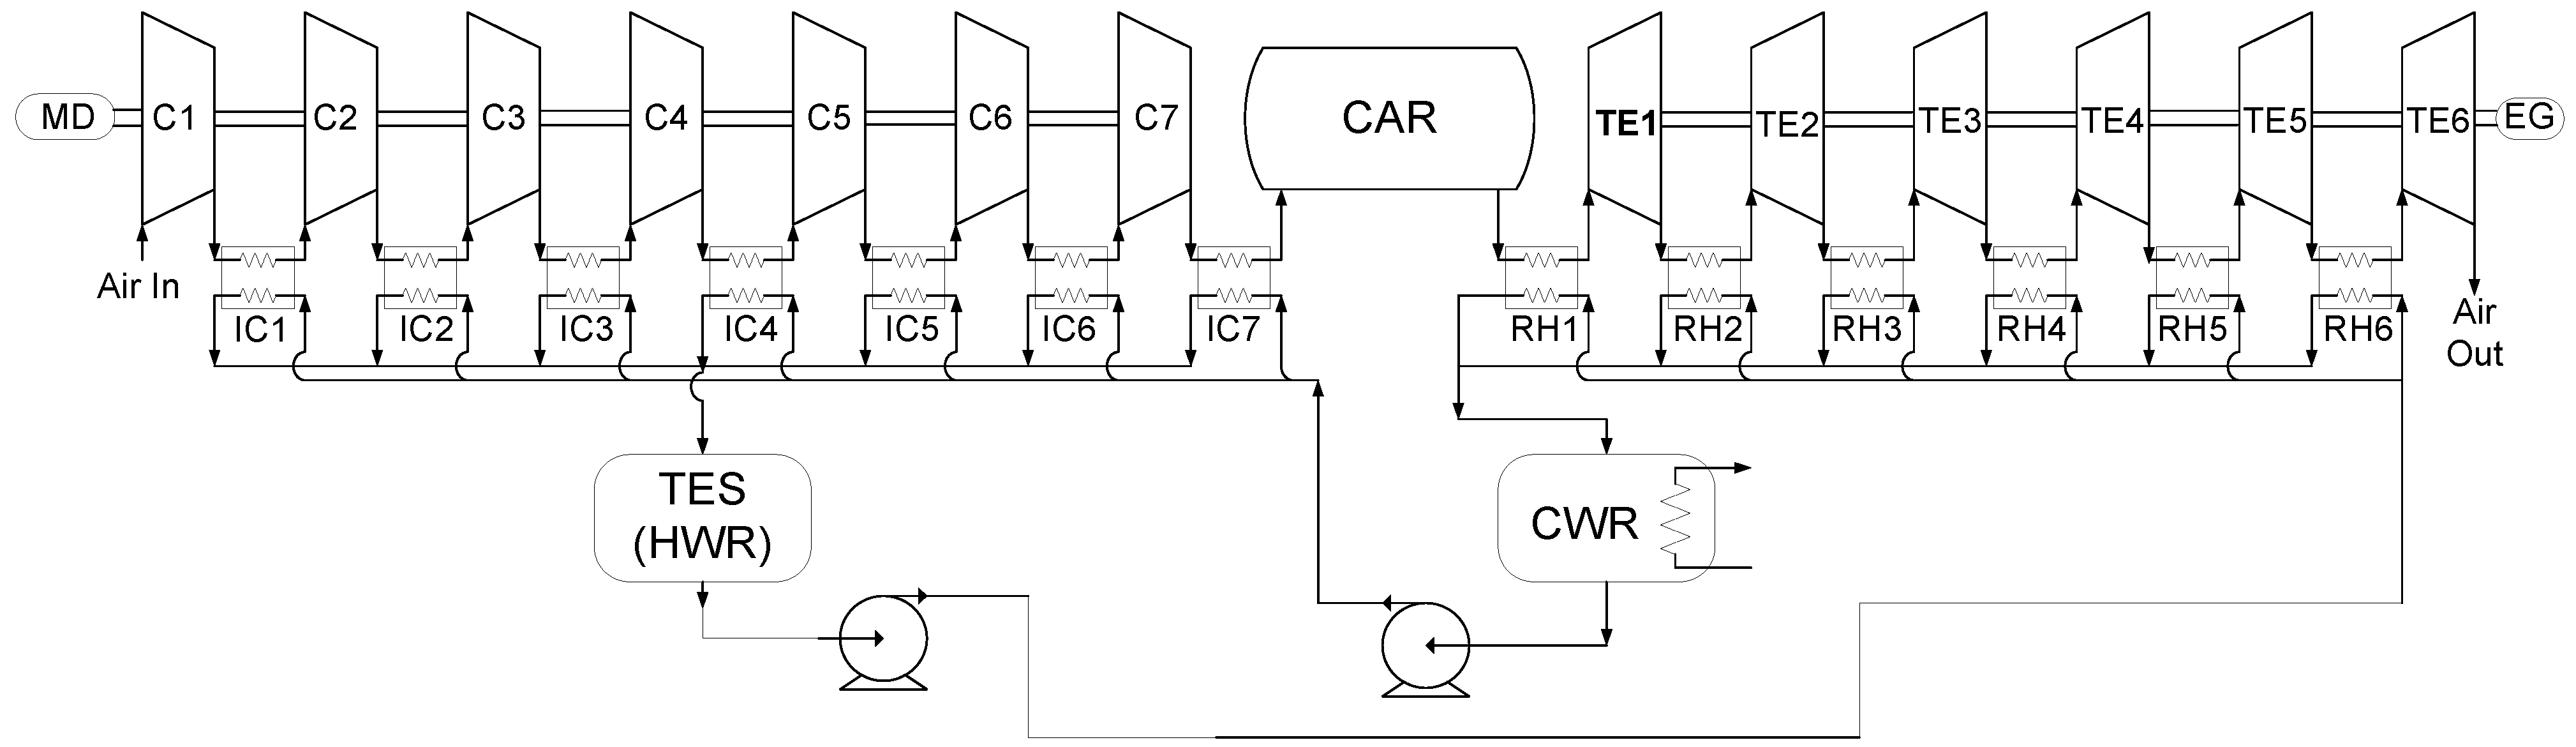
The proposed ACAES system (
Figure 1, from an idea by “ENEL Ingegneria e Innovazione” similar to the scheme proposed in [
4]), is designed as a typical backup unit for wind energy plants. It is based on a seven-stage intercooled compression train. The inlet air (25 °C, 1 bar, dry air) passes through the compression train (an air-based version of that described in [
14]), driven by an electric motor (MD), and is stored in pressurized vessels with an overall volume of 6,340 m
3. The compressed air storage reservoir (CAR) is built as a system of interconnected vessels; it is pre-pressurized at 77 bar, so that the compressor train starts operating at this pressure, and finishes its operating cycle when the discharge pressure reaches 125 bar. The compressors operated most of the time in off-design conditions (variable Inlet Guide Vanes setting helps maintaining a good efficiency at off-design). The intercoolers (IC) are water-cooled: the heat from the intercoolers is recovered and stored in a hot water reservoir (TES). Following the description of the air path, the plant is completed by a six-stage expansion train (TE), geared to the electric generator (EG). The expansion is reheated after each stage, recovering heat stored in the hot water tank in a water/air heat recovery heat exchanger (RH). The cold water flow at the RH discharge is recovered in the cold water reservoir (CWR), from which it is re-used in a closed loop for the next operating cycle. Before re-use, water is cooled down to the temperature of the environment by an external cooler.
Figure 1.
Schematic of the CAES plant.
Figure 1.
Schematic of the CAES plant.
2. CAES Plant Components
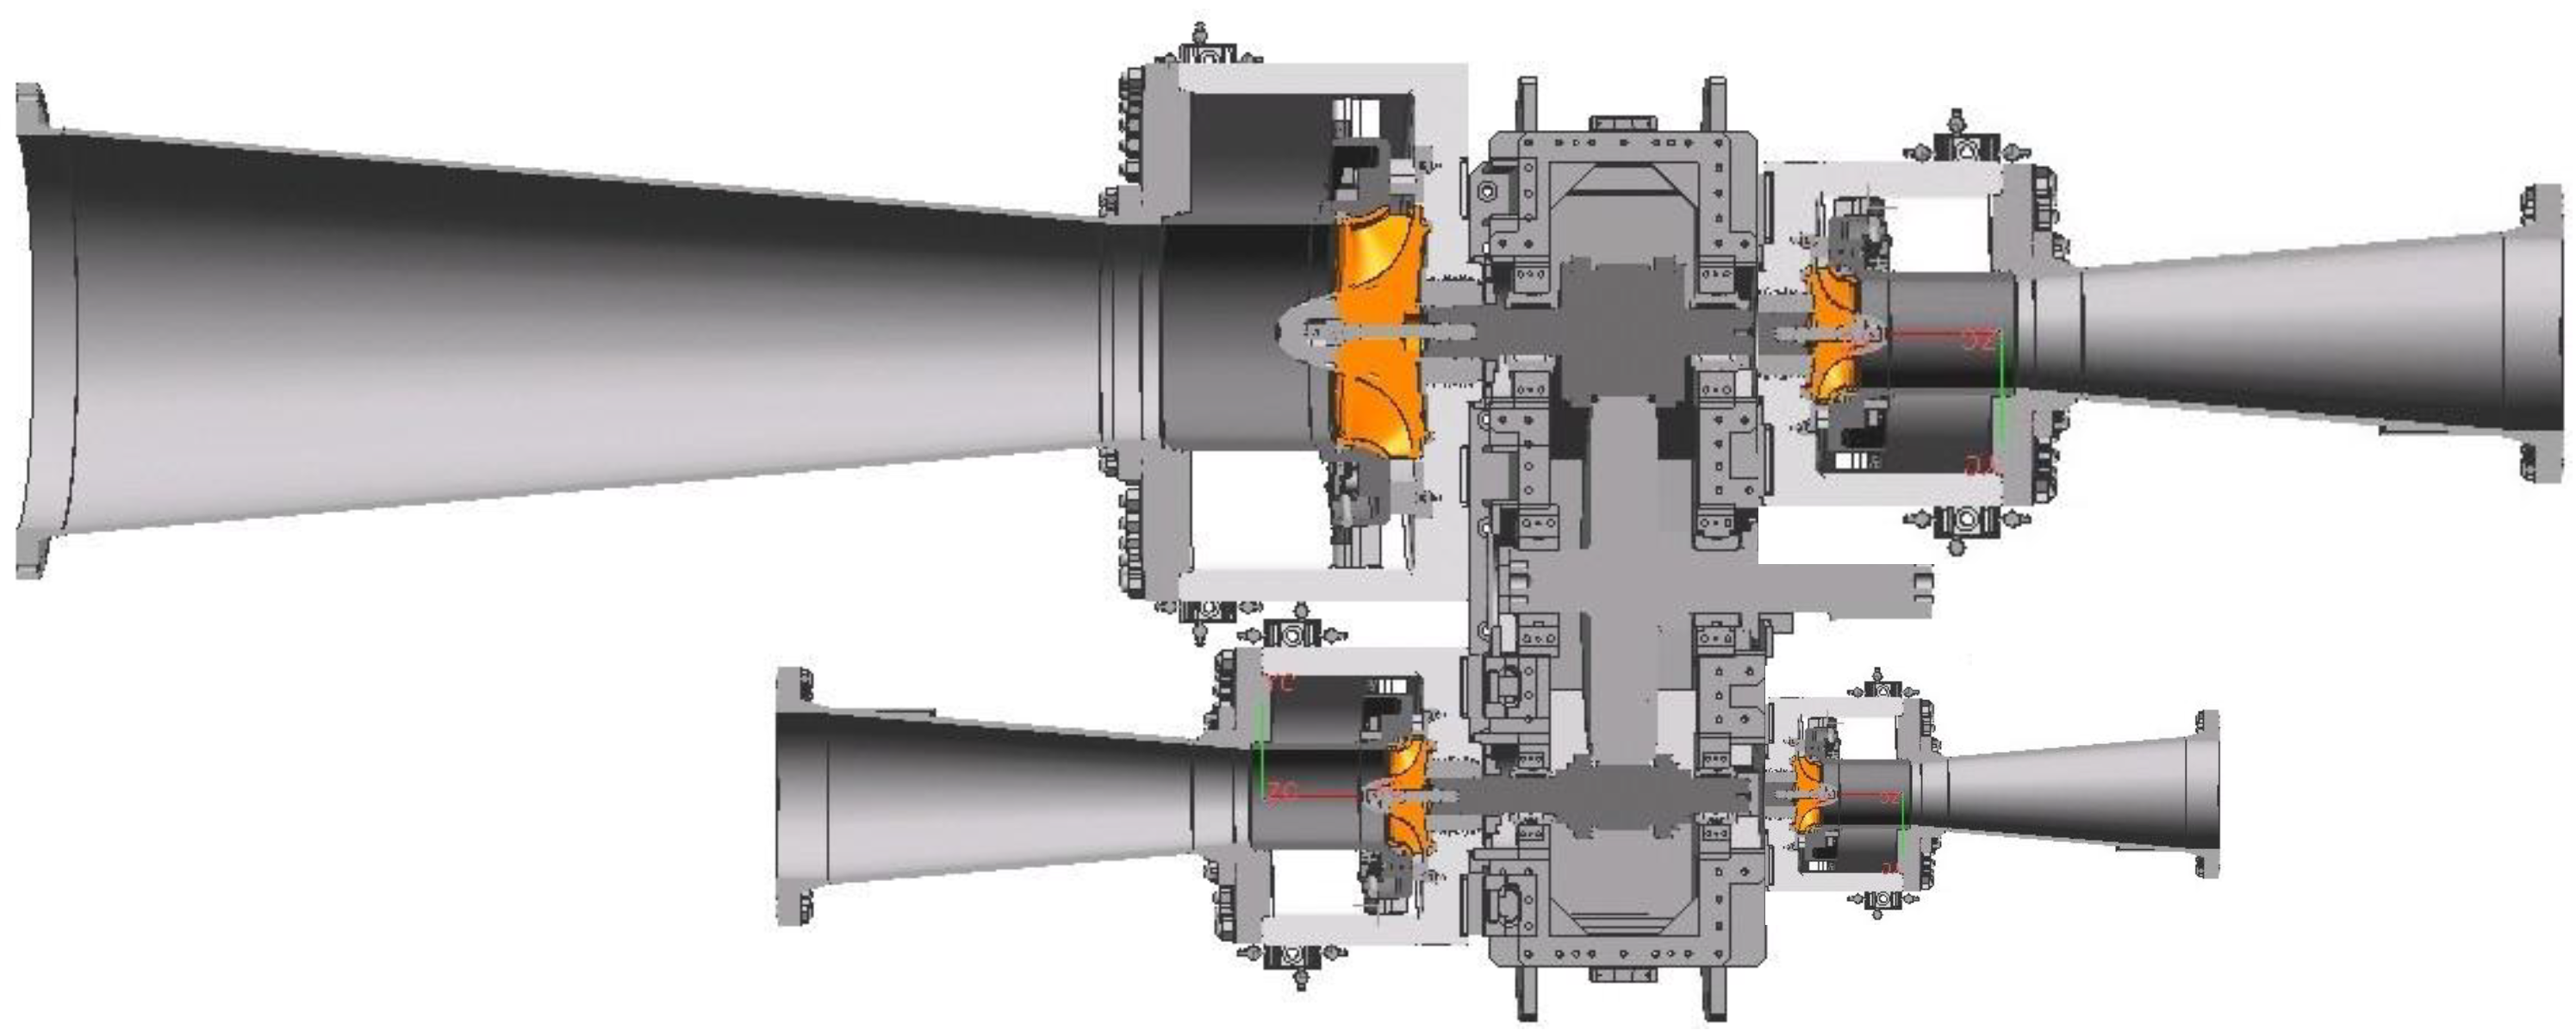
2.1. Compressor Train
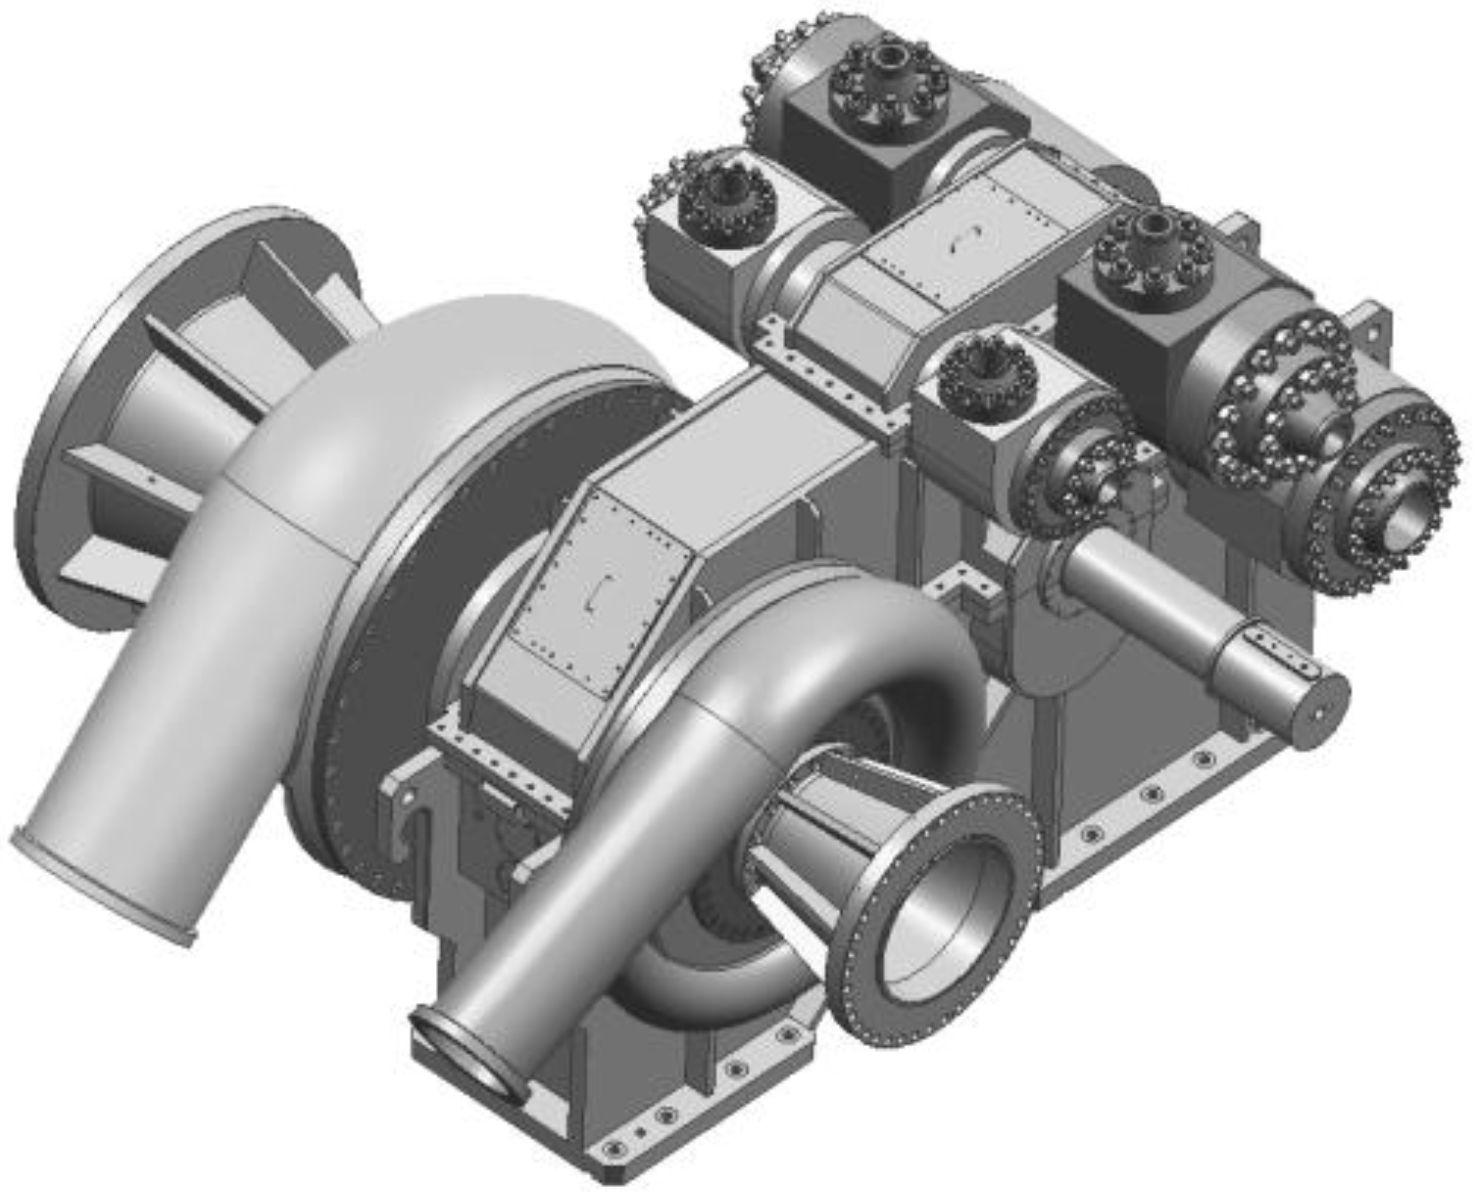
The reference case is built around a typical multi-stage centrifugal compressor train using a GE Oil&Gas/Nuovo Pignone SRL compressor (
Figure 2), as it allows the modular selection of the required number of impellers optimizing the speed using different gear ratios between the High Speed Shafts and main shaft. This design allows also relatively simple inter-stage extraction, as is needed in the present case for intercooling (IC in
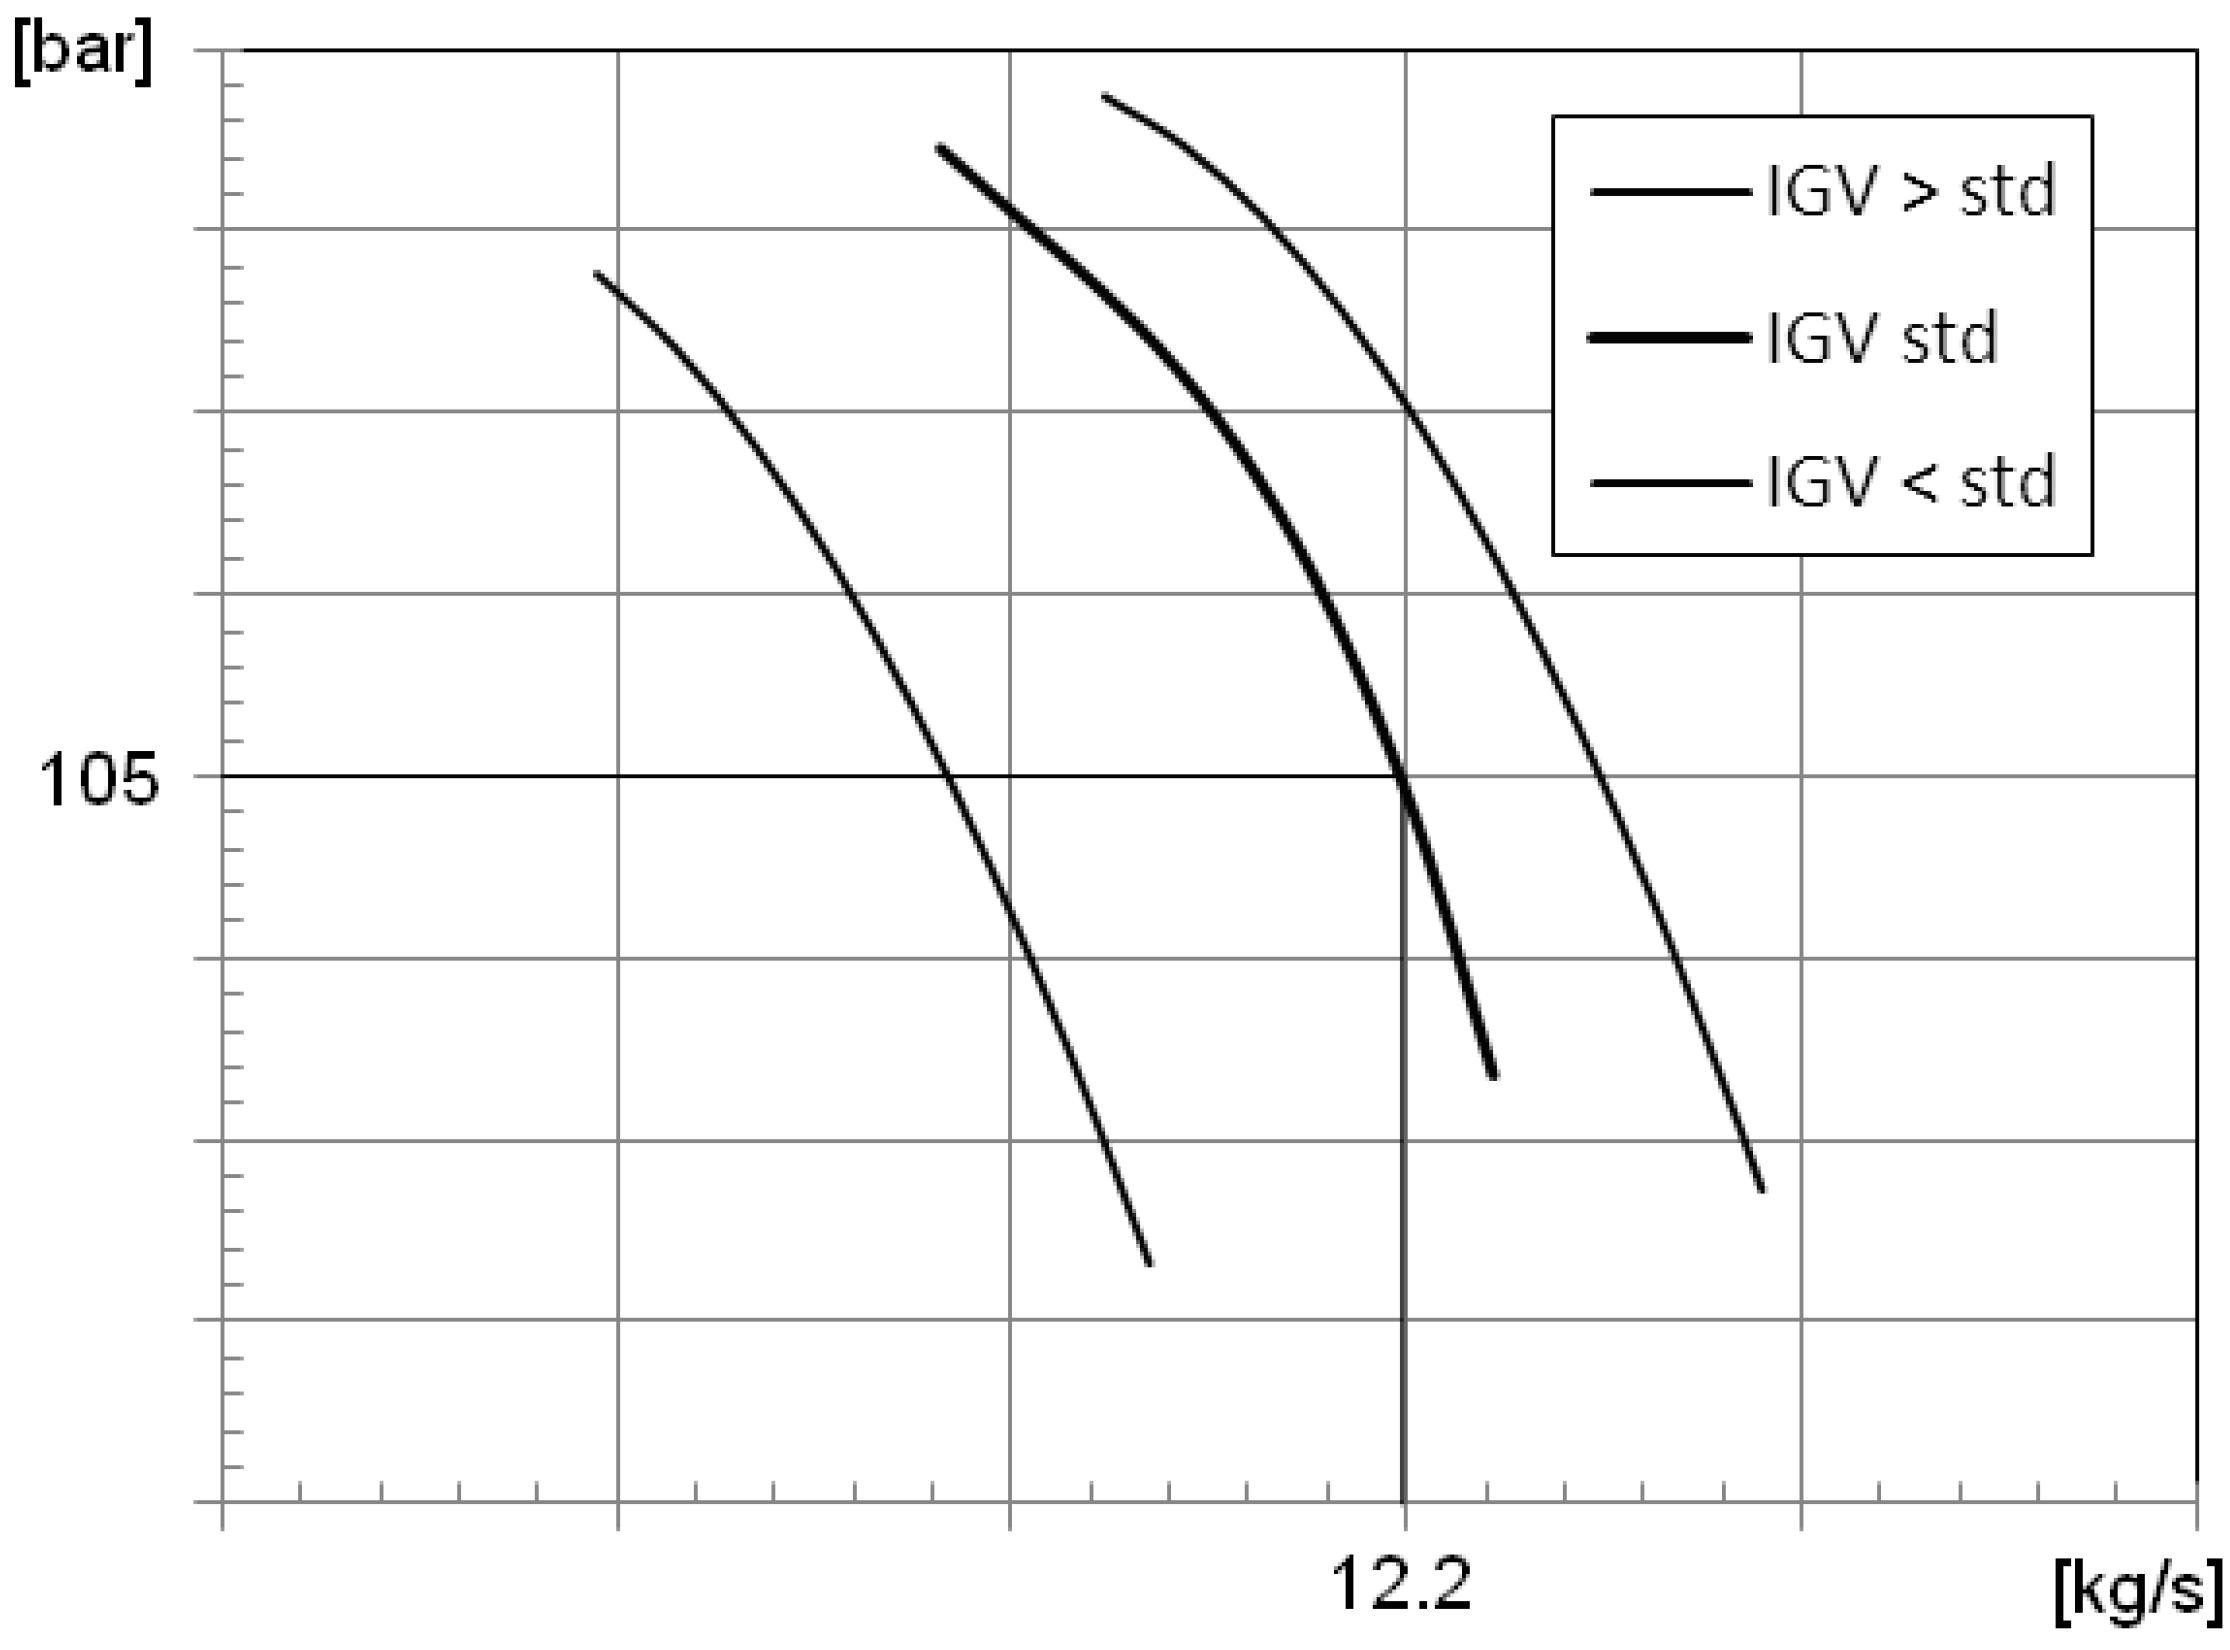
Figure 1). The first three stages of the compressor train are equipped with variable-Inlet Guide Vanes control, which can adjust the Inlet Guide Vanes setting angle from +15° to −60°. It should be remarked that the compressor train is operated at constant mass flow (12, 2 kg/s) and variable discharge pressure (fixed volume of the CAR): accordingly, the characteristic curve can be adjusted along the pressure range, as is shown in
Figure 3.
Figure 2.
SRL Compressor.
Figure 2.
SRL Compressor.
Figure 3.
SRL Compression Train pressure-flow rate characteristic curve with variable Inlet Guide Vanes setting.
Figure 3.
SRL Compression Train pressure-flow rate characteristic curve with variable Inlet Guide Vanes setting.
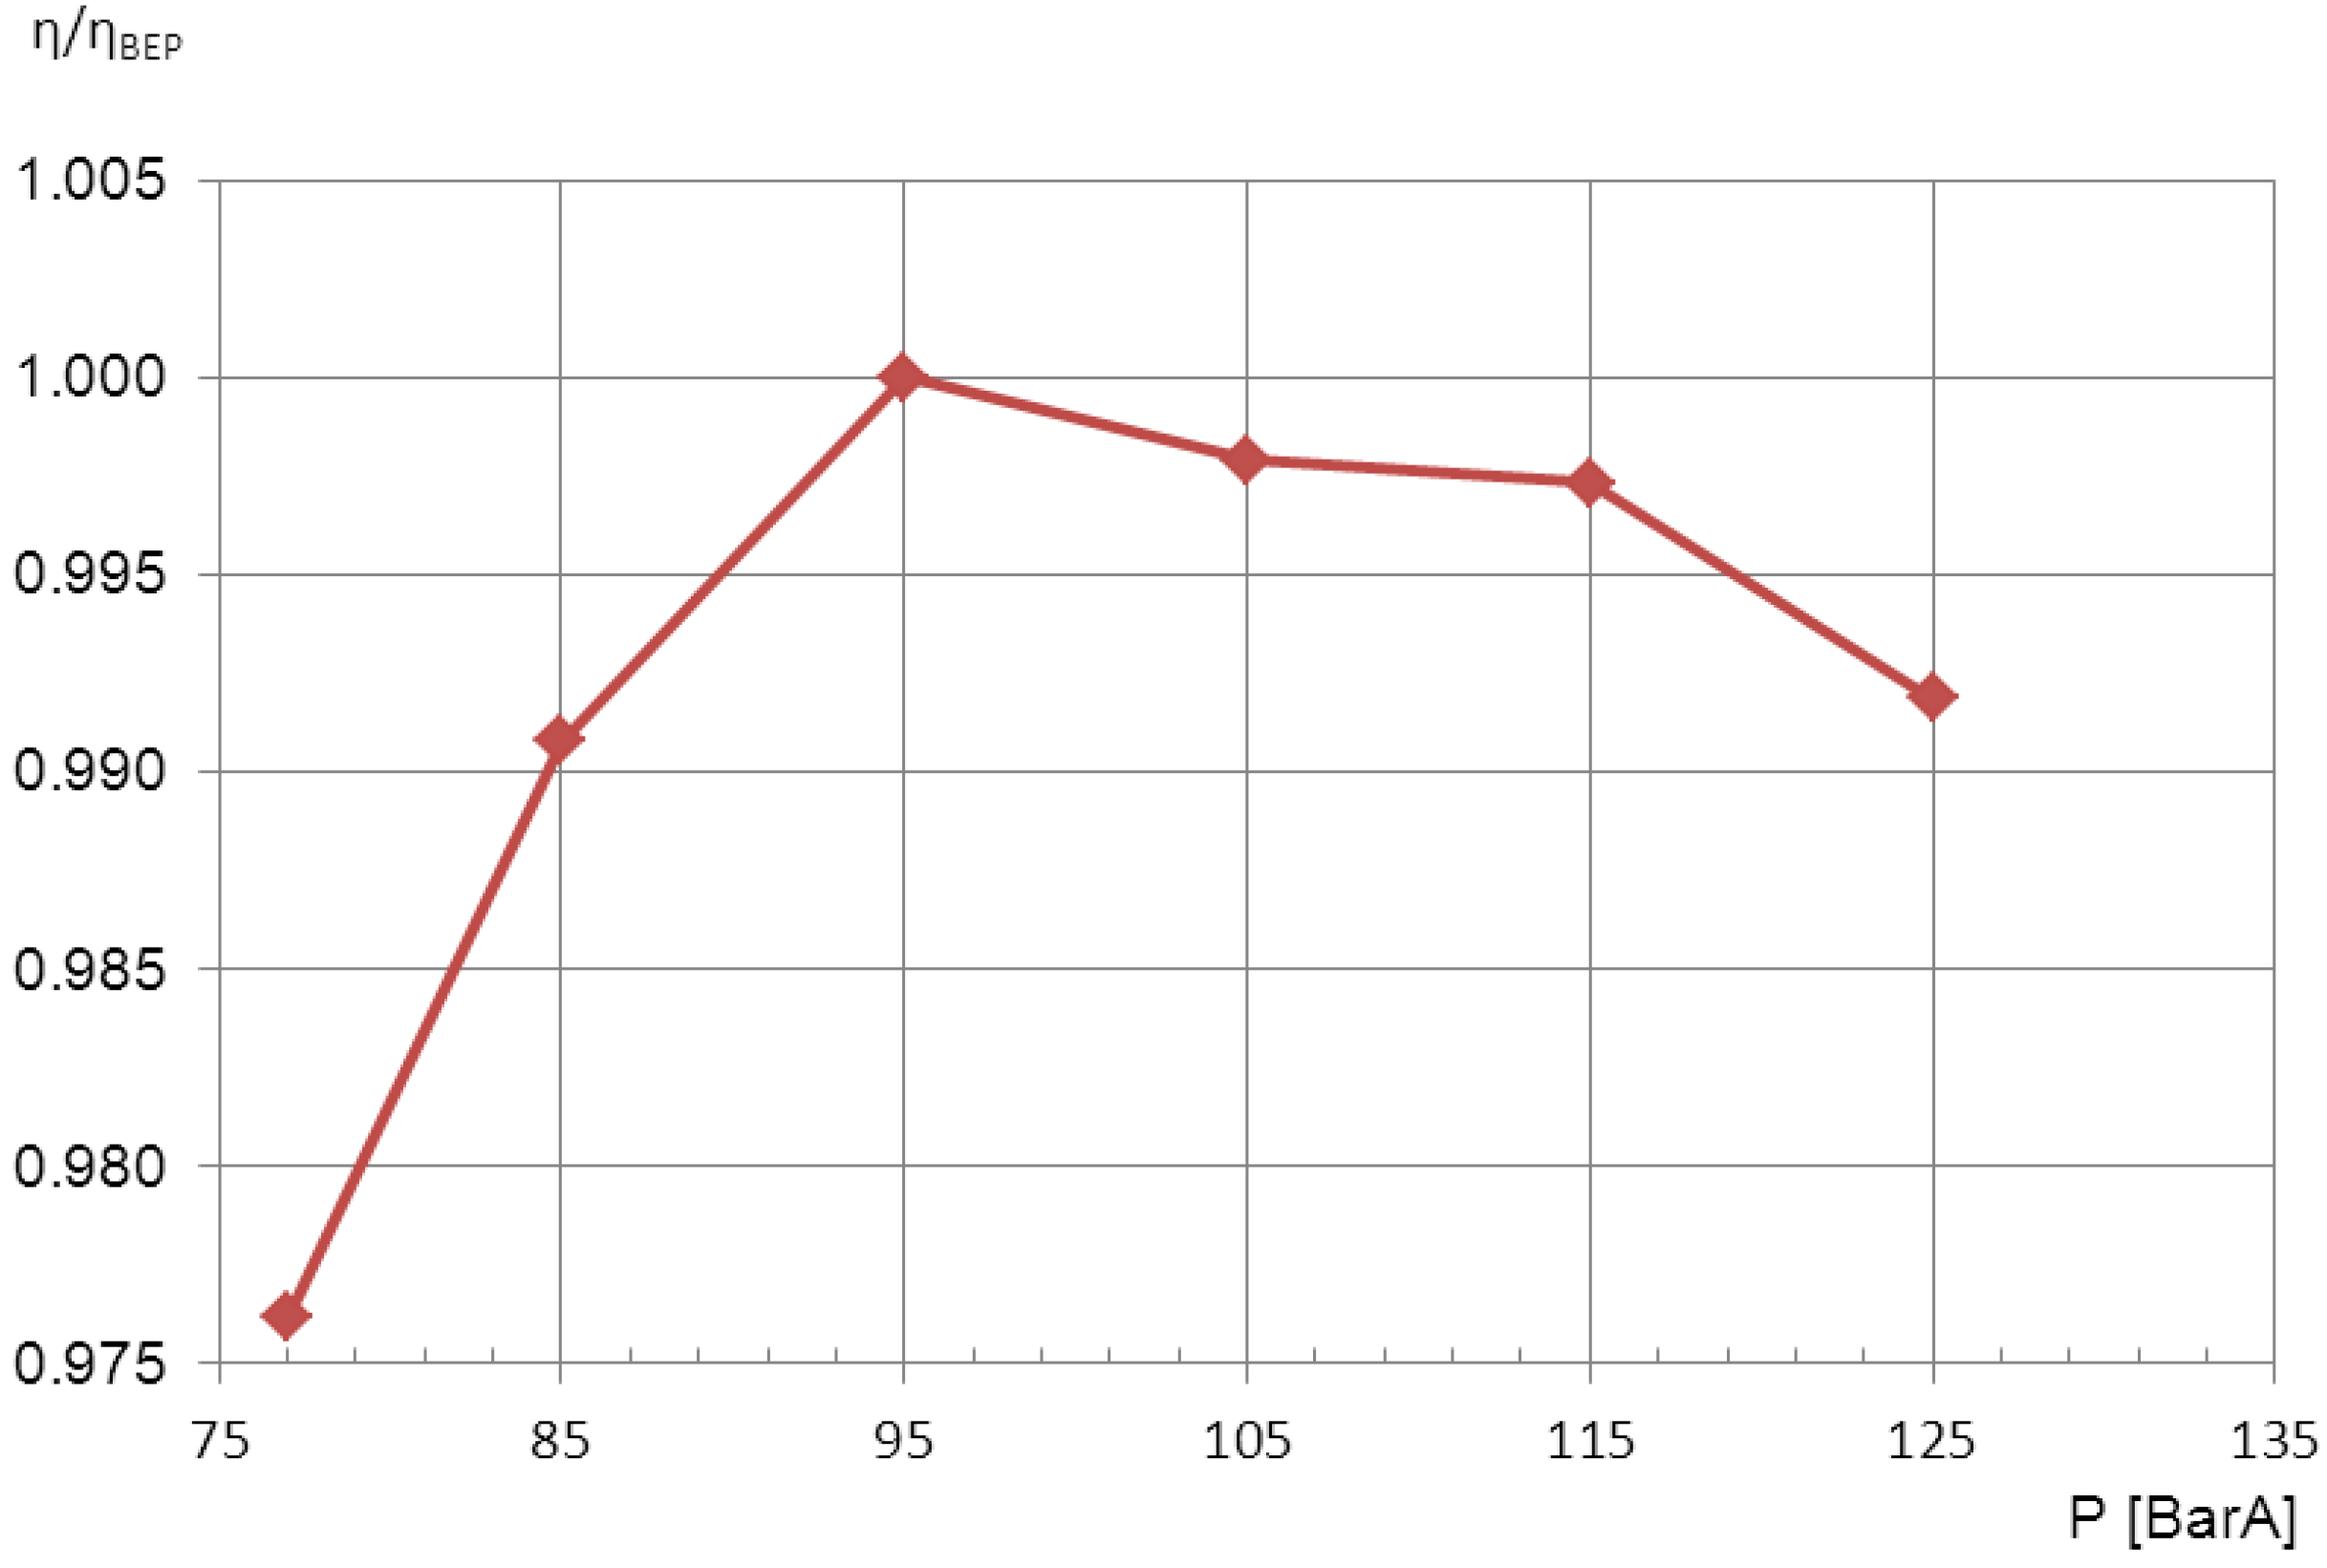
The variable-geometry Inlet Guide Vanes operating mode allows also to maintain a good efficiency under off-design operating conditions;
Figure 4 shows the efficiency achievable (at optimal Inlet Guide Vanes setting) under the main reference operating conditions, over the full pressure range considered in the CAES application.
The GE internal tool CCS was used to select each impeller of the SRL compressor. CCS is based on an internal database of different types of centrifugal impellers which have already been designed for other applications and whose performance has been checked against test data. The tool has a number of inputs: Pin, Tin, , RPM, D for each impeller stage; moreover, the inter-stage pressure drops, the casing size and rating, the size of flanges and volutes. The discharge pressure pout is a code output, as well as the Inlet Guide Vanes pre-rotation angle and the BEP efficiency at design conditions.
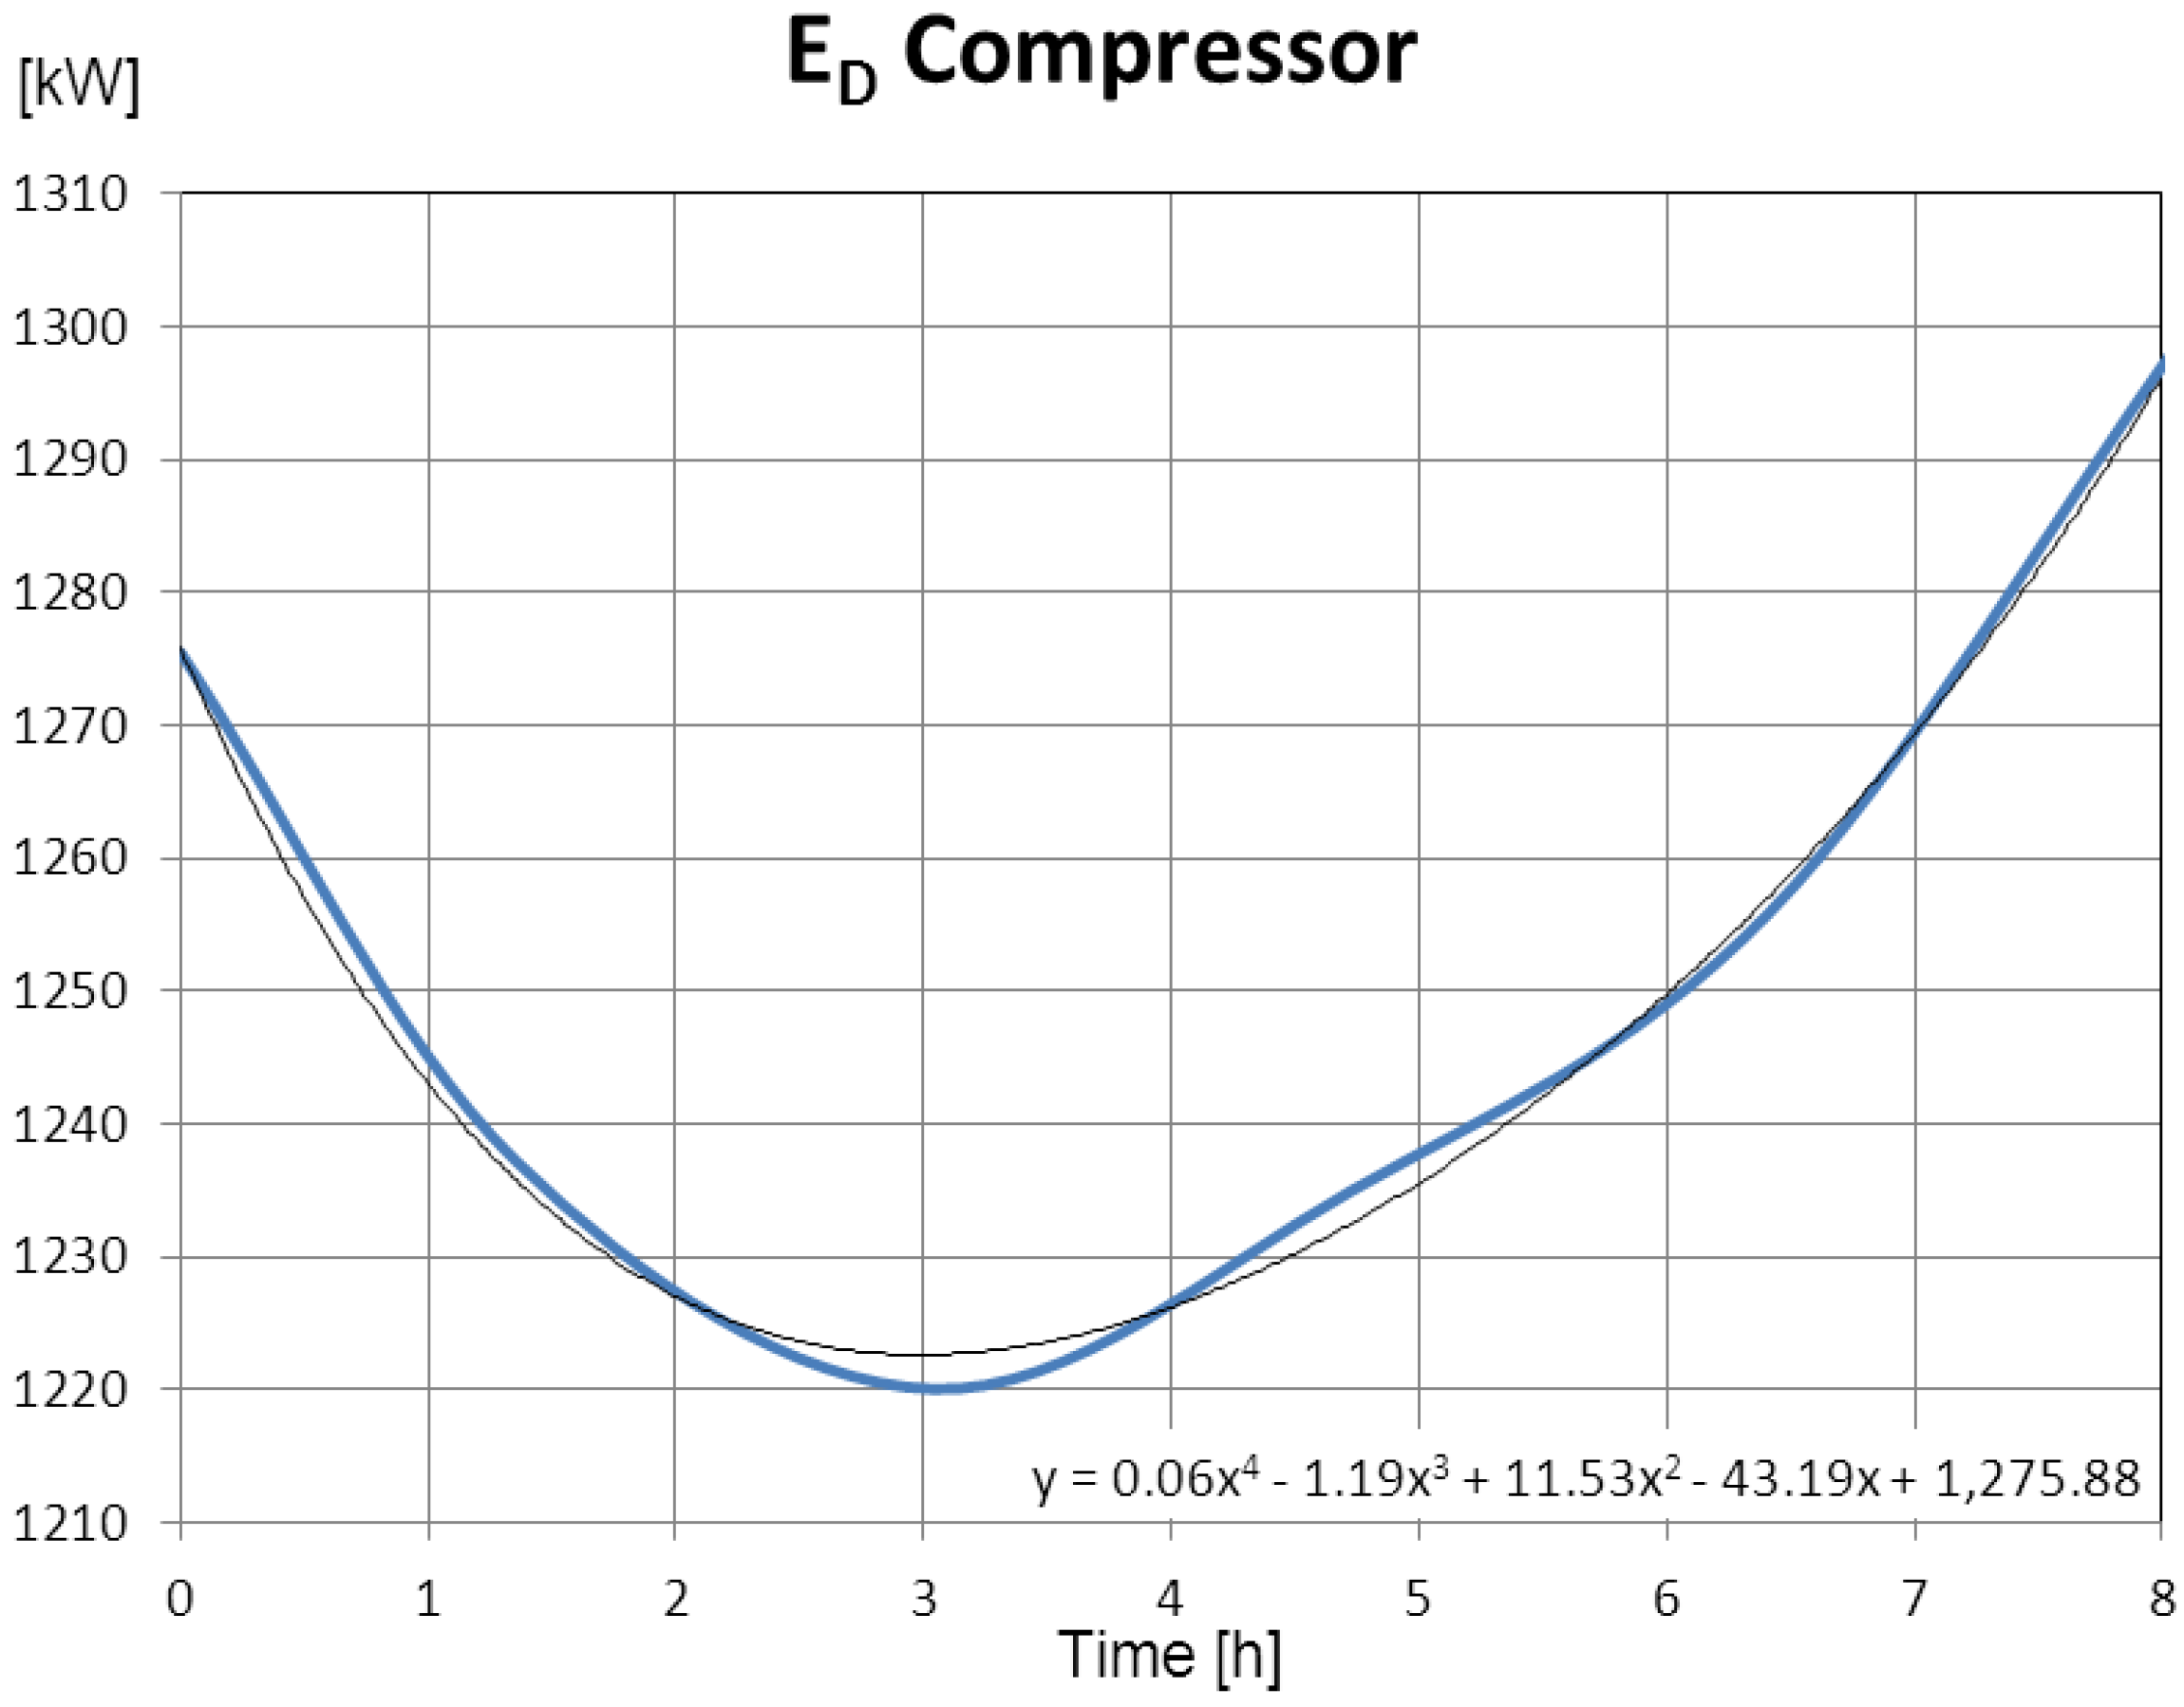
The nominal design condition was assumed at a discharge pressure of 95 bar. The calculation of the operating point conditions was then repeated for off design, setting five discrete operating points: 125, 115, 95, 85 and 77 bar, and calculating the optimal Inlet Guide Vanes setting and the off-design efficiency. The power absorbed by the compression train ranges from 7.5 MW for pout = 75 bar to 8.1 MW for pout = 125 bar. The SRL motor drive is an asynchronous electric motor having the following target data: W = 9,600 kW; Nominal rotational speed = 1,500 rpm; Nominal voltage V = 13.8 kV.
Figure 4.
Compression Train calculated polytropic efficiency along the charging cycle (Varying Inlet Guide Vanes).
Figure 4.
Compression Train calculated polytropic efficiency along the charging cycle (Varying Inlet Guide Vanes).
2.2. Turbo-Expander Train
The turbo-expander is again of the integrally-geared type: an example is shown in
Figure 5. In the present case, 6 stages were considered, geared on three shafts (rotating respectively at 26,000, 14,000 and 7,300 rpm). Each stage is of the radial/mixed flow design, with three-dimensional blade shape, and equipped with variable-setting Inlet Guide Vanes; each stage inlet is preceded by a Reheat Heat Exchanger (RH in
Figure 1).
Figure 5.
Integrally-Geared Turbo-Expander.
Figure 5.
Integrally-Geared Turbo-Expander.
The turbo-expander mass flow rate was adjusted to maintain as far as possible a constant power output with variable inlet pressure: this operating condition results from the electric market day-ahead arbitrage pricing which is required by the Italian grid operator. In the present case, three reference conditions were assumed for calculating the design and off-design performance, which are summarized in
Table 1.
Table 1.
Turbo-expander train reference operating conditions.
Table 1.
Turbo-expander train reference operating conditions.
| | HP | IP | LP |
|---|
| PCAR, bar | 125 | 98 | 75 |
| , kg/s | 24.5 | 26.6 | 27.4 |
| W, MW | 8.60 | 8.62 | 8.34 |
The EG is an asynchronous electric generator having the following target data: W = 10,500 kVA; Nominal rotational speed = 1,500 rpm; Nominal voltage V = 13.8 kV.
2.3. Heat Exchangers (IC, RH)
The heat exchangers were designed by an external provider after specifications by GE O&G Nuovo Pignone; a shell and tube arrangement was required; shell/tube arrangement between air and water were switched with variable pressure: in fact, air passes through shells (and water through the pipes) when the air pressure is low (first stages), while in the last stages air passes inside the pipes (and water through the shell side) in order to minimize heat exchanger capital costs.
The shell side is provided with baffles which ensure a correct cross-flow arrangement. The water inlet/outlet conditions were specified as 20 °C/90 °C for the IC; and 89 °C/80 °C for the RH heat exchangers. Due attention was paid in not exceeding the boiling water temperature balancing the amount of water mass flow. Referring for example to coolers, the water mass flow rates were adjusted for each unit under each operating condition in order to have a delivery temperature of 90 °C, with a heat exchanger pinch temperature difference of 15 °C. The calculation was done by traditional HE sizing rules, assuming a constant overall heat transfer coefficient and surface. So, considering heat exchangers duty, it is possible, knowing air inlet and outlet temperature, to calculate the water flow rates (data reported in
Table 2).
Table 2.
Main data for CAES plant heat exchangers.
Table 2.
Main data for CAES plant heat exchangers.
| Unit | External Diameter [mm] | L [mm] | [kg/s] | Q [kW] |
|---|
| Intercooler 1 | 900 | 4000 | 4.8 | 1414 |
| Intercooler 2 | 900 | 5000 | 5 | 1500 |
| Intercooler 3 | 900 | 4500 | 5.9 | 1800 |
| Intercooler 4 | 650 | 6000 | 3.2 | 1000 |
| Intercooler 5 | 600 | 6500 | 3.4 | 1000 |
| Intercooler 6 | 580 | 7000 | 3.3 | 1000 |
| Aftercooler | 500 | 7500 | 3.5 | 1100 |
| Heater 1 | 700 | 6000 | 12 | 2700 |
| Heater 2 | 800 | 6000 | 9.5 | 1600 |
| Heater 3 | 950 | 5000 | 9.3 | 1500 |
| Heater 4 | 950 | 5000 | 9.3 | 1600 |
| Heater 5 | 1000 | 5000 | 8.7 | 1500 |
| Heater 6 | 1000 | 5000 | 8.9 | 1500 |
2.4. Reservoirs (CAR, CWR, TES)
Air storage vessels (CAR) were selected considering an above ground storage ACAES plant, using 2115 TENARIS pressure vessels with a unit capacity of 3 m3. The admissible work pressure for this vessel is 140 bar, tested following the 97/23/EC-PED standard. Each cylinder features 622 mm external diameter and 12 m length.
In Thermal Energy Storage (TES), the hot water reservoir works at ambient pressure, therefore water cannot exceed the boiling temperature. An average temperature of the hot tank of 89 °C was estimated, with an overall volume of water equal to 810 m3, including 50 m3 used as fixed quantity to make sure that the tank never empties.
The Cold Water Reservoir (CWR) has the same size; it starts its operation (storage mode) at 20 °C; at the end of the production mode, it is full of warm water at 47 °C, which has been delivered from the TES passing through the HR network. The cooling load needed for reducing the CWR temperature from 47 °C to 20 °C is provided by an external heat exchanger.
3. Exergy and Exergoeconomic Analysis
3.1. Exergy Analysis
Exergy Analysis was set in the classical reference form [
15,
16]. Exergy is evaluated as an extensive property, so it can be transferred into or out of a control volume where streams of matter enter and exit. For each component, generally:
The term accounts for the time rate of exergy transfer at the inlet i. Similarly, accounts for the time rate of exergy transfer at the outlet e.
The analyses considered in this work involves a slow evolution of steady-state operating conditions (as the pressure in the CAR is varied); for the analysis of most components, it is sufficient to consider the steady-state form of the exergy rate balance. At steady state,
and
, so Equation (1) reduces to:
This equation states that the rate at which exergy is transferred into the control volume exceeds the rate at which exergy is transferred out. The difference is the rate at which exergy is destroyed within the control volume due to irreversibilities. In compact form Equation (2) reads:
where
ei and
ee can be calculated from enthalpy and entropy referring to unit mass of the fluid:
In this study, the compressors were assumed to be working without any heat transfer to the external environment (Adiabatic conditions). Both Heat Exergy and the Exergy Loss terms disappear, leading to:
The compression power is easily found:
The compressor work is negative, as the sign convention defines as negative an energy flow entering the system.
Heat exchangers are treated as steady-state adiabatic, no-work components; under these assumptions,
can be calculated from:
Exergy destruction within the piping (air and water sides) were evaluated calculating the friction losses by traditional correlations. The piping was considered adiabatic; the total pressure loss is converted into an entropy generation, and the exergy destruction is calculated consequently [
15]:
A closed-system balance was used to evaluate the total exergy stored in the compressed air reservoir (vessels). Only physical exergy was considered, neglecting kinetic and potential contributions; air vessels were assumed, at the end of the charge, at a temperature of 25 °C (same as environment).
The specific physical exergy is:
In the case of an ideal gas with constant specific heat ratio, the specific physical exergy can be expressed as:
From the assumptions made, air temperature is constant at ambient value, hence:
Note that in this case, the assumption of constant k is no longer necessary.
ECAR over one operating cycle can be calculated by the difference between exergy stored at 125 bar and 77 bar, simply as:
The exergy loss corresponding to heat release to the environment in order to cool the water in the CWR at the end of the cycle can be estimated using the difference between two exergy levels, calculated by a closed system balance:
where
and
are respectively the exergies of the CWR at the final (47 °C) and the initial temperatures (20 °C). The exergy loss can then be estimated as
.
3.2. Thermo-Economic Analysis
Exergo-economics [
15] is the branch of engineering that combines exergy analysis and economic principles to provide the system designer or operator with information not available through conventional energy analysis and economic evaluations, but crucial to the design and operation of a cost-effective system involving transformation of energy.
In the present case, we are dealing with a system transforming electricity (off-peak) into electricity (peak-load) having a higher economic value. Considering this, a simple input-output analysis could be performed arriving to similar overall results. However, the exergo-economic analysis allows:
to examine in detail the contribution of very different components (work-transfer components, that is, compressors and turbines; and heat recovery components, that is, intercoolers and heaters) on the basis of a common parameter, that is, the component exergy destruction
to examine separately and with exergy as guiding principle the share of the costs of exergy destruction and of capital investment for each component. Indeed, some of the components used (e.g., vessels) require a very high capital investment and this modifies to an appreciable extent— as is shown in the conclusions—the results of a thermodynamic-only analysis.
At the base of an exergo-economic analysis there is an economic analysis in order to detect and define each cost relative to the system. The system was modeled considering a sequence of steady states; all relevant entering and exiting material streams, as well as both heat and work interactions with the surroundings, were included. Associated with these transfers of matter and energy are exergy transfers into and out of the system, and exergy destructions caused by the irreversibilities within the system. Since exergy measures the true thermodynamic value of such effects, and costs should only be assigned to commodities of value, it is meaningful to use exergy as a basis for assigning costs in thermal systems.
The cost balance applied to the
k-th system component can be generally written as:
In the specific case of compressors, for each stage:
No auxiliary relation is needed for compressor stages [
15]. In the first compressor stage
was considered equal to zero (ambient air); in the other stages,
is equal to the cost stream exiting the preceding cooler.
was considered equal to 38 €/MWh, corresponding to use of off-peak electricity.
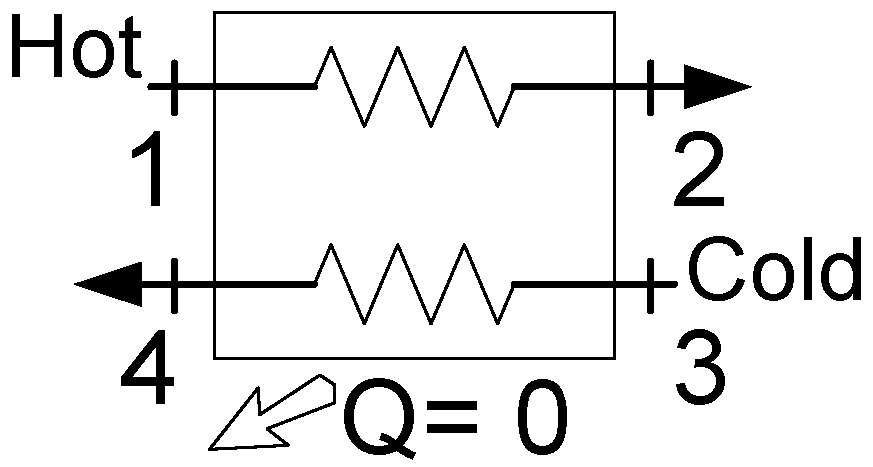
Each heat exchanger was evaluated referring to the component model shown in
Figure 6, using the following relation:
Figure 6.
Schematic of heat exchanger.
Figure 6.
Schematic of heat exchanger.
The additional exergoeconomic equation was set according to the purpose of the heat exchanger (cooling of heating) [
15].
The expander thermo-economic balance is similar to that of the compressor, considering now the work stream as an outlet:
The auxiliary relation in this case is [
15]:
.
For the storage (CAR) reservoir (a component in which the capital cost is expected to be very high), the thermo-economic relation is applied over the complete lifetime considering the overall scheduled operating time in charge/discharge modes, and it reads:
The operating time in the different states of charge/discharge is considered in Equation (19); the cost of the storage vessels is directly presented in €.
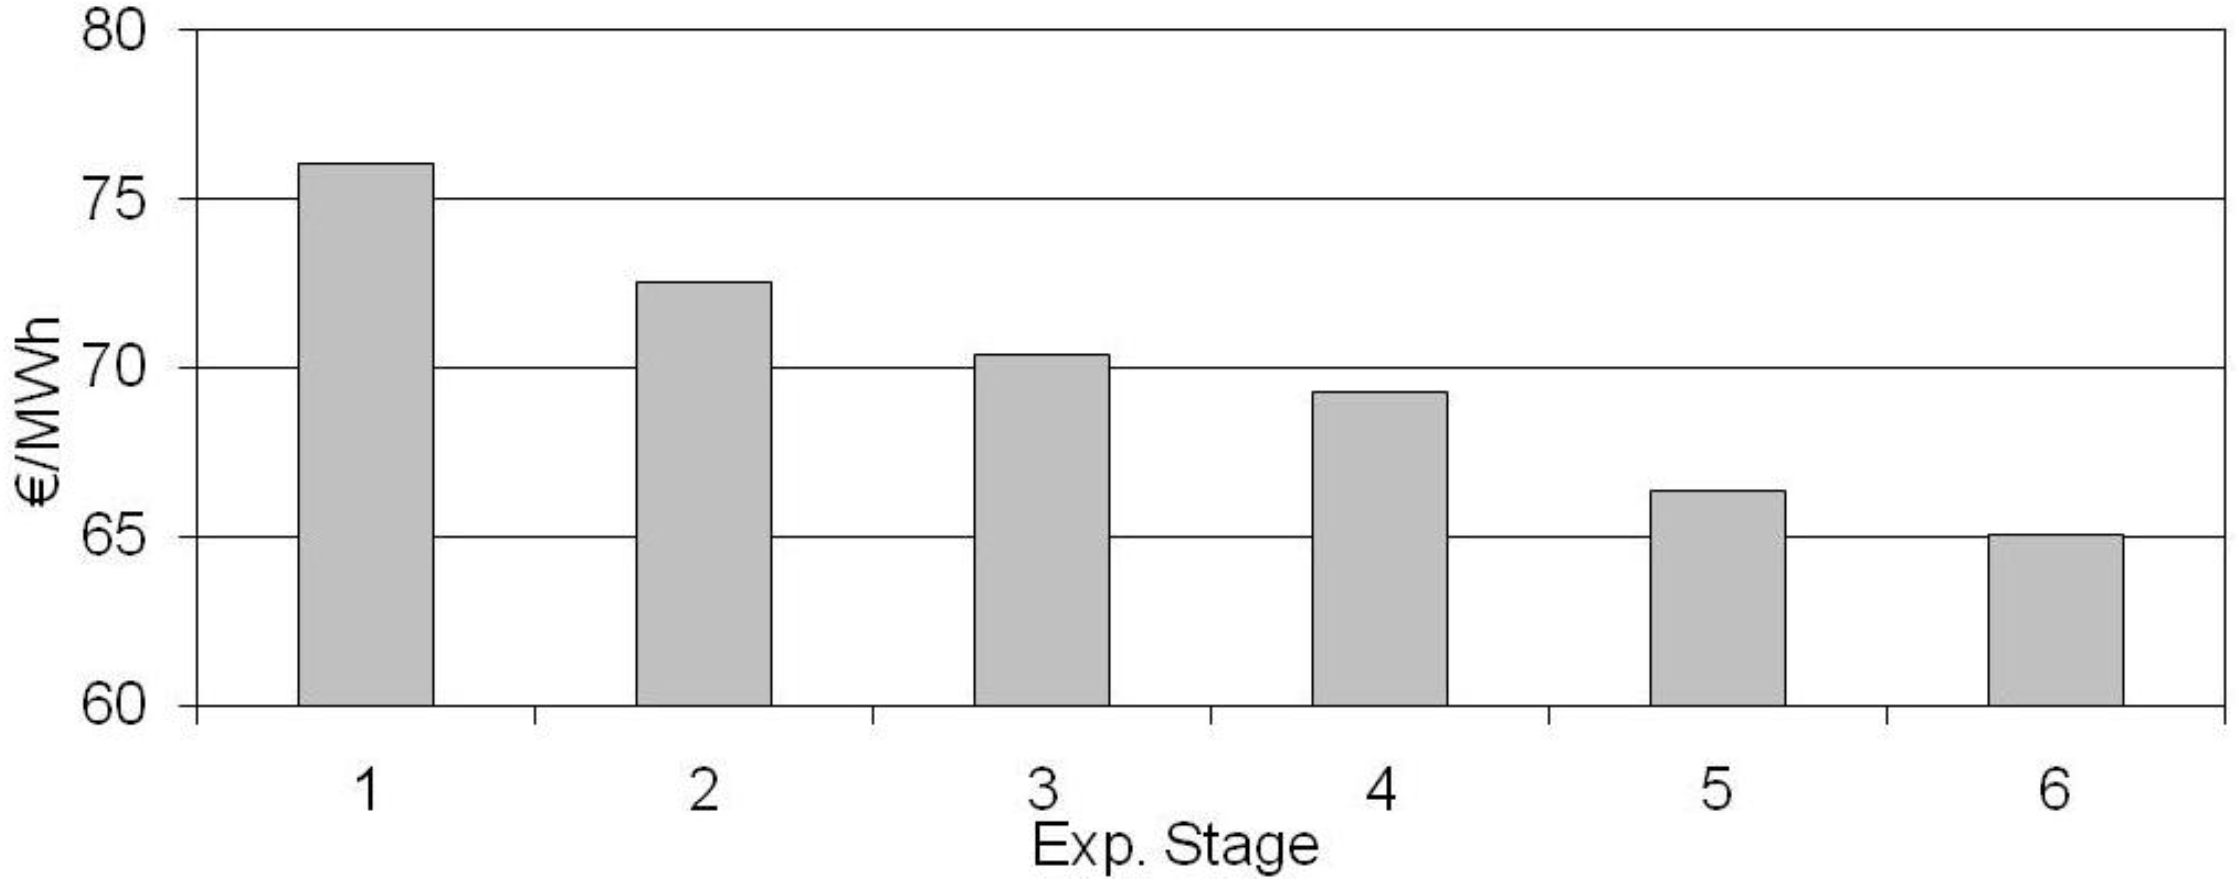
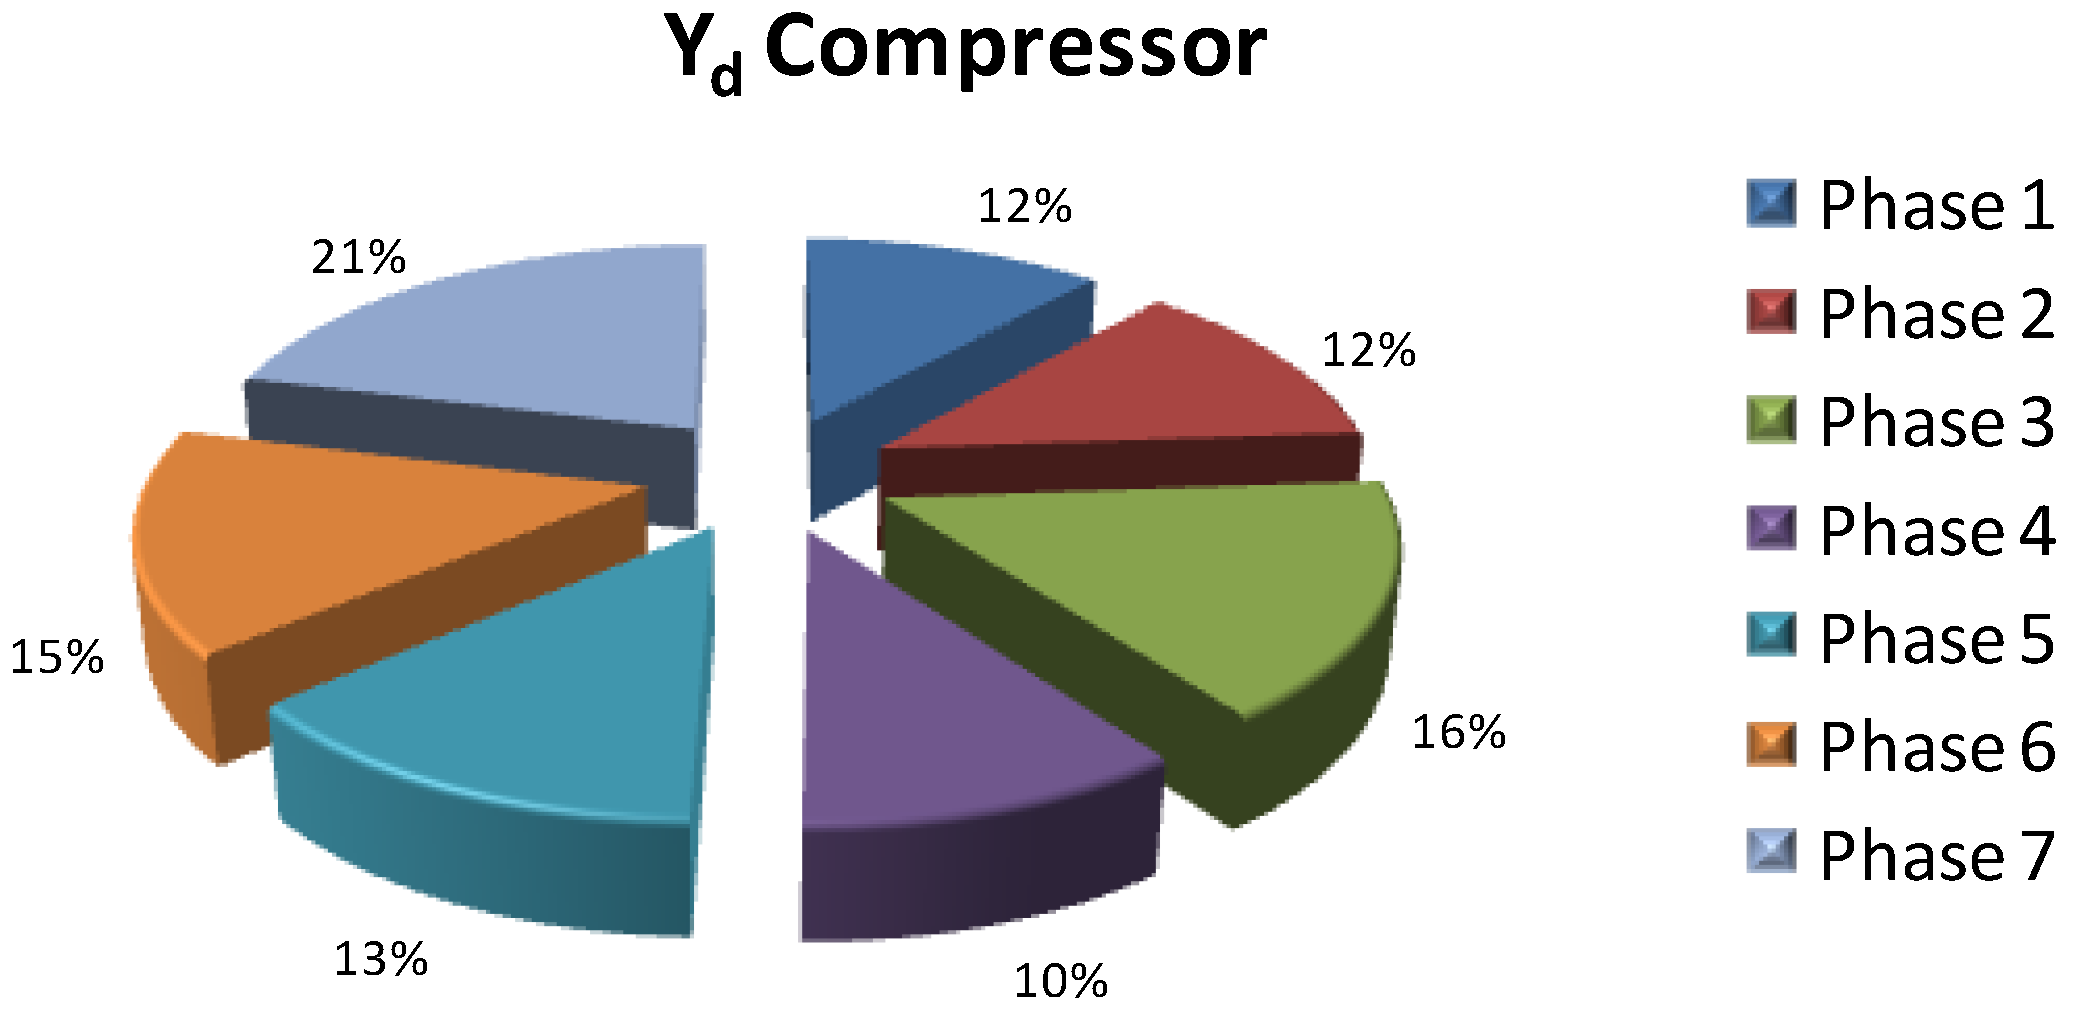
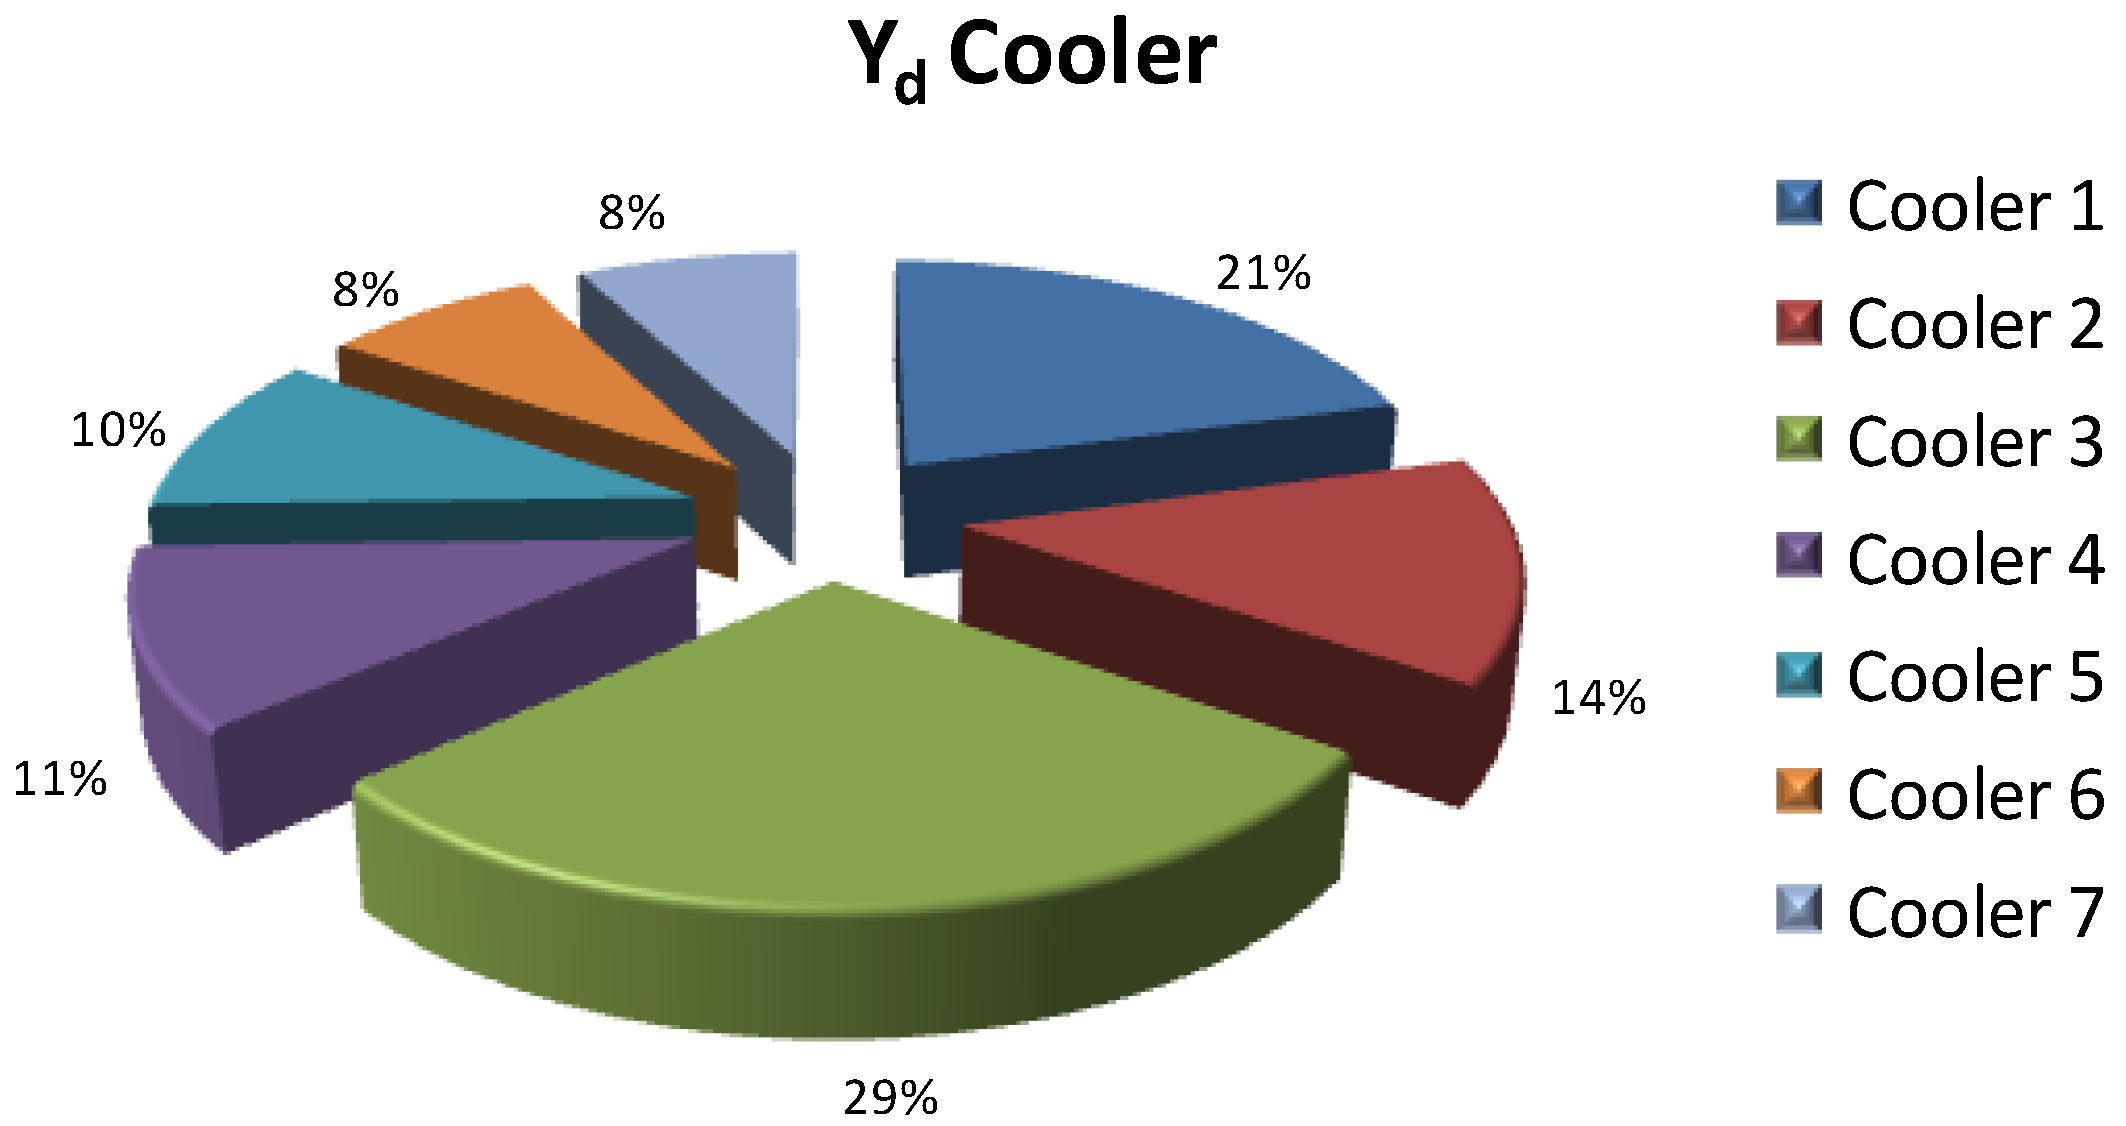
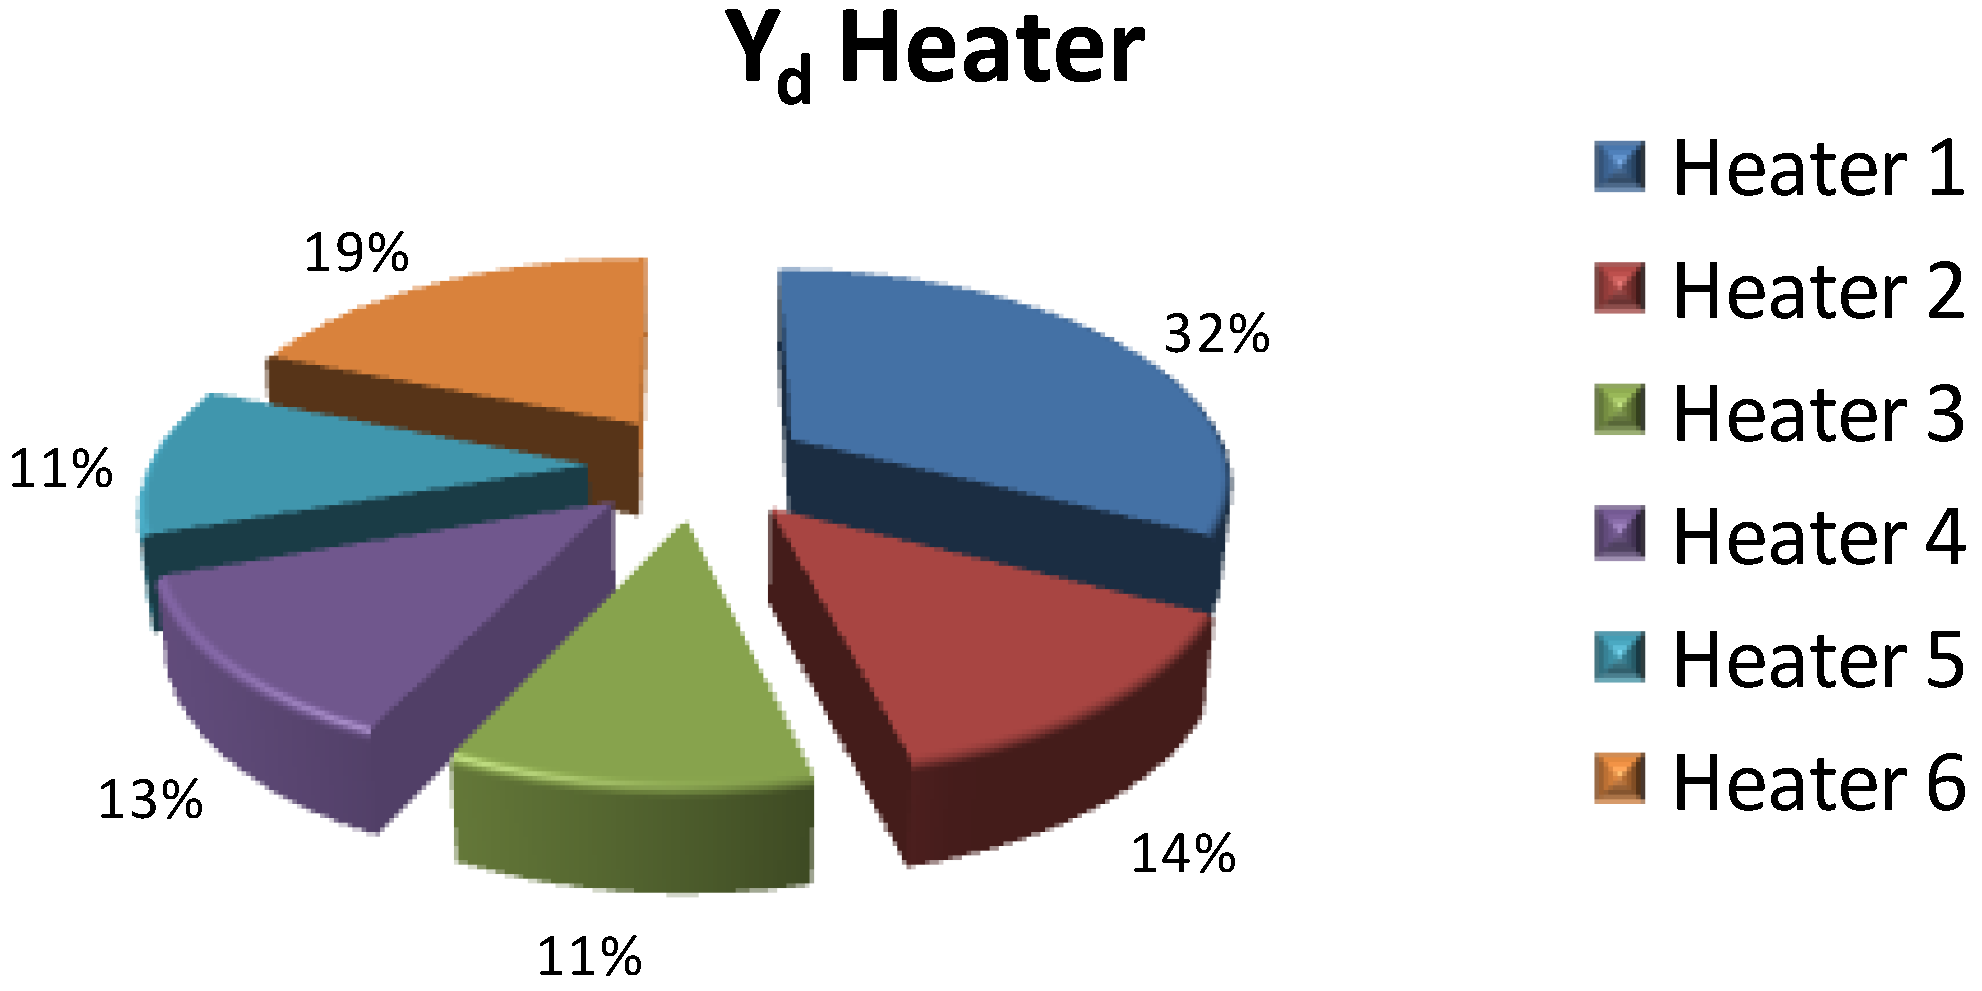
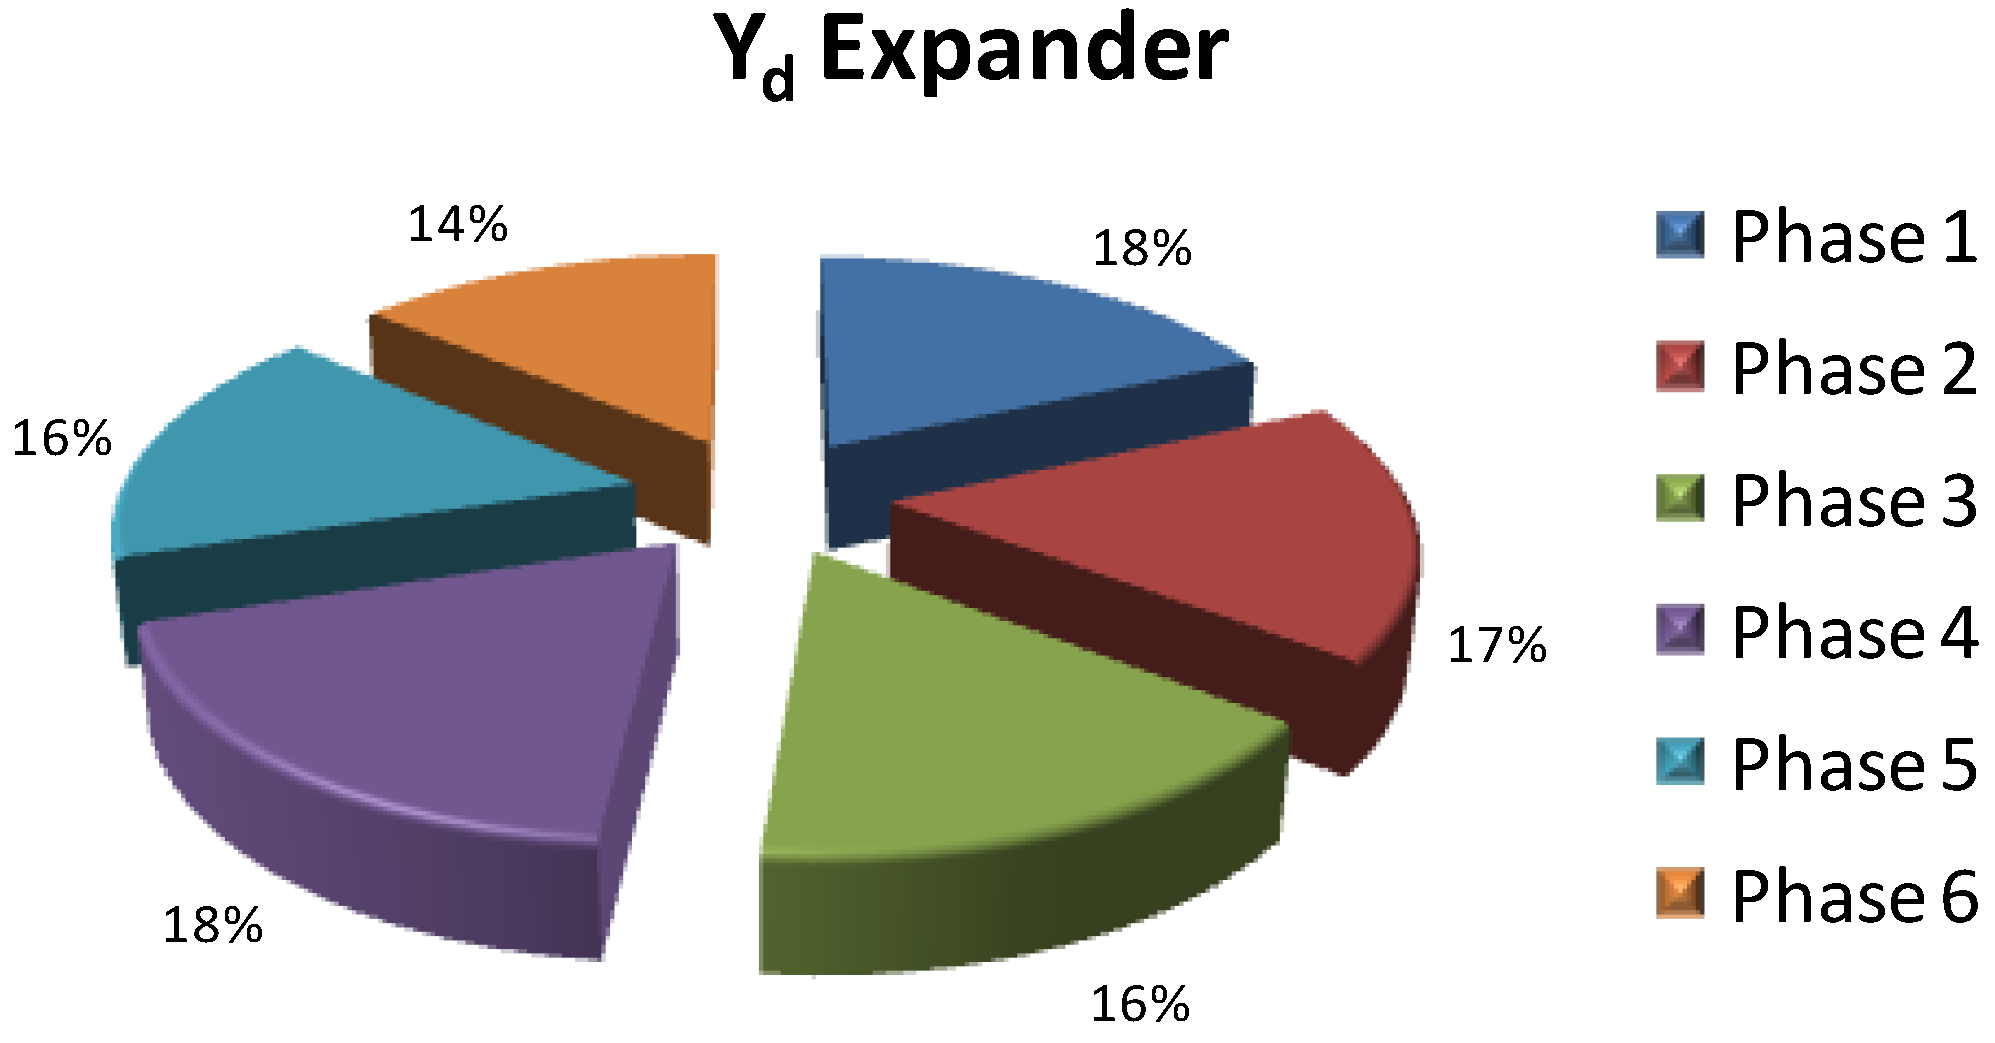
5. Results—Exergo-economic Analysis
Detailed results about exergy analysis have been shown in
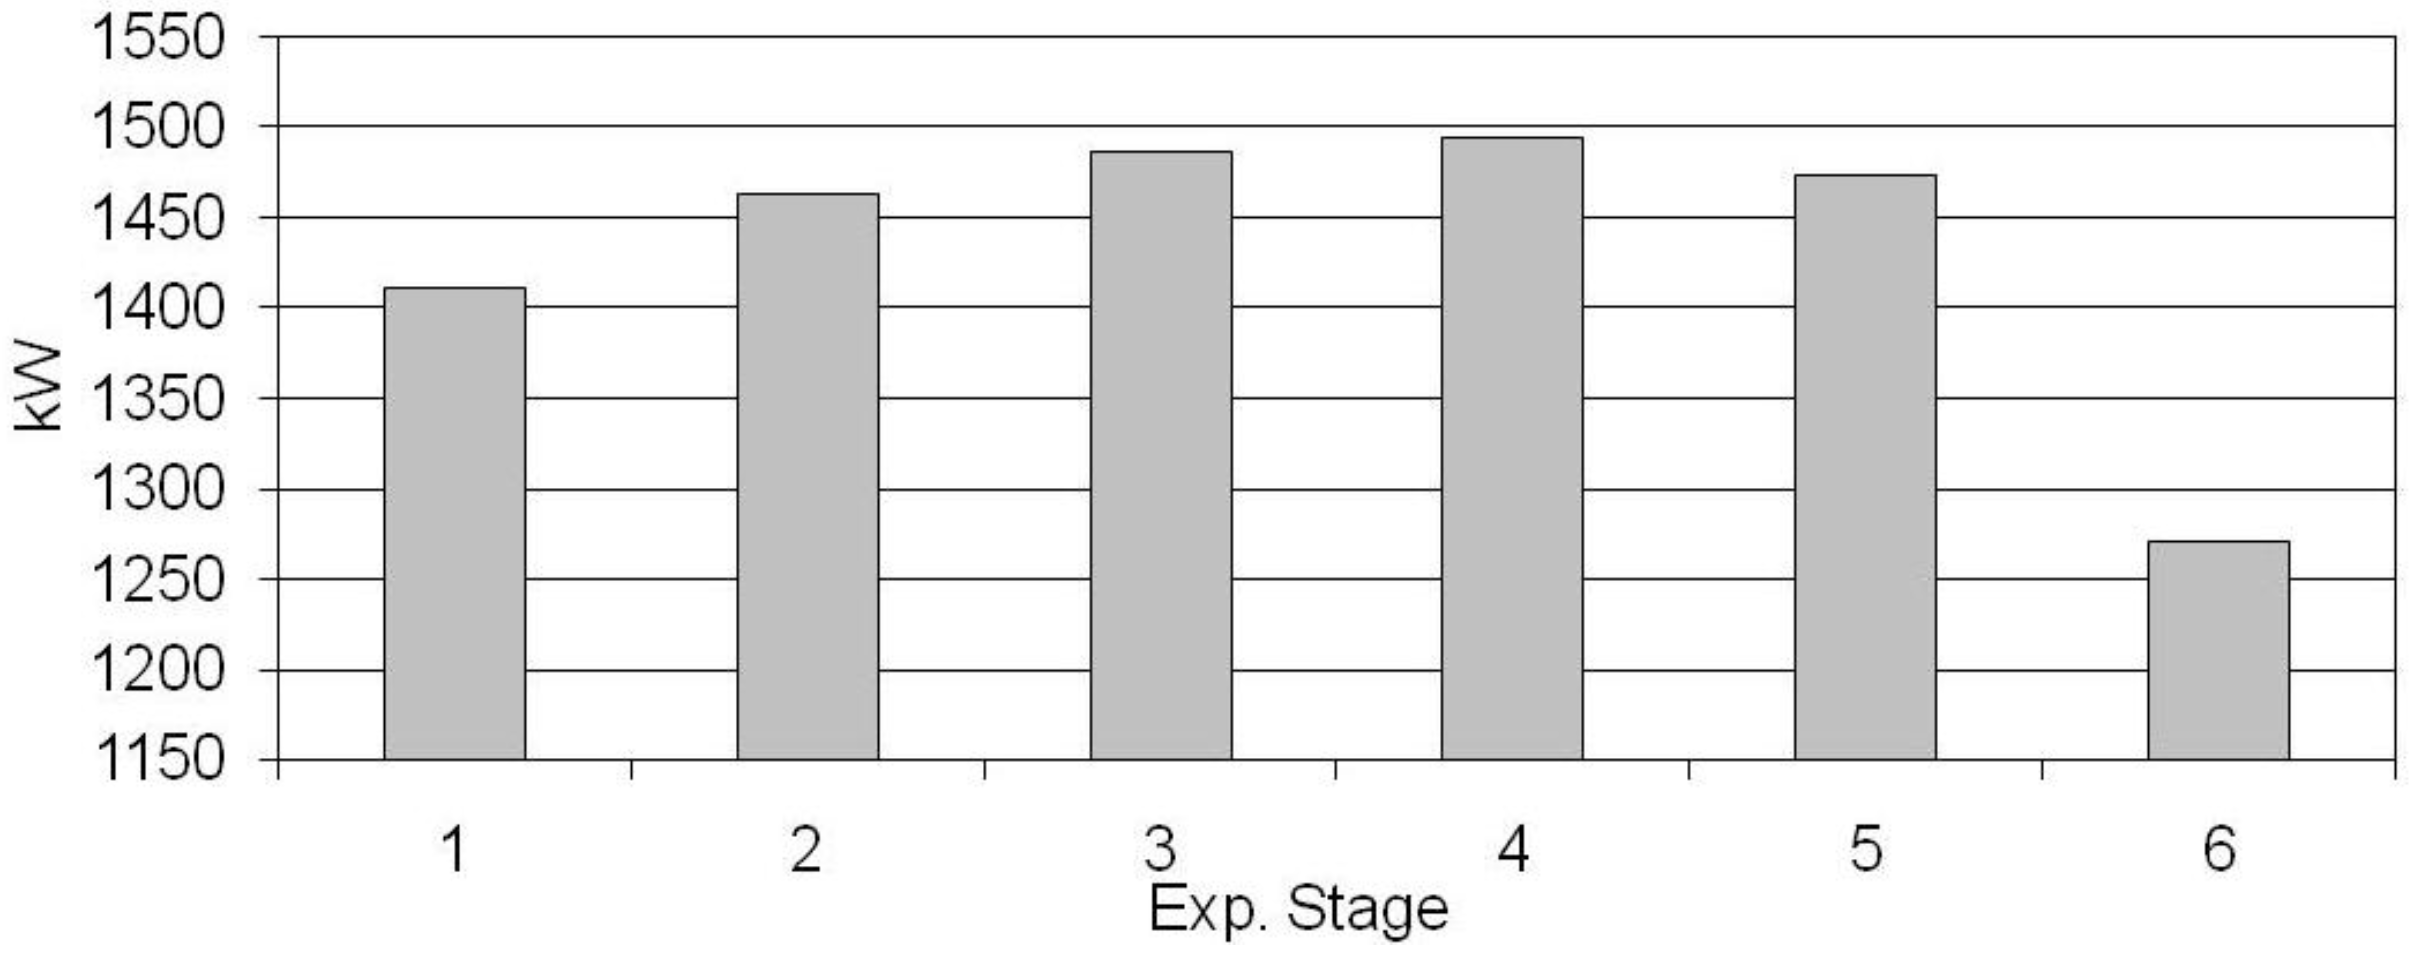
Section 4, consequently the conclusions here reported represent only a synthesis of this case study. Referring to maximum pressure (125 bar), the power production distribution among the 6 expander stages is shown in
Figure 13, and the cost of electricity produced by each stage, according to the thermo-economic analysis of the plant, is summarized in
Figure 14.
Figure 13.
Power produced by each expander stage (pCAR = 125 bar).
Figure 13.
Power produced by each expander stage (pCAR = 125 bar).
Figure 14.
Electricity production cost for each expander stage (pCAR = 125 bar).
Figure 14.
Electricity production cost for each expander stage (pCAR = 125 bar).
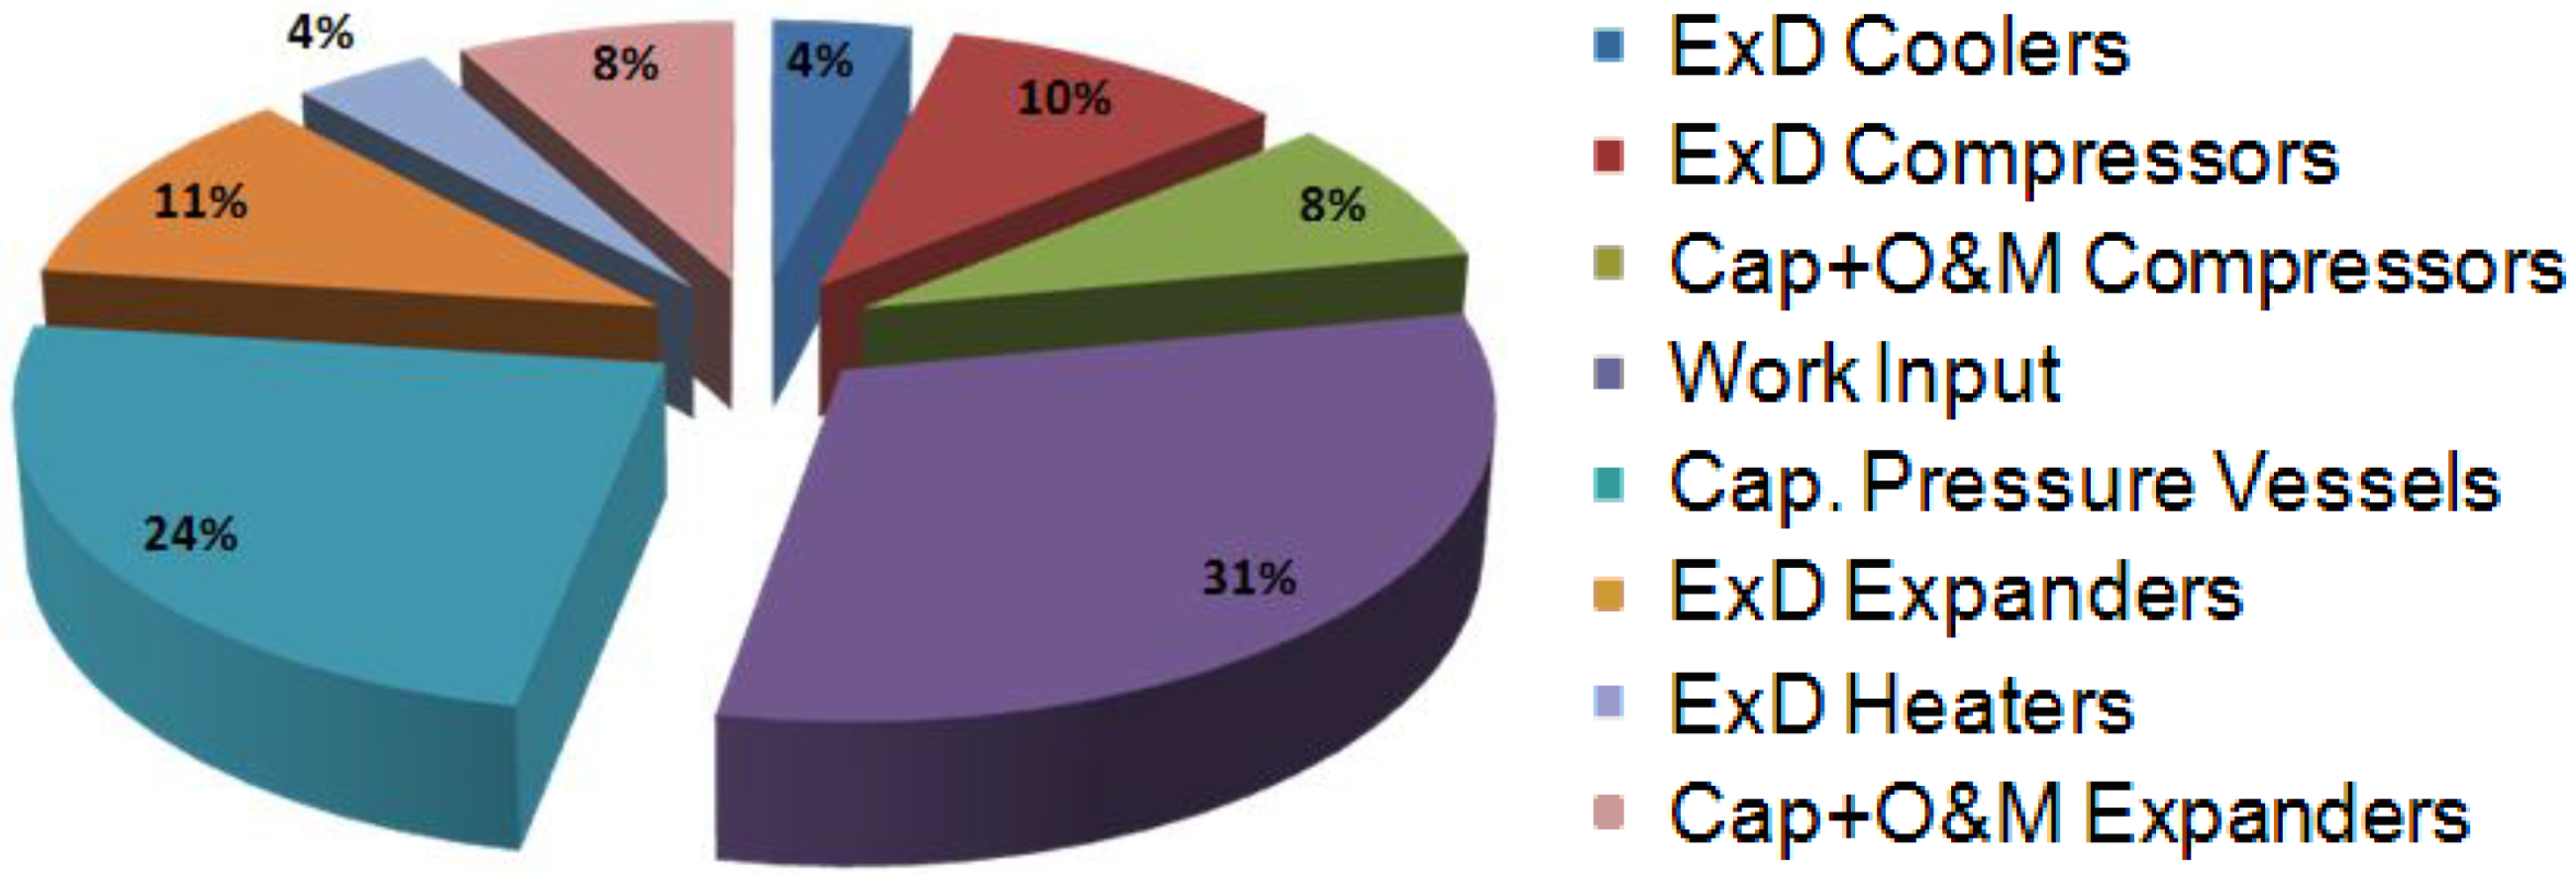
The power-averaged cost of the electricity produced was calculated at 70 €/MWh, which corresponds to a marginal cost of (70–38) = 32 €/MWh of the equivalent stored electrical energy; in practice, an 84% increase with respect to the base-load cost of electricity assumed (38 €/MWh). This is considered as a promising result for proposing ground-built ACAES systems as storage devices for the near future. The distribution of the marginal cost buildup among the main plant components, in terms of cost of exergy destruction and capital +O&M costs, is shown in
Figure 15.
Figure 15.
Relative distribution of the marginal costs among ACAES plant components. Exergy destruction and Capital + O&M costs (pCAR = 125 bar).
Figure 15.
Relative distribution of the marginal costs among ACAES plant components. Exergy destruction and Capital + O&M costs (pCAR = 125 bar).
It can be noticed that the work input amounts to 31% of the expenses; exergy destruction during plant operation (storage and production modes) represents 29% of the marginal cost; about 40% can be accounted to capital expenses, with the largest share due to the pressure vessels (24%). A comparison with
Figure 12 shows that the exergy destruction terms represent 37% in terms of exergy, but they reduce to 29% in terms of marginal contribution to cost buildup.
6. Conclusions
An ACAES (Adiabatic Compressed Air Energy Storage) pilot installation, designed with current technology for compressors/expanders/intercoolers/re-heaters, using standard pressure vessels and hot/cold water tanks in a closed loop was presented and the results of a system model were presented. The analysis included off-design performance of the machinery and was completed by an exergy balance and by the application of thermo-economics to calculate the final cost of electricity.
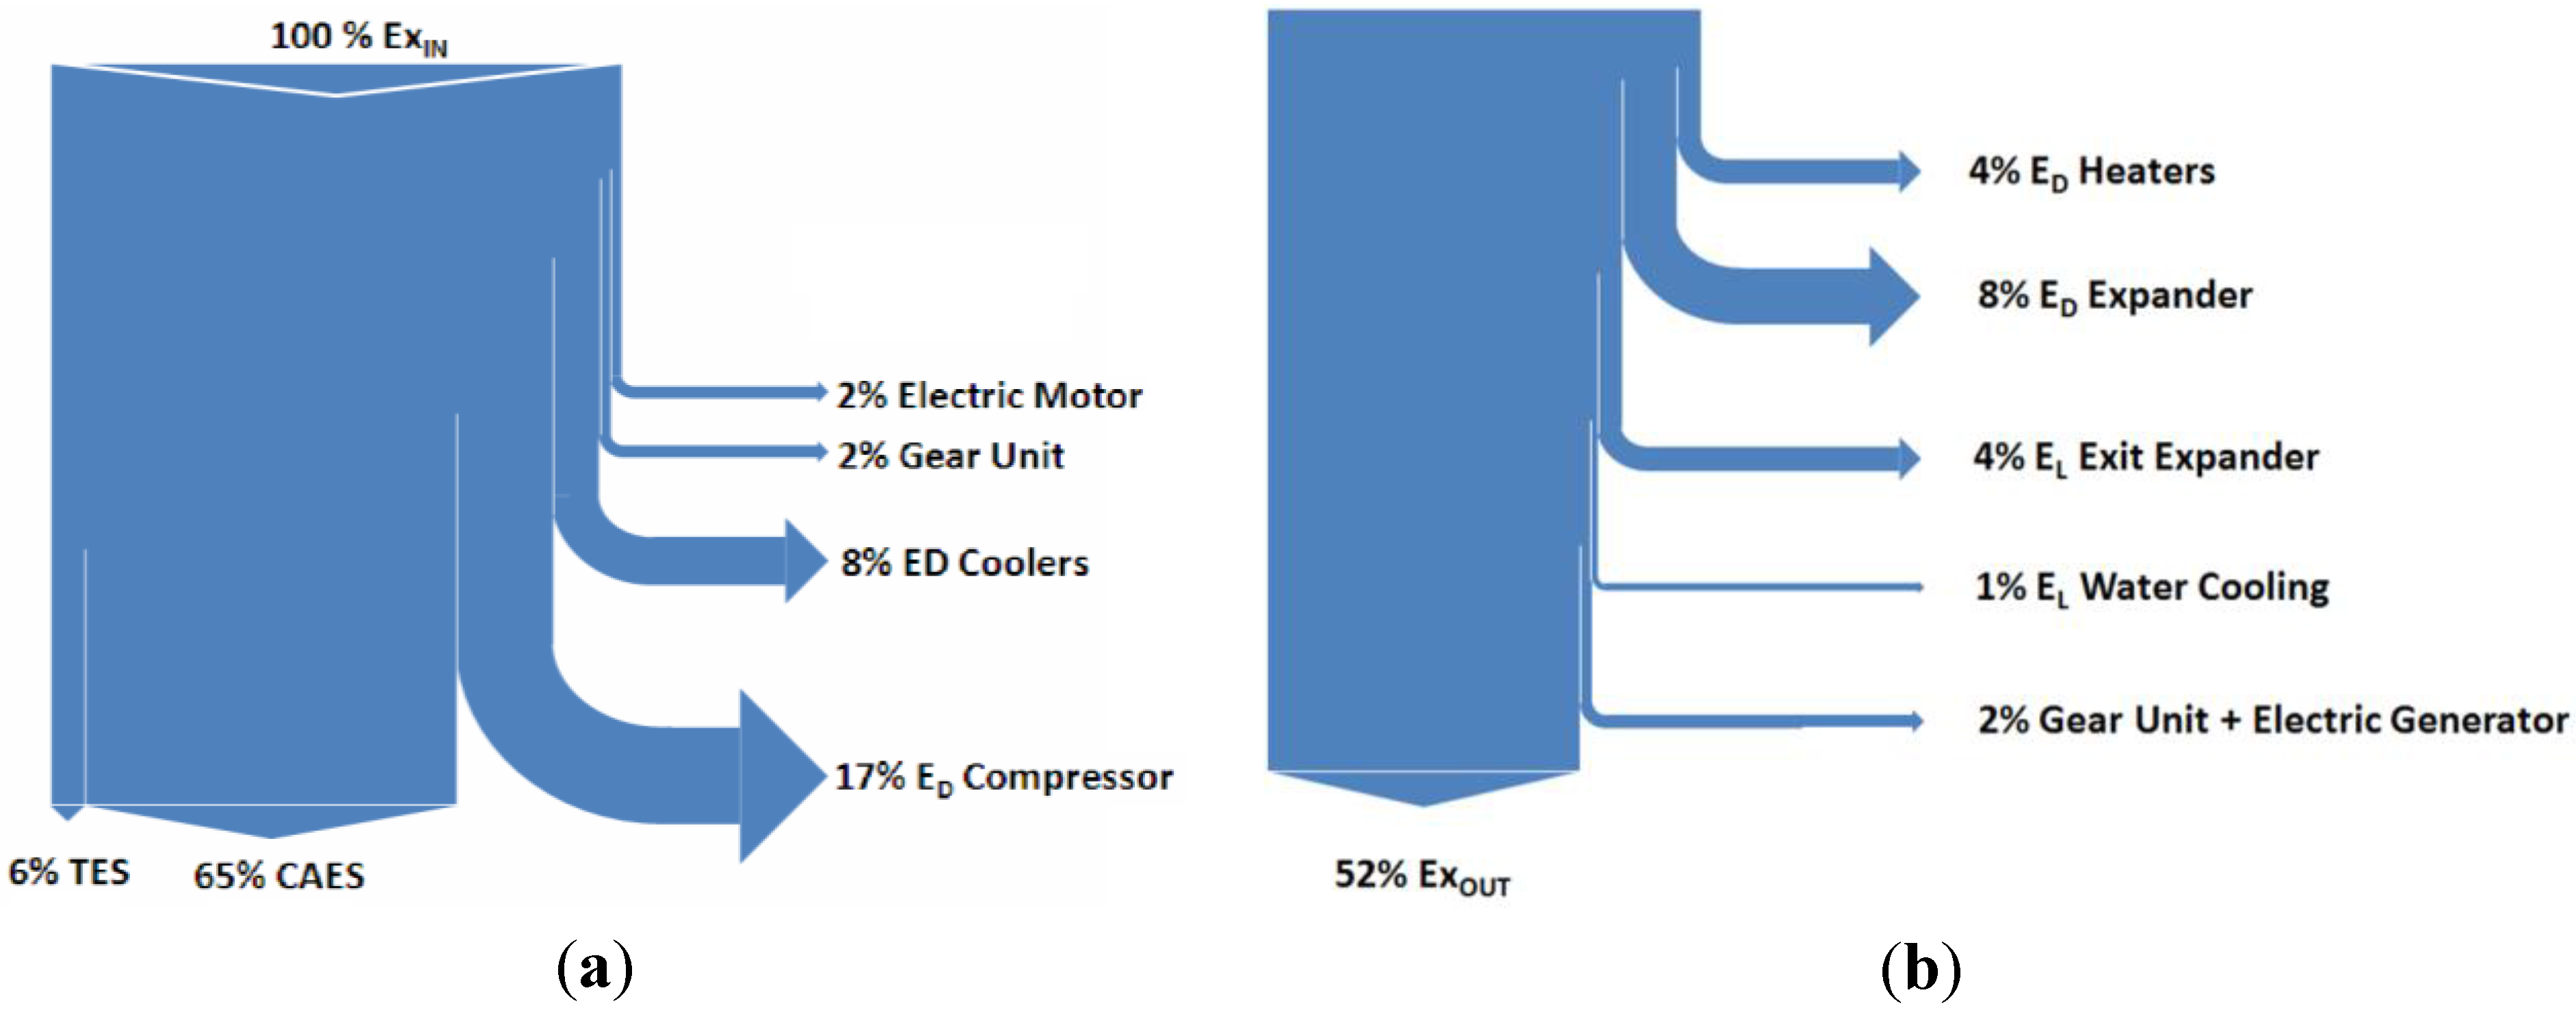
The exergy analysis demonstrated that the largest exergy destructions occur in the compressors, expanders, and in the compressor intercoolers. To a smaller extent, the exergy losses connected to waste flows (“cold” water and expander exit flow rate) were also contributing to the overall exergy efficiency, which scored about 52%. The system is operated with electricity input and output.
Applying exergo-economics with real costs of equipment (pressure vessels, turbo-machinery, heat exchangers and electrical equipment) modifies to a large extent the results of the exergy analysis, in terms of economic performance. The capital cost of the pressure vessel system and the cost of electricity for operating the compressors represent the major contributions to the cost buildup. On the whole, the proposed system is able to provide peak load electricity with a cost increase of about 84% with respect to the base-load cost (which is assumed for operating the compressors). This performance—even if improvable by design modifications—is considered appealing in the current status of the electricity market.


