Impacts of Irrigation on the Heat Fluxes and Near-Surface Temperature in an Inland Irrigation Area of Northern China

Abstract
: Irrigated agriculture has the potential to alter regional to global climate significantly. We investigate how irrigation will affect regional climate in the future in an inland irrigation area of northern China, focusing on its effects on heat fluxes and near-surface temperature. Using the Weather Research and Forecasting (WRF) model, we compare simulations among three land cover scenarios: the control scenario (CON), the irrigation scenario (IRR), and the irrigated cropland expansion scenario (ICE). Our results show that the surface energy budgets and temperature are sensitive to changes in the extent and spatial pattern of irrigated land. Conversion to irrigated agriculture at the contemporary scale leads to an increase in annual mean latent heat fluxes of 12.10 W m−2, a decrease in annual mean sensible heat fluxes of 8.85 W m−2, and a decrease in annual mean temperature of 1.3 °C across the study region. Further expansion of irrigated land increases annual mean latent heat fluxes by 18.08 W m−2, decreases annual mean sensible heat fluxes by 12.31 W m−2, and decreases annual mean temperature by 1.7 °C. Our simulated effects of irrigation show that changes in land use management such as irrigation can be an important component of climate change and need to be considered together with greenhouse forcing in climate change assessments.1. Introduction
Radiation and heat fluxes on the Earth's surface play important roles in regional to global circulations and may cause significant changes to the surface climate. Human activities have been widely recognized as a key contributor to climate change [1]. Human activities modify radiation and heat fluxes at the surface by altering the composition of the atmosphere and by changing the land cover [2–4]. Land cover changes can affect the regional energy balance and atmospheric processes through changes in land surface attributes including albedo, roughness length, and soil moisture. There is growing evidence that these impacts of land cover changes need to be considered when evaluating the effects of anthropogenic greenhouse warming and modeling future climate change [5,6].
Many studies have shown that changes in land use management including irrigation can be as important as changes in land cover in terms of their influences on the climate system [7–9]. It is reported that globally irrigated agriculture consumes 2600 km3 of water each year, which comprises 70% of all human water withdrawals [10,11]. This huge manipulation of water for irrigation would imply the regional significance of irrigation on near surface energy exchange and hydrological cycle. There are a number of pathways through which irrigation may affect local and regional climates. Irrigation reduces surface albedo and increases net surface radiation [12]. Enhanced soil moisture due to irrigation leads to greater evapotranspiration and a resulting cooling of the land surface through the repartitioning between sensible heat fluxes and latent heat fluxes [8,13]. Under given circumstances increased atmospheric water vapor may enhance cloud cover, convection, and downstream precipitation [14]. Irrigation creates thermal contrast between cool and wetter irrigated land and nearby hotter and drier non-irrigated land and thus can modify regional circulation patterns [12].
Despite the importance of irrigation for regional climate, there is limited understanding about the effects of irrigation on the heat fluxes and near-surface climate in the future, especially at the regional scale and for countries in the developing world. Previous studies have demonstrated the climatic effects and responses of irrigation using observational records [15–17] and climate modeling [8,18–21]. For example, based on historical near surface temperature records, Mahmood et al. [15] conducted pairwise comparisons of temperatures between irrigated and non-irrigated locations in Nebraska, USA. They found a decrease of 1 °C in mean maximum growing season temperature over irrigated areas. Using a regional climate model, Kueppers et al. [12] investigated the climate effect of irrigated agriculture in California and they showed that a regional irrigation cooling effect existed and the magnitude of this effect had strong seasonal variability. Mainly due to data limitations, however, almost all of these studies have focused on the interaction between irrigation and past climate changes. To our knowledge, none of these studies provides direct insights about how future climate will respond to irrigation. Understanding how irrigation amount, extent, and location will affect future climate is needed to formulate policies aimed at mitigating or adapting to climate change. In addition, to date, most studies have been devoted to irrigated areas in the United States or India where data on land use and climate are relatively ample [20,22–24]. There is one study that has examined the effects of irrigation on climate in Asia including China [25], but to our knowledge, no study focuses particularly on China or regions in China. More efforts are required to understand the climatic feedbacks of many regions in the developing world including China which continue to experience expansion of irrigated land.
As 80% of the nation's food is produced on irrigated cropland, irrigated agriculture in China plays an important role in sustaining people's livelihood and the economy [26,27]. In arid regions of northern and northwestern China where natural rainfall cannot fulfill agricultural water requirements, irrigation is used to improve soil moisture conditions and increase yields [28]. Situated in the middle reaches of the Yellow River basin in northern China, our study area has a long history of intensive farming and irrigation water use [29]. The loose texture and high erodibility of loess soil, sparse vegetation, and intensive agriculture combined have resulted in severe soil erosion and ecological deterioration over this region [30]. Given the reliance on irrigated agriculture and high ecological vulnerability, a better understanding of the land-atmosphere interactions and feedback mechanisms in this region is of both scientific and social importance.
This study examines the impacts of irrigated agriculture on the heat fluxes and near-surface temperature in the future using a next-generation mesoscale forecast model, the Weather Research and Forecasting (WRF) modeling system. One of the key components of the WRF system is a sophisticated land surface model (LSM), which allows an explicit calculation of the water and energy dynamics of the land surface. With the most recent information on land use in our study area and projected future atmospheric lateral boundary conditions, we intend to extend the existing findings about the climatic effects of irrigation to further investigate future changes in the energy budget and regional climate in response to irrigation.
2. Study Area
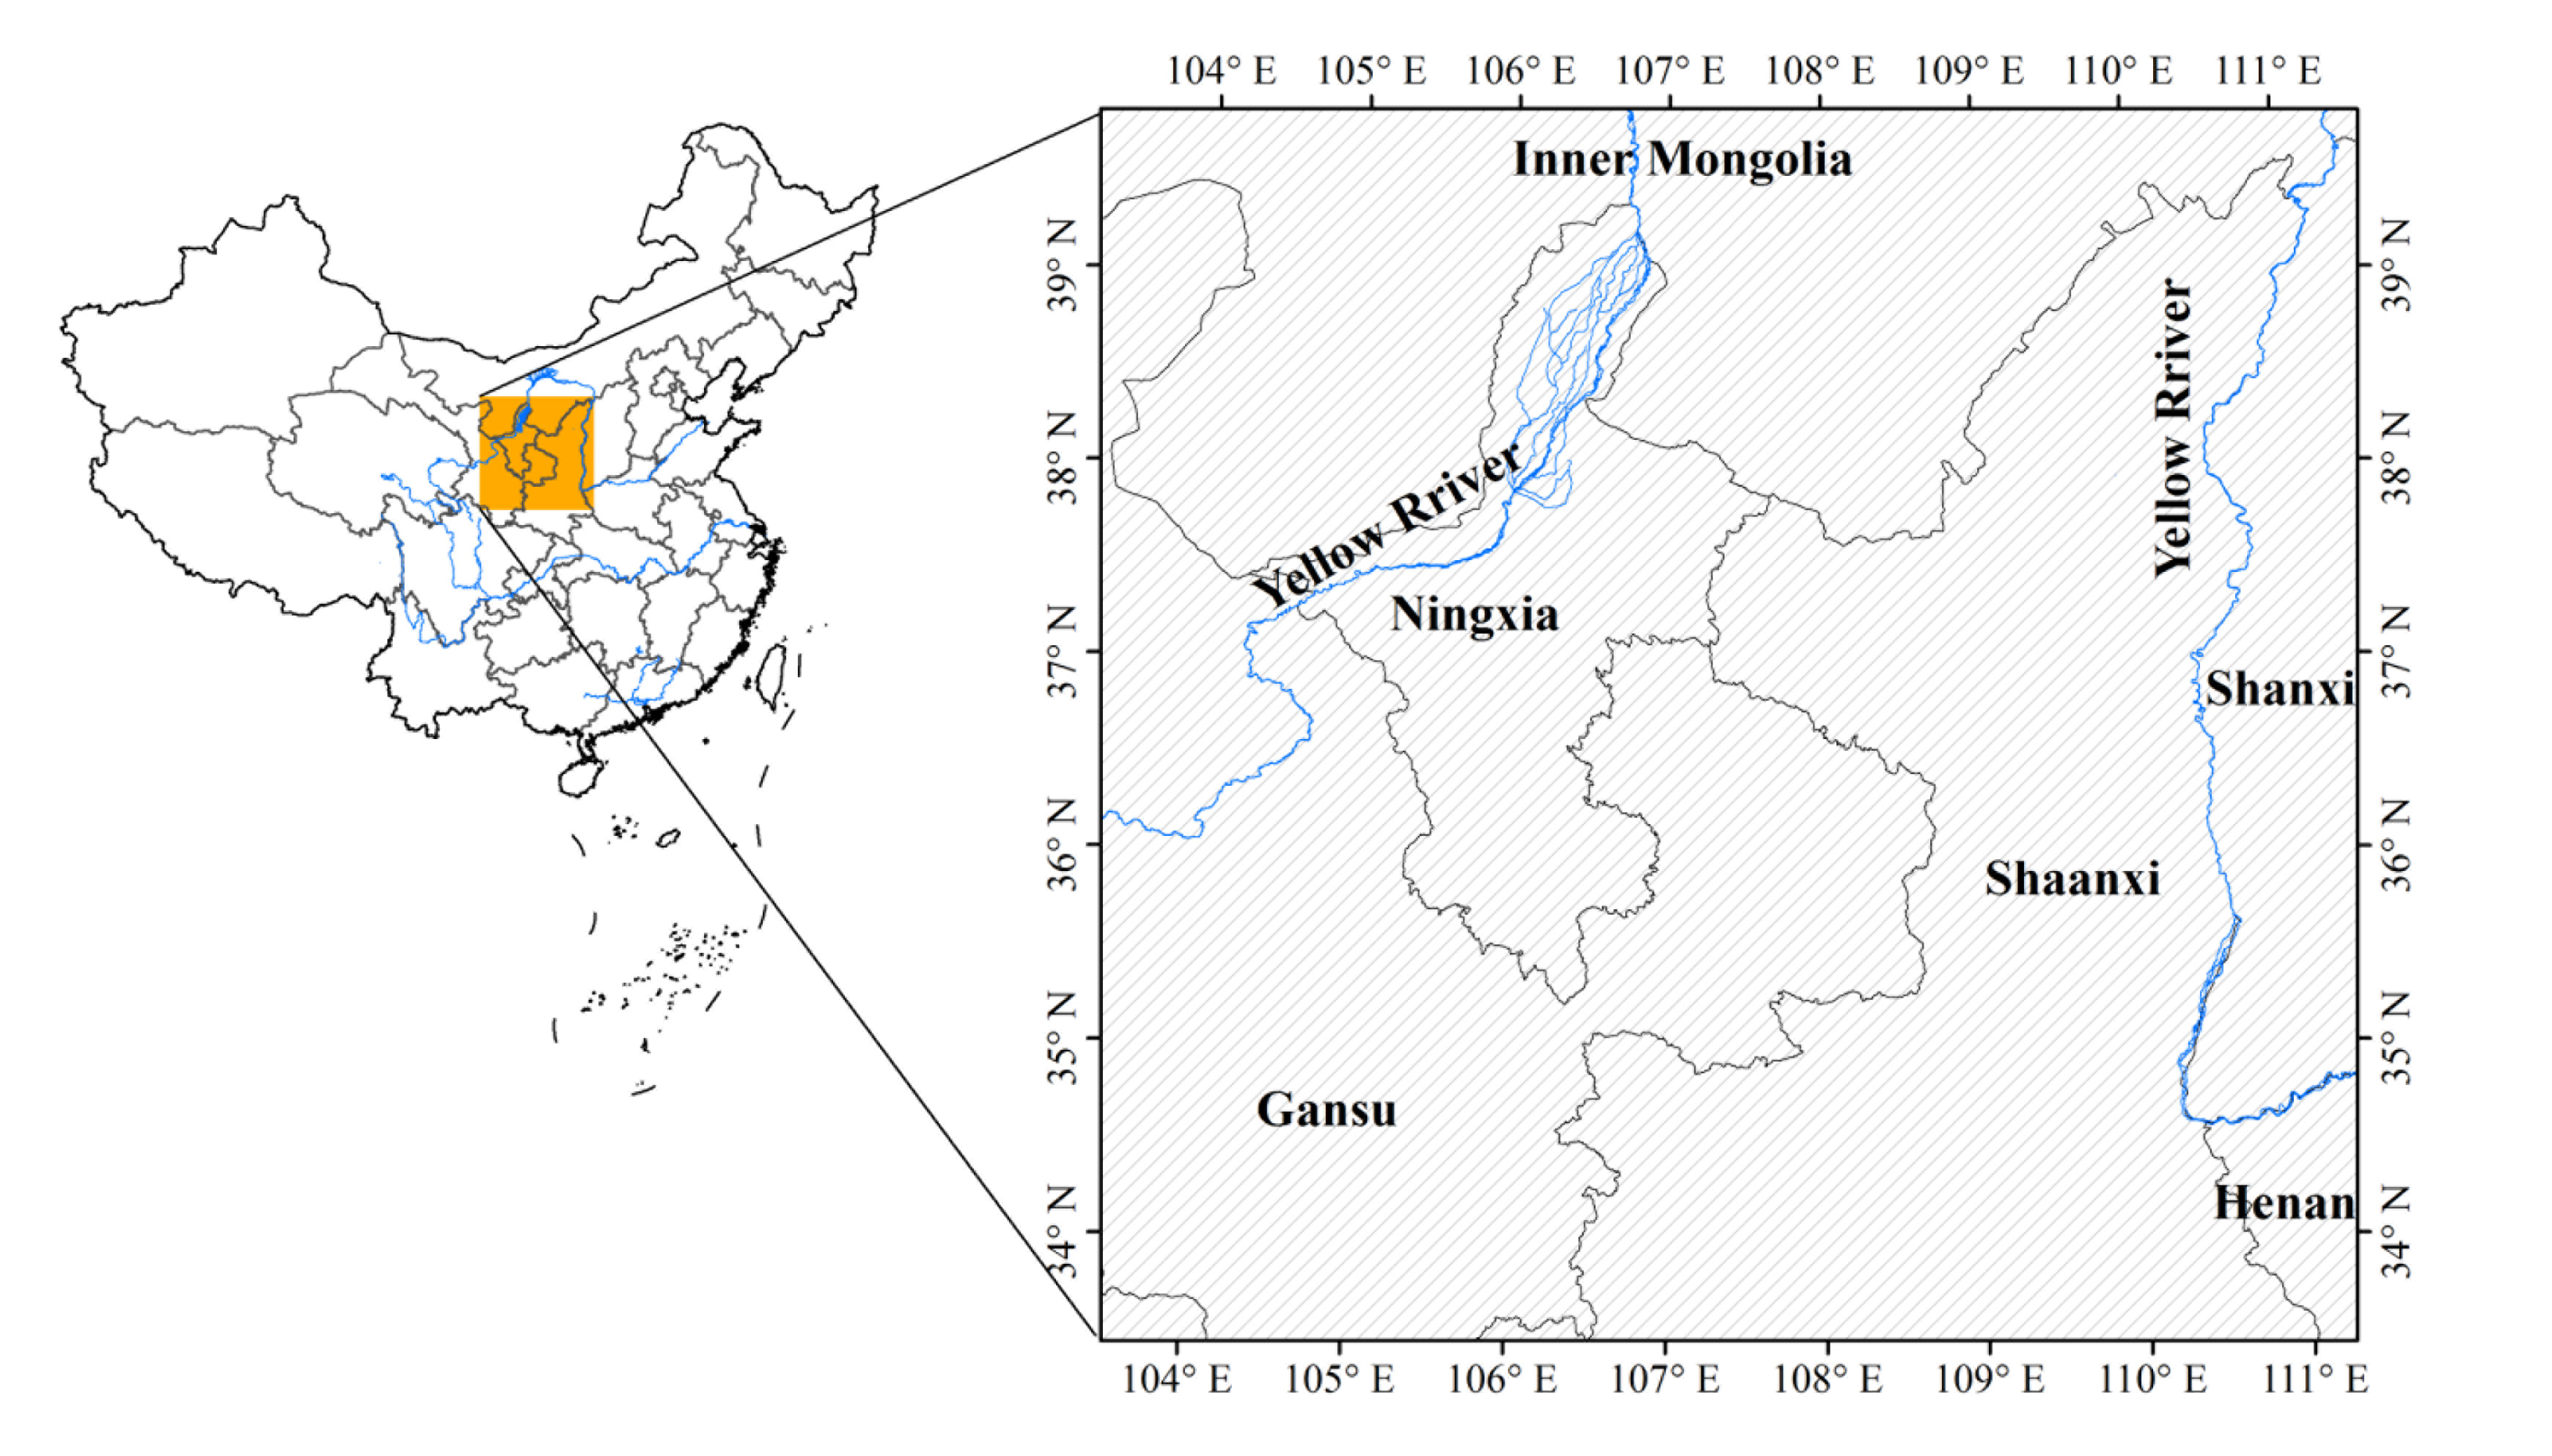
Our study area is situated in northern China and it occupies an area of 476,100 km2 (Figure 1). The Yellow River, the river with the highest sediment concentration in the world, flows through the region [31]. The region has a semi-arid to semi-humid continental climate, with extensive monsoonal influence. Winters are cold and dry, while summers are warm and in many areas hot. The average annual temperature ranges from 4 °C to 12 °C. The average annual precipitation varies between 440 mm and 600 mm and 70% of the rainfall is concentrated during the summer in the form of storms [29]. Covered with highly erodible Loess deposits, the region has among the world's highest soil erosion rates [32]. More than 1.6 billion tons of sediment has been deposited to the Yellow River annually, posing a serious flood risk for downstream areas [33]. The highly erodible soil, low vegetation cover, and centuries of unsustainable agricultural practices, combined with great population pressures, have led to severe environmental degradation. The main land use categories comprise cultivated land and sparse grassland. The typical cropping system over the area is double cropping with winter wheat rotated by maize or soybeans each year [28]. The cropping season of wheat occurs during the fall, winter, and spring (October–May) and the cropping season of maize (soybeans) occurs during the summer (June–September). The maize is sown immediately after the wheat is harvested. In order to increase grain production, farmers usually apply supplemental irrigation to their crops to overcome rainfall deficiency taking place throughout the year.
3. Data
Since understanding the interactions between irrigation and changes in the regional heat fluxes and temperature in the future is the main goal of the study, we require high resolution, spatially explicit data on land use. We used a land use data set that were derived from the National Aeronautics and Space Administration (NASA) Landsat Thematic Mapper and Enhanced Thematic Mapper (TM/ETM) satellite, and analyzed by the Chinese Academy of Sciences (CAS) [34,35]. This national data set, which has undergone extensive testing and development, contains the most recent information about the extent of different land uses in China for the year 2010. Original land-use maps, which have been classified into 6 first-level land-use categories and 25 second-level categories, exist at the scale of 1:100,000. The validation test indicates that the average interpretation accuracy for the land-use maps is 95%. The land use maps are further geocoded and stored as 1 km grid data using both the area percentage grid method and the greatest-area method. For the greatest-area method, if a cell contains more than one polygon and has more than one possible code, the code of the polygon with the greatest area in the cell is used. Land use data operated by the WRF system follow the United States Geological Survey's (USGS) land cover classification scheme. Therefore, we implemented a spatial data mining technique proposed by Wu et al. [36] to our study area and converted the land use data from the CAS to the USGS classification system. The USGS classification system, which consists of 24 categories, has been widely recognized and used in the simulation studies of climate changes. Particularly, we produced the majority of the land cover categories including dryland and irrigated cropland in the USGS system by comparing the relevant subcategories between the CAS and USGS systems using the greatest-area grid data. In this way, we generally retained the spatial distribution of land covers in the original high resolution data set. The new land cover dataset is a single-layer dataset with ∼1 km spatial resolution, representing 15 land cover categories. Finally, to meet the input requirements of the WRF system, we aggregated the 1km grid data of the USGS system to the 10 km grid data to facilitate the simulation of atmospheric responses to different land cover scenarios.
We constructed the atmospheric lateral boundary forcing conditions for the period of 2010–2020 using the projected output of future climate change based on the Representative Concentration Pathway 6 (RCP6) from the multimodel dataset of the Coupled Model Intercomparison Project Phase 5 (CMIP5). The RCPs provide four possible climate trajectories, all of which depend on how factors including radiative forcings, technology, economies, lifestyle, and policy will change in the future [37]. The RCP6, which is developed by the Asia-Pacific Integrated Model (AIM) modeling team at the National Institute for Environmental Studies (NIES), Japan, is a stabilization scenario where total radiative forcing is stabilized after 2100 [38]. The variables that we use to construct the atmospheric forcing conditions from 2010 to 2020 include air temperature, specific humidity, sea level pressure, u-wind, v-wind, and geopotential height.
4. Methods
4.1. Land Cover Scenarios
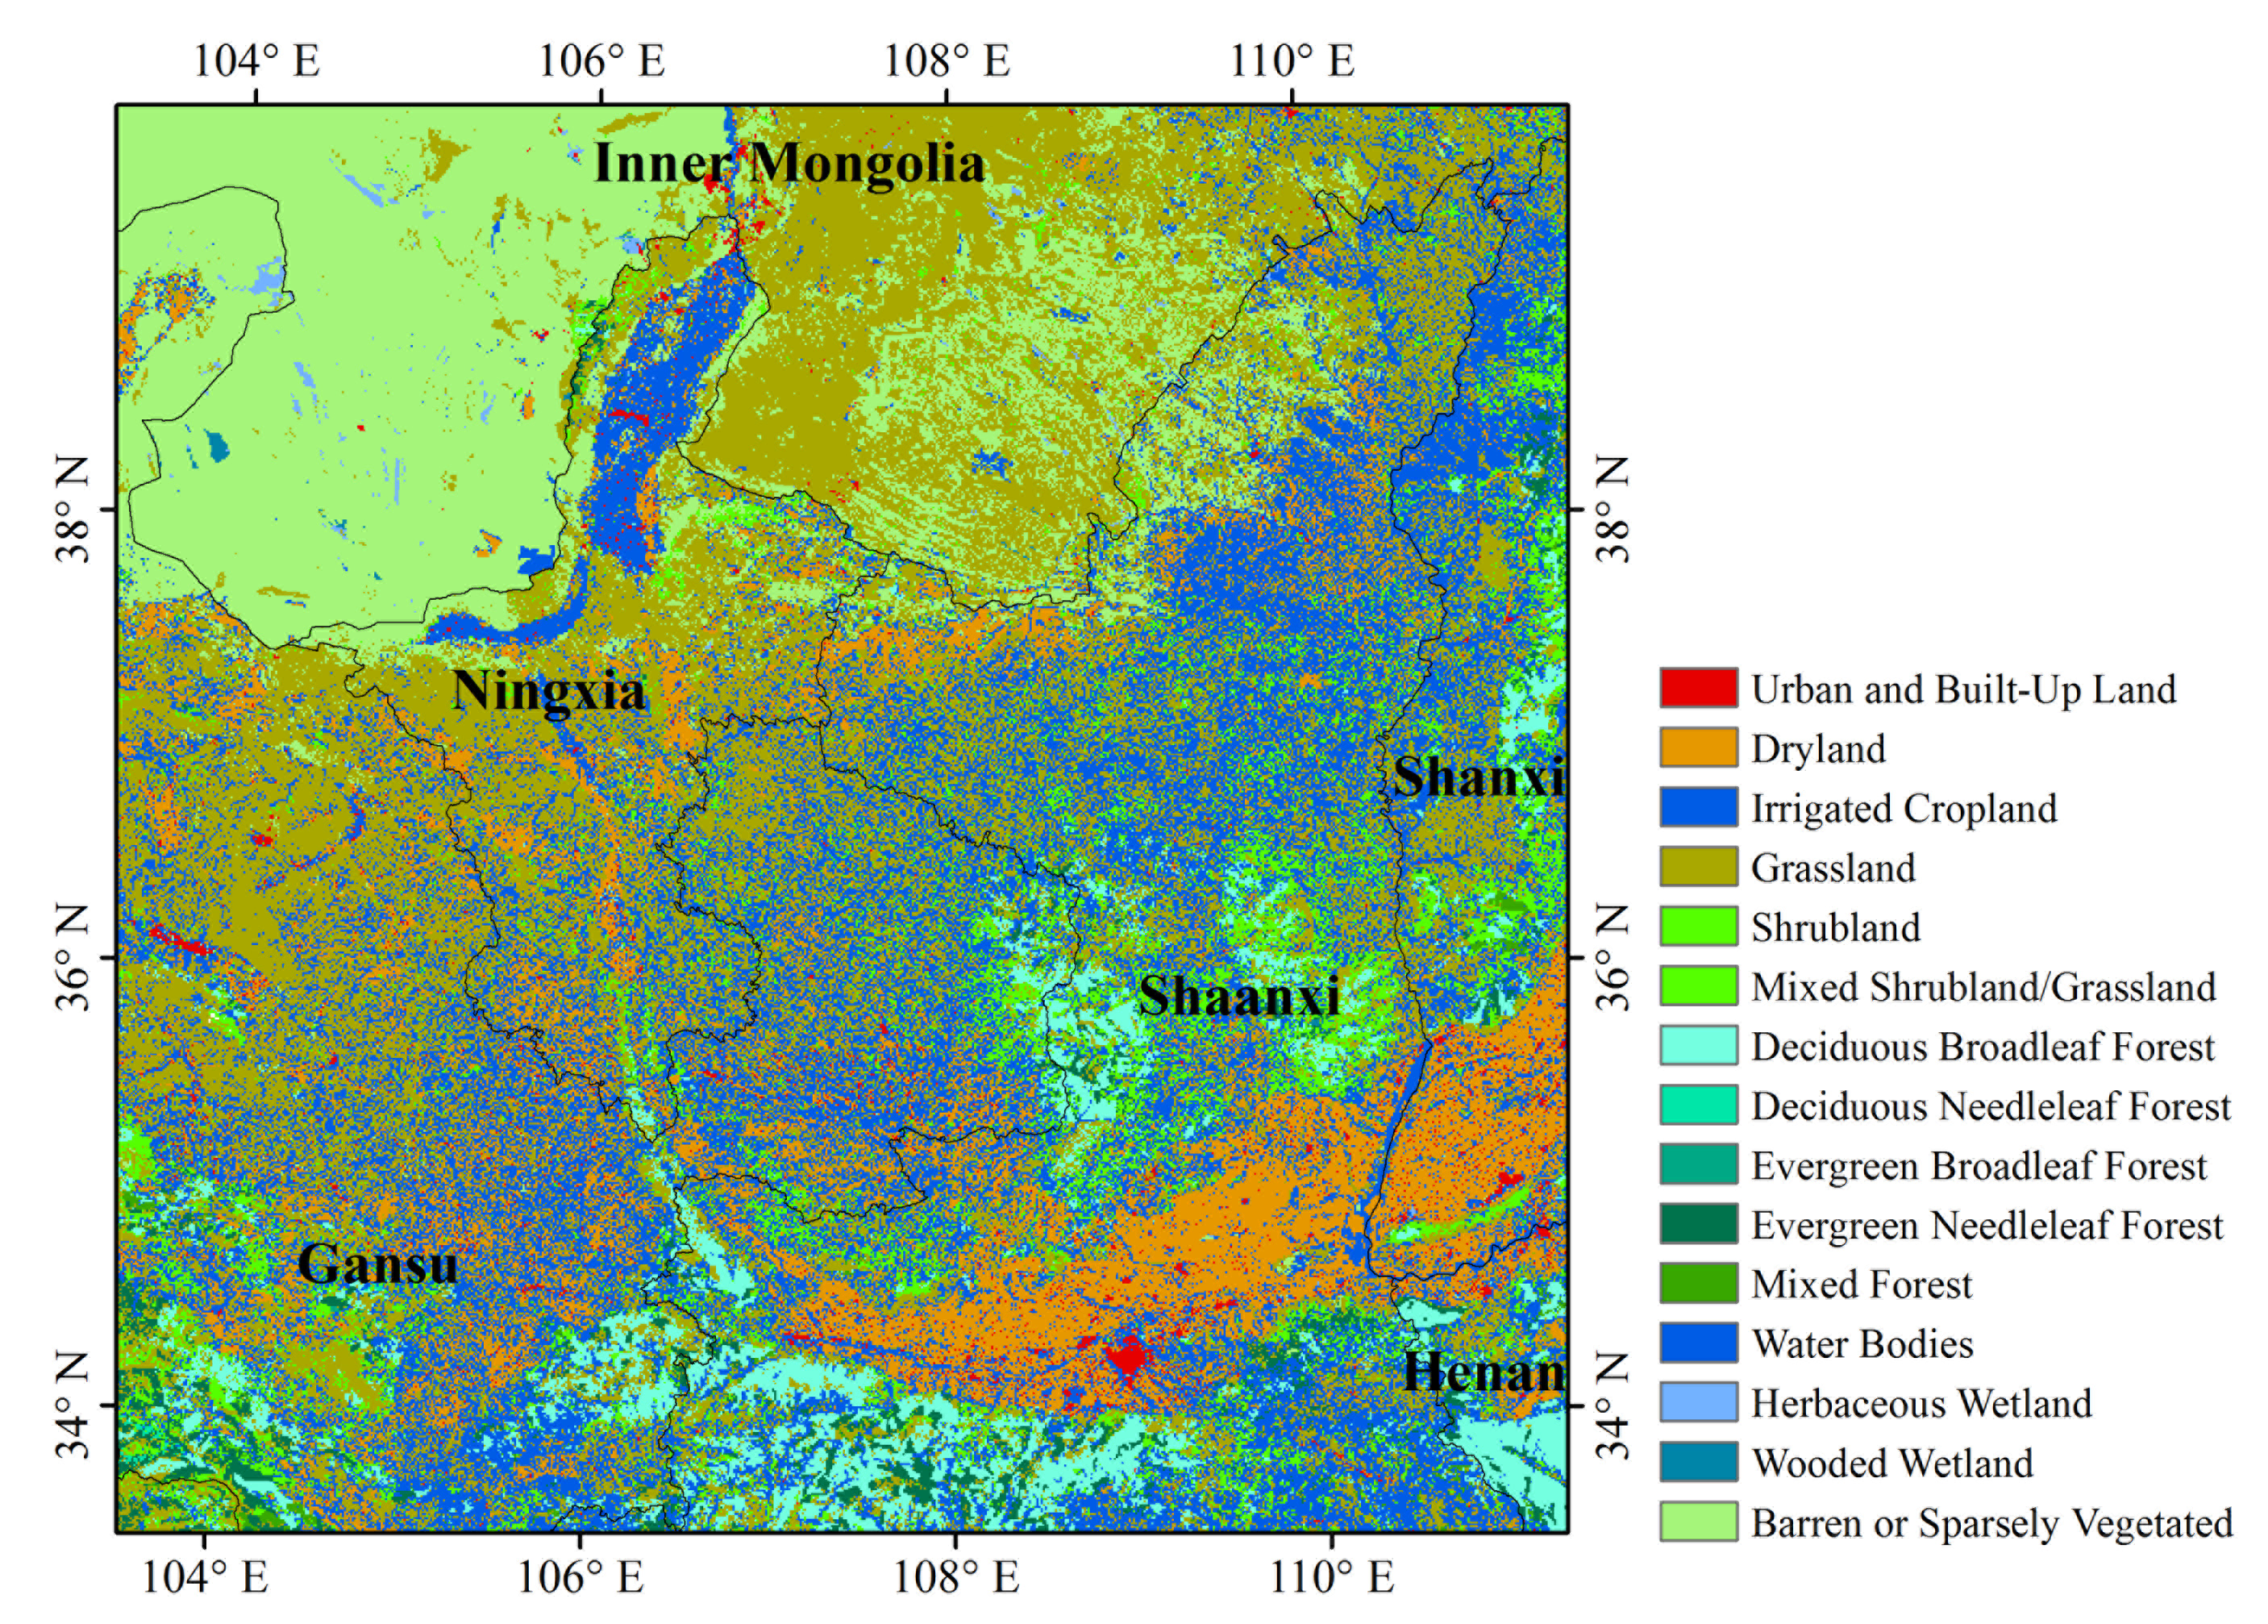
Figure 2 displays the land cover map of our study area in 2010 represented by the new land cover dataset that is generated from the CAS national land use data set. This land cover map shows that the contemporary landscape of our study area is characterized by a rich culture of agriculture and the mixture of different land covers. In 2010, the area of cultivated cropland including dryland and irrigated cropland, takes up 37% of the total landscape. More than 72% of the cultivated cropland is irrigated while the proportion of dryland is relatively small.
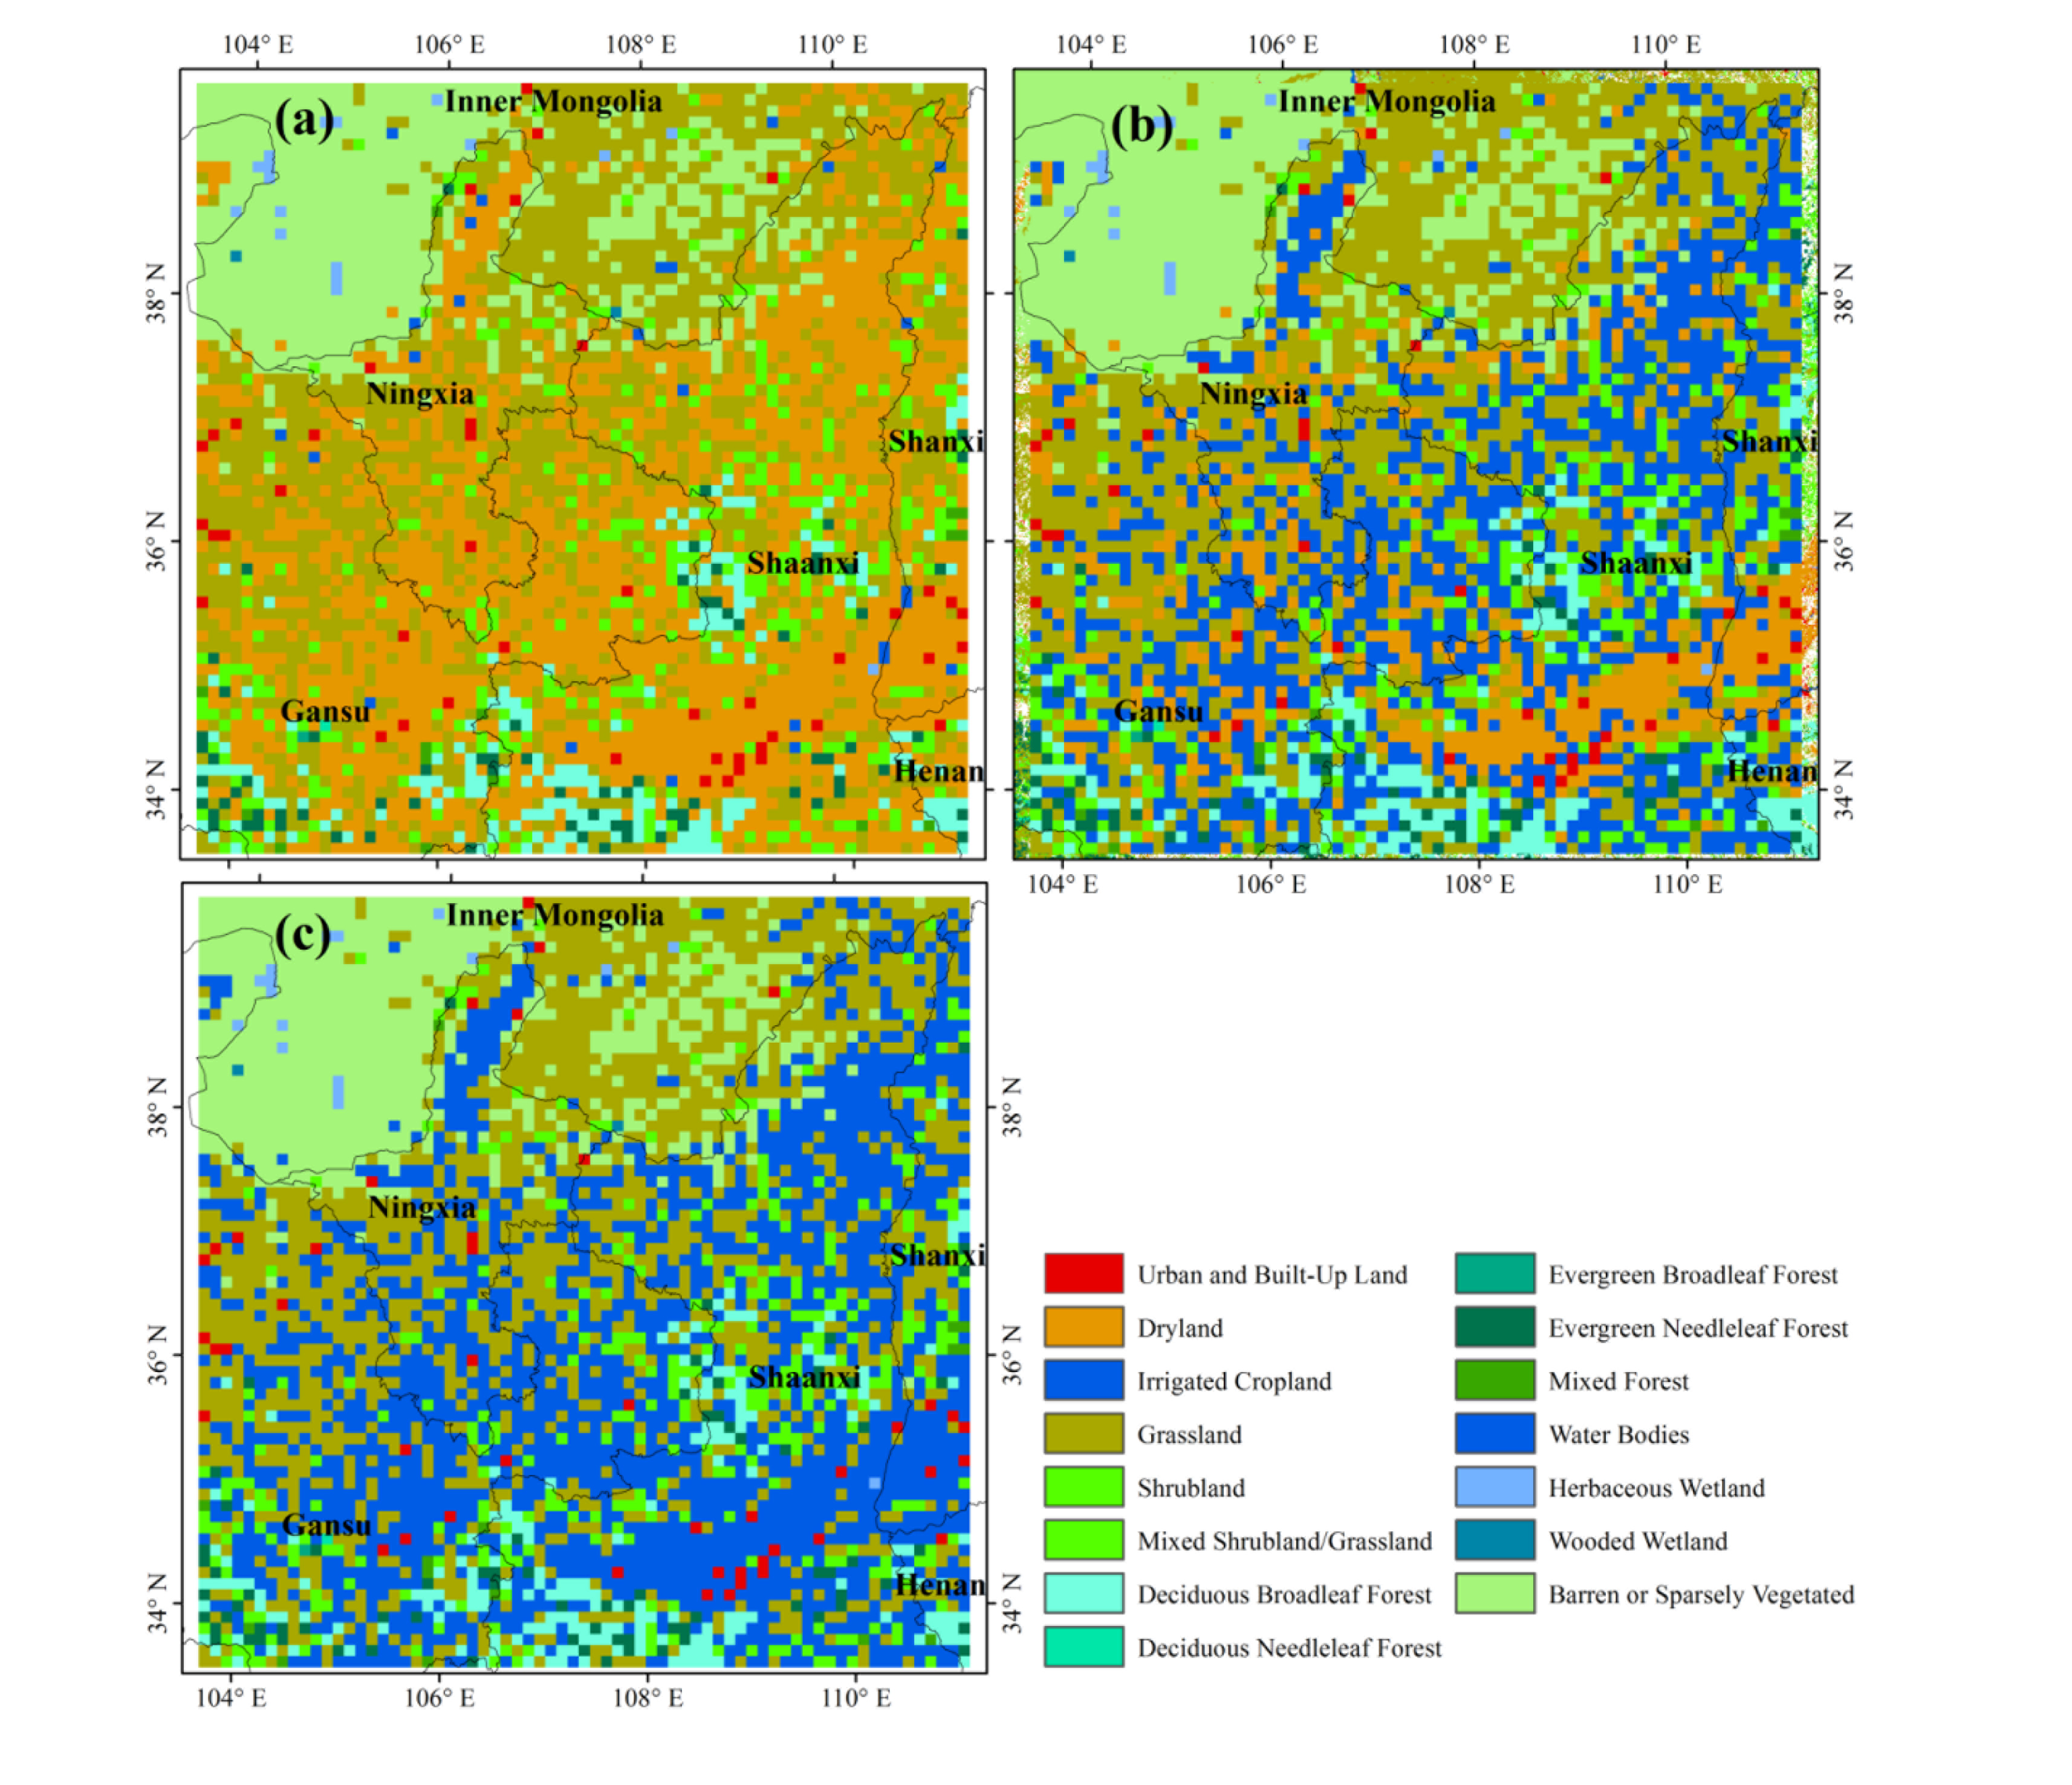
In order to identify the effects of irrigated agriculture on the energy fluxes and near-surface temperature, we designed three land cover datasets corresponding to three land cover scenarios (Figure 3). The control scenario (CON) assumes that there is no irrigation at all. The irrigation scenario (IRR) assumes that irrigated agriculture maintains at the contemporary scale. The irrigated cropland expansion scenario (ICE) assumes an expansion of the irrigation to all cultivated cropland. For the IRR, we used the new land cover dataset derived from the CAS dataset. For the CON, we selected any grid cell in which the land cover was irrigated cropland in the new land cover dataset and replaced it with the cell of dryland. For the ICE, we selected any grid cell specified as dryland in the new land cover dataset and replaced it with the cell of irrigated cropland. In reality, we expect the potential expansion of irrigated cropland to be limited because we consider that further expansion of irrigation would be largely constrained by the shortage of water resources in northern China. The land cover scenarios defined here are relatively extreme and are intended to help understand the nature and potential magnitude of climate effects of irrigated agriculture. However, based on the modeling results of these scenarios, we can derive useful insights about the actual climate effects of past and future expansion of irrigation over existing cropland.
4.2. Model Description
We conducted numerical simulations using the WRF modeling system Version 2. The WRF model is a fully-functioning, next-generation mesoscale forecast model and data assimilation that will advance both the understanding and prediction of mesoscale climate systems and promote the interactions between the atmospheric research and operational communities [39]. It is a three-dimensional, non-hydrostatic, and primitive-equation atmospheric modeling system. The WRF model Version 2 uses the Eulerian mass coordinate and is referred to as the Advanced Research WRF (ARW) system [40]. Changes and updates to the ARW over previous versions include mixed-phase physics schemes suitable for cloud-resolving modeling, multiple-nesting capabilities that enhance resolution over the areas of interest, and enhanced model coupling Application Program Interface (API) enabling WRF to be coupled with other models such as ocean, and land models. The WRF model has been utilized extensively for regional climate, operational numerical weather prediction, and hurricane and storm prediction [40–42]. Validation against observational records indicates its high performance in simulating spatial and temporal climatic features [39].
For all simulation runs, we used a domain centered at 36.7° N, 107° W, with a horizontal resolution of 10 km and with 31 vertical layers. The soil column has four soil layers, with the bottom layer extending to a maximum depth of 3.5 m. In the WRF model, we simulated water vapor and cloud processes using the Single-Moment 3-class (WSM3) scheme [43]. We used the Grell-Devenyi ensemble cumulus parametrization scheme [44] to account for the sub-grid-scale effects of convective and shallow clouds. The surface layer physics followed similarity theory. We parameterized atmospheric boundary layer processes using the Yonsei University (YSU) planetary boundary layer, a nonlocal K scheme with an explicit treatment of the entrainment layer and parabolic K profile in the unstable mixed layer. We chose the Rapid Radiative Transfer Model (RRTM) [45] as the longwave radiation scheme and MM5 Shortwave scheme [46] as the shortwave radiation scheme. We selected the Smagorinsky scheme for horizontal diffusion and Mellor and Yamada [47] scheme for vertical diffusion. We used the Noah LSM [48] to model land surface processes. The Noah LSM is a four-layer soil temperature and moisture model which calculates thermal and moisture stocks and fluxes at the land-atmosphere interface and may handle vegetation, root, and canopy effects and surface snow-cover prediction.
For irrigated grid cells representing irrigated cropland, our model forces soil moisture at root zone to field capacity at every time step (time step = 30 min), all year round. Field capacity, defined as the maximum amount of water that the unsaturated zone of a soil can hold, is a parameter prescribed based on soil type. Irrigation practices and technologies vary in real cases. However, since most of our study area supports a whole year growing season [28], we use this as a reasonable approximation to actual irrigation. The irrigation water either leaves the surface through evapotranspiration or gets lost as runoff or sub-surface drainage. Our model separately simulates three processes of evapotranspiration—ground evaporation, vegetation transpiration, and vegetation evaporation, i.e., evaporation of water intercepted by vegetation canopy. The amount of evapotranspiration is calculated as the sum of the three. For non-irrigated grid cells representing dryland and the other land covers, the LSM determines soil moisture as a function of precipitation, evapotranspiration, infiltration, and soil properties. Initial soil moisture conditions and vegetation parameters specific to different land covers were taken from the parameter files in the Noah LAM. All vegetation interacts with soil moisture from the single vegetated soil column [13]. Like Lobell et al. [9] and Kueppers et al. [12], we set atmospheric CO2 concentrations constant at 355 ppm. To study the impacts of land surface changes related to irrigation, we simulated the regional atmospheric dynamics for a period of 11 years (1 January 2010–31 December 2020), based on the three land cover scenarios described earlier. We discarded the first year of each simulation as spin-up and compared results from the final 10 years among different scenarios.
5. Results and Discussion
5.1. Effects of Irrigation on Heat Fluxes
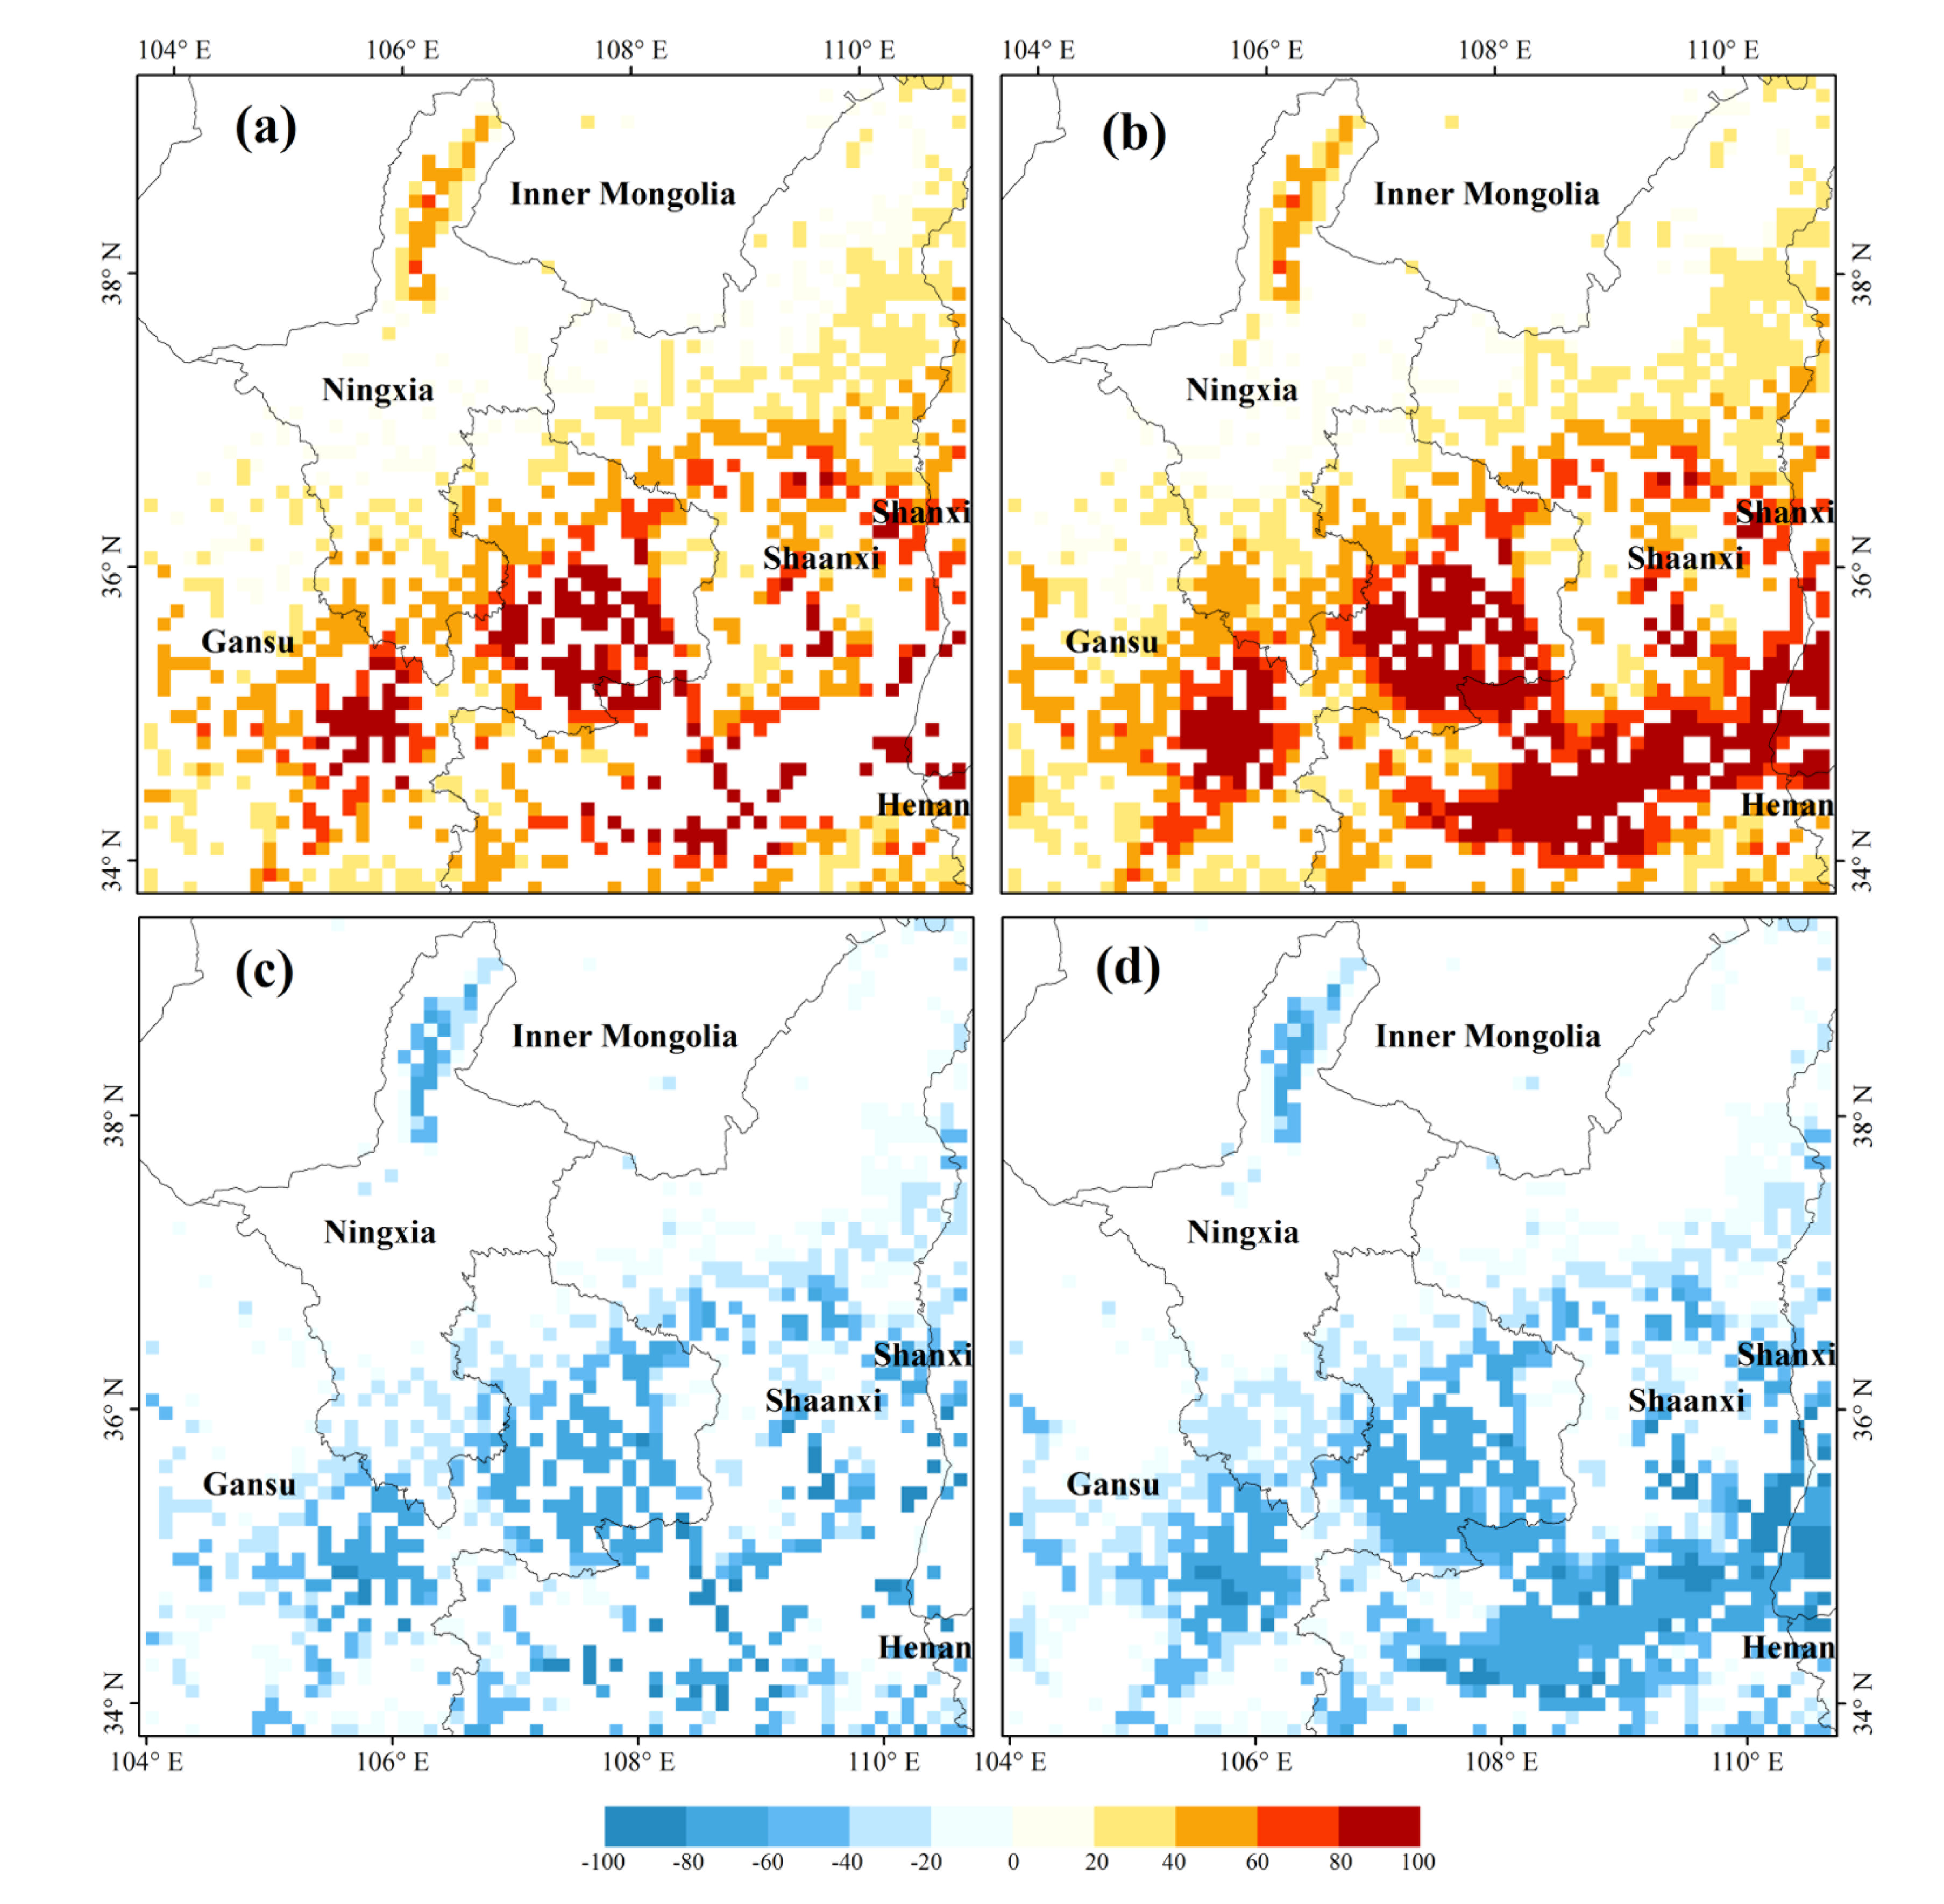
Over the 10-year period of simulations, irrigation displays significant impacts on surface energy budgets, evidenced by the differences in the partitioning of this energy between latent heat and sensible heat for the three land cover scenarios (Figure 4). The conversion from CON to IRR shows an increase in annual mean latent heat fluxes of 12.10 W m−2 and a decrease in annual mean sensible heat fluxes of 8.85 W m−2. The largest increases in annual mean latent heat fluxes occur in the central and eastern parts of Gansu province. For large areas in the middle and south section of the model domain, where irrigated cropland is densely distributed in IRR, latent heat fluxes increase by 40–80 W m−2. Surface energy budgets appear to change little for areas in the north section of the model domain, where much of the landscape is made up of barren land and grassland. More differences can be identified when irrigation extent expands to all cultivated cropland. The conversion from CON to ICE results in an increase in annual mean latent heat fluxes of 18.08 W m−2 and a decrease in annual mean sensible heat fluxes of 12.31 W m−2. Particularly, the latent heat fluxes increase by 80 W m−2 or more for a broad region in Middle Shaanxi and Shanxi provinces, where large areas of dryland is converted to irrigated cropland. The shift of energy balance away from sensible heat and towards latent heat is primarily due to increased soil moisture associated with irrigated grid cells, which leads to higher rates of evapotranspiration. The annual mean increase in evapotranspiration between the CON and IRR is 0.41 mm/day and is 0.61 mm/day between the CON and ICE.
Interestingly, further expansion of irrigation in ICE not only affects the surface energy budgets of the newly-converted land, but has an impact on the larger surrounding region. For example, many existing irrigated grid cells in IRR experience a further increase in latent heat fluxes in ICE. Our results indicate that the impact of irrigation can move beyond the scope of individual grid cells. This can be partially explained by the processes of irrigation water loss and a likely change in regional precipitation patterns. Despite that a large portion of extra water added from irrigation leaves the surface through evapotranspiration, the rest is lost in the form of runoff and sub-surface drainage, both of which may affect hydrology of the areas nearby. Compared to CON, irrigation increases runoff by 37 mm/year and 38 mm/year in IRR and ICE respectively. In addition, previous studies have demonstrated that precipitation feedbacks are not confined at local level [3,8].
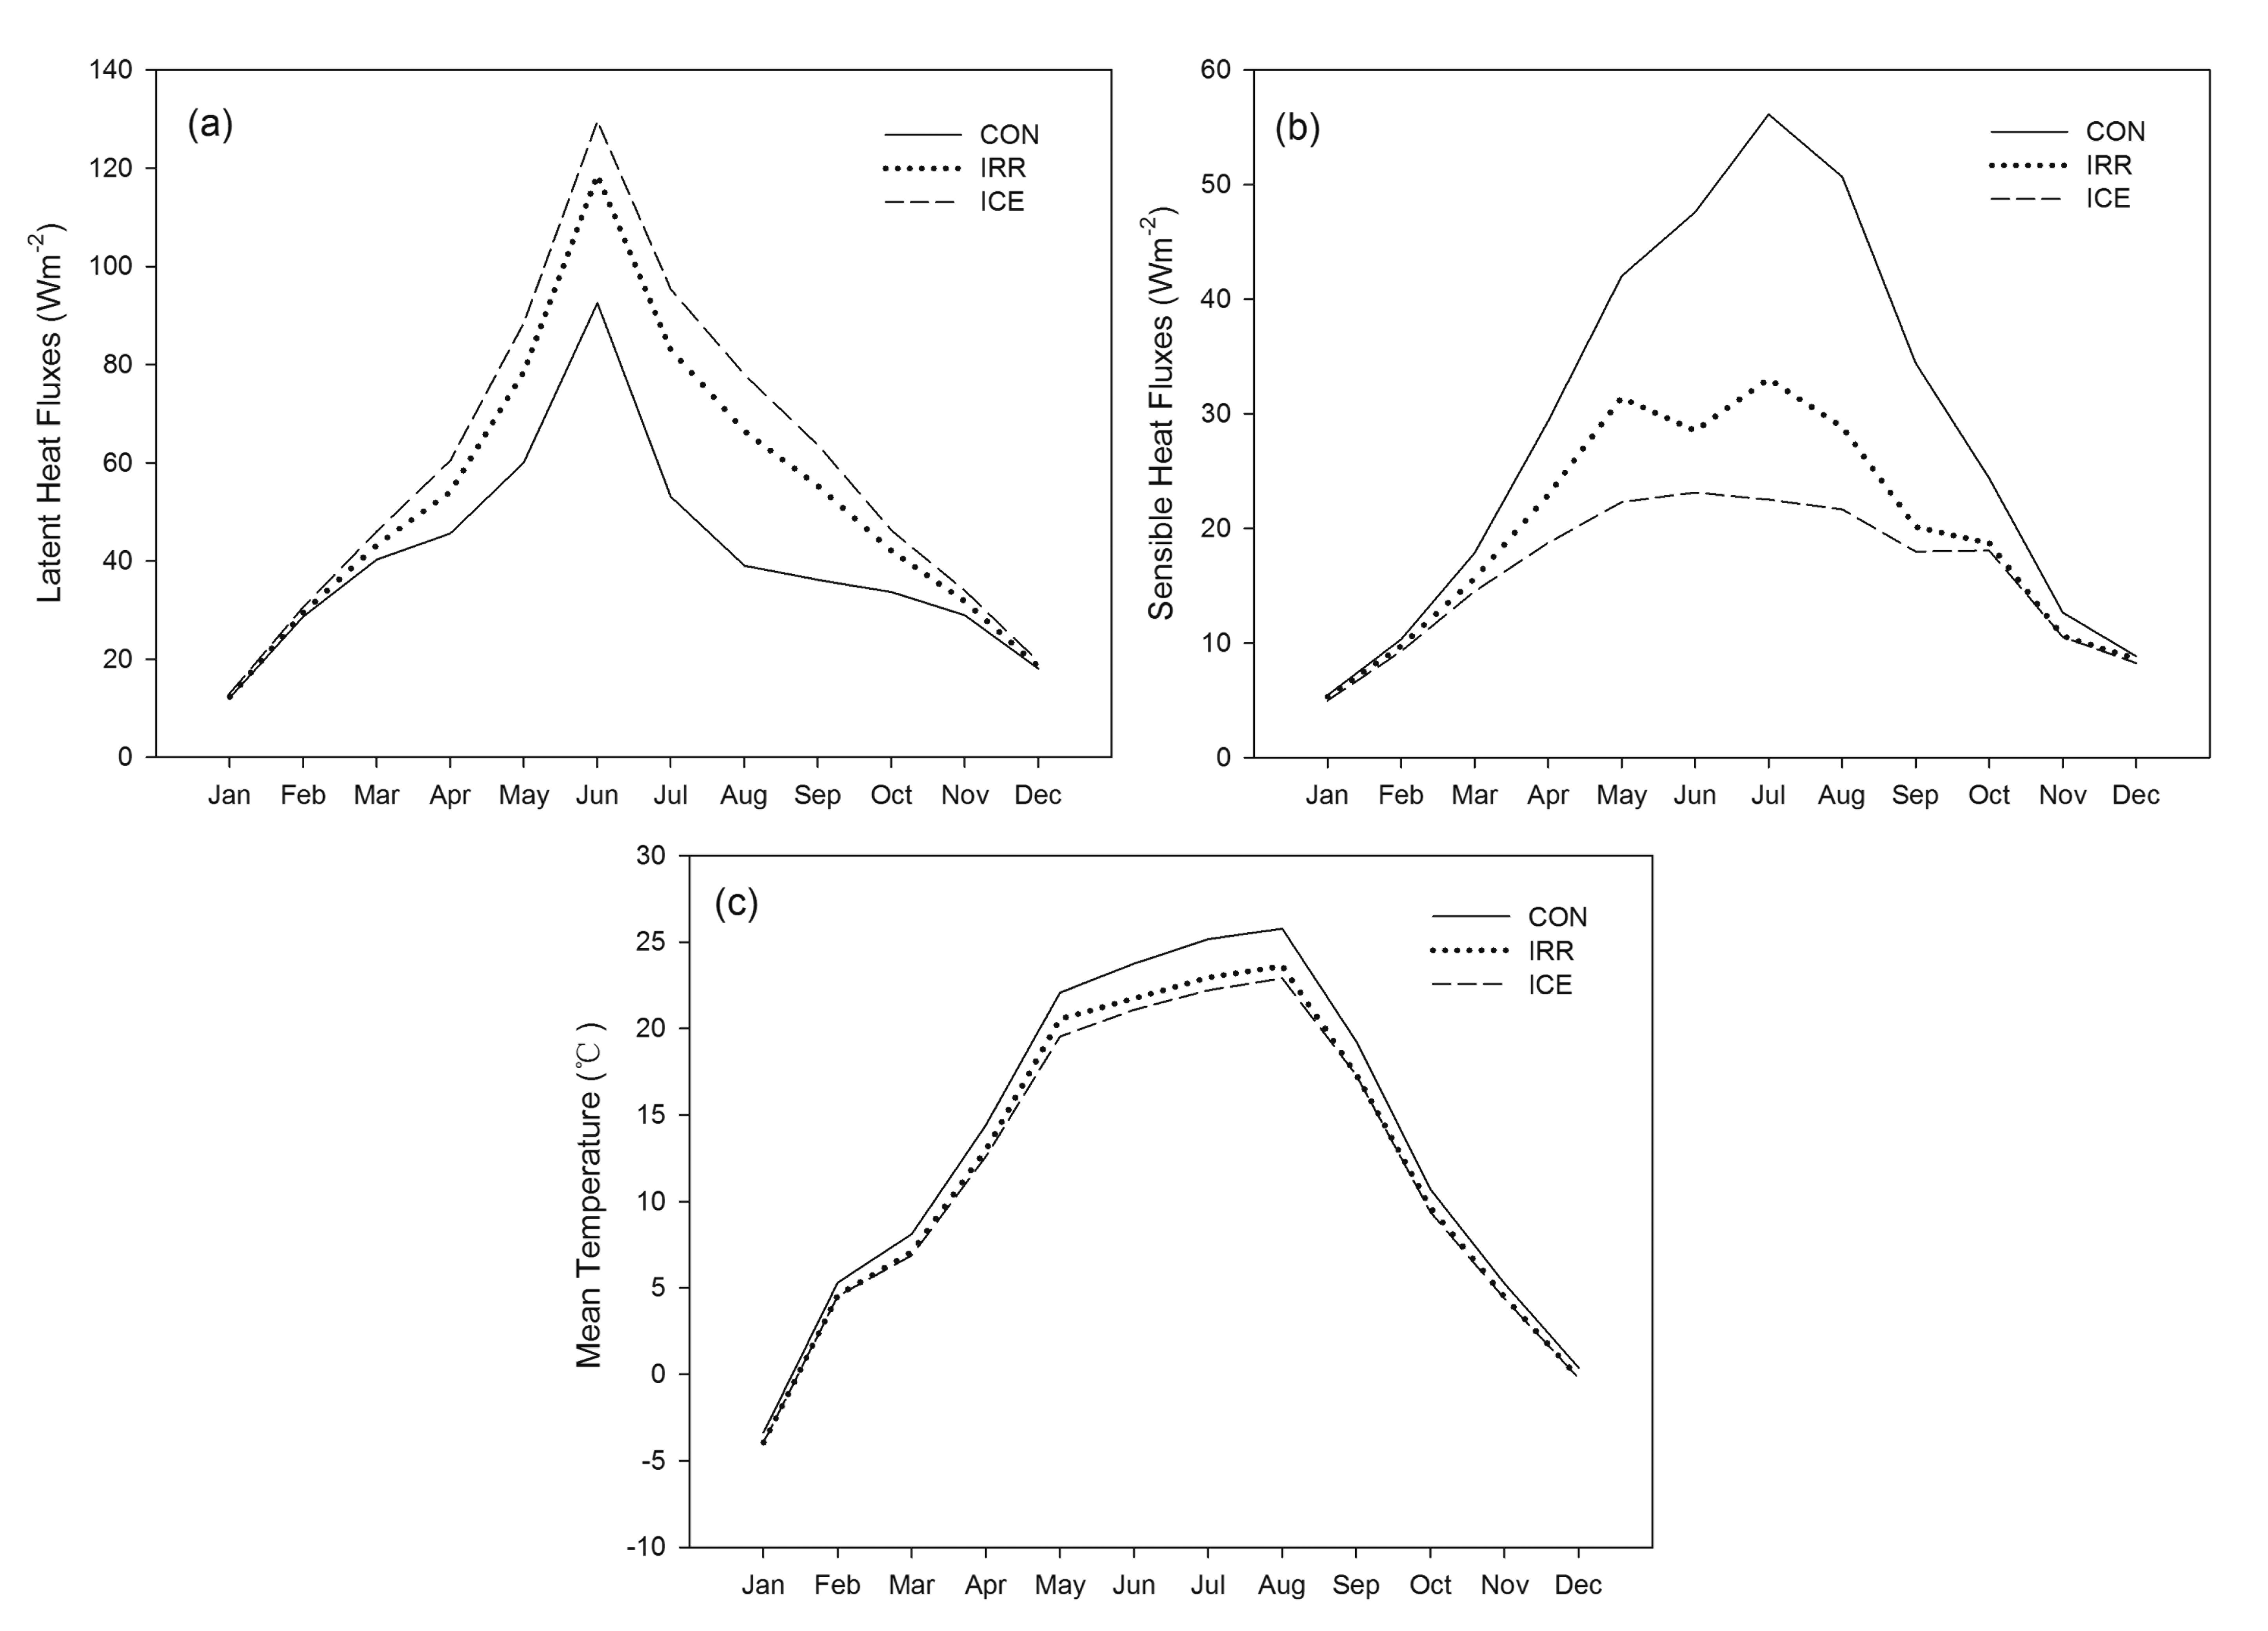
Substantial seasonal variation exists in terms of the magnitude of change in surface energy budgets (Tables 1 and 2, and Figure 5). The increases in latent heat fluxes due to irrigation peak during the summer in both IRR and ICE. From CON to IRR, irrigated land conversion increases latent heat fluxes by 27.79 W m−2 for the summer months (June, July and August) and by merely 0.50 W m−2 for the winter months (December, January and February). From CON to ICE, further expansion of irrigated land leads to an increase in latent heat fluxes of 39.41 W m−2 in the summer and only 1.47 W m−2 in the winter. In typical semi-arid regions of northern China, as water vapor released into the atmosphere from the water-stressed landscape is limited, surface net radiation is mainly partitioned into sensible heat fluxes. However, irrigation and increased soil moisture can introduce significant latent heat fluxes through surface evaporation and transpiration. Both of these two processes usually peak during the summer, when temperature is relatively high and crop growth peaks. That basically explains why the effect of irrigation on surface energy budgets is much stronger in the summer than winter. As expected, there is also significant seasonal difference associated with the change in evapotranspiration and the pattern of this difference agrees with the seasonality of the change in energy fluxes. Similarly, the largest increases of evapotranspiration occur during the summer, with an average increase of 0.95 mm/day for IRR and 1.35 mm/day for ICE, while evapotranspiration increases are small during the winter.
5.2. Effects of Irrigation on Near-Surface Temperature
There are significant changes in near-surface temperature due to irrigation (Figure 6). Converting from CON to IRR, the annual mean temperature of our study area is 1.3 °C lower on average, when a considerable proportion of dryland is converted to irrigated cropland. The irrigation cooling effect is the most significant for areas where irrigated cropland heavily concentrates. Particularly, parts of the middle section of the model domain, including portions of the central and eastern parts of Gansu province, portions of the southern Ningxia province, portions of the central Shaanxi province, are cooled by 5 °C averaged over the year. Much of the irrigated areas in the north and northeast section of the model domain is cooled by 3 °C. On the other hand, most desert and grassland areas in the north section of the model domain experience little temperature change. On average, the decrease in annual mean temperature is eight times greater over irrigated areas than over non-irrigated areas. The cooling effect becomes more significant with the further expansion of irrigated land to all cultivated cropland. The conversion from CON to ICE decreases the annual mean temperature of our study area by 1.7 °C. Expansion of irrigated land in the central parts of Shaanxi and Shanxi provinces suppresses the local annual mean temperature by 4–5 °C. Many existing irrigated areas in IRR show a further reduction of annual mean temperature in ICE. Our modeled decreases in near-surface temperature are accompanied by large increases in evapotranspiration and a shift of energy partitioning towards latent heat fluxes. Comparisons between CON and IRR, and between CON and ICE demonstrate that generally areas experiencing significant cooling is consistent with areas that have large increases in latent heat fluxes.
There are two mechanisms that could explain the surface cooling effect associated with irrigation. Irrigation increases the latent heat fluxes and decreases the sensible heat fluxes, thereby leading to a direct evaporative cooling of the surface. This is the dominant mechanism that contributes to the cooling effect of irrigation, as suggested by our modeled results about the changes in heat fluxes and near-surface temperature across different land cover scenarios. Furthermore, other factors can strengthen this cooling effect. Increased water vapor in the atmosphere causes an increase in cloud cover, which in turn can result in a greater fraction of reflected solar radiation and a decrease in total downwelling radiation. This non-local mechanism of irrigation is usually called the indirect cooling effect of irrigation [8]. Compared to CON, annual mean downwelling radiation of our study area decreases by 3.97 W m−2 and 5.27 W m−2 in IRR and ICE, respectively. Very likely this is due to enhanced cloud cover resulting from additional water vapor introduced from irrigation. Clouds can affect the energy distribution in the atmosphere through two mechanisms. Lower-level clouds cool the surface by reflecting solar radiation while upper-level clouds warm the atmosphere by partially capturing emitted thermal radiation [49]. Based on this, it is likely that the increased cloud cover due to irrigation would be lower-level cloud cover. In addition, our modeling results show that the irrigation cooling effect is not restricted to the near-surface atmosphere associated with irrigated areas, but spread to adjacent non-irrigated areas. For example, from CON to ICE, in the central and eastern parts of Gansu province, and the central Shaanxi province, even non-irrigated grid cells undergo various degrees of cooling, although the magnitude of this cooling is smaller compared to that of the nearby irrigated grid cells. This indicates that non-local processes such as enhanced cloud cover are probably also important in determining regional surface temperature.
Differences in monthly mean surface temperature for the three land cover scenarios reveal that the impact of irrigation on regional temperature vary substantially across seasons. The cooling effect of irrigation is much stronger in the summer than winter. For instance, from CON to ICE, the largest cooling effect occurs in July, with a decrease in mean surface temperature of 3.0 °C, while the smallest cooling effect occurs in January, with a decrease in mean surface temperature of 0.6 °C. This seasonal pattern of the cooling effect is consistent with the seasonality of the changes in evapotranspiration and heat fluxes due to irrigation. This is expected because our results have shown that the dominant cooling effect, the evaporative cooling, reaches its maximum during the summer growing season. In addition, irrigation exerts a stronger cooling effect during the day than night. With the expansion of irrigated cropland in both IRR and ICE, the annual average change in daily maximum temperature is much greater than daily minimum temperature, leading to a decrease in the diurnal temperature range. For example, from CON to IRR, the annually-averaged maximum temperature decreases by 1.9 °C while the annually-averaged minimum temperature decreases by 0.5 °C. This regional result confirms to the previous finding of Sack et al. [8] on effects of global irrigation that irrigation mostly affects daytime climate. Since both of the two cooling mechanisms—the evaporative cooling and increased reflected solar radiation due to more cloud cover—tend to peak during the day, the irrigation cooling effect is mainly reflected by a substantial decrease in daily maximum temperature.
Theoretically lower albedo of irrigated soil may also affect the surface energy balance and regional climate. However, comparing among different scenarios, we find that albedo changes only slightly due to irrigation. For example, the average albedo for areas of cultivated cropland decreases by 0.0073 from CON to IRR, by 0.001 from IRR to ICE. This magnitude of change in albedo due to irrigation is much smaller relative to that associated with the land conversion between natural vegetation (such as forest and grassland) and cropland. Field measurements have also verified that the differences between irrigated and non-irrigated albedos in our study region are small [50]. This indicates that in our case the change in net radiation due to lower albedo of irrigated land accounts for a minimal portion of the change in energy balance and therefore plays a less important role in regional climate. Our finding for this particular region is consistent with the global-scale experimental study of Lobell et al. [9], which shows that the global temperature changes were highly correlated with changes in net surface solar radiation, but not with changes in surface albedo.
Our simulated effect of irrigation on the latent heat fluxes in the inland irrigation area of northern China is smaller than estimates in regional studies such as Kuepper et al. [12], in which irrigation increased the latent heat fluxes in California year round by 70.7 W m−2, but close in the magnitude to estimates about India in Douglas et al. [11], southern India in Biggs et al. [3], and U.S. High Plains in Adegoke et al. [22]. Similarly, although many regional studies have shown significant cooling effects of irrigation, they have disagreed about the magnitude of these effects. Our simulated cooling effect is close in the magnitude to estimates about Nebraska in Mahmood et al. [15], California in Kueppers et al. [12] and India in Douglas et al. [11]. Our simulated irrigation cooling in our study region is also consistent with Lee et al. [25], which found qualitatively similar, but smaller temperature decreases over Asia due to irrigation. Differences in the magnitude of the effects of irrigation between these studies can be explained by differences in how irrigation is modeled, the selection and setup of the atmospheric model, the scale of the study region, and other regional heterogeneities.
The design of our WRF model has some limitations. As different crops have distinct irrigation water requirements and timing of irrigation, ideally there could be a crop model that deals with the irrigation status of different crop types. This requires spatially explicit information about crop-type distributions and crop-specific information about agricultural management. Given the data-sparse environment, those data are not available for our study region. Using an average land cover in an irrigation simulation scheme could cause over- or under-estimated irrigation water input [51]. Development of high-resolution land use data about crop types and incorporation of a crop model in the irrigation scheme could be a direction of future work for researchers who intend to explore climatic effects of irrigation.
6. Conclusions
Population growth and westernization of dietary patterns have increased the demand for food, resulting in intensification of agricultural practices in many regions around the world [52]. Expansion of irrigated agriculture has the potential to alter regional to global climate significantly. In this paper, we investigate the impacts of irrigation on the heat fluxes and near-surface temperature in the future for a specific region. We focus our study on an inland irrigation area of northern China, an area in the developing world with a long history of irrigated agriculture and high ecological vulnerability. Based on the modeling results of the WRF system, we examine the changes in heat fluxes and near-surface temperature among three land cover scenarios: the CON, the IRR, and the ICE. Our results indicate that the surface energy budgets and temperature are sensitive to changes in the extent and spatial pattern of irrigated land. Conversion to irrigated agriculture at the contemporary scale (as in IRR) leads to an increase in annual mean latent heat fluxes of 12.10 W m−2, a decrease in annual mean sensible heat fluxes of 8.85 W m−2, and a decrease in annual mean temperature of 1.3 °C across the study region. Further expansion of irrigated land to all cultivated cropland (as in ICE) increases annual mean latent heat fluxes by 18.08 W m−2, decreases annual mean sensible heat fluxes by 12.31 W m−2, and decreases annual mean temperature by 1.7 °C. The cooling effects of irrigation tend to be greatest for areas where irrigated cropland heavily concentrates, and are much stronger in the summer growing season than winter. The seasonality of the cooling effect is consistent with the seasonality of the changes in evapotranspiration and heat fluxes due to irrigation. In addition, we identify that irrigation exhibits a greater cooling effect during the day than night, leading to a decrease in the diurnal temperature range. While direct evaporative cooling plays a dominant role, indirect non-local processes such as enhanced cloud cover are probably also important in causing the cooling of the surface.
Our modeled effects of irrigation show that changes in land use management such as irrigation can be an important component of climate change. Several studies have shown that the regional climate of northern China is becoming warmer and drier and this trend is likely to continue into the future [53,54]. However, those projections do not account for the climate impacts from land cover and land management change. Regional climate forcings including irrigation expansion can introduce a countervailing cooling effect, weakening the projections of future regional warming from greenhouse gases. Our study has simulated the scenario of expansion of irrigated area, which is likely to take place due to population growth and economic development. In other circumstances, irrigated area may also decline due to lack of sufficient water supply or conversion of irrigated agriculture to urban land [55,56]. It is expected that these irrigation changes can modify future regional climate and need to be considered together with greenhouse forcing in climate change assessments.
Acknowledgments
This research was financially supported by the major research plan of the National Natural Science Foundation of China (Grant No. 91325302), the National Natural Science Funds of China for Distinguished Young Scholar (Grant No. 71225005), and National Key Programme for Developing Basic Science in China (Grant No. 2010CB950900).
Conflicts of Interest
The authors declare no conflict of interest.
References
- Intergovernmental Panel on Climate Change (IPCC). Climate Change 2001: Impacts, Adaptation, and Vulnerability; Contribution of Working Group II to the Third Assessment Report of the Intergovernmental Panel on Climate Change; McCarthy, J.J., Canziani, O.F., Leary, N.A., Dokken, D.J., White, K.S., Eds.; Cambridge University Press: New York, NY, USA, 2001; p. 1032. [Google Scholar]
- Sahu, N.; Behera, S.K.; Yamashiki, Y.; Takara, K.; Yamagata, T. IOD and ENSO impacts on the extreme stream-flows of Citarum river in Indonesia. Clim. Dyn. 2012, 39, 1673–1680. [Google Scholar]
- Biggs, T.W.; Scott, C.A.; Gaur, A.; Venot, J.P.; Chase, T.; Lee, E. Impacts of irrigation and anthropogenic aerosols on the water balance, heat fluxes, and surface temperature in a river basin. Water Resour. Res. 2008, 44. [Google Scholar] [CrossRef]
- Cruz, F.A.; Ortega-Espaldon, M.V.; Duma, J.C. Rural-urban dependence on wood energy in a selected area in Laguna province, Philippines: A rapid rural appraisal. Wood Fuel Flows Rapid Apprais. Four Asian Ctries 1991, 26, 63–130. [Google Scholar]
- Defries, R.S.; Bounoua, L.; Collatz, G.J. Human modification of the landscape and surface climate in the next fifty years. Glob. Chang. Biol. 2002, 8, 438–458. [Google Scholar]
- Feddema, J.J.; Oleson, K.W.; Bonan, G.B.; Mearns, L.O.; Buja, L.E.; Meehl, G.A.; Washington, W.M. The importance of land-cover change in simulating future climates. Science 2005, 310, 1674–1678. [Google Scholar]
- Singh, R.B. Environmental consequences of agricultural development: A case study from the Green Revolution state of Haryana, India. Agric. Ecosyst. Environ. 2000, 82, 97–103. [Google Scholar]
- Sacks, W.J.; Cook, B.I.; Buenning, N.; Levis, S.; Helkowski, J.H. Effects of global irrigation on the near-surface climate. Clim. Dyn. 2009, 33, 159–175. [Google Scholar]
- Lobell, D.B.; Bala, G.; Duffy, P.B. Biogeophysical impacts of cropland management changes on climate. Geophys. Res. Lett. 2006, 33. [Google Scholar] [CrossRef]
- Shiklomanov, I.A. Appraisal and assessment of world water resources. Water Int. 2000, 25, 11–32. [Google Scholar]
- Douglas, E.M.; Beltrán-Przekurat, A.; Niyogi, D.; Pielke, R.A., Sr.; Vörösmarty, C.J. The impact of agricultural intensification and irrigation on land–atmosphere interactions and Indian monsoon precipitation—A mesoscale modeling perspective. Glob. Planet. Chang. 2009, 67, 117–128. [Google Scholar]
- Kueppers, L.M.; Snyder, M.A.; Sloan, L.C. Irrigation cooling effect: Regional climate forcing by land-use change. Geophys. Res. Lett. 2007, 34. [Google Scholar] [CrossRef]
- Puma, M.J.; Cook, B.I. Effects of irrigation on global climate during the 20th century. J. Geophys. Res. Atmos. (1984–2012) 2010, 115. [Google Scholar] [CrossRef]
- Pielke, R.A.; Marland, G.; Betts, R.A.; Chase, T.N.; Eastman, J.L.; Niles, J.O.; Running, S.W. The influence of land-use change and landscape dynamics on the climate system: Relevance to climate-change policy beyond the radiative effect of greenhouse gases. Philos. Trans. R. Soc. Lond. Ser. A Math. Phys. Eng. Sci. 2002, 360, 1705–1719. [Google Scholar]
- Mahmood, R.; Foster, S.A.; Keeling, T.; Hubbard, K.G.; Carlson, C.; Leeper, R. Impacts of irrigation on 20th century temperature in the northern Great Plains. Glob. Planet. Chang. 2006, 54, 1–18. [Google Scholar]
- Bonfils, C.; Lobell, D. Empirical evidence for a recent slowdown in irrigation-induced cooling. Proc. Natl. Acad. Sci. USA 2007, 104, 13582–13587. [Google Scholar]
- Lee, E.; Chase, T.N.; Rajagopalan, B.; Barry, R.G.; Biggs, T.W.; Lawrence, P.J. Effects of irrigation and vegetation activity on early Indian summer monsoon variability. Int. J. Climatol. 2009, 29, 573–581. [Google Scholar]
- Haddeland, I.; Lettenmaier, D.P.; Skaugen, T. Effects of irrigation on the water and energy balances of the Colorado and Mekong river basins. J. Hydrol. 2006, 324, 210–223. [Google Scholar]
- Kueppers, L.M.; Snyder, M.A.; Sloan, L.C.; Cayan, D.; Jin, J.; Kanamaru, H.; Weare, B. Seasonal temperature responses to land-use change in the western United States. Glob. Planet. Chang. 2008, 60, 250–264. [Google Scholar]
- Lobell, D.; Bala, G.; Mirin, A.; Phillips, T.; Maxwell, R.; Rotman, D. Regional differences in the influence of irrigation on climate. J. Clim. 2009, 22, 2248–2255. [Google Scholar]
- Saeed, F.; Hagemann, S.; Jacob, D. Impact of irrigation on the South Asian summer monsoon. Geophys. Res. Lett. 2009, 36. [Google Scholar] [CrossRef]
- Adegoke, J.O.; Pielke, R.A., Sr.; Eastman, J.; Mahmood, R.; Hubbard, K.G. Impact of irrigation on midsummer surface fluxes and temperature under dry synoptic conditions: A regional atmospheric model study of the US High Plains. Mon. Weather Rev. 2003, 131, 556–564. [Google Scholar]
- Chang, H.I.; Kumar, A.; Niyogi, D.; Mohanty, U.C.; Chen, F.; Dudhia, J. The role of land surface processes on the mesoscale simulation of the July 26, 2005 heavy rain event over Mumbai, India. Glob. Planet. Chang. 2009, 67, 87–103. [Google Scholar]
- Debele, B.; Srinivasan, R.; Gosain, A.K. Comparison of process-based and temperature-index snowmelt modeling in SWAT. Water Resour. Manag. 2010, 24, 1065–1088. [Google Scholar]
- Lee, E.; Sacks, W.J.; Chase, T.N.; Foley, J.A. Simulated impacts of irrigation on the atmospheric circulation over Asia. J. Geophys. Res. Atmos. (1984–2012) 2011, 116. [Google Scholar] [CrossRef]
- Zhang, H.; Wang, X.; You, M.; Liu, C. Water-yield relations and water-use efficiency of winter wheat in the North China Plain. Irrig. Sci. 1999, 19, 37–45. [Google Scholar]
- Yang, H.; Zhang, X.; Zehnder, A.J. Water scarcity, pricing mechanism and institutional reform in northern China irrigated agriculture. Agric. Water Manag. 2003, 61, 143–161. [Google Scholar]
- Deng, X.P.; Shan, L.; Zhang, H.; Turner, N.C. Improving agricultural water use efficiency in arid and semiarid areas of China. Agric. Water Manag. 2006, 80, 23–40. [Google Scholar]
- Fu, B.; Chen, L. Agricultural landscape spatial pattern analysis in the semi-arid hill area of the Loess Plateau, China. J. Arid Environ. 2000, 44, 291–303. [Google Scholar]
- Zhang, X.; Zhang, L.; Zhao, J.; Rustomji, P.; Hairsine, P. Responses of streamflow to changes in climate and land use/cover in the Loess Plateau, China. Water Resour. Res. 2008, 44. [Google Scholar] [CrossRef]
- Xu, J. River sedimentation and channel adjustment of the lower Yellow River as influenced by low discharges and seasonal channel dry-ups. Geomorphology 2002, 43, 151–164. [Google Scholar]
- Zhang, X.C.; Liu, W.Z. Simulating potential response of hydrology, soil erosion, and crop productivity to climate change in Changwu tableland region on the Loess Plateau of China. Agric. For. Meteorol. 2005, 131, 127–142. [Google Scholar]
- Chen, L.; Wang, J.; Fu, B.; Qiu, Y. Land-use change in a small catchment of northern Loess Plateau, China. Agric. Ecosyst. Environ. 2001, 86, 163–172. [Google Scholar]
- Liu, J.; Liu, M.; Deng, X.; Zhuang, D. The land use and land cover change database and its relative studies in China. J. Geogr. Sci. 2002, 12, 275–282. [Google Scholar]
- Liu, J.; Liu, M.; Zhuang, D.; Zhang, Z.; Deng, X. Study on spatial pattern of land-use change in China during 1995–2000. Sci. China Ser. D Earth Sci. 2003, 46, 373–384. [Google Scholar]
- Wu, F.; Zhan, J.; Yan, H.; Shi, C.; Huang, J. Land cover mapping based on multisource spatial data mining approach for climate simulation: A case study in the farming-pastoral ecotone of North China. Adv. Meteorol. 2013, 2013. [Google Scholar] [CrossRef]
- Moss, R.H.; Edmonds, J.A.; Hibbard, K.A.; Manning, M.R.; Rose, S.K.; van Vuuren, D.P.; Wilbanks, T.J. The next generation of scenarios for climate change research and assessment. Nature 2010, 463, 747–756. [Google Scholar]
- Hijioka, Y.; Matsuoka, Y.; Nishimoto, H.; Masui, T.; Kainuma, M. Global GHG emission scenarios under GHG concentration stabilization targets. J. Glob. Environ. Eng. 2008, 13, 97–108. [Google Scholar]
- Michalakes, J.; Dudhia, J.; Gill, D.; Henderson, T.; Klemp, J.; Skamarock, W.; Wang, W. The weather research and forecast model: Software architecture and performance. Proceedings of the 11th ECMWF Workshop on the Use of High Performance Computing in Meteorology, Reading, UK, 25–29 October 2004; Volume 25, p. 29.
- Kumar, A.; Dudhia, J.; Rotunno, R.; Niyogi, D.; Mohanty, U.C. Analysis of the 26 July 2005 heavy rain event over Mumbai, India using the Weather Research and Forecasting (WRF) model. Q. J. R. Meteorol. Soc. 2008, 134, 1897–1910. [Google Scholar]
- Mölders, N. Suitability of the Weather Research and Forecasting (WRF) model to predict the June 2005 fire weather for Interior Alaska. Weather Forecast 2008, 23, 953–973. [Google Scholar]
- Wicker, L.J.; Skamarock, W.C. Time-splitting methods for elastic models using forward time schemes. Mon. Weather Rev. 2002, 130, 2088–2097. [Google Scholar]
- Hong, S.Y.; Dudhia, J.; Chen, S.H. A revised approach to ice microphysical processes for the bulk parameterization of clouds and precipitation. Mon. Weather Rev. 2004, 132, 103–120. [Google Scholar]
- Grell, G.A.; Dévényi, D. A generalized approach to parameterizing convection combining ensemble and data assimilation techniques. Geophys. Res. Lett. 2002, 29. [Google Scholar] [CrossRef]
- Mlawer, E.J.; Taubman, S.J.; Brown, P.D.; Iacono, M.J.; Clough, S.A. Radiative transfer for inhomogeneous atmospheres: RRTM, a validated correlated-k model for the longwave. J. Geophys. Res. Atmos. (1984–2012) 1997, 102, 16663–16682. [Google Scholar]
- Dudhia, J. Numerical study of convection observed during the winter monsoon experiment using a mesoscale two-dimensional model. J. Atmos. Sci. 1989, 46, 3077–3107. [Google Scholar]
- Mellor, G.L.; Yamada, T. Development of a turbulence closure model for geophysical fluid problems. Rev. Geophys. 1982, 20, 851–875. [Google Scholar]
- Chen, F.; Dudhia, J. Coupling an advanced land surface-hydrology model with the Penn State-NCAR MM5 modeling system. Part I: Model implementation and sensitivity. Mon. Weather Rev. 2001, 129, 569–585. [Google Scholar]
- Stubenrauch, C.J.; Briand, V.; Rossow, W.B. The role of clear-sky identification in the study of cloud radiative effects: Combined analysis from ISCCP and the scanner of radiation budget. J. Appl. Meteorol. 2002, 41, 396–412. [Google Scholar]
- Guan, X.; Huang, J.; Guo, N.; Bi, J.; Wang, G. Variability of soil moisture and its relationship with surface albedo and soil thermal parameters over the Loess Plateau. Adv. Atmos. Sci. 2009, 26, 692–700. [Google Scholar]
- Ozdogan, M.; Rodell, M.; Beaudoing, H.K.; Toll, D.L. Simulating the effects of irrigation over the United States in a land surface model based on satellite-derived agricultural data. J. Hydrometeorol 2010, 11, 171–184. [Google Scholar]
- Jiang, L.; Deng, X.; Seto, K.C. The impact of urban expansion on agricultural land use intensity in China. Land Use Policy 2013, 35, 33–39. [Google Scholar]
- Wang, S.R.; Zheng, S.H.; Cheng, L. Studies on impacts of climate change on water cycle and water resources in northwest China. Clim. Environ. Res. 2003, 8, 44–51. [Google Scholar]
- Zhao, Z.C.; Ding, Y.H.; Xu, Y.; Zhang, J. Detection and prediction of climate change for the 20th and 21st century due to human activity in northwest China. Clim. Environ. Res. 2003, 8, 27–34. [Google Scholar]
- Güneralp, B.; Seto, K.C. Environmental impacts of urban growth from an integrated dynamic perspective: A case study of Shenzhen, South China. Glob. Environ. Chang. 2008, 18, 720–735. [Google Scholar]
- Seto, K.C.; Reenberg, A.; Boone, C.G.; Fragkias, M.; Haase, D.; Langanke, T.; Simon, D. Urban land teleconnections and sustainability. Proc. Natl. Acad. Sci. USA 2012, 109, 7687–7692. [Google Scholar]


| Month | Tmean (°C) | Tmax (°C) | Tmin (°C) | ET (mm/day) | LH (W m−2) | SH (W m−2) | DR (W m−2) |
|---|---|---|---|---|---|---|---|
| January | −0.58 | −1.10 | −0.01 | 0.01 | 0.20 | −0.12 | −0.23 |
| February | −0.75 | −1.27 | −0.09 | 0.03 | 0.85 | −0.57 | −0.78 |
| March | −1.04 | −1.53 | −0.17 | 0.10 | 2.95 | −2.21 | −1.83 |
| April | −1.43 | −1.89 | −0.46 | 0.29 | 8.47 | −6.45 | −3.30 |
| May | −1.53 | −1.96 | −0.71 | 0.63 | 18.49 | −10.62 | −5.70 |
| June | −2.02 | −2.56 | −0.98 | 0.89 | 26.06 | −19.07 | −7.46 |
| July | −2.22 | −2.80 | −1.16 | 1.02 | 29.88 | −23.08 | −8.88 |
| August | −2.17 | −2.75 | −1.15 | 0.93 | 27.42 | −21.82 | −8.36 |
| September | −1.92 | −2.47 | −0.85 | 0.65 | 19.16 | −14.28 | −4.99 |
| October | −1.06 | −1.55 | −0.39 | 0.28 | 8.42 | −5.66 | −3.16 |
| November | −0.77 | −1.29 | −0.15 | 0.09 | 2.87 | −2.05 | −1.55 |
| December | −0.59 | −1.12 | −0.03 | 0.01 | 0.45 | −0.23 | −0.36 |
| Year | −1.34 | −1.86 | −0.51 | 0.41 | 12.10 | −8.85 | −3.97 |
Note: Tmean, mean temperature; Tmax, maximum temperature; Tmin, minimum temperature; ET, evapotranspiration; LH, latent heat fluxes; SH, sensible heat fluxes; and DR, downwelling radiation.
| Month | Tmean (°C) | Tmax (°C) | Tmin (°C) | ET (mm/day) | LH (W m−2) | SH (W m−2) | DR (W m−2) |
|---|---|---|---|---|---|---|---|
| January | −0.57 | −1.24 | −0.09 | 0.03 | 0.91 | −0.45 | −0.40 |
| February | −0.79 | −1.48 | −0.13 | 0.06 | 1.98 | −1.03 | −1.12 |
| March | −1.23 | −1.88 | −0.23 | 0.19 | 5.77 | −3.32 | −2.80 |
| April | −1.82 | −2.42 | −0.55 | 0.51 | 14.90 | −10.63 | −4.44 |
| May | −2.54 | −3.30 | −1.06 | 0.97 | 28.49 | −19.71 | −7.67 |
| June | −2.67 | −3.42 | −1.23 | 1.27 | 37.09 | −24.46 | −10.03 |
| July | −2.96 | −3.77 | −1.45 | 1.44 | 42.23 | −33.61 | −11.94 |
| August | −2.88 | −3.68 | −1.44 | 1.32 | 38.91 | −29.02 | −11.25 |
| September | −1.97 | −2.58 | −0.88 | 0.93 | 27.49 | −16.43 | −6.71 |
| October | −1.32 | −1.97 | −0.45 | 0.42 | 12.59 | −6.31 | −4.25 |
| November | −0.88 | −1.54 | −0.16 | 0.16 | 5.03 | −2.12 | −2.14 |
| December | −0.61 | −1.26 | −0.10 | 0.05 | 1.52 | −0.59 | −0.50 |
| Year | −1.69 | −2.38 | −0.65 | 0.61 | 18.08 | −12.31 | −5.27 |
Note: Tmean, mean temperature; Tmax, maximum temperature; Tmin, minimum temperature; ET, evapotranspiration; LH, latent heat fluxes; SH, sensible heat fluxes; and DR, downwelling radiation.
© 2014 by the authors; licensee MDPI, Basel, Switzerland. This article is an open access article distributed under the terms and conditions of the Creative Commons Attribution license ( http://creativecommons.org/licenses/by/3.0/).
Share and Cite
Jiang, L.; Ma, E.; Deng, X. Impacts of Irrigation on the Heat Fluxes and Near-Surface Temperature in an Inland Irrigation Area of Northern China. Energies 2014, 7, 1300-1317. https://doi.org/10.3390/en7031300
Jiang L, Ma E, Deng X. Impacts of Irrigation on the Heat Fluxes and Near-Surface Temperature in an Inland Irrigation Area of Northern China. Energies. 2014; 7(3):1300-1317. https://doi.org/10.3390/en7031300
Chicago/Turabian StyleJiang, Li, Enjun Ma, and Xiangzheng Deng. 2014. "Impacts of Irrigation on the Heat Fluxes and Near-Surface Temperature in an Inland Irrigation Area of Northern China" Energies 7, no. 3: 1300-1317. https://doi.org/10.3390/en7031300