The Development and Empirical Evaluation of the Korean Smart Distribution Management System


Abstract
: This paper introduces the development and actual test results of the Korean Smart Distribution Management System (KSDMS). The KSDMS has been designed and developed to cope with the lack of interconnection capability of the Dispersed Energy Resource (DER), to provide standardization and compatibility, and to implement automatic processing of service restoration, in the existing Distribution Automation System (DAS) in Korea. First, real-time system analysis and control application programs were developed, to solve the problems of the existing DAS; and the Distribution Management System (DMS) platform was developed, to run the developed application programs. Second, international standard-based communication, platform, and database structures were adopted, for standardization and compatibility. Third, a platform and application program functions were developed to process faults automatically; and a communication device and an intelligent electronic device (IED) were developed to automate fault restoration, through communication between devices. The KSDMS was evaluated by three tests: unit function test, platform and application program integration test, and empirical test. The first two were conducted on both small and large demonstration systems. The empirical test was performed at the Power Testing Center (PTC) in Gochang, and on a real system, at the Korea Electric Power Corporation (KEPCO), on Jeju Island. The test results verified that the KSDMS can actively resolve the problems of the existing DAS.1. Introduction
Recently, the power systems industry has focused on the introduction of the Dispersed Energy Resource (DER), and on the creation of its market. The DER is a smart grid technology that converges information communication and power system technologies. This focus is the result of worldwide attention to environmental pollution, such as CO2 emissions, and the demands of governments, power-related industries and consumers, for the creation of a new market. This smart technology has completely restructured the conventional power system. In other words, the power generated from the consumer side or distribution networks is either consumed by the regional electricity customers, or flows back to the transmission network. This technological change most affects the distribution system connecting the electricity consumers with the power company. Thus, a system that can stably and reliably operate the distribution system needs to be developed.
Traditionally, a distribution system has been regarded as less important than the transmission networks. Most distribution systems have been operated by Supervisory Control and Data Acquisition systems (SCADA). In practice, some of the critical or limited distribution networks (regions or downtowns with a dense population of electricity customers) have been operated by the Distribution Automation System (DAS).
The DAS in Korea, which has been researched since 1993, started operation in 1998. At present, the DAS operates at 190 offices, and 48 metropolitan distribution centers [1]. Recently, the economic feasibility of the DAS [2], information interlinked with the power transmission system [3], and information standardization of simulators for operator training [4] have been researched. Internationally, the DAS has been actively researched since the late 1980s, with the rise of personal computers. In addition to the researches on platform structures and communication networks [5–8], researches on the configuration of devices and communications for the DAS, and the operation of switches to reduce loss, have been conducted [9,10].
Unlike the DAS, which performs SCADA functions, such as field status measurements and fault removal, the Distribution Management System (DMS) is a decision-making support system that can optimize system operation. Many application programs have been used for the DMS. The structure of the DMS is similar to that of the Energy Management System (EMS, a combination of distribution SCADA and network analysis/control application). A conceptual study on the DMS was started in the mid-1990s [11–13]. At that time, most studies were on the use of application programs for voltage control and system reconfiguration. Since the 2000s, various detailed application programs have been run on the DMS, because of the increasing trend of DER interconnection [14–23].
Most studies on the DMS were limited to its conceptual structures and individual application programs. Its efficiency was evaluated through simulations of a small-sized distribution system, with tens of buses. However, an actual distribution system is large, so a single DMS for practical application has to deal with several thousands of buses. Therefore, the DMS platform and application programs for real-time operation of such large-size distribution systems need to be developed, and to be empirically evaluated.
This paper summarizes a case study on the development of the next-generation DMS system in Korea. The next-generation DMS system improves on several limitations of the existing DAS system, such as lack of receptivity of DER, lack of standardization and compatibility, and manual processing of faults. It thereby prepares for the optimal operation of the future distribution system. In Section 2, the functions of the existing DAS and it technical problems are summarized. In Section 3, the three main objectives of the next generation DMS system that have been developed for solving the problems of the existing DAS are described. First, an application program, which improves the lack of receptivity of the DER, a platform, and a Database (DB) configuration, over which the application program runs, are explained. Second, an international-standard-based system configuration for securing standardization and compatibility is summarized. Third, a platform, application programs, and communication devices, including field devices for the automation of fault restoration, are briefly presented. In Section 4, summarized results of the unit function test, integration test, and field test are provided. The field test was performed at the Power Testing Center (PTC) in Gochang, and on a real system at the Korea Electric Power Corporation (KEPCO), on Jeju Island.
2. Existing Distribution Automation System and Factor of Changes
Table 1 summarizes the statistics of the distribution systems in Korea [24]. The distribution systems in Korea have been managed and operated by just one power company, KEPCO. As summarized in the table, the distribution systems in Korea are very large, so their operation and management are critically important.
The scope of the distribution systems in Korea begins with the secondary side of the 154/22.9 kV main transformer in a substation. It finishes with the primary side of pole and pad-mounted transformers that supply power to electricity customers (high and low voltages). The operation of a distribution system in Korea is summarized as follows:
- (1)
South Korea, with a population of about 50 million, is 1/5 the total area of Japan. With the industrialization policy of the Korean government, the size of the power facilities of Korea is ranked within the top 10 worldwide. Therefore, the distribution system in Korea has a high proportion of medium and short-distance lines, as in the dense load type (metropolitan and medium-sized cities).
- (2)
Outages are costly, due to the dense population. Thus, the most critical objective of the power company in Korea is to reduce the frequency and durations of outages.
- (3)
A single company, KEPCO, transmits and distributes electricity in Korea, making it relatively easy to apply new technologies to the entire system. Because of the above characteristics of the KEPCO distribution system, the operators of the distribution systems have adopted a distribution automation system at an early time for achieving remote fault recovery, and load transfer, by remote control of switches.
The Total Distribution Automation System (TDAS), which is currently responsible for monitoring and controlling all of the distribution systems in Korea, was developed in 1993, and has been operating since 1998. Currently, the TDAS is installed and operated at over 190 distribution offices, and 40 metropolitan distribution centers. The main functions of the TDAS are monitoring of the distribution lines, removal of fault lines, and recovery of the outage section, other than the fault location. The TDAS consists of all DBs (real time, control, and history) used to operate a system; an operation server that manages data; a Front End Processor (FEP) that transfers the status (analog and digital) obtained by the Remote Terminal Unit (RTU), which is mounted in devices, including switches, to the operation server; and a client PC, by which operators perform automation switch remote control and fault restoration, via the Human Machine Interface (HMI). The characteristics of distribution automation in Korea may be summarized as follows:
- (1)
Many automation switches (switches attached with RTUs, for remote measurement and control) divide a system for fault recovery, and transfer load to the other interconnected distribution lines. Nearly 35% of all the 127,000 line switches are automation switches. These many automation switches are needed to reduce the outage duration, as mentioned earlier (3 min on average, as summarized in Table 1). By adopting automatic switching, the frequency or duration of a sustained interruption has been significantly reduced. On the other hand, as the division and interconnection points have increased competitively, the unit prices of the RTU and measurement instruments have been reduced, and measurement precision has degraded significantly, due to limited budget.
- (2)
Upon the occurrence of a fault in a line, the RTU generates an alarm signal (Fault Indicator (FI)), while a protective device simultaneously removes the fault. The FI is a signal generated when a fault or an overload condition, which is greater than a certain threshold, is detected. Such a generated FI is displayed on a monitor screen. The operator determines whether a fault occurred between a switch at the far end of a load, where the FI signal is generated, and the next switch, knowing that the distribution system is operated as a radial structure. On the basis of this determination, the operator manually separates the fault location remotely, via the switch operation; re-applies a protective device; and applies the outage section, rather than the fault location, to the adjacent interconnected lines, to return power. Then, a maintenance technician is sent to repair the fault.
- (3)
Voltage and current are measured at the installation points of the automation switches, and at other automation facilities (line capacitor, Step Voltage Regulator (SVR), and DER), and transferred to the central device. The synchronization of the measured values can have a deviation of approximately 1 hour. In the case of a measured voltage, its value is very low, and many errors can occur, due to the poor measurement precision of the RTU. Thus, it is currently very difficult for an operator to monitor the voltage status. However, in the case of TDAS, a deviation in the measured voltage value was not a significant problem, because TDAS aims to restore faults. Also, having a radial structure, TDAS can operate with few measurements. In practice, the voltage is managed by measuring it with a measuring device in the field, in winter and summer seasons; while a tap or SVR is installed in a pole transformer, at a location of large voltage drop.
The operational reliability of the TDAS has been threatened by the following recent environmental changes of the distribution system in Korea.
- (1)
Increasing inflow of DERs:
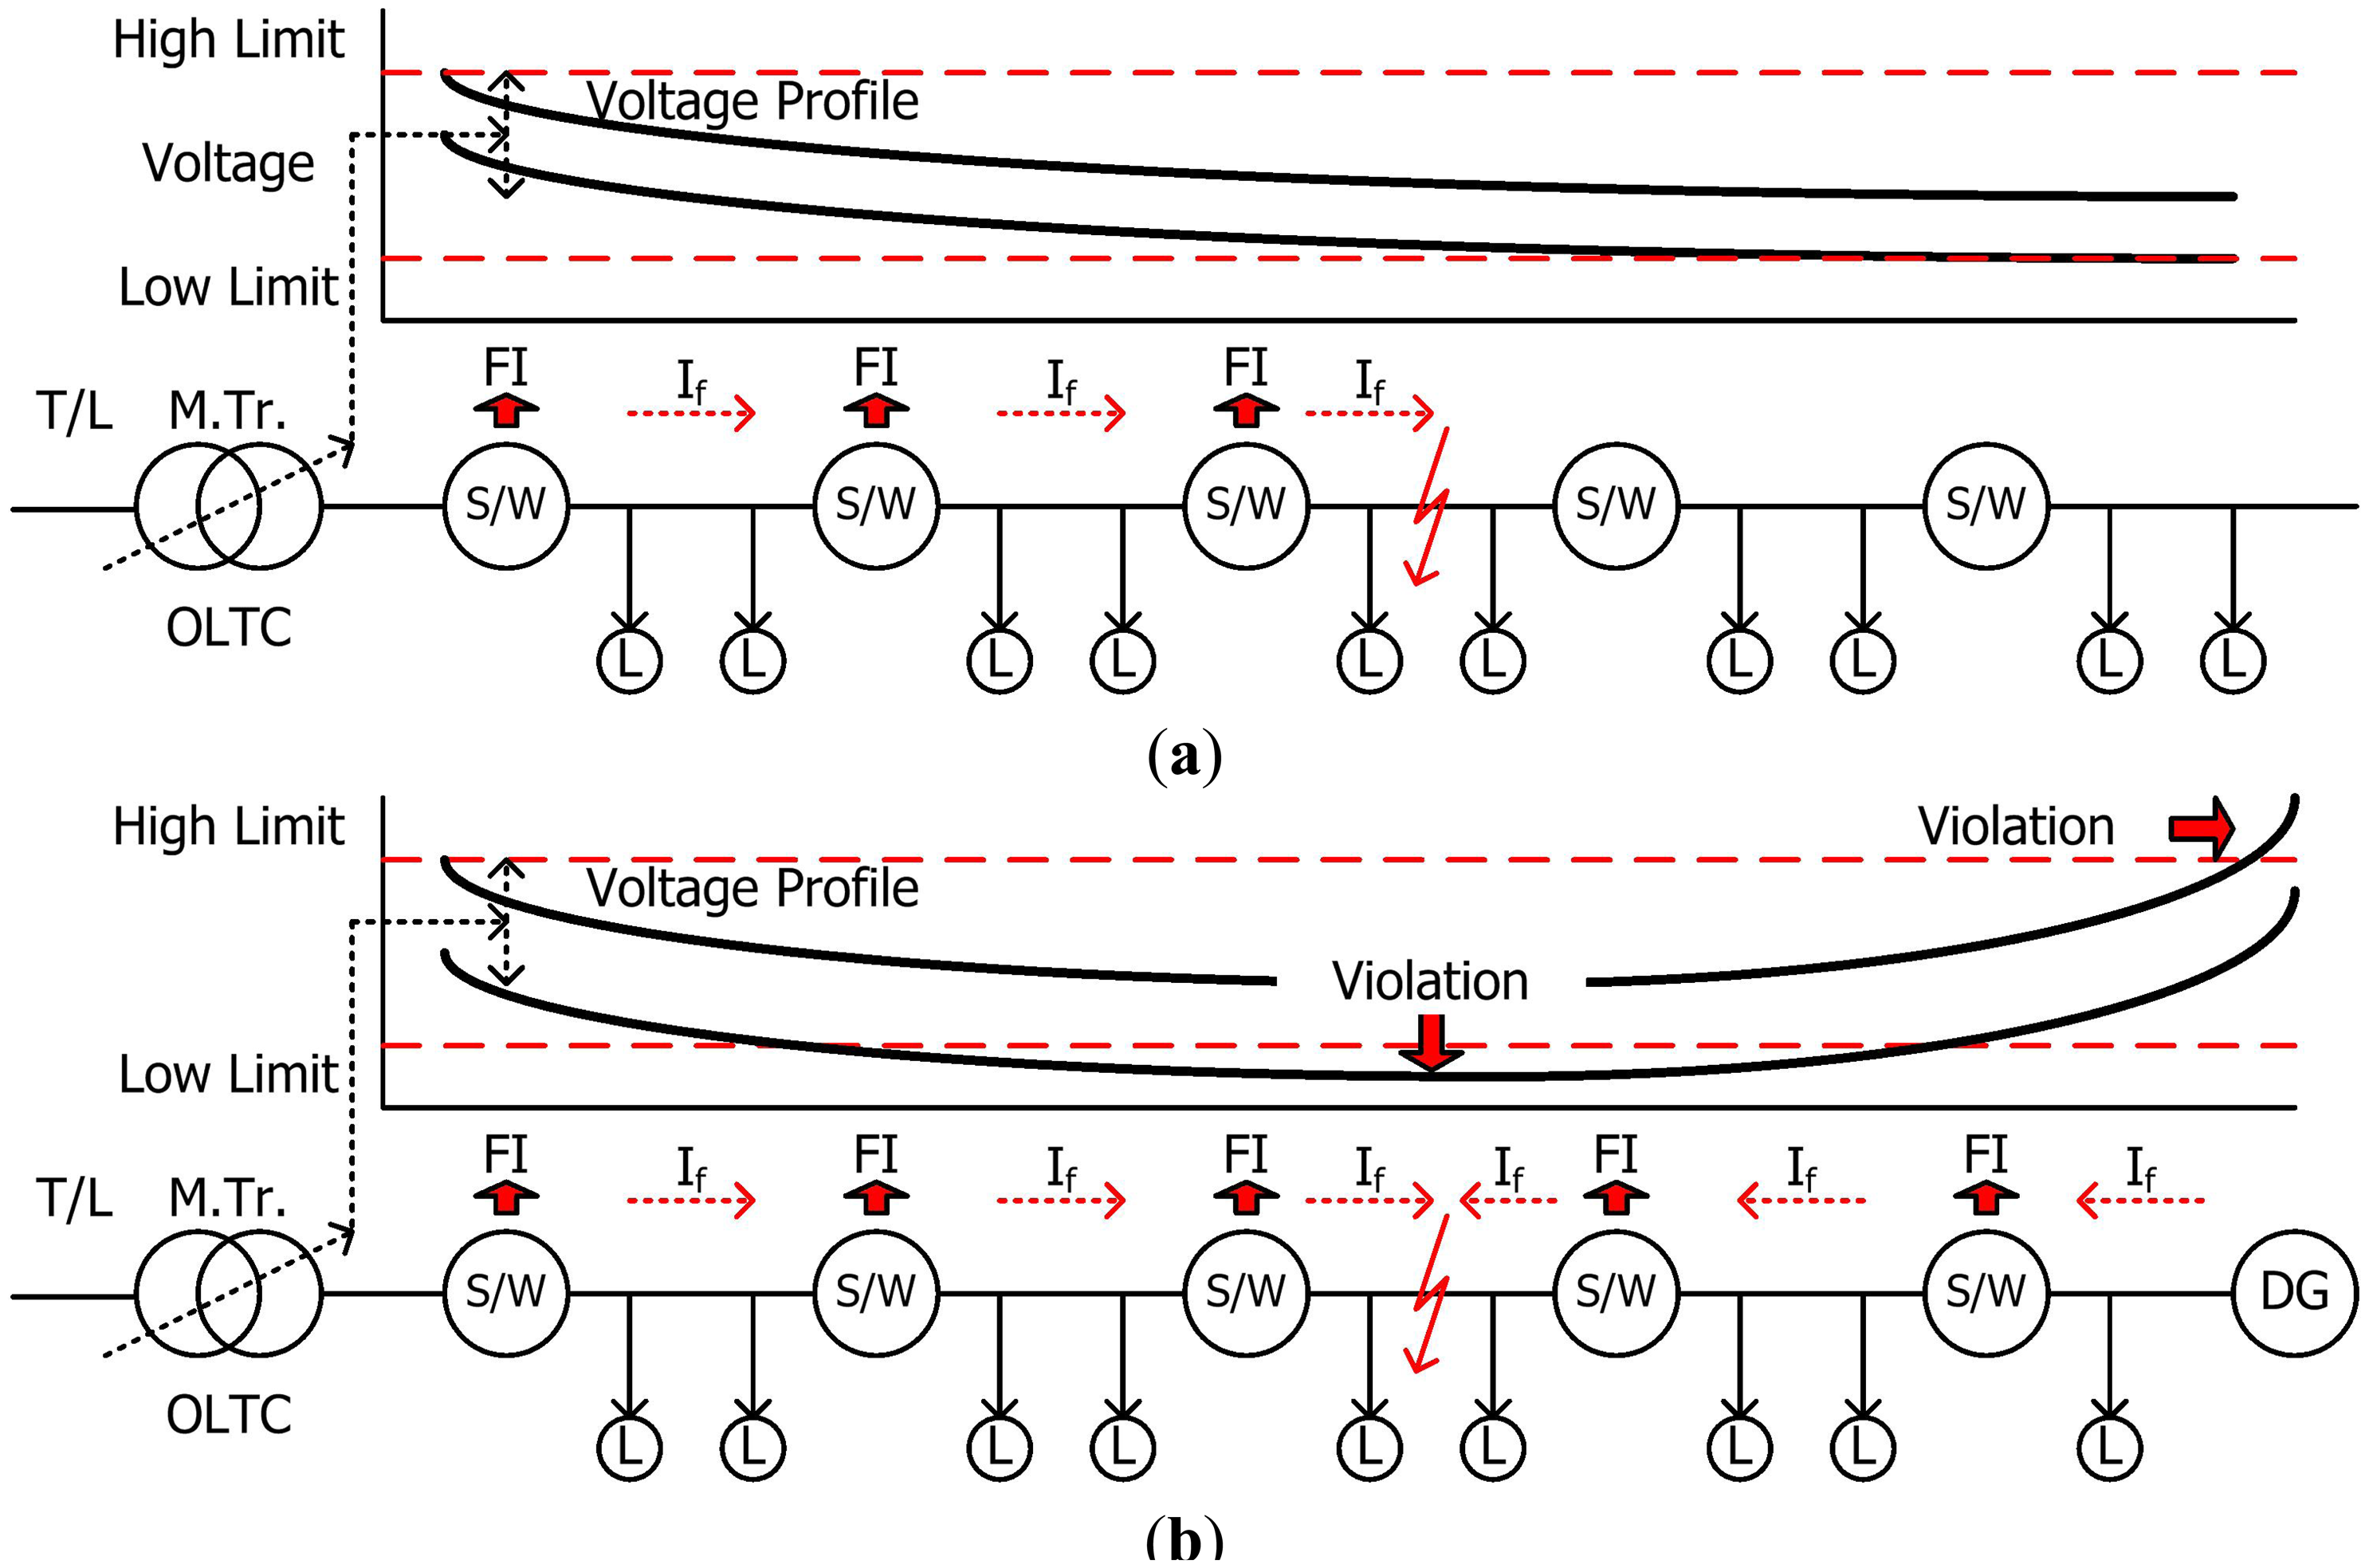
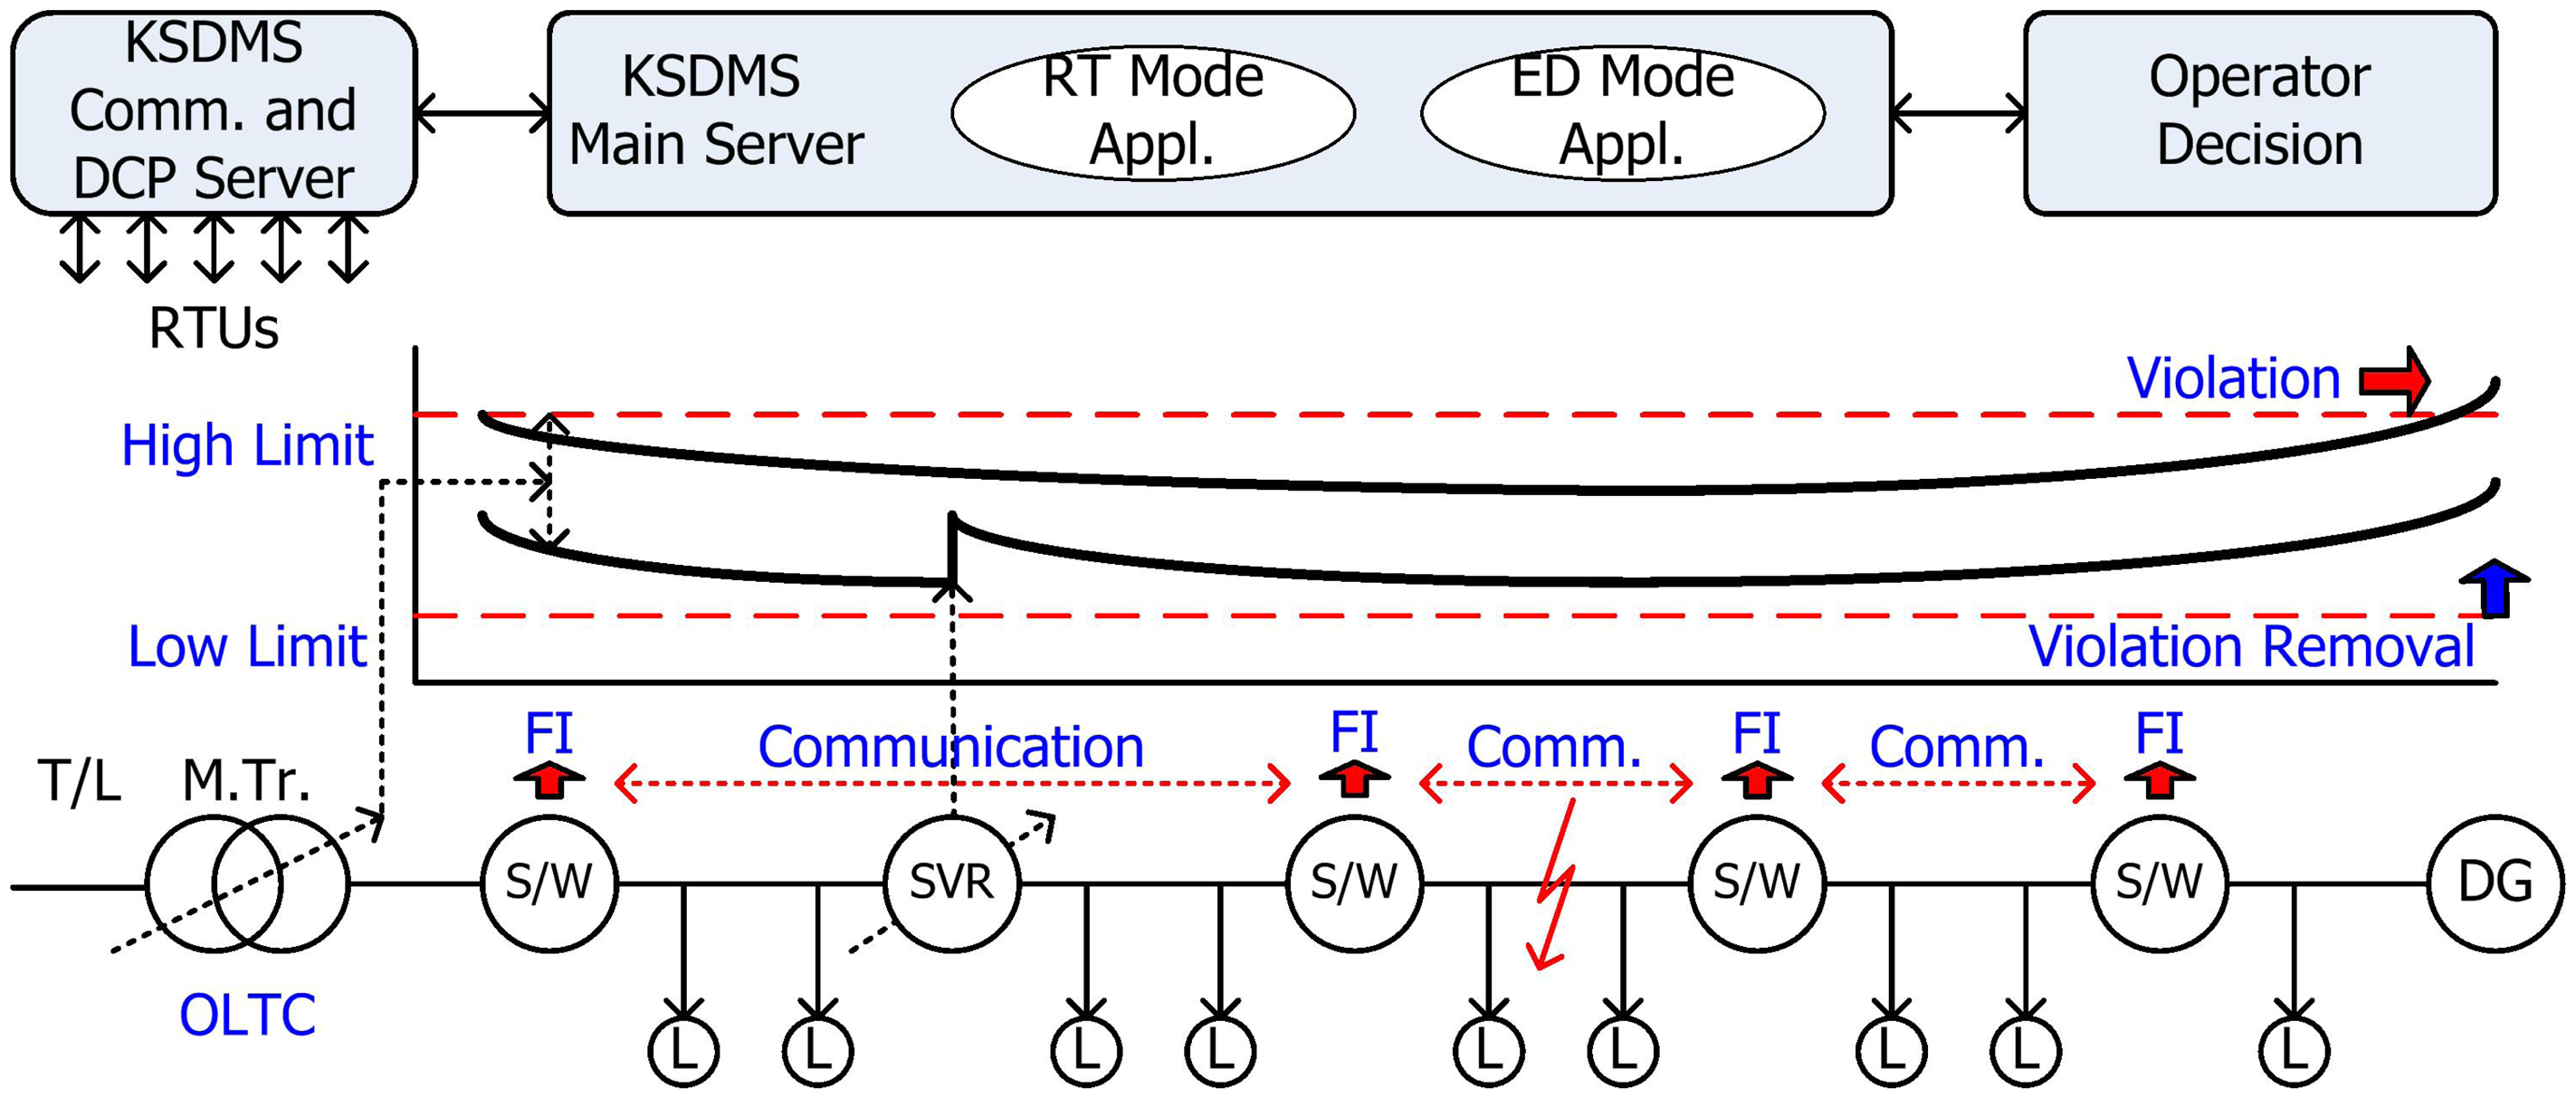
The increase in the number of DERs has generated two problems. First, it creates a voltage problem, which is a critical element in the operation of a distribution system. As mentioned before, voltage management through several measurements could yield a large output variance, which can lead to an overvoltage problem at the installation point of the DER. Moreover, the On-Load Tap Changer (OLTC) in the main transformers (M. Tr.) at the distribution substation, which is responsible for the voltage control in the distribution system thus far, has a drawback, in that it cannot take the effect of output power of the DER into consideration. As shown in Figure 1, when the OLTC tap is reduced, to resolve overvoltage due to the output power of the DER, low voltage violation could occur; whereas, when the tap is raised to resolve the low voltage in the line, high voltage violation can occur, at the connection point of distributed power. Second, fault restoration becomes difficult, due to the fault contribution of the DER. In a system linked with the DER, an FI signal is distributed in two directions, as shown in Figure 1, making it difficult to detect a fault location using the existing method.
- (2)
Problem with securing standardization and compatibility:
The existing distribution system, which was operated independently, now requires information exchange between the upper and the lower subsystems (electricity customer-side system), in response to the smart grid. Therefore, the compatibility of the DMS systems should be secured. Furthermore, along with the aforementioned inflow of output power of the DER, the use of new devices by electricity customers and high voltage distribution systems, due to the Advanced Metering Infrastructure (AMI), has greatly increased. Therefore, the demand for a compatible system that can integrate the unit technology components developed by a number of vendors has increased.
- (3)
Increasing demand for the automation of fault restoration:
As summarized in Table 1, the distribution systems in Korea have the world's smallest frequency, and duration of faults. However, the fault restoration method, which is based on the output signal generated by fault occurrence, and is used in existing DAS fault restoration, has had difficulty, due to the output power of DER, and the errors in the terminal itself. Furthermore, fault locations cannot be detected well, due to aging field devices, the error of the FI output caused by the zero sequence current in the case of ground faults, and the obstacle in the FI signal output, caused by a traffic problem in the communication networks. In addition, many newly employed operators desire the automation of fault restoration.
3. Development of the Korean Smart DMS
3.1. Background of the Korean Smart DMS
The KSDMS project was conducted from June 2009 to May 2013, in order to develop Korea's next-generation distribution operation system. The main technical objective of the development system was to solve the aforementioned problems of the existing DAS. The key objectives of this new system are summarized in Table 2. The core objectives of the KSDMS mentioned in Table 2 were set for the following reasons:
- (1)
Increase of DER receptivity: The DER interconnection results in existing operators being incapable of overcoming the problems that then arise. In addition, less experienced young operators, who have recently replaced the existing ones, may not be efficient in quick and accurate problem assessment. Therefore, we developed a system analysis and control application program that can assist operators in assessing possible problems.
- (2)
Increase of standardization and compatibility: New equipment, and devices with better performance, have recently been introduced to the distribution system. The installation of distribution systems, such as voltage or reactive power controllers, which were unimaginable in the past, has now become the norm. In order to mount application programs that ensure easy and hassle-free operation of such equipment, it is essential to develop standardized systems. Furthermore, the KSDMS has been developed with consideration of exporting it internationally.
- (3)
Automatic fault detection, isolation, and restoration (FDIR): The top priority of any power company is reducing the fault duration in distribution systems. Thus, we aimed for an outage time of less than 1 min, through the automatic identification, separation, and recovery of fault sections.
In order to increase the receptivity of the DER, the objective was to change the existing passive distribution network into an active distribution network. To this end, there has been accurate understanding of the system status; and on this basis, application programs have been developed for real-time system operation. Figure 2 shows the concept of the active distribution network. As the status of a distribution node is obtained from the communication devices and the Data Communication Server (DCP), it is transferred to the operation server. The operation server determines the current status using the real-time mode application program, as well as the voltage violation, to determine the solution for the violation, using all available control resources (OLTC, and SVR). According to the preset operation mode by the operators (automatic control or operator setup), the solution is delivered to the site device. In the case of a fault occurrence, the fault location is determined by information transmission between devices, using IEC61850 Goose communication; and its restoration solution is determined, using the event-driven mode application program.
If a system does not isolate the fault automatically with the communication between RTUs, the fault location is determined using the application program, with consideration of FI occurrence, fault current, and DER location.
3.2. Development of KSDMS Applications
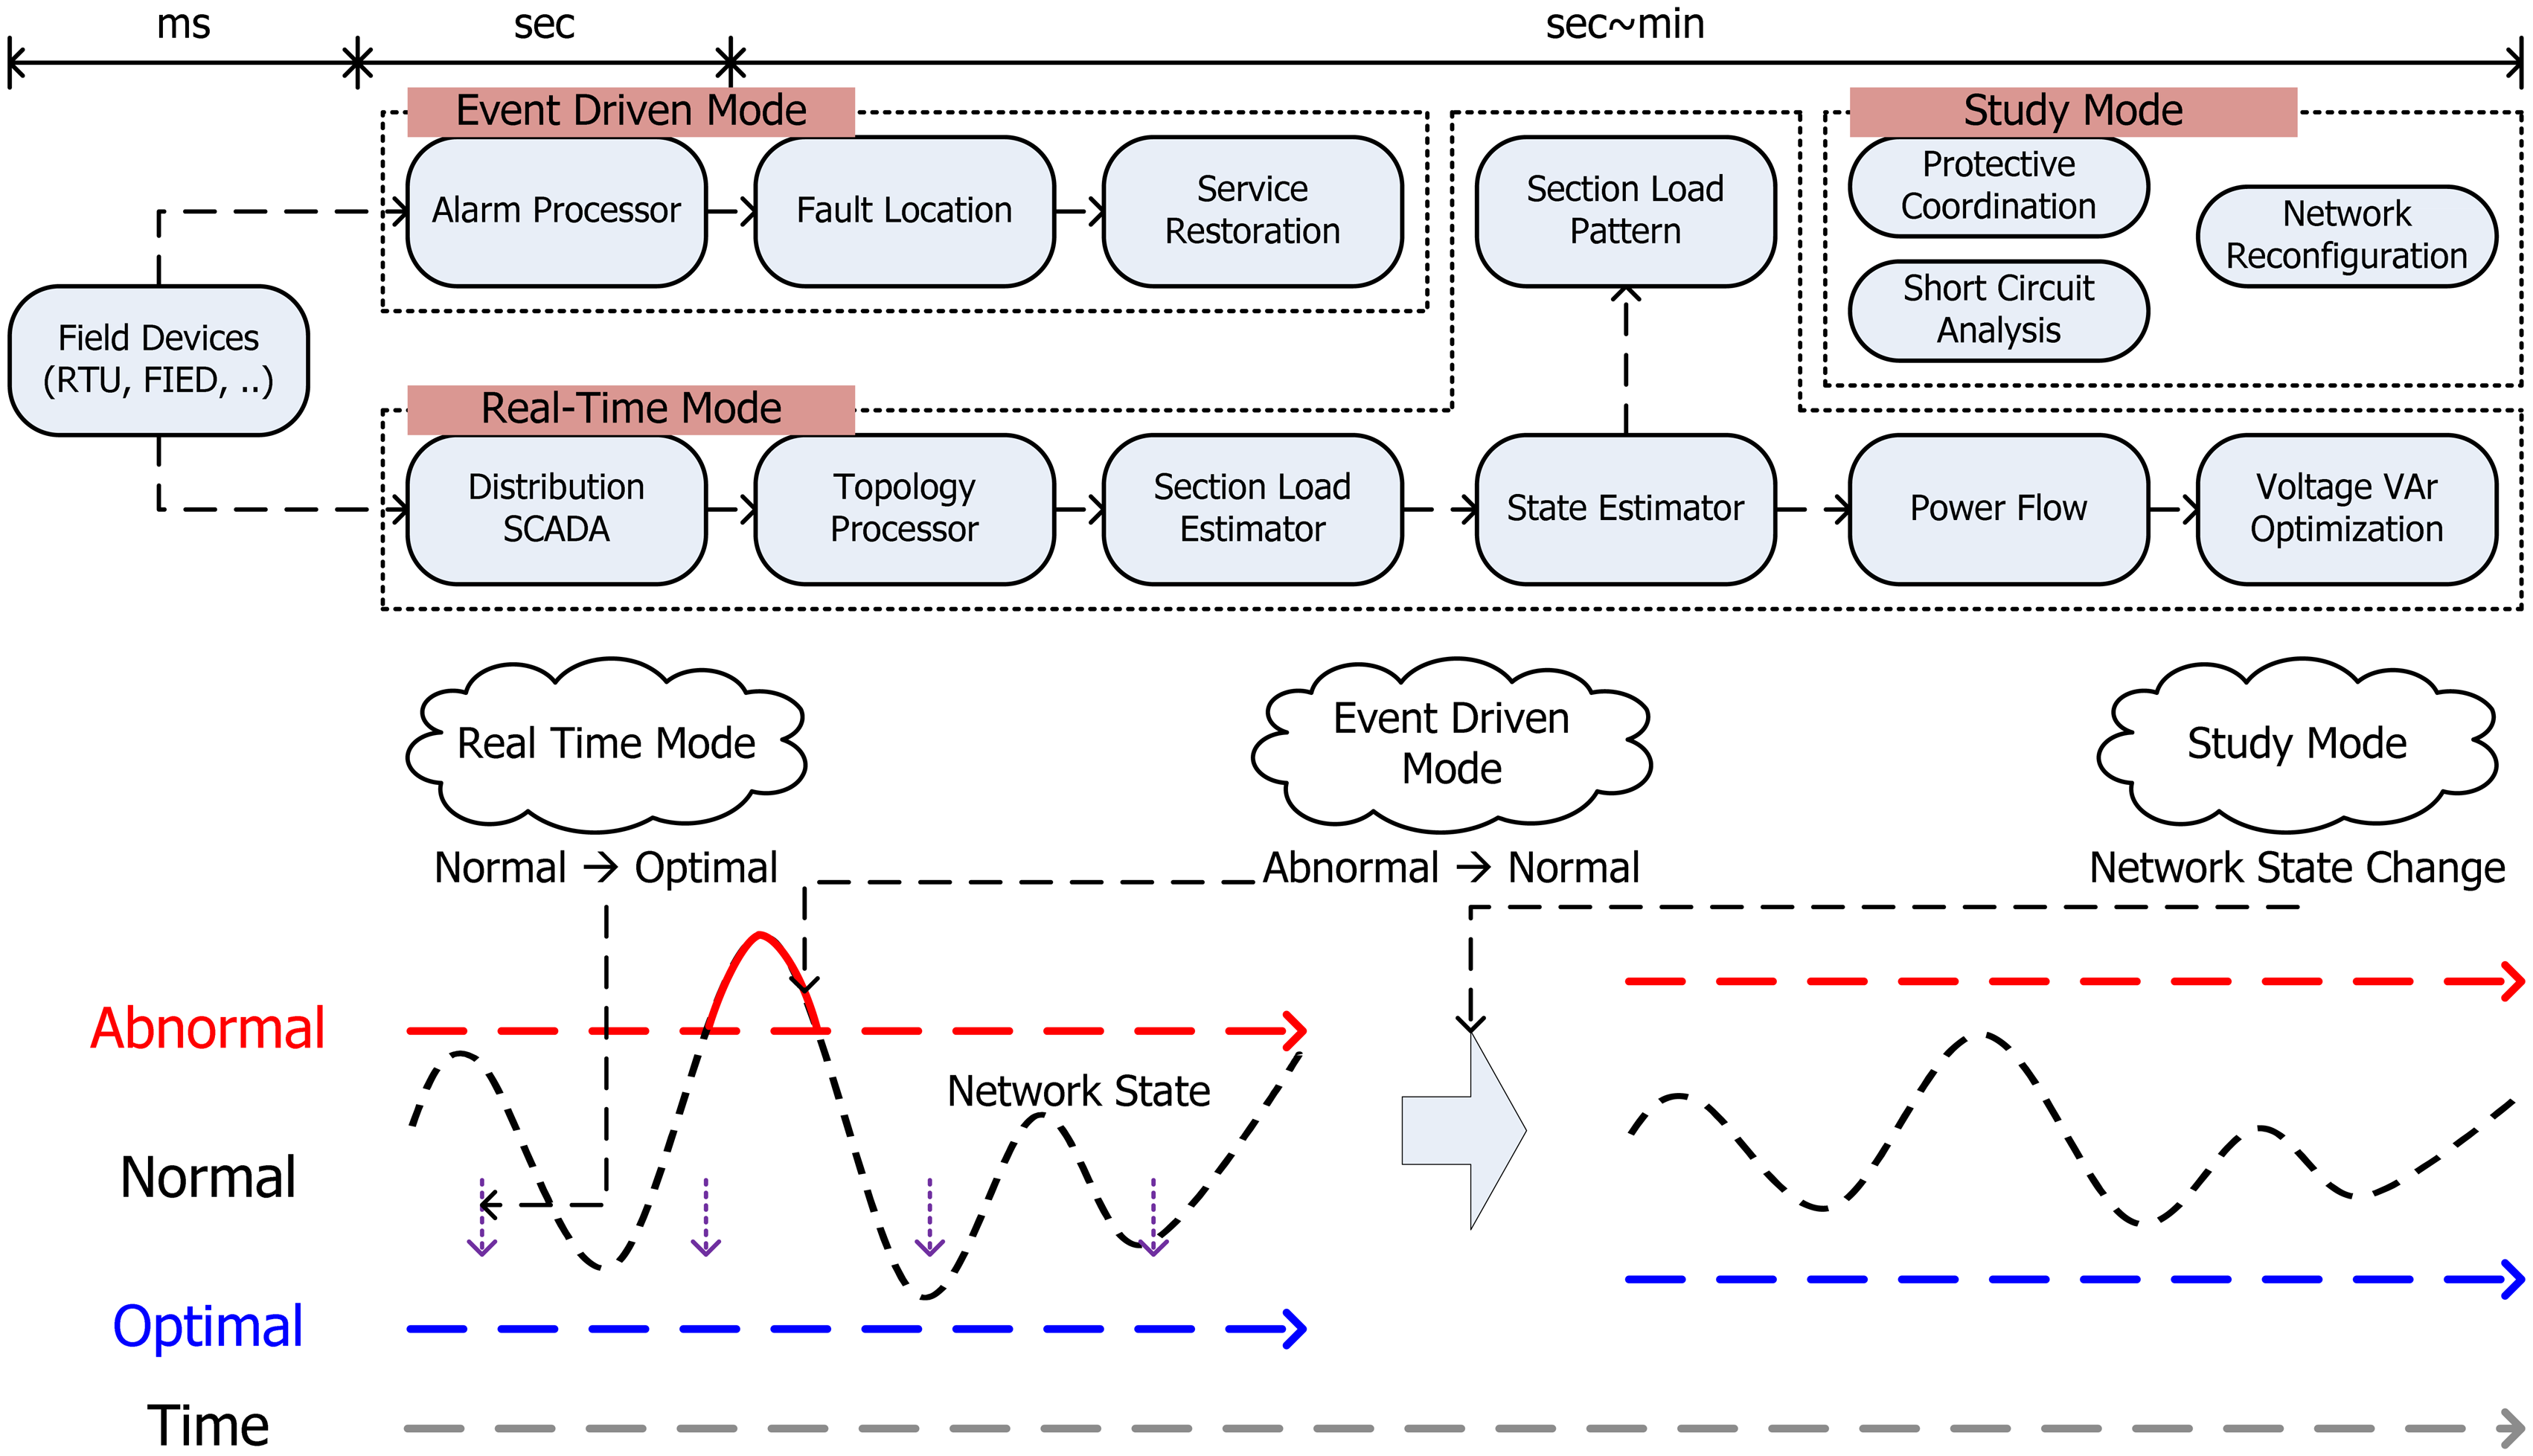
Figure 3 shows the structure for KSDMS solution deduction using applications. As indicated in the figure, all applications consist of three modes: real-time (RT), event-driven (ED), and study (ST). The RT mode is periodically operated (the user can adjust it for intervals of a few minutes, to several tens of minutes), and monitors and controls system conditions (voltage, currents, and loads), while maintaining the optimal status of the system. When a fault occurs in the distribution system, the ED mode detects and separates the faulty section, and provides a solution to ultimately restore the power failure section. The ST mode simulates the network conditions, when the system configuration (topology change and equipment supplement) is modified.
The process of solution deduction using the applications in each mode is as follows:
- (1)
RT Mode: The application service interface (ASI, a function of middleware of operation server) controls the operation of applications that transfer conditional information (switch status, voltage, currents, and topology), which is sent from terminal equipment to the memory DB as snapshot-type data. First, its current topological conditions are examined using the topology processor, and the section load estimator calculates section loads, which are pseudo measurement values of the status estimator. These are used to estimate the voltage and topology, during status estimation. This process is performed, because the number of measured values is absolutely lacking in the case of the distribution system; to ensure observability; and to increase redundancy. Moreover, the network topology between points that have measured values is electrically reduced during status estimation, to increase observability. Finally, the voltage and angle of the distribution network are determined through load flow calculation, using loads and generation data obtained through status estimation. Using real-time power flow results as the base case, the Voltage VAr Optimization (VVO) examines violations of voltage and overload, and when a violation occurs, generates control recommendations to solve the problem. Even when a violation does not occur, control recommendations are generated to minimize loss, according to the user setting. The generated control recommendations are transferred to field devices by the user, or directly to the field equipment, to exert control after the results are deducted, according to the setting.
- (2)
ED Mode: When a fault occurs, it is detected by an alarm processor, and an FI is transferred from the field device (RTU or IED). The ASI creates (aside from the RT Mode) a memory DB that can be accessed by applications in ED mode. The alarm processor summarizes information from the FI and fault currents, and inputs it to the memory DB, and the ASI operates the fault location program that examines the faulted section (the section between the automatic switches). After isolating the fault section through investigation, the ASI operates the service restoration program to determine the restoration plan (switching operation) for the power failure section, except for the fault section.
- (3)
Study Mode: The ASI, operated by user commands, creates a memory DB that is separate from the RT and ST Modes, and loads the DB data of the current RT mode, or a saved case.
Table 3 summarizes the configuration and characteristics of the application program in the KSDMS.
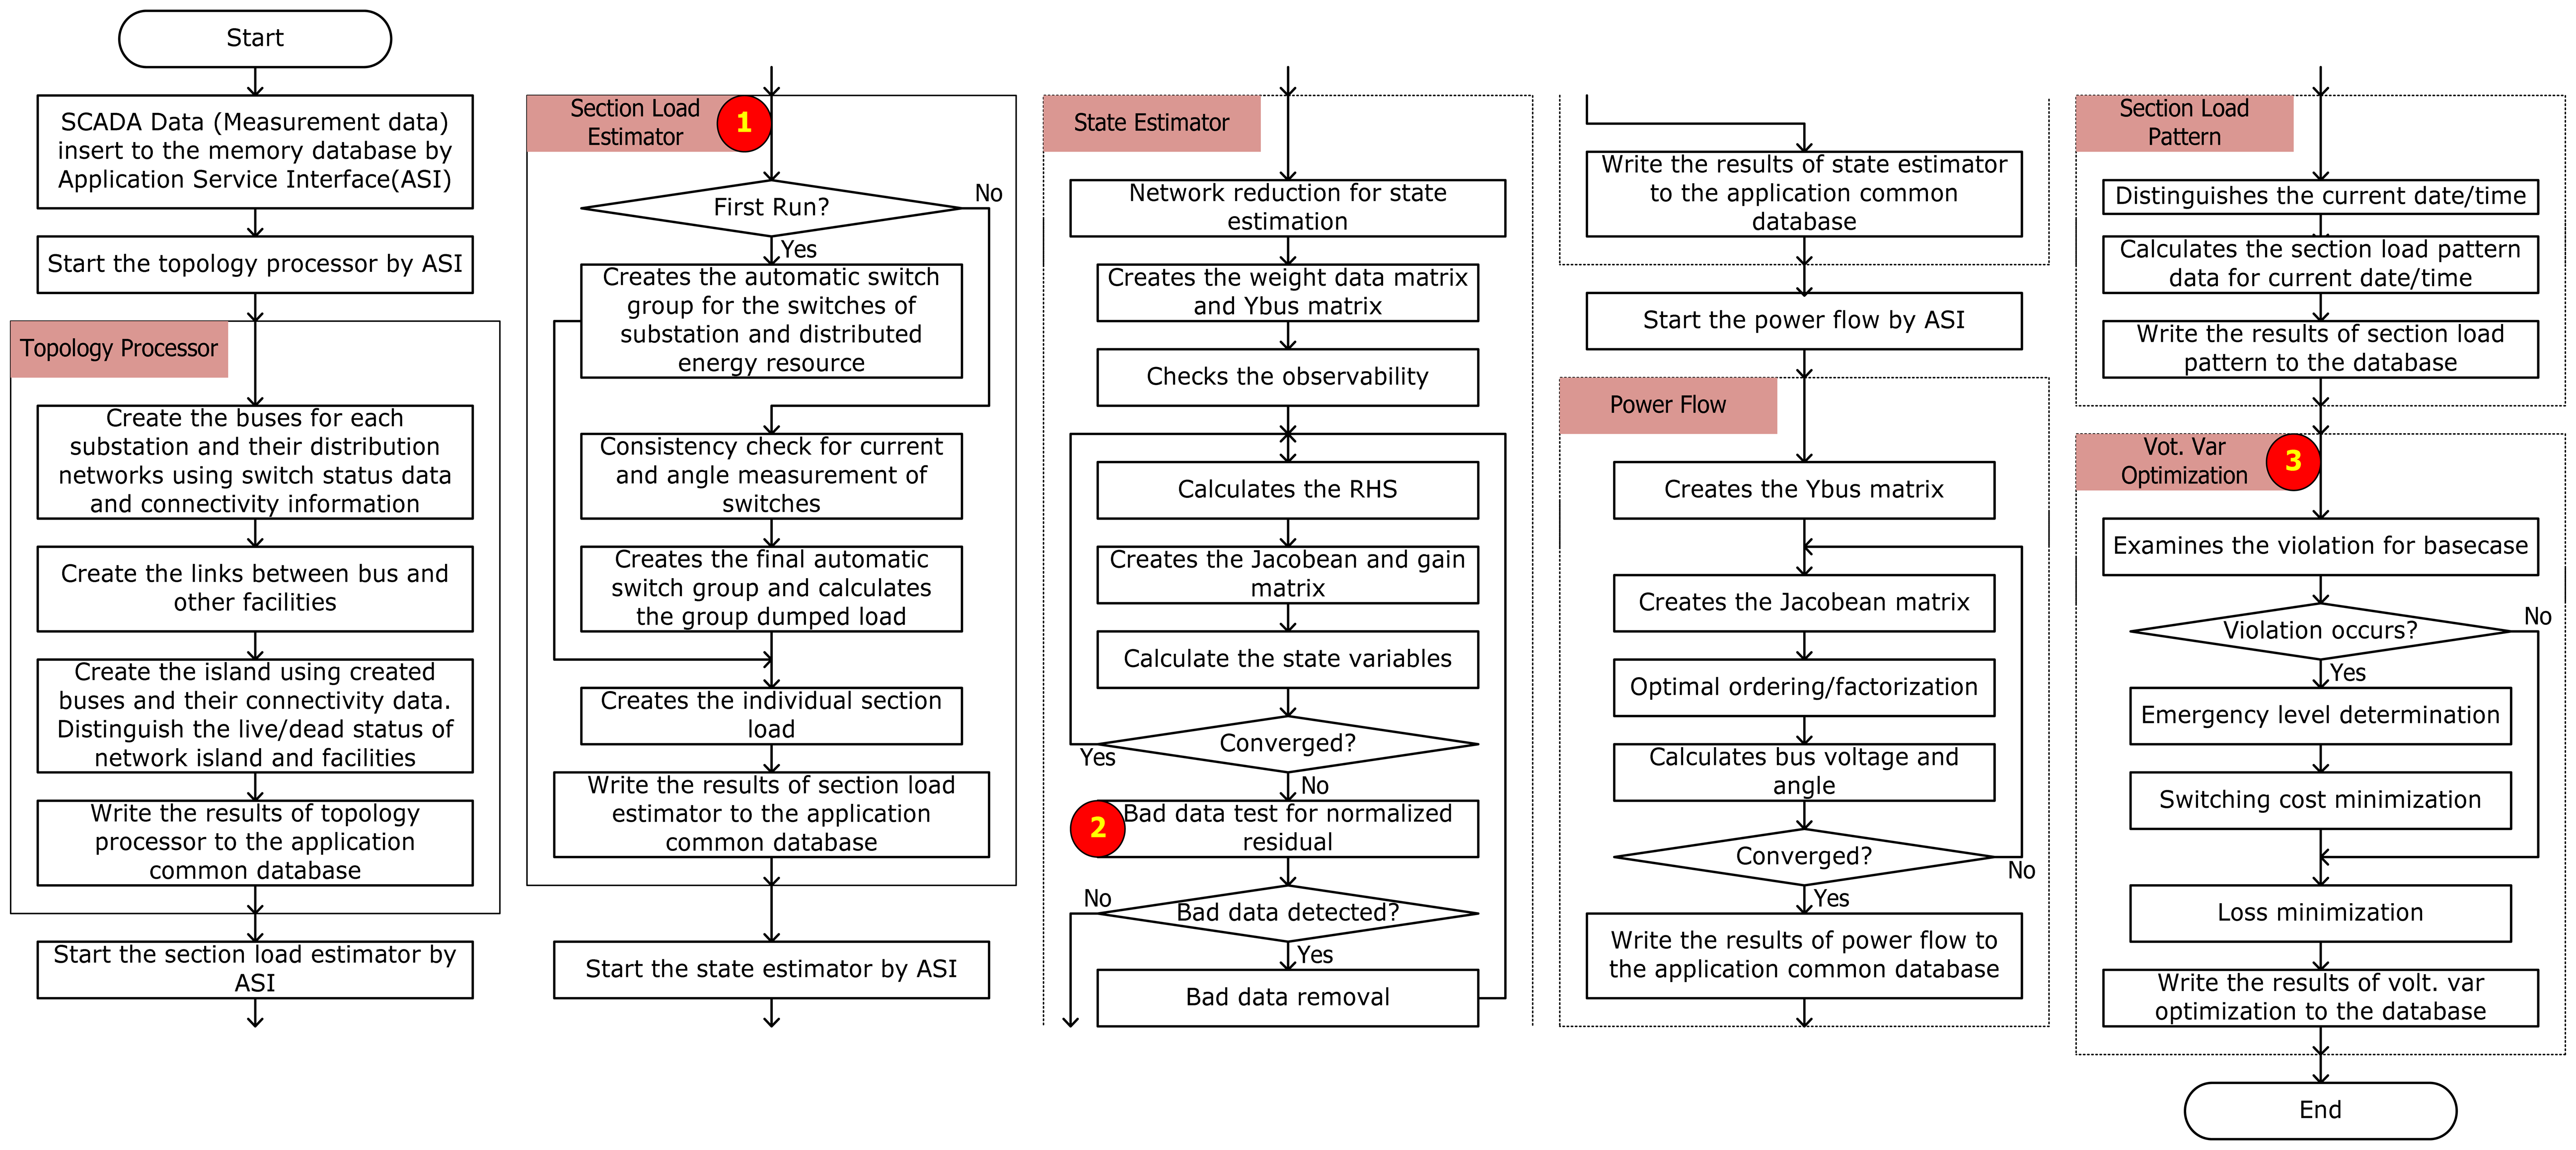
Figure 4 shows a flow chart of applications in the RT mode. Detailed explanations for the main parts of the figure are as follows:
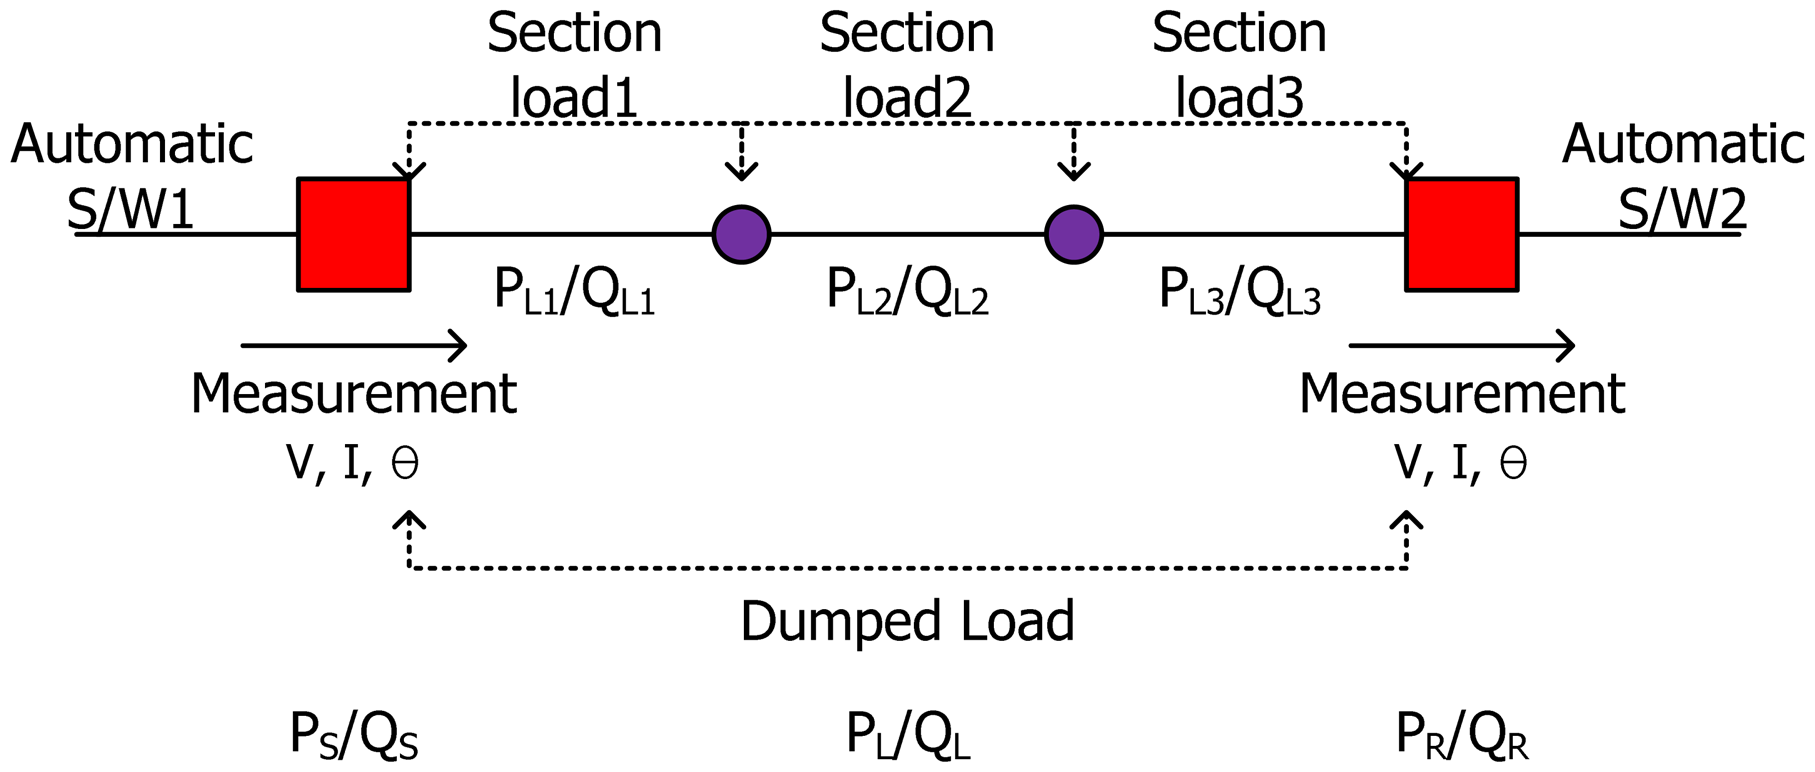
Part ➀: Figure 5 shows the definition of the section load in the KSDMS. As shown in the figure, actual loads of the distribution system are distributed alongside distribution lines, but do not have measuring points, except at the automatic switches. Hence, this study calculates the dumped loads between automatic switches, and distributes them as section loads, using measured values of the automatic switches. A section load estimator uses only the most reliable information during initial operation, and filters bad data through a consistency check, using all measured values after a second operation.
Part ➁: To filter bad data during KSDMS status estimation, two methods are used, the maximum normalized residual method, and the method that removes all measured values with a standard deviation higher than ±x sigma (σ), among normalized residuals of measurement values. This is because the method that individually removes bad data one-by-one understandably requires a great amount of time, because there is an extensive amount of bad data, in voltage measurement values in Korea.
Part ➂: The KSDMS VVO improves the manual operations of existing distribution management methods, and provides a solution that can manage all control equipment on the distribution system at a comprehensive system level. For an optimal solution, we adopted the mixed integer linear programming (MILP) and sequential MILP (SMILP) methods, which find a solution through repeated flow calculation. The controlling equipment of the KSDMS VVO includes the OLTC, SVR, SVC, STATCOM, Sh.C, and DER, where the output of reactive power is controlled. The KSDMS VVO, in general, uses only the continuous control variable devices (SVC/STATCOM, DER;, to minimize the loss of effective power. If a violation occurs in the distribution system, the KSDMS VVO minimizes the cost of the switching operations of all control equipment, and calculates the loss-minimizing reference values of the DER and SVC, based on the reference values of the control equipment that can resolve the violation. The KSDMS VVO uses three main modules to optimize the voltage and reactive power. The function of each module is as follows:
- (1)
Emergency level determination (ELD): ELD is initiated only when a violation occurs, and calculates an emergency level, and the range of the following operational condition of the distribution system. The voltage emergency level, line flow emergency level, and power factor emergency level are indices that indicate the magnitudes of voltage, line flow, and power factor violations, respectively.
- (2)
Switching cost minimization (SCM): SCM minimizes the cost of operating switch-based equipment, using all of the voltage and reactive power control equipment. The SCM calculates the reference values that minimize the costs of switch-based control equipment (OLTC, SVR, SC, and ShR), by solving problems associated with OPF.
- (3)
Loss minimization (LM): LM minimizes losses, using the DG and SVC. The Loss minimization uses OPF (optimal power flow), to calculate the reference values of DG and SVC that minimize the loss of effective power.
3.3. Development of KSDMS Platform
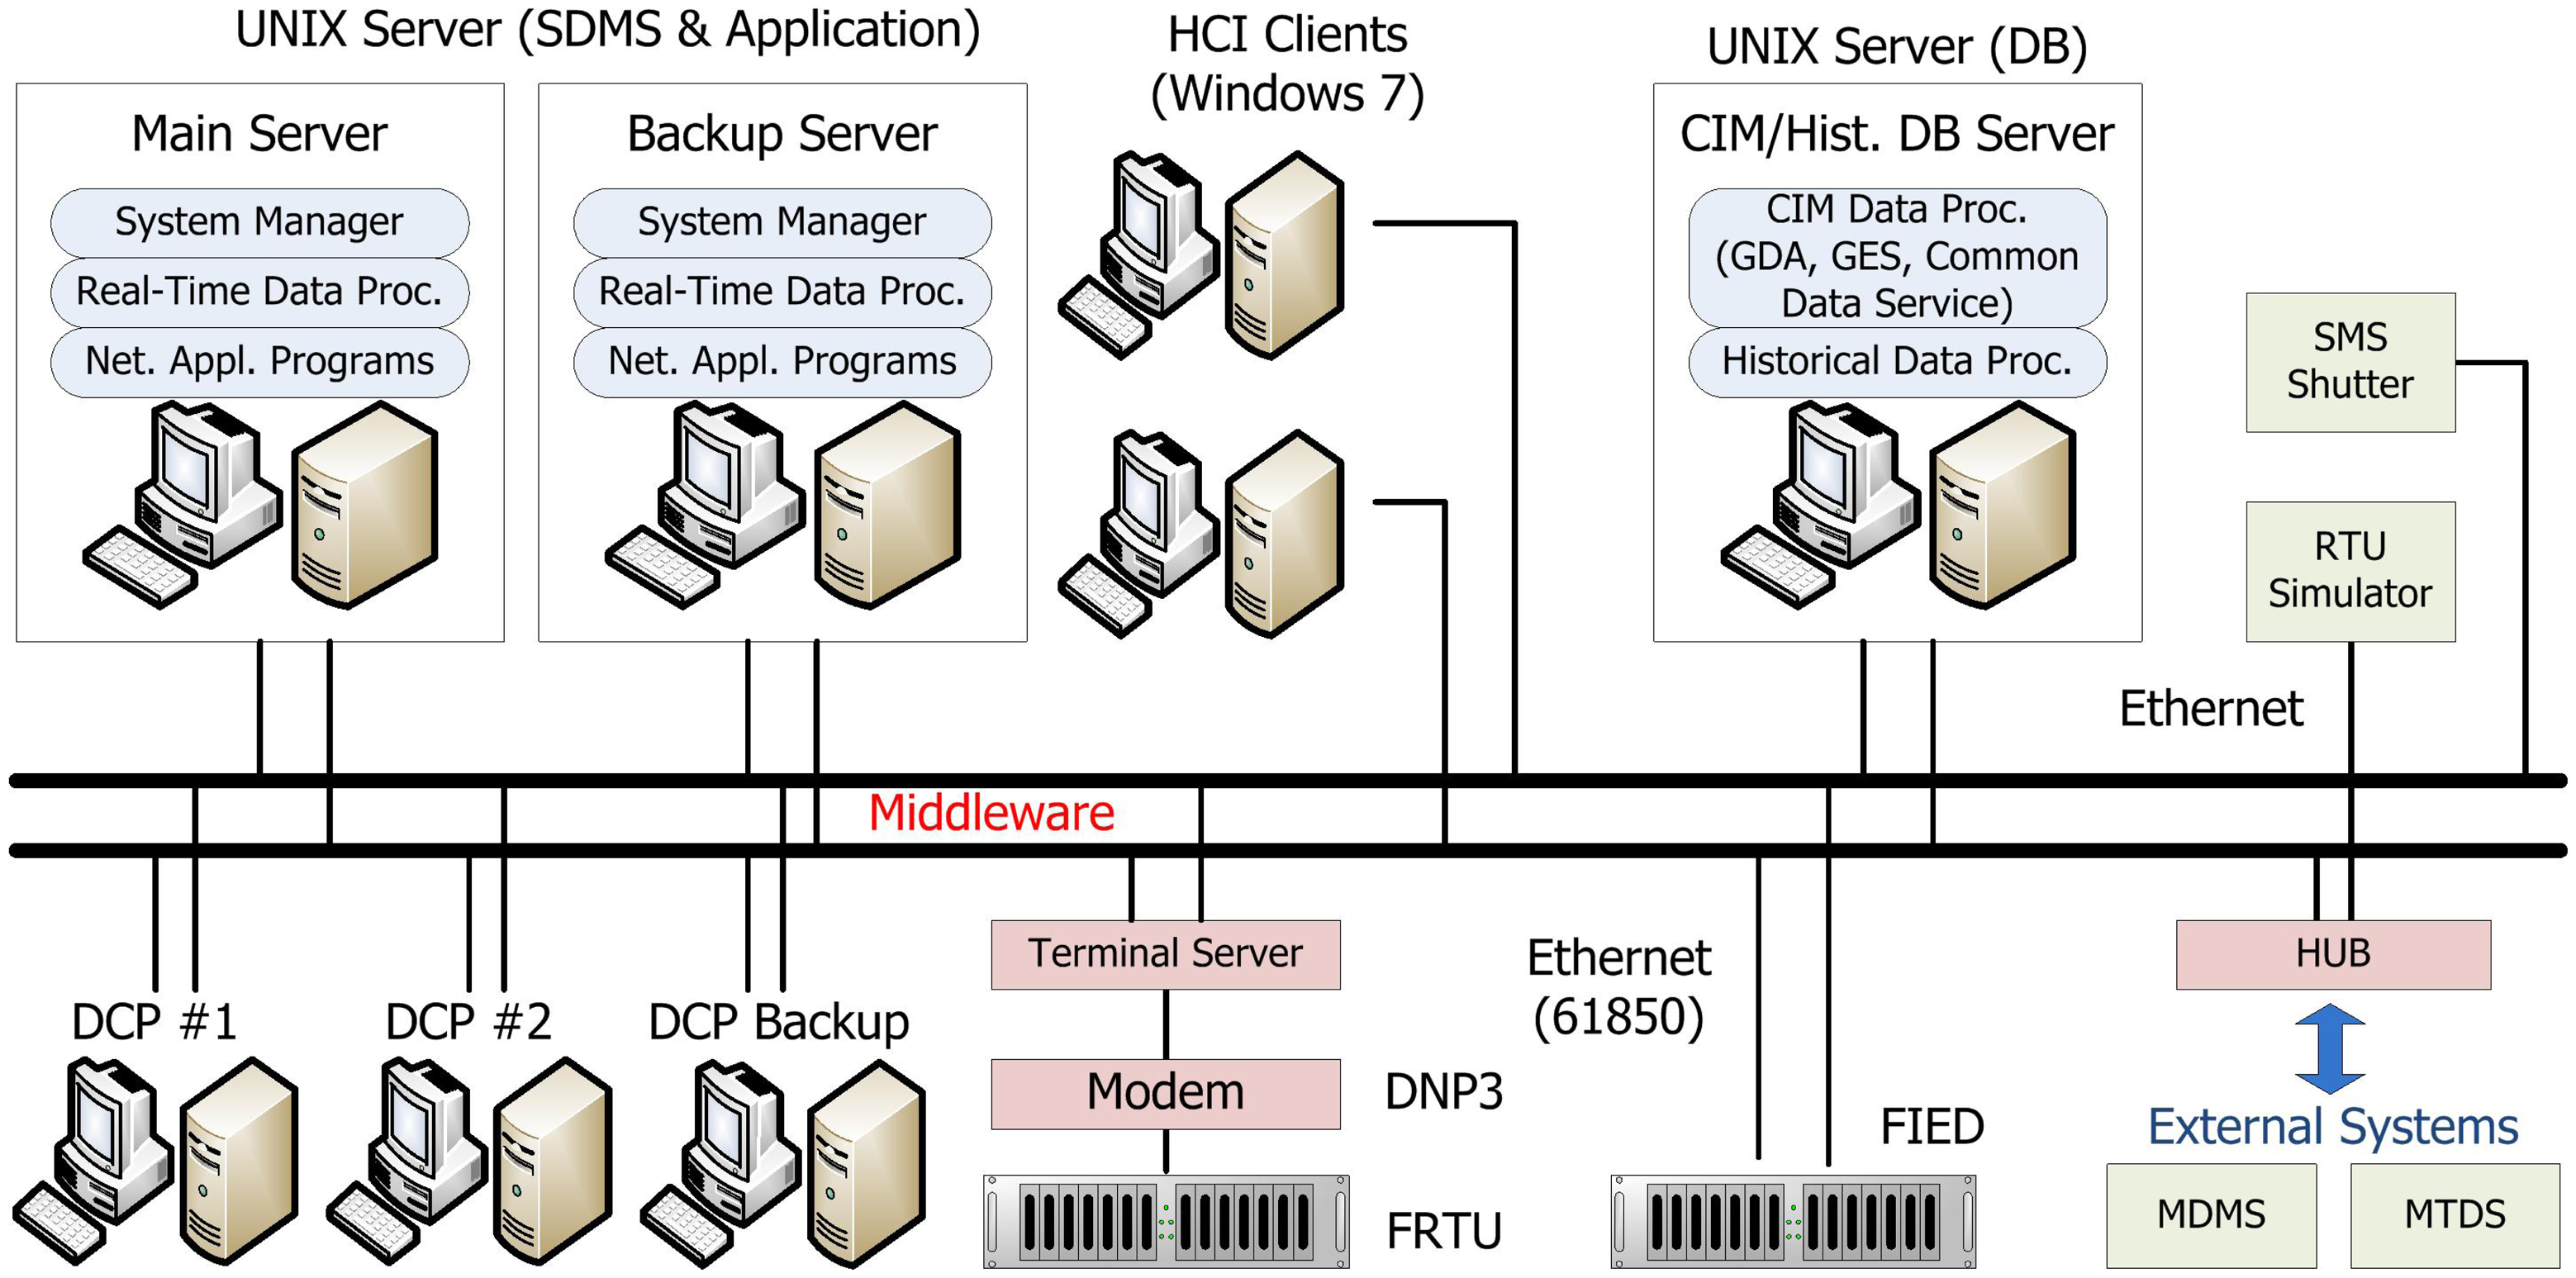
A practical distribution system is a large-scale system; for example, the number of buses that are operated by a single office is normally of the order of several thousands (in the case of the Jeju office in general, approximately 8000 buses are in the system, and 5000 buses are in the reduced system). Therefore, application programs, platforms, and DB structure are required that can analyze such large-size distribution systems. Figure 6 shows the platform structure for real-time system analysis and control. As shown in this figure, the structure of the KSDMS platform is similar to that of a small-size EMS. The configuration of the KSDMS platform consists of an operation server, which is responsible for system operation; a DB server, which manages the database; and a DCP server, which is responsible for data communication with the field devices and the operator's PC. The operation server and the DCP server are redundantly configured as 1:1 and 1:n, respectively; and all the operation data are backed up in the external hard disk in real time, for fast operation recovery during server failover.
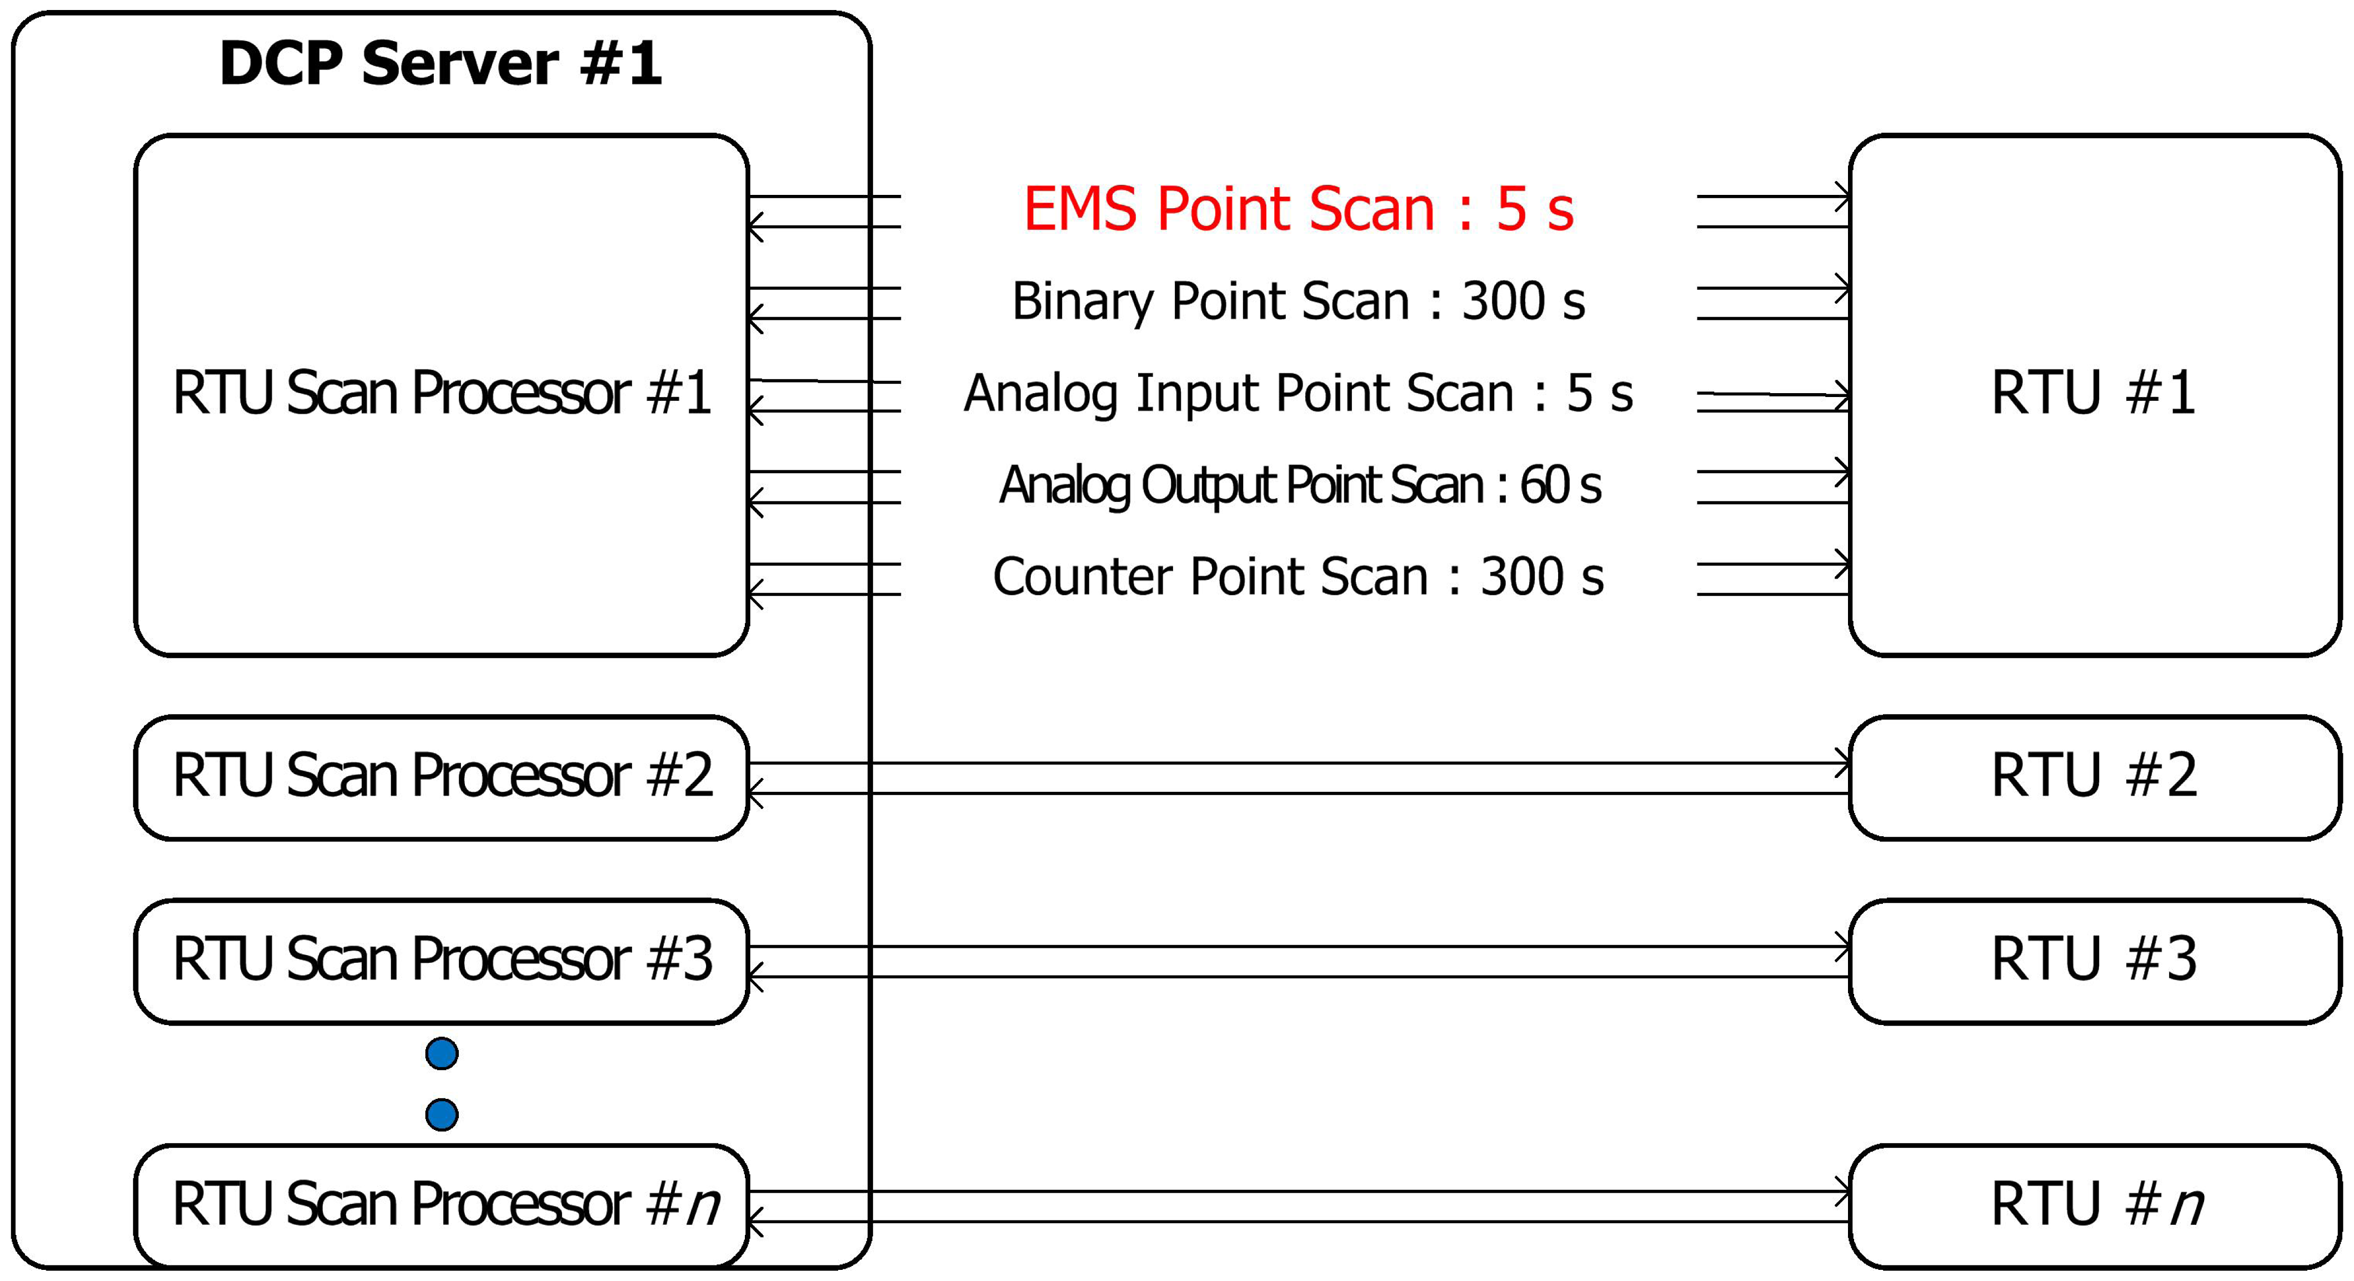
The asynchronous problem with the measured data during system monitoring in the existing DAS was solved by the configuration of the DCP server in this study, as shown in Figure 7. As shown in this figure, a processor for data communication with each of the field devices by software was mounted in the DCP server. This was to change the existing 1:1 mode data communication, to 1:n mode data communication. The data required for system analysis and control of the application program, which are most sensitive in terms of synchronous data acquisition, were defined as the EMS point data, which were configured for synchronous acquisition within 5 s (200 RTUs per DCP). The EMS data consist of the voltage per phase, current, phase, generation amount P/Q, and transformer tap position information, which are required for system analysis.
3.4. Development of the KSDMS Database
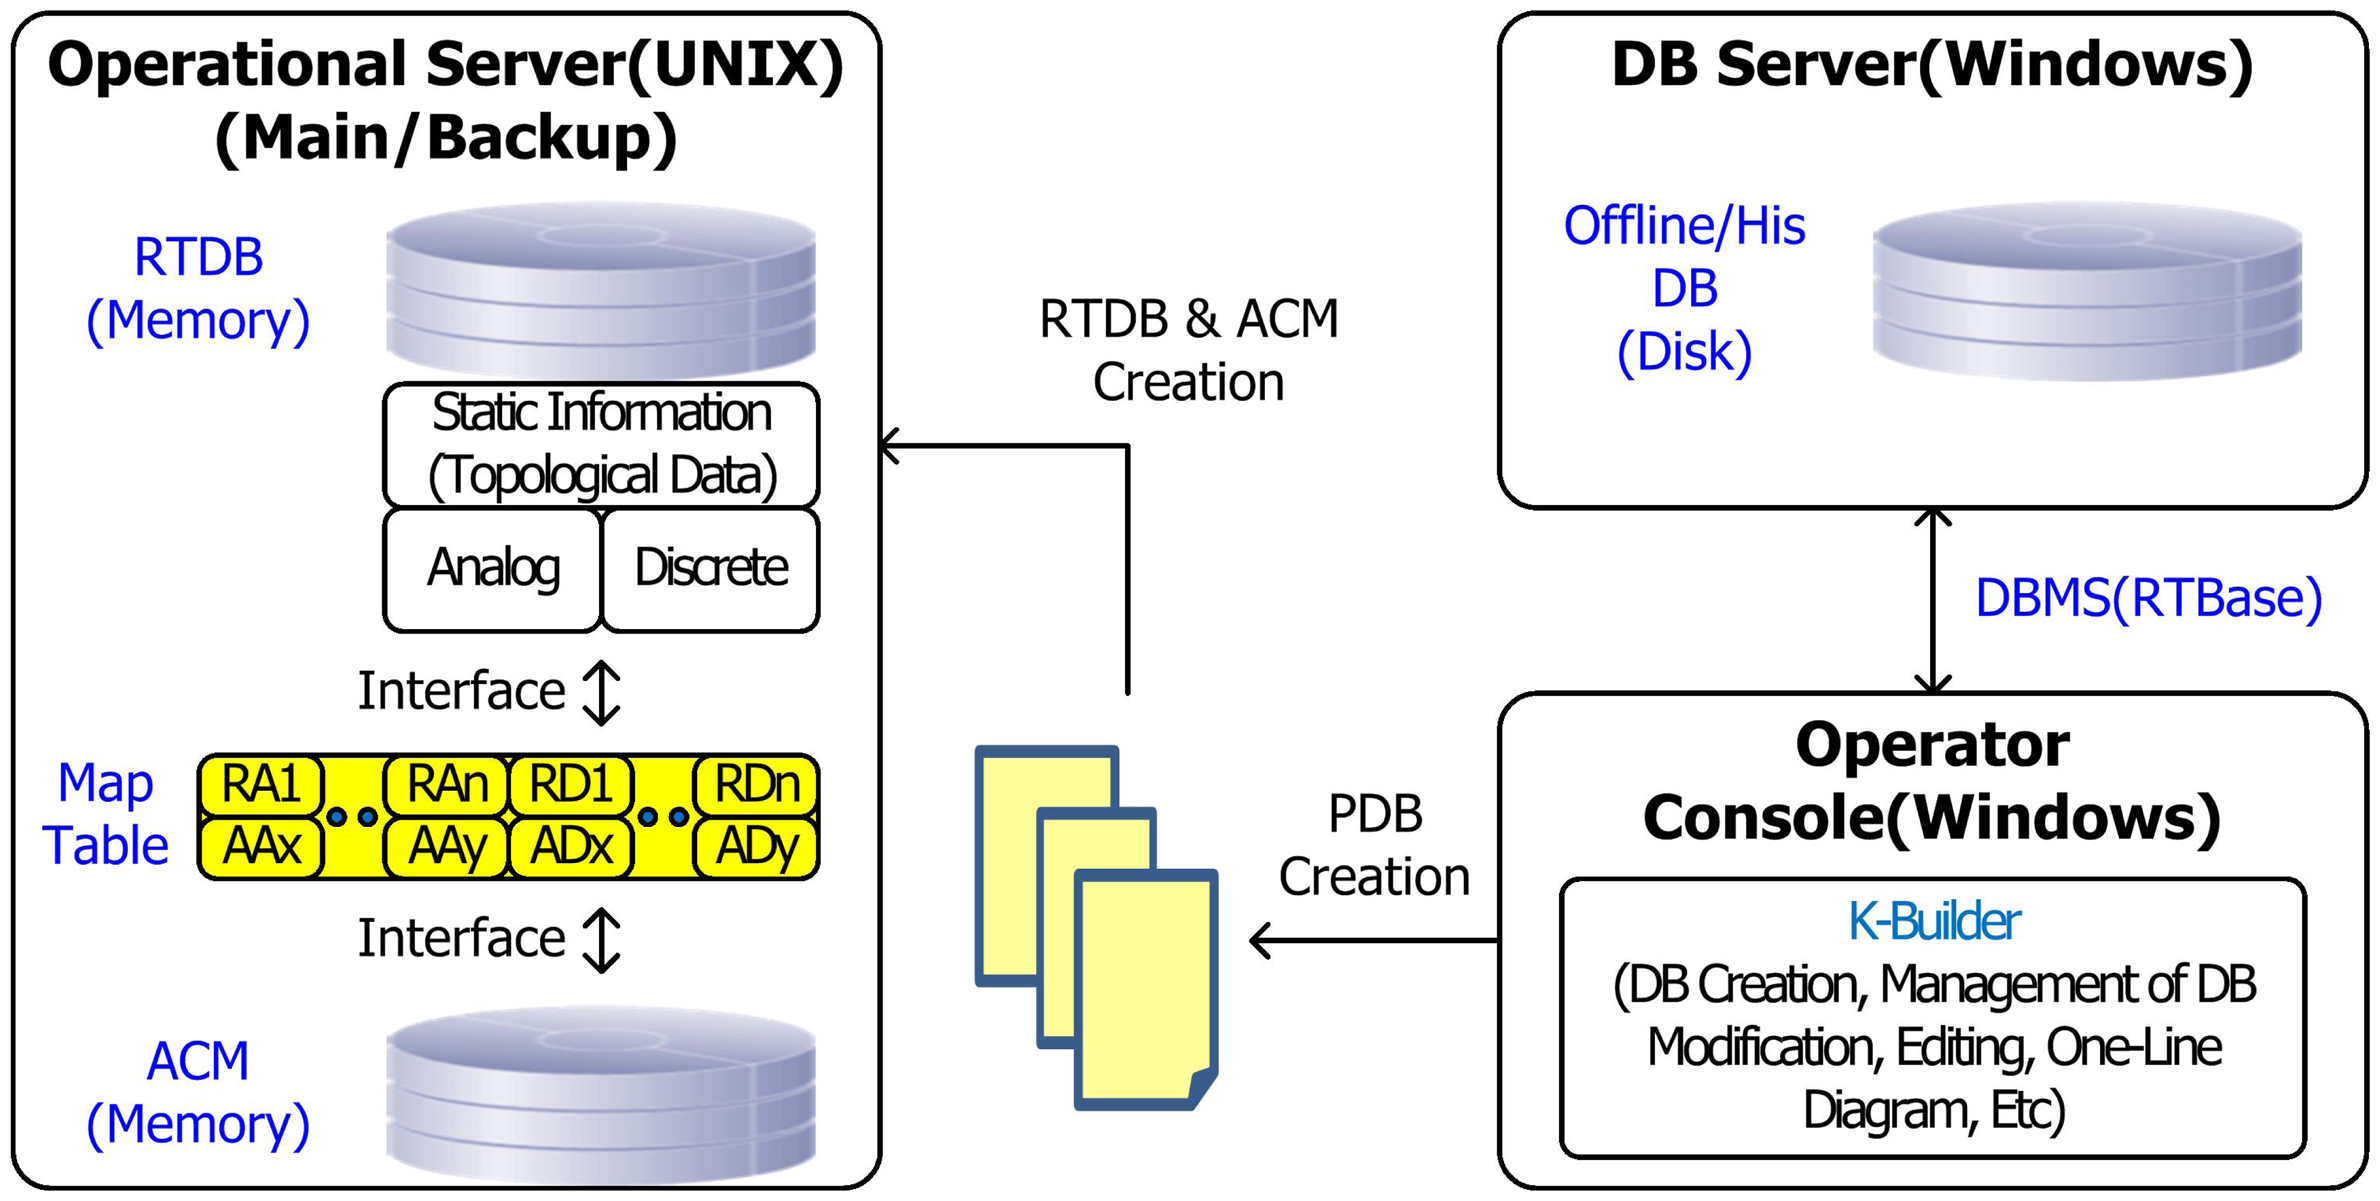
The KSDMS was configured to secure standardization and compatibility, as follows: For data standardization inside the system, the IEC61970/IEC61968 (CIM) standard was applied to the facility modeling, and to the database model. The database structure of the KSDMS is shown in Figure 8.
As shown in this figure, the overall DB is divided into the Real Time Database (RTDB), which is configured as the memory of the operation server; the Application Common Model (ACM); and the offline/historical DB, which is managed by the DB server. The operator's console manages the offline DB, and extracts the modification as a type of Physical DB (PDB), to update the RTDB, ACM, and map tables. During the DB (RTDB and ACM) update of the operation server, the backup server is updated; then, the main server is updated after failover, to ensure DB update, without interruption of the operation.
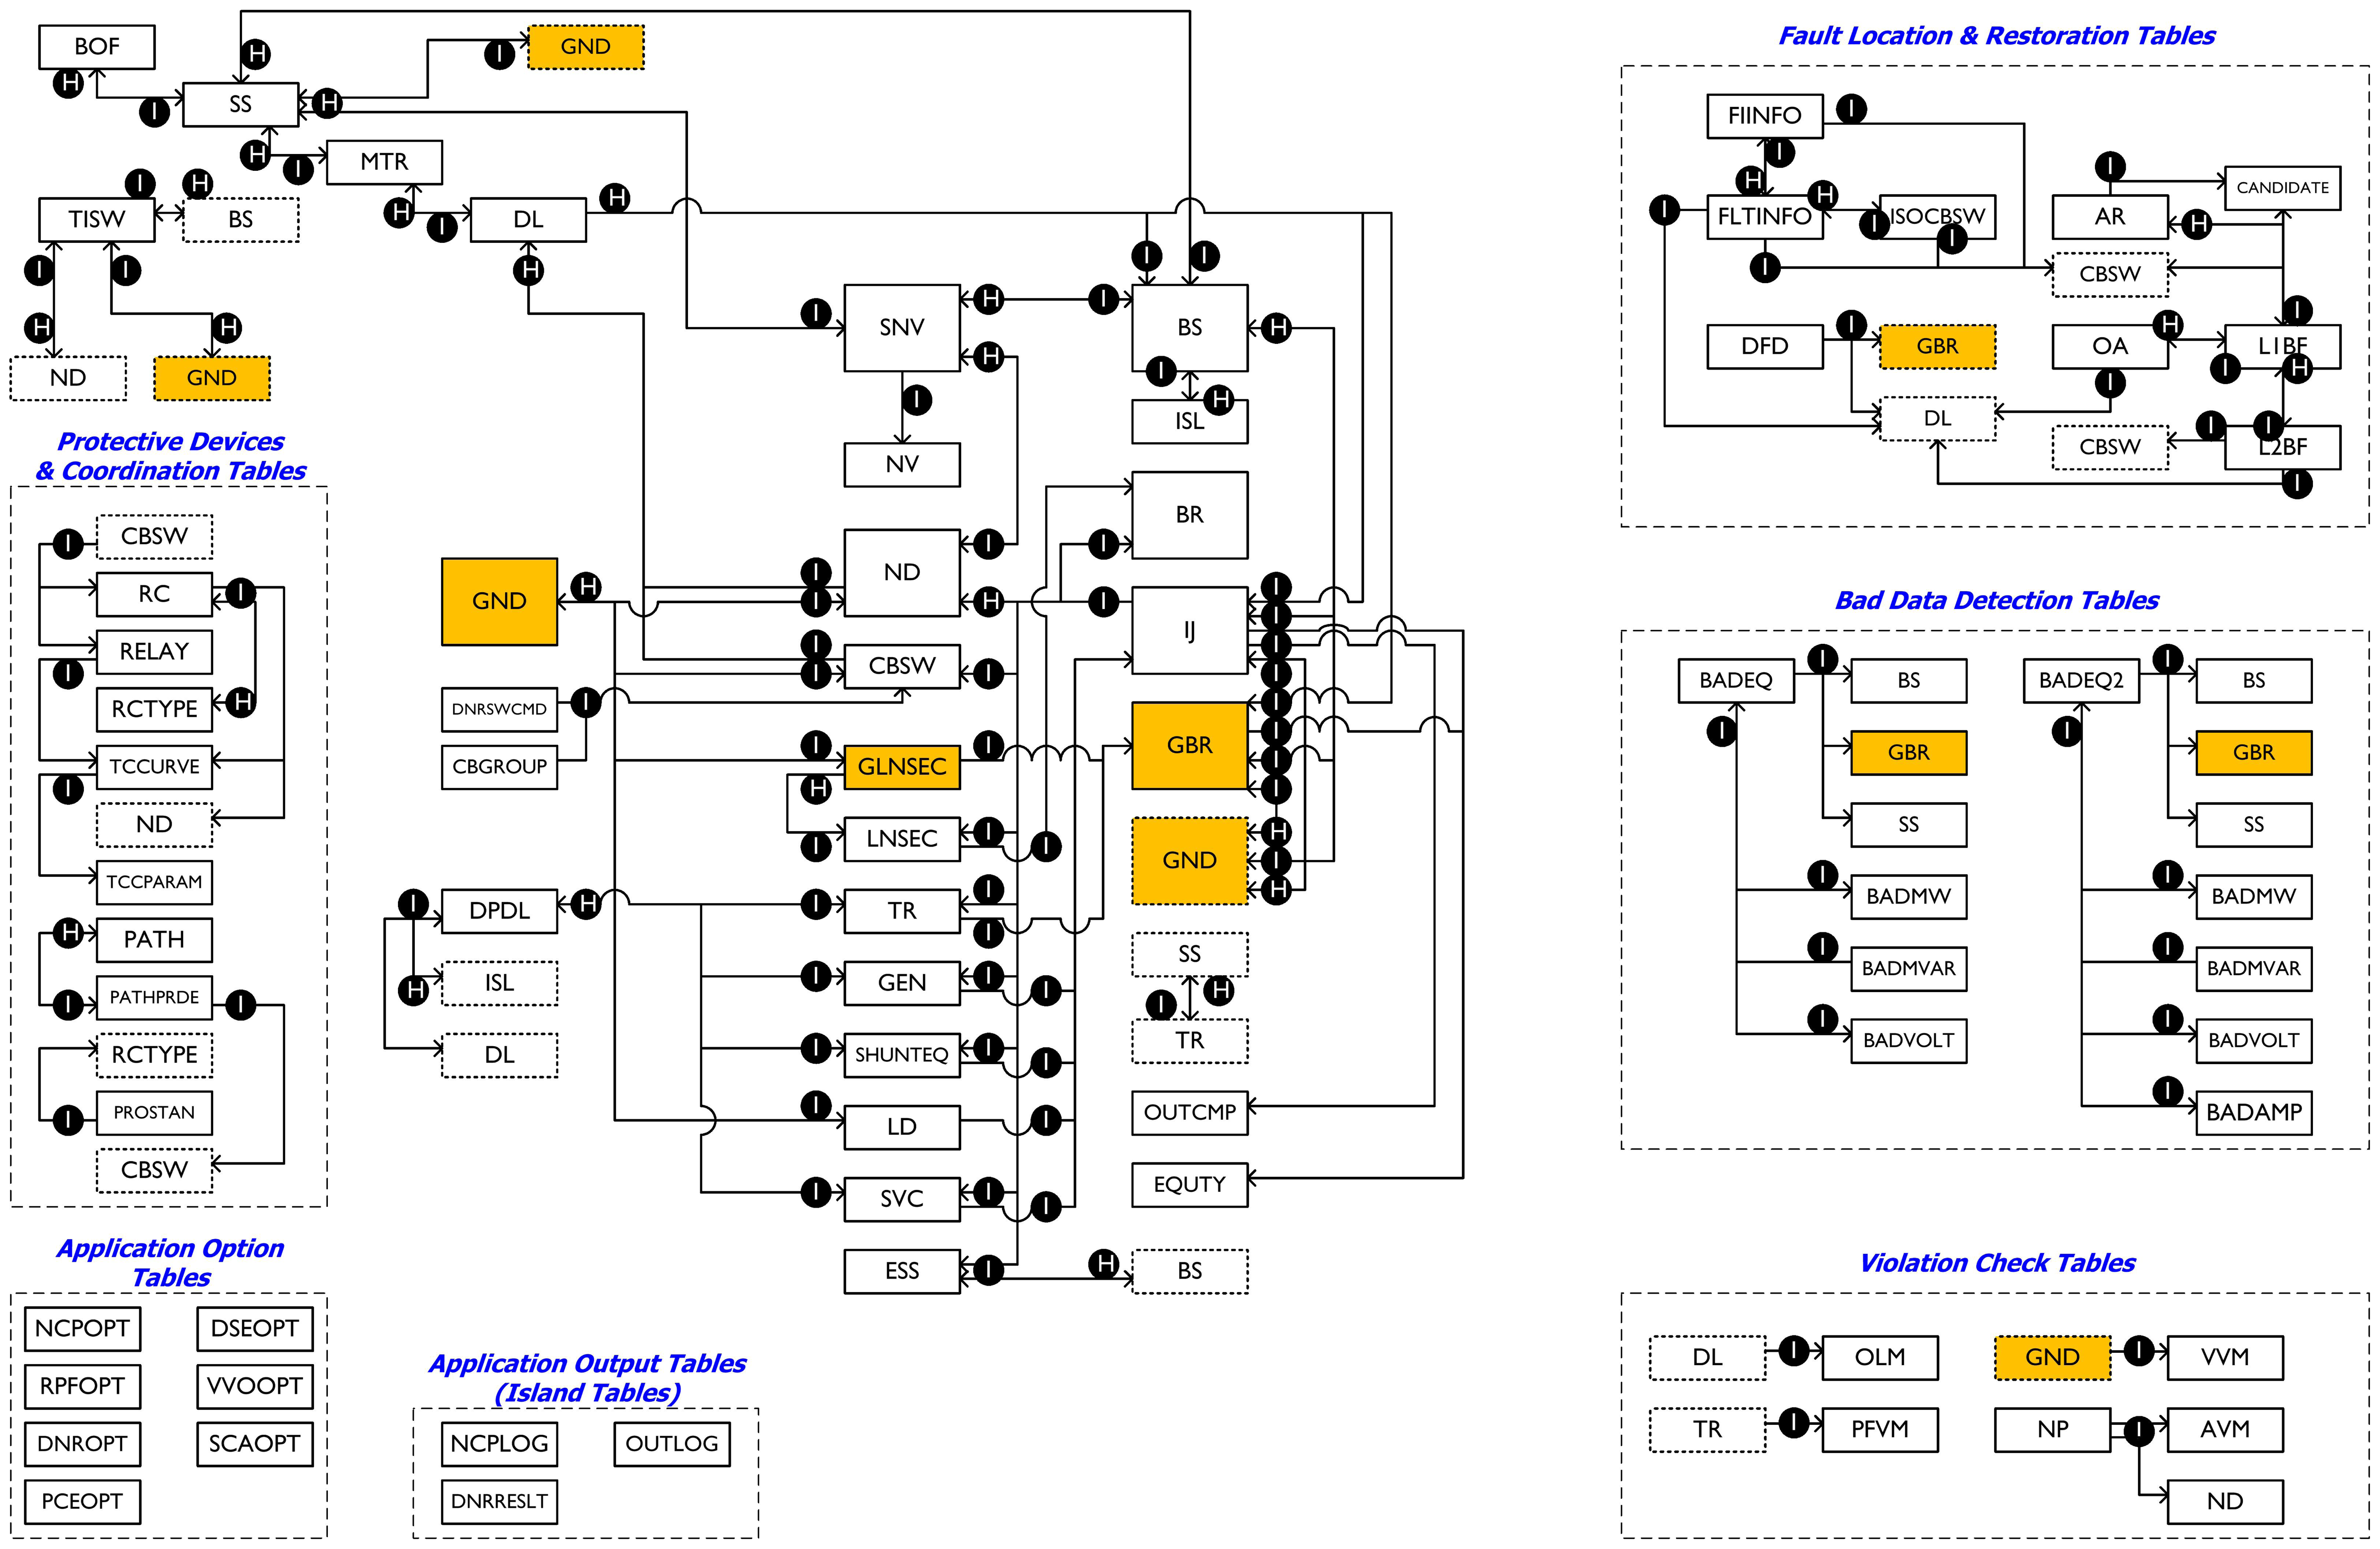
Figure 9 shows the structure of the common database of the application program. Figure 9 is referred to as the ACM, which is commonly used by the KSDMS application programs. Placing the branch office at the top table, a hierarchic structure of transformers, M. Tr., and Distribution Line (D/L) is created and configured, using a linked list structure [33,34].
The rectangular boxes shown in Figure 9 represent the table, and the lines with arrows indicate the relationship between each table. The shaded/colored boxes represent the table in relation to system reduction, which is reduced, to prevent interruption of the operation of a simple branch point, and the placement in the continuous section. Each table is comprised of three links. The first link identifies each record of the table with a consecutive integer; the second contains the data of each record, which includes names and properties; the third contains links to other tables, which are divided into head, sibling, and indirect indices. Consider the 2 tables that have a 1:n relationship; the head index denotes the first record in table n. The sibling index indicates the next record in table n. The indirect index indicates the record in table 1. “H” and “I” denote the head and indirect index, respectively. For example, the “substation (SS)” table is linked with the “switch (CBSW)” table, by the 1:n entry. Thus, the “SS” table has the head index (1), and the “CBSW” table has the sibling (n) and indirect (n).
3.5. Development of the KSDMS Feeder IEDs and Fault Restoration Process
The IEC61968 (CIS) standard [35] and OPC-UA [36] were applied, to standardize the data exchange between systems. Using these standards, standardized data exchange can be performed between the upper and the lower systems. The IEC61850 standard [37], which is a communication standard for substation automation systems whose application has recently extended into distribution systems, was adopted as one of the communication standards. In other words, both existing DNP3.0 [38] communication and IEC61850 communication were adopted, in order to configure systems. In addition, a point map was defined in the database, to accept heterogeneous field devices without modification of the middleware, to increase the receptivity and compatibility of heterogeneous field devices.
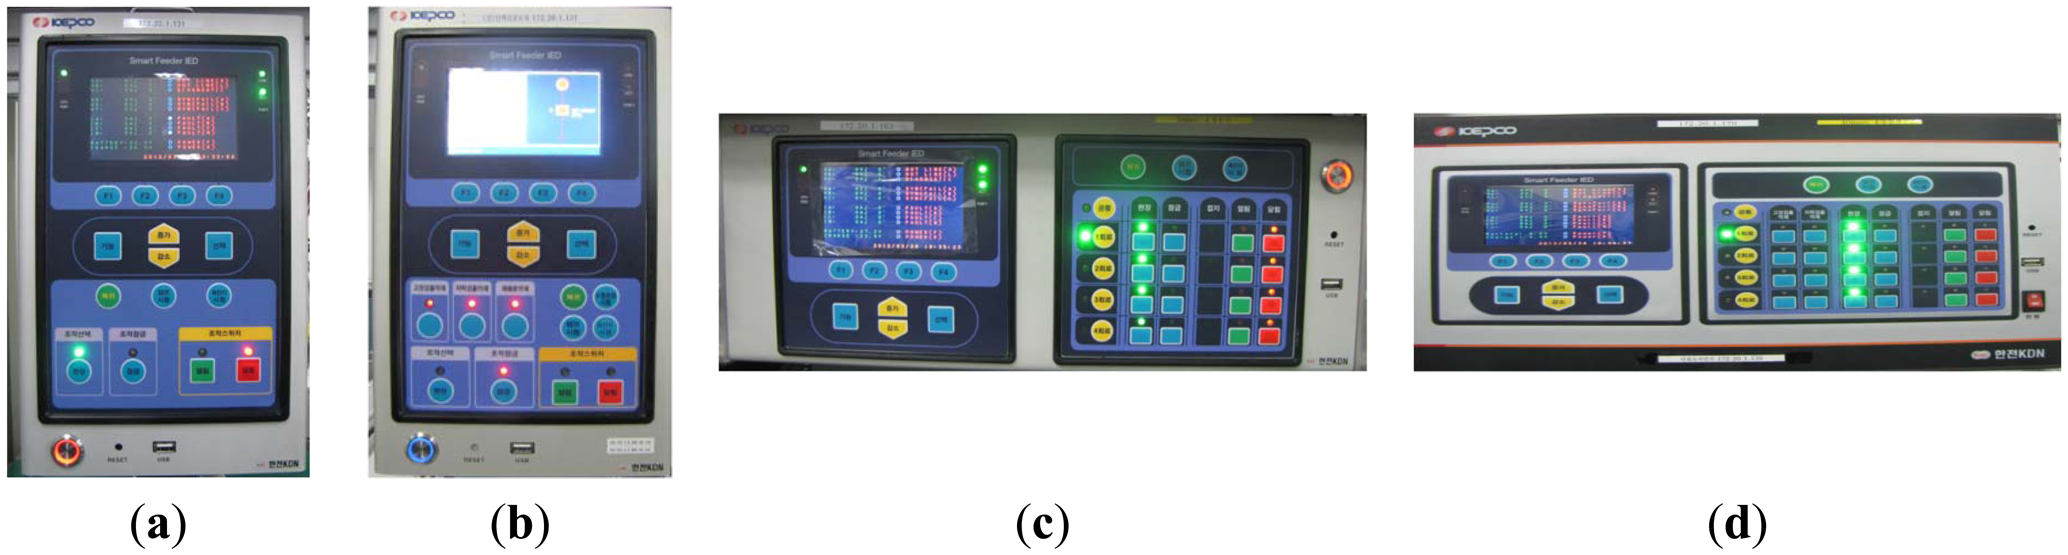
Application programs that can determine the fault location, and perform outage section restoration, were developed for fault restoration automation. Moreover, determination of fault location and automation of outage restoration, without the identification process, can be performed by developing a fault restoration process, using IEC61850 communication between devices. Four types of IEDs have been developed, based on IEC61850 communication, as shown in Figure 10. The fault restoration process of the KSDMS may be summarized as follows:
- Step 1
Detection of fault occurrence
- -
Upon an alarm signal (FI), the detection process is transferred from the field device (RTU or IED) to the main server, and the fault occurrence is detected by the alarm processor in the main server.
- Step 2
Fault removal: This is performed automatically by the protective device.
- Step 3
Fault location detection.
- -
Overcurrent protection section: The fault location is determined by the fault location program of Table 3, using the FI information, fault current values, and the location of DER. The fault location program filters losses or errors in the FI information.
- -
Communication protection section between the devices: The fault location is automatically detected, using communication between devices (IEDs), as illustrated in Figure 2.
- Step 4
Isolation of the fault location
- -
Overcurrent protection section: The switch list for the isolation of the detected section, mentioned in Step 3, is produced by the fault location program. The fault sections are then isolated by switching operation.
- -
Communication protection section between the devices: The fault location is automatically isolated.
- Step 5
Reclosing of the protective device
- Step 6
Restoration of outage location, other than fault location
- -
The outage section restoration program (service restoration of Table 3) produces a switch operation list, and then runs the switches sequentially.
- -
If a problem occurs during the automatic operation of the switches (i.e., unable to perform switch operation, due to a communication problem), the status is initialized, by performing Step 6 again.
- Step 7
The fault is restored, and crews are dispatched.
4. Testing of the KSDMS
The KSDMS was tested with three types. The objective and characteristics of each test are summarized in Table 4. As shown in the table, the test was divided into the unit function test, the integration test, and the practical field test. The unit function test and the integration test were performed in a lab environment. The performance and interrelation functions of platforms, applications, and terminal equipment were examined, through accuracy verification tests of applications, using a small-sized representative system, and by applying simulation data to an actual large-sized system. In the case of the field test, the KSDMS system and field devices were installed, and an artificial fault generator was used to test the automatic fault processing at the PTC in Gochang. Furthermore, periodic system analysis of the KSDMS system applications, and verification of the system voltage stabilization through control, were performed at two D/L systems in Jeju.
Table 5 shows the performance indices of each part of the KSDMS system that were verified through the test. Performance indices are divided into applications, platforms, and field devices. The accuracy of each application was then confirmed, by comparing it with commercial programs, or through a complete enumeration test. In terms of the complete enumeration test, a method was used that compares all analyzed statuses (the condition of the sampling extracted from a certain section) that can occur in the system, when comparable commercial programs with those functions do not exist. In the case of the platform, the number of acceptable nodes, as well as synchronization, was investigated; and failure management automation was examined for the field device (IED).
4.1. Unit Function and Integration Tests
The unit function test and integration test of KSDMS applications and platform have to be performed. The technical specifications of the function and integration tests were produced [33], and the tests were conducted based on this specification. The system was tested and inspected on a small demonstration system, and a large real system in the Jeju office of KEPCO. The integration test was conducted using the static and historical data in the Jeju Office of KEPCO, to test the relationships between the platform, application programs, and field devices. The function and integration test performances showed that the aforementioned performance evaluation criteria were satisfactory. The contents of the unit function and the integration test are summarized in Table 6.
Important results of the unit function and the integration test may be summarized as follows: The accuracy test result of the application program is depicted in Table 7, Figure 11, and Table 8, with regard to the status estimation, and the result of Voltage Var Optimization (VVO).
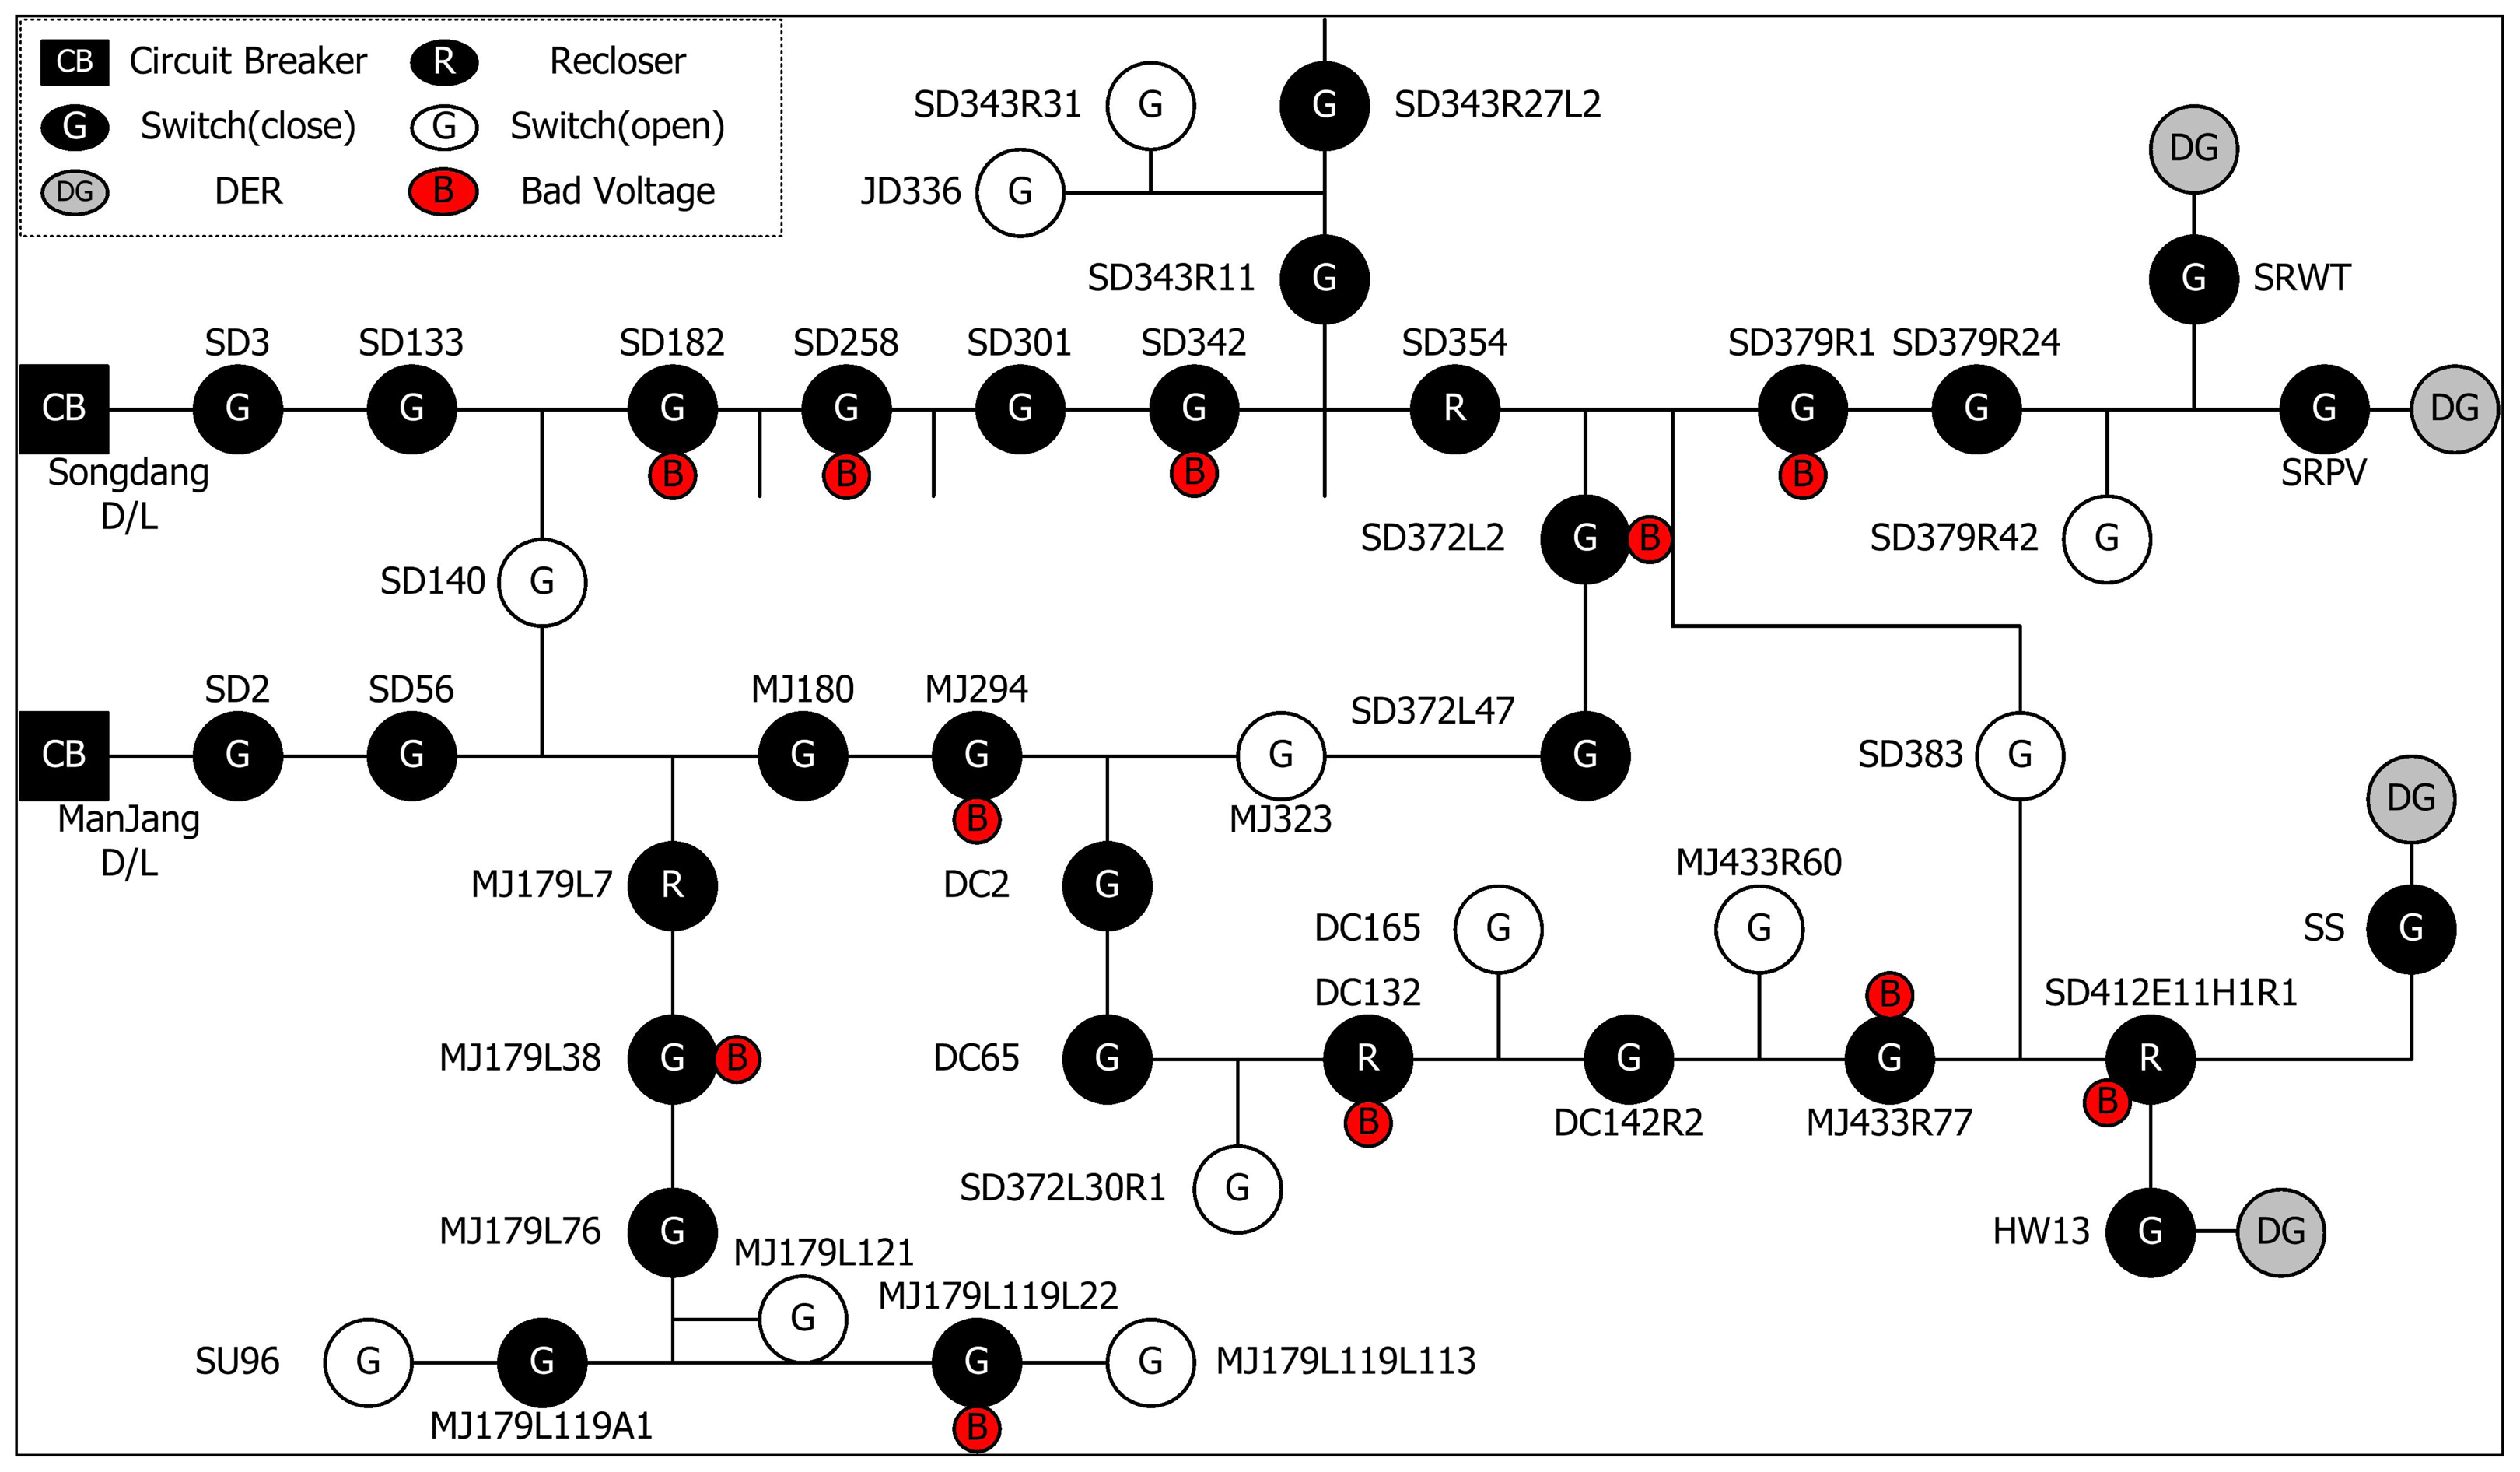
As shown in Figure 11, the bad data test of state estimation was conducted by two D/Ls (Songdang and Manjang), in the Jeju Office. The test system in Figure 11 includes one substation, two D/Ls, and a total of 154 buses, 67 switches, 34 feeder IEDs, and four dispersed generators. We used the simulation data for the section loads, and generations of the test system. A true value was set to the result of the power flow calculation, and the bad data of the voltage and current were injected into the test.
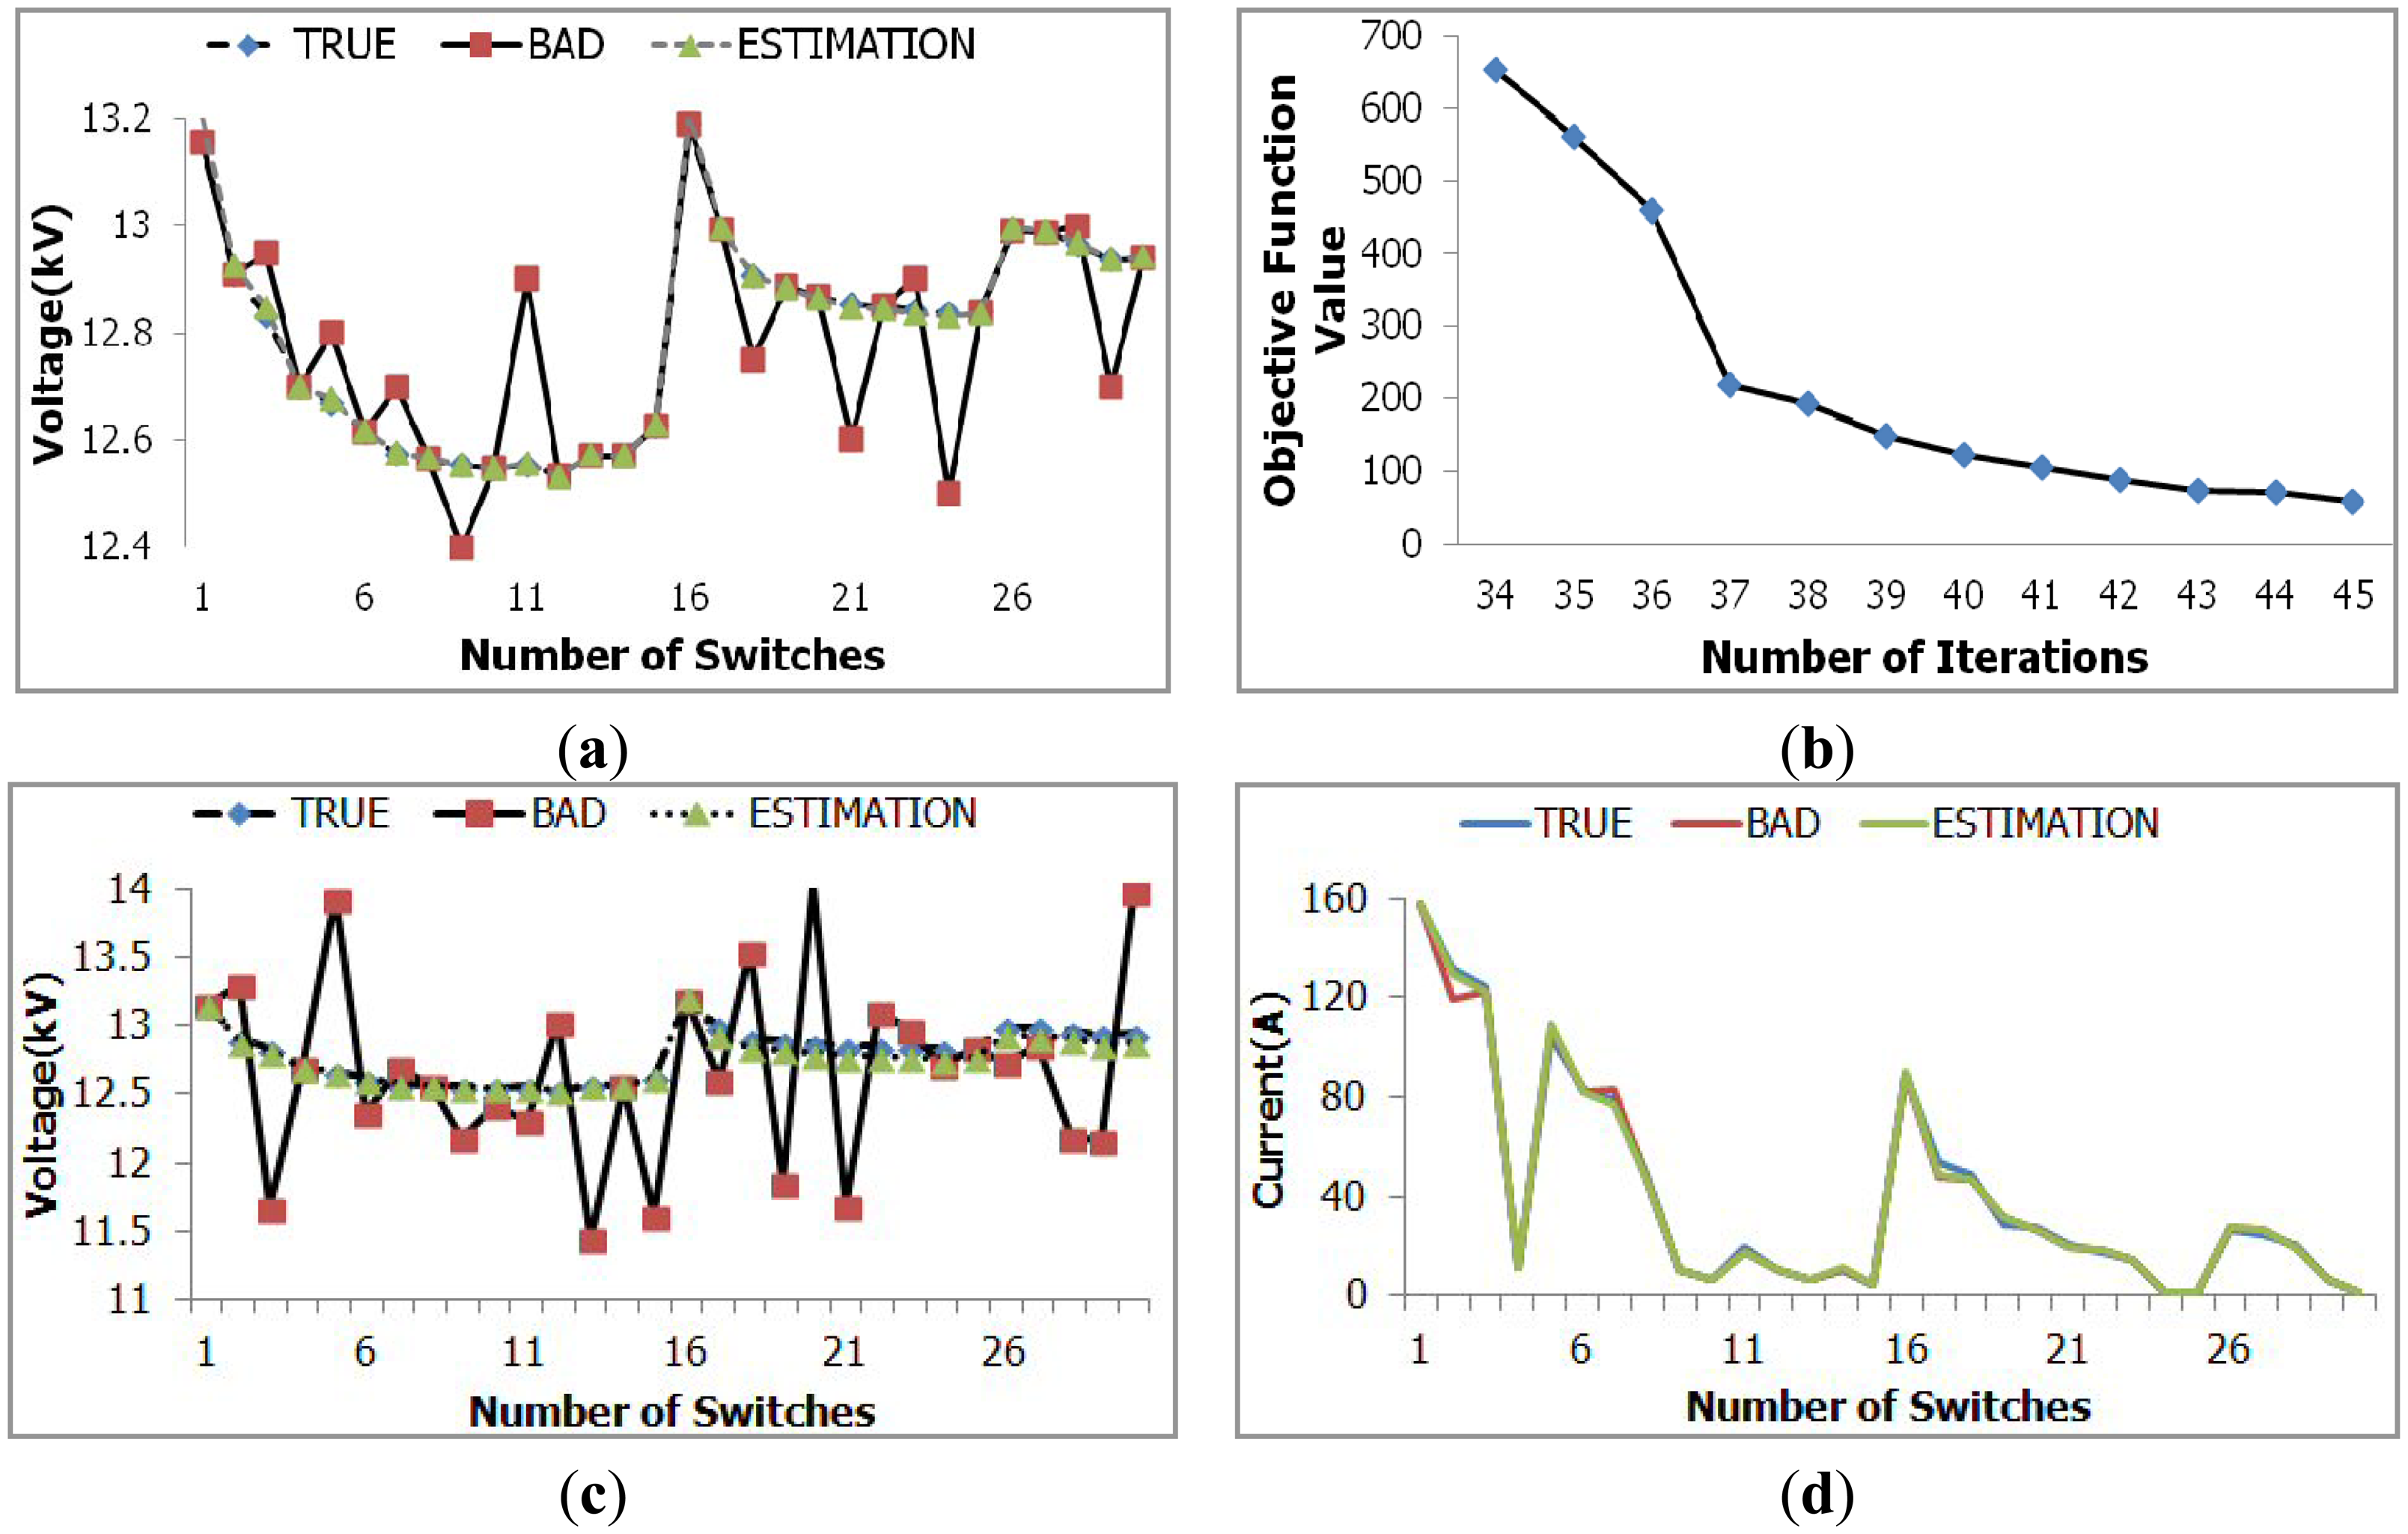
Overall bad data tests for the test system are summarized in Table 7. In the Table 7, random noise +α% means that the value ranges from +α% to −α%. The bad data test is composed of nine cases. The performance of state estimation for bad data filtering is compared, using the following equation:
Figure 12 shows the graphical results for test Case 1 and Case 8. As shown in Figure 12b, the objective function was decreased monotonically for convergence, and the inserted defective data were all filtered (Figure 12a,c,d). With this result, the KSDMS can be used in solving the error data problem of the acquired data of the TDAS, as mentioned earlier.
The VVO function test illustrated in Table 7 also showed that the test results of the entire system at the Jeju Office matched those of the specially developed complete enumeration test program (performing power flow calculation for all states). The test system of VVO includes seven substations, 65 D/Ls, and a total of 4911 buses, 3623 switches, and five dispersed generators. The control device includes 17 OLTCs, two SVRs, and five reactive powers of dispersed generators. We use the simulation data for the section loads and generations of the test system.
Table 8 shows that the VVO calculation result, and the complete enumeration test result of each case, were nearly consistent. The complete enumeration test is slightly different from the result of the VVO optimization calculation, because the former included test intervals. In the case of Tap of M.Tr and SVR, the recommended values per phase are shown.
The test result of synchronous data acquisition showed that the EMS point data, which are illustrated in Figure 7, were acquired within 5 s, at more than 200 RTUs. Therefore, the synchronous acquisition problem, a problem of the TDAS system, was solved.
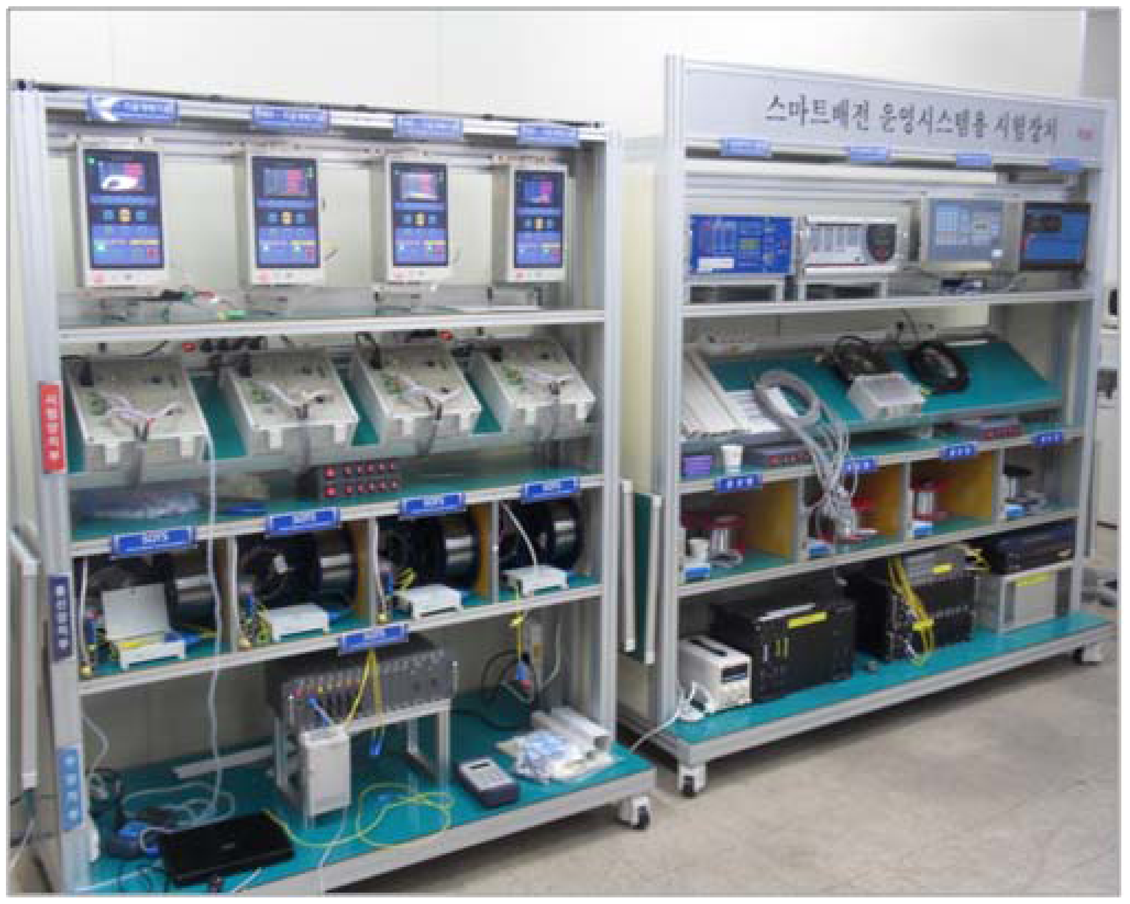
The test result of the fault restoration automation process is depicted in Figure 13. The fault location and indication were determined by the RTU simulator, and the fault current was input to the actual RTU Zig by Omicron. This process tested fault restoration, using communication between actual RTUs, and the execution of the application program (fault location determination and fault restoration). Figure 13 shows a photo of the simulator used for the failure management performance test. The test result verified that the fault restoration automation functions operated correctly.
The results of the unit and integration function tests are shown in Table 9. The function and integration tests confirmed that our performance objectives were met. The test results in Table 9 revealed the following: the overall functions and degree of precision satisfied the respective design levels at the outset. In the KSDMS, the operation cycle of the real-time application program in real systems was set to be about 5–15 min. The test results showed that the application program was satisfactory for various system scales, in terms of its precision and execution speed. Since the real-time application program can operate with a system of up to 20,000 buses, it can cover 150 to 200 D/Ls, based on the current distribution system size in Korea, making the program sufficient for the real-time control of real systems.
4.2. Practical Field Test
Although an empirical testing of an operation system requires at least 2 to 3 years of operation and tuning, the empirical field-testing of the overall developed system in this study was conducted over a relatively short period. This was to verify the field applicability of the system, and to complement some of the functions. The target system for the empirical test was divided into the following, according to their functions.
4.2.1. Field Test on Gochang PTC
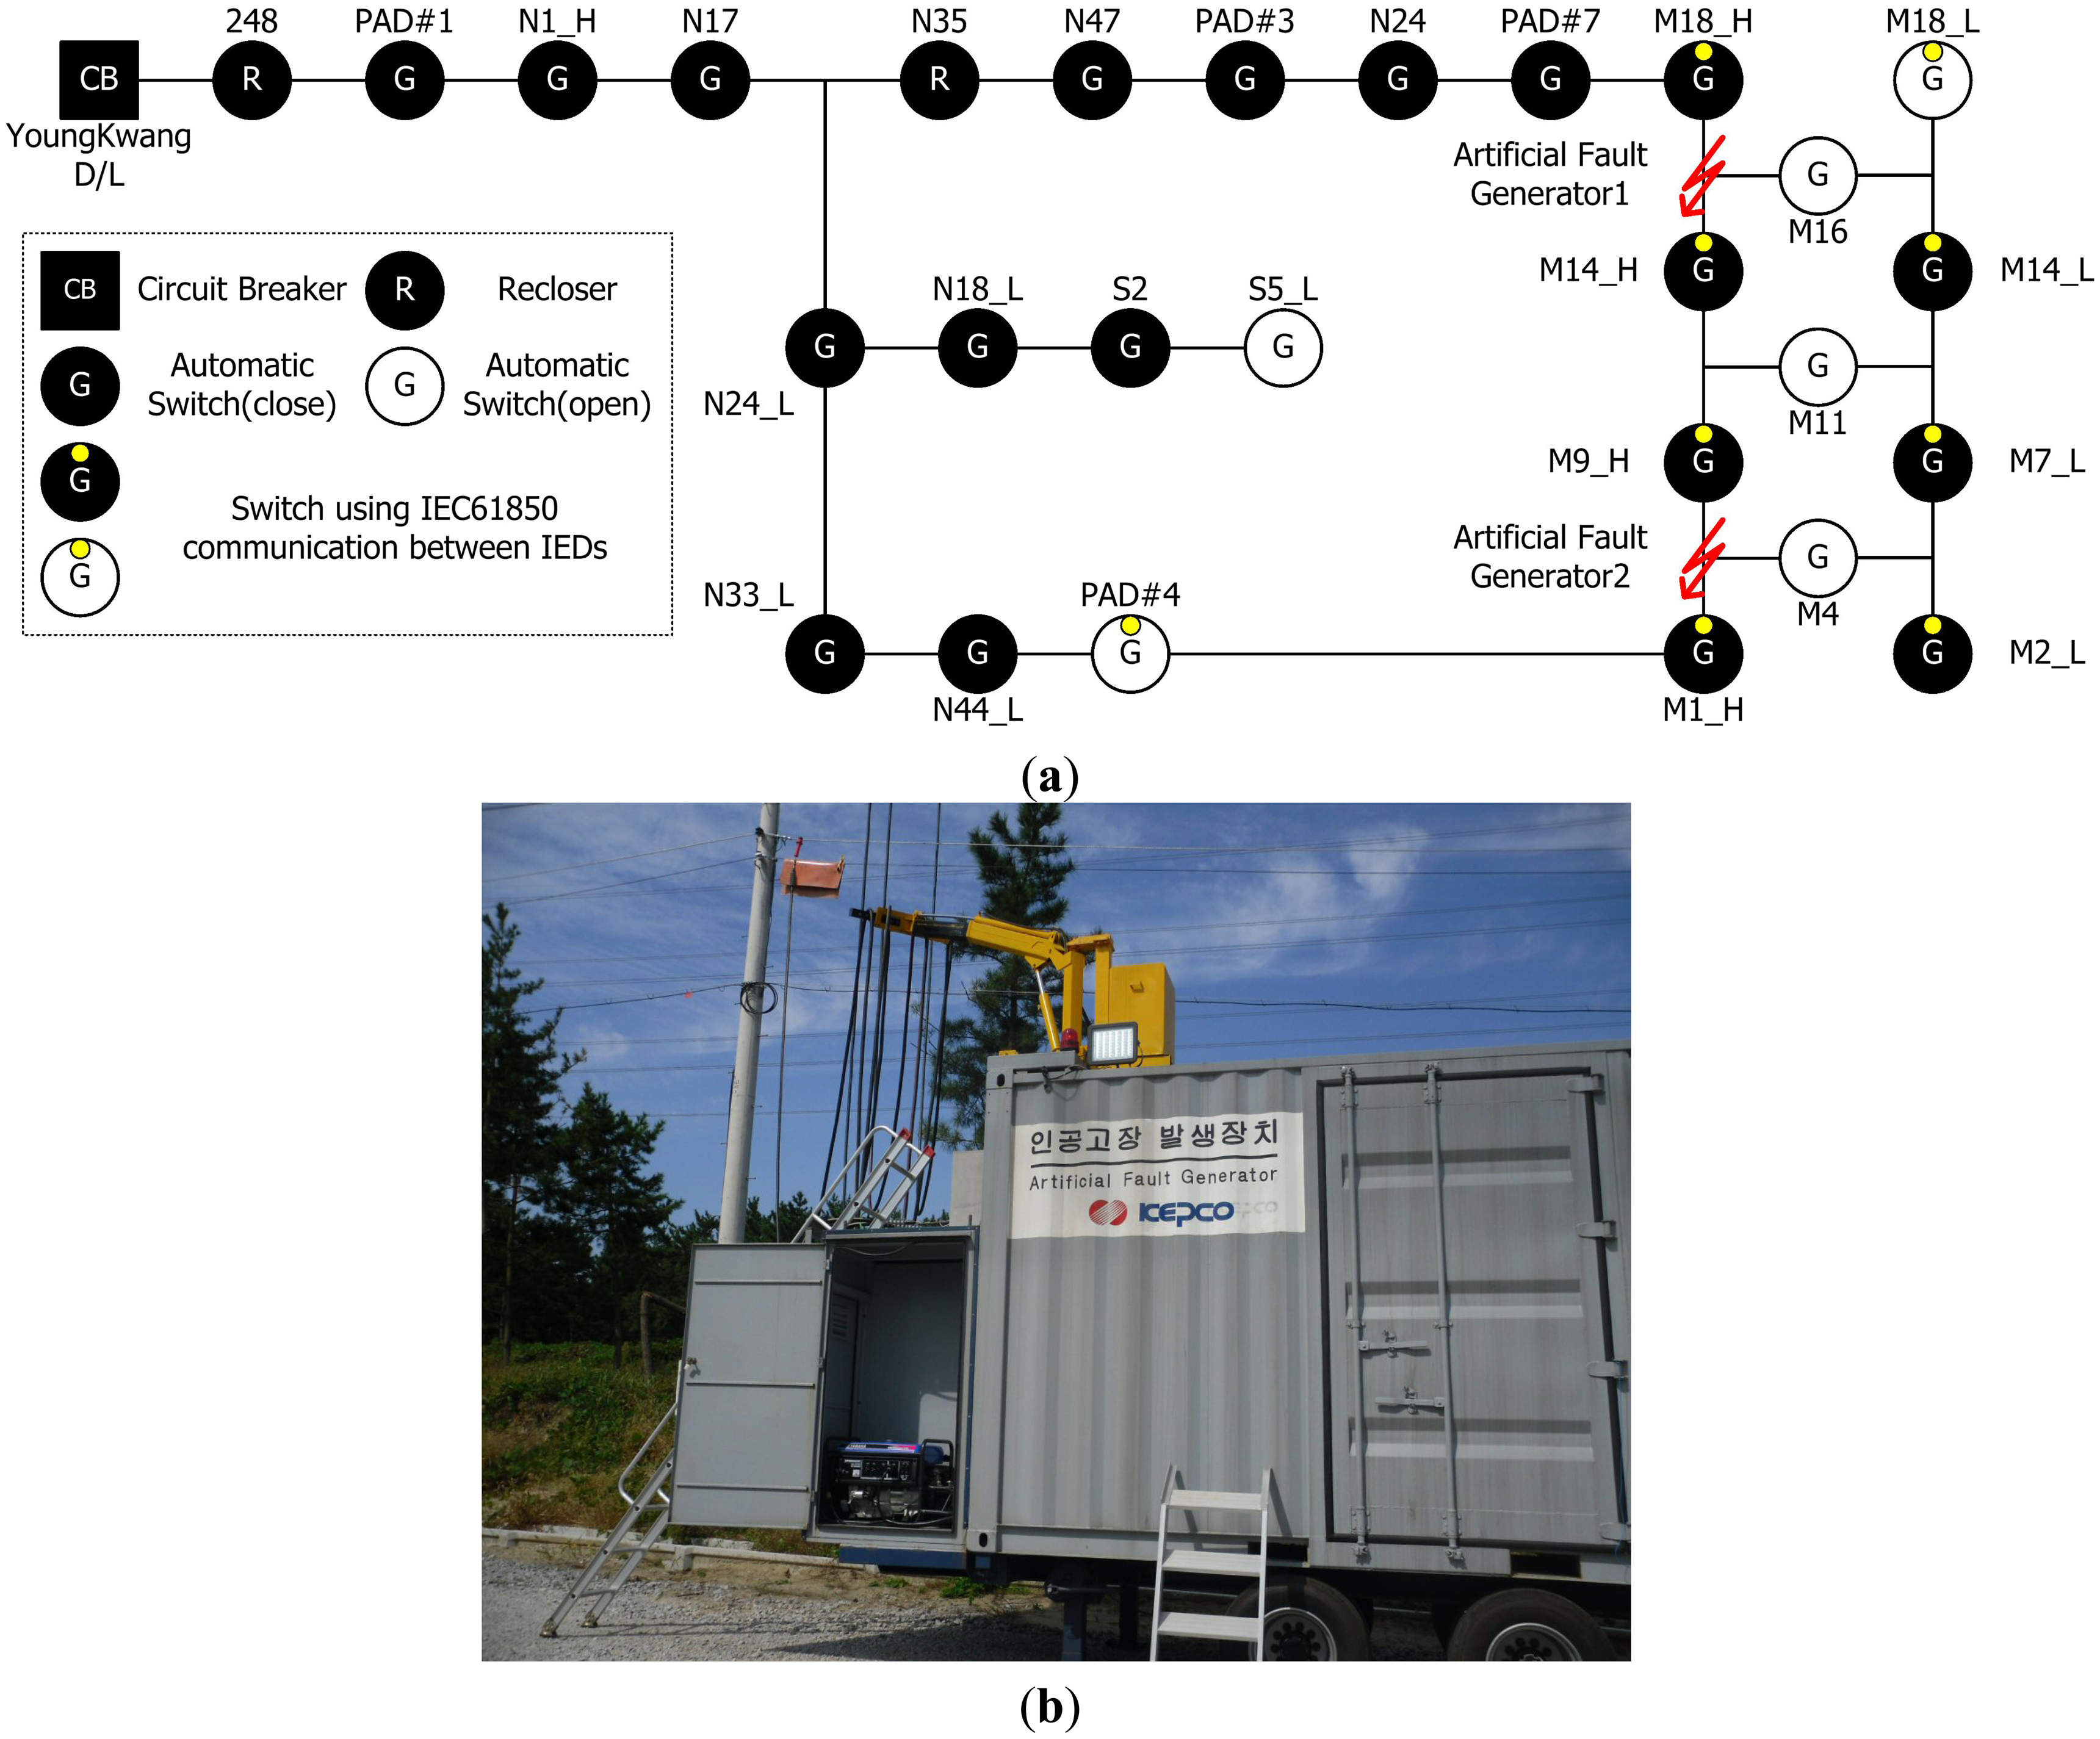
Gochang PTC is a facility for conducting empirical tests on real systems at KEPCO, which provides a total of 3-km lines of real systems. Real faults can be tested, by using the simulated fault occurrence device, and other related systems and devices. Therefore, the platform, related devices, and fault restoration of the KSDMS were tested at the Gochang PTC. Table 10 summarizes the details of the empirical test performed at the Gochang PTC. Figure 14 shows the system configuration, and the artificial fault generator, used at the Gochang PTC.
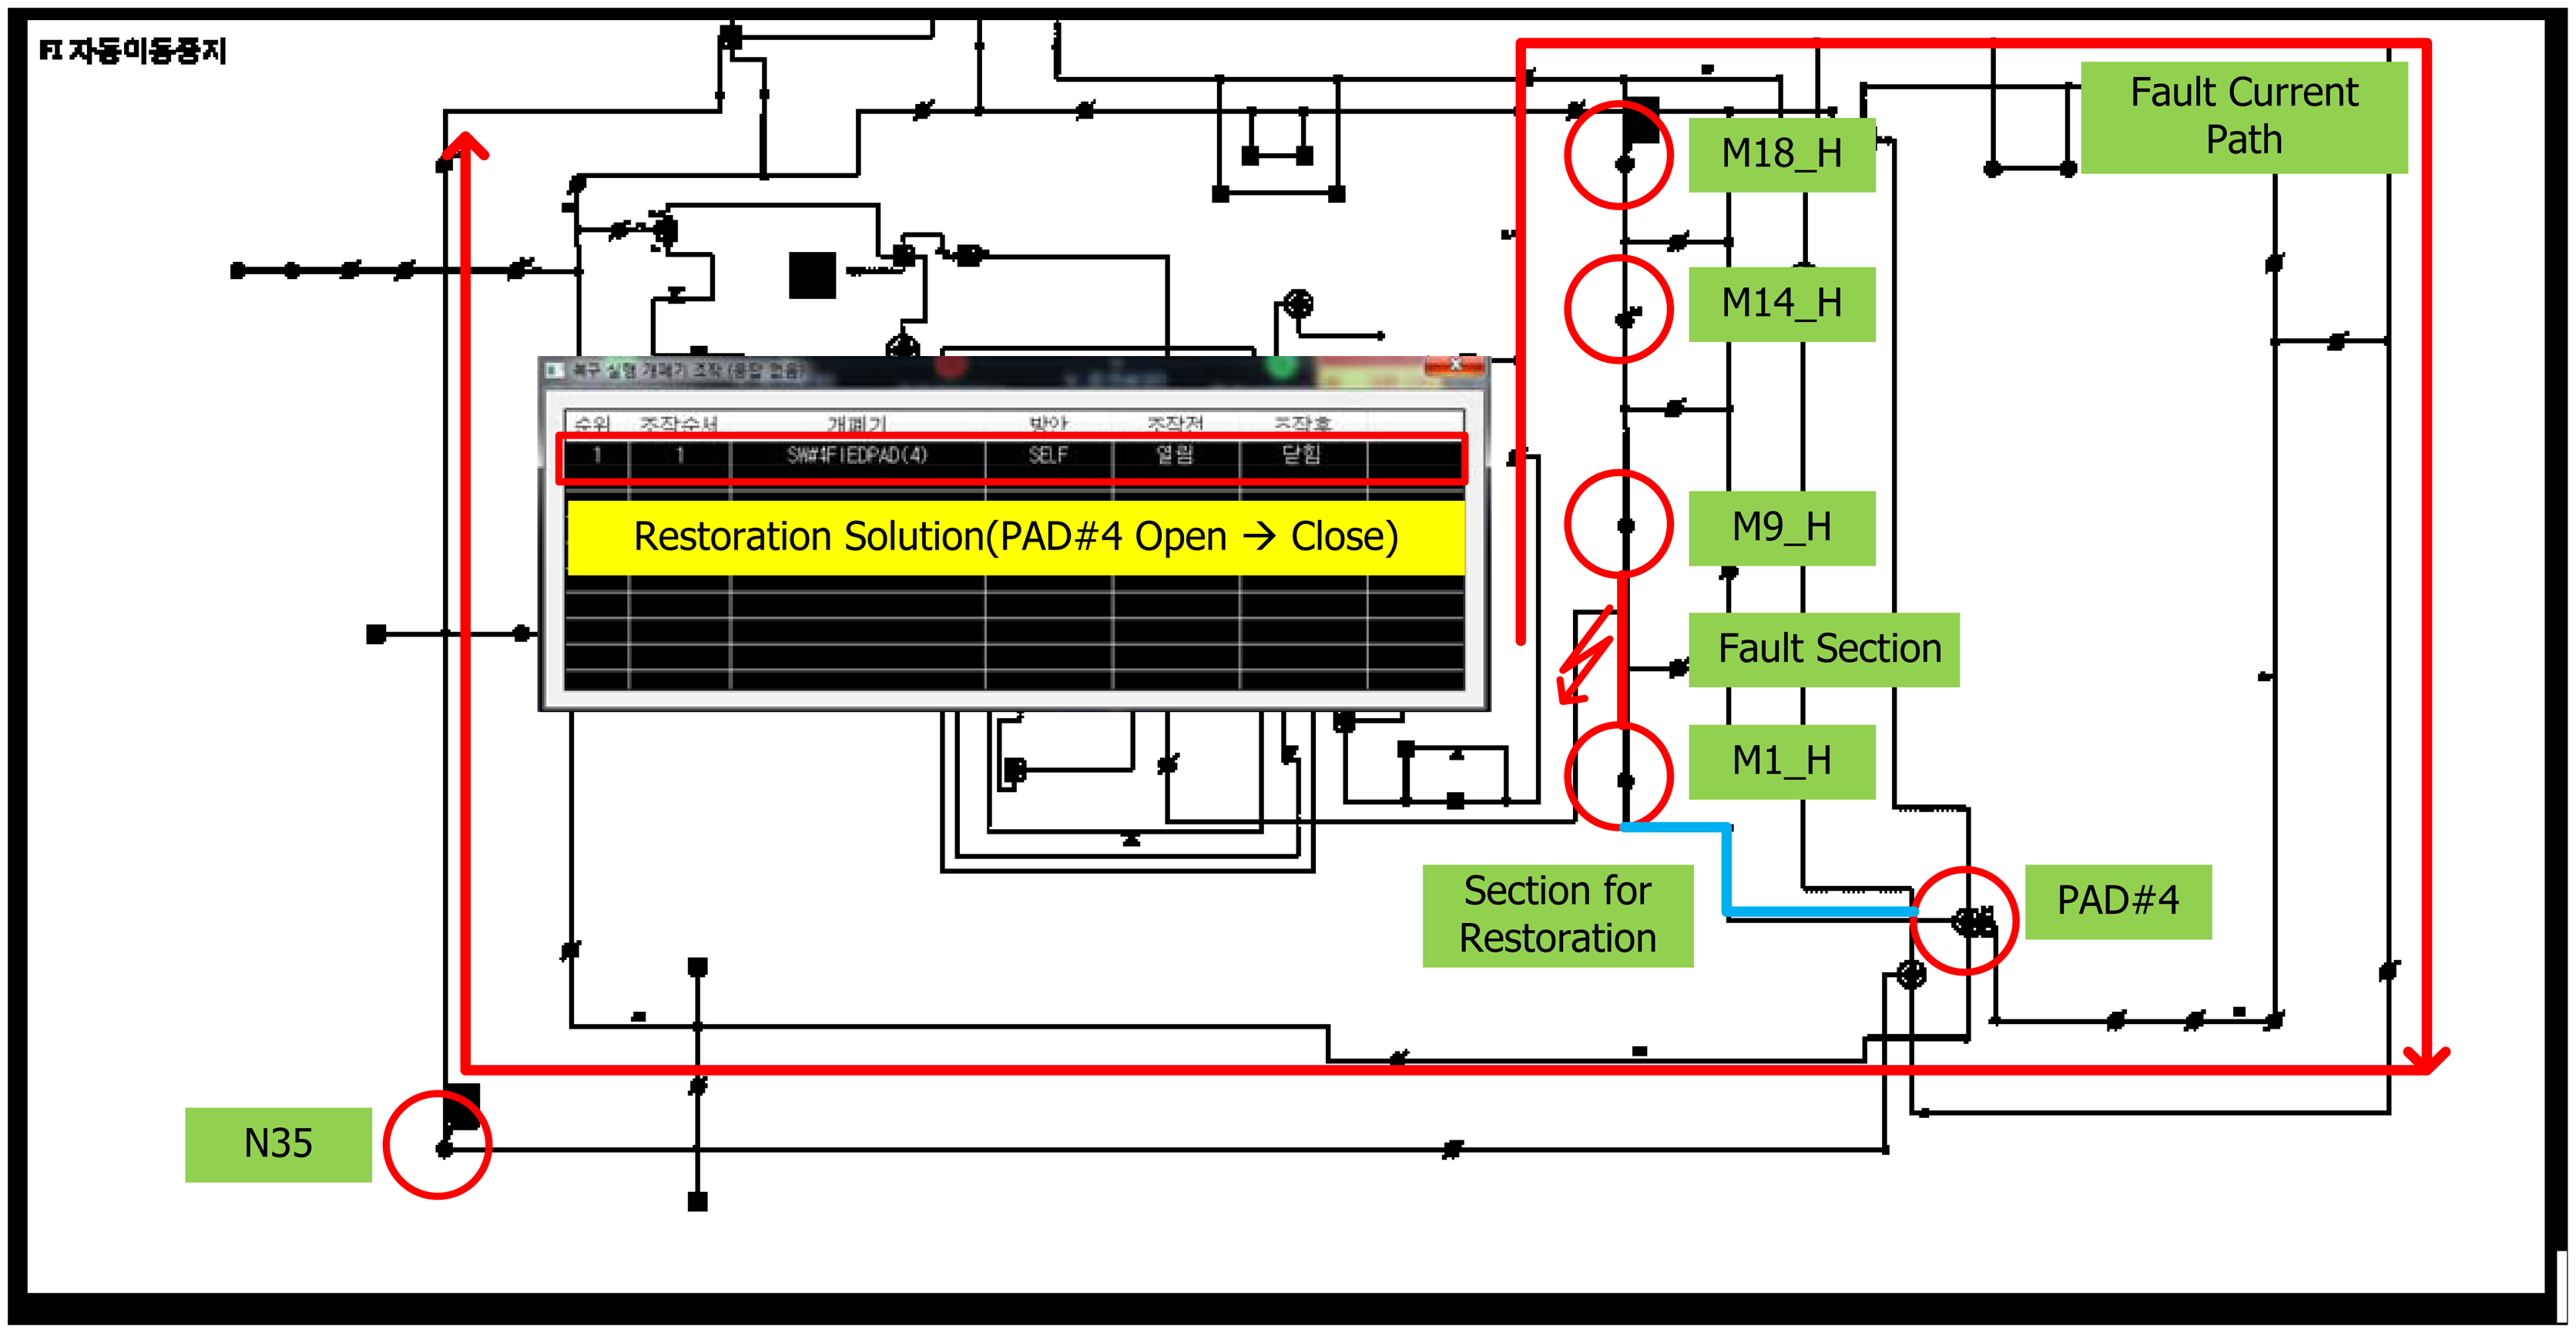
Figure 15 and Table 11 show the test result of fault restoration performed at the Gochang PTC. The fault restoration test consisted of the following steps:
- Step 1
Fault occurs between switch M9_H and M1_H
- Step 2
All switching devices on the fault current path detect the fault current
- Step 3
Recloser N35 trips to remove the fault current, and then switches M9_H and M1_H are tripped, using IEC61850 goose communication
- Step 4
Recloser N35 recloses
- Step 5
Service restoration program runs, and recommends the switching steps
- Step 6
Operator handles the switches (PAD#4 open → close)
The test was conducted for four cases, as shown in Table 7. The results revealed that in all four cases, the fault section was correctly identified, and an adequate recovery solution was extracted.
4.2.2. Field Test on Jeju Island
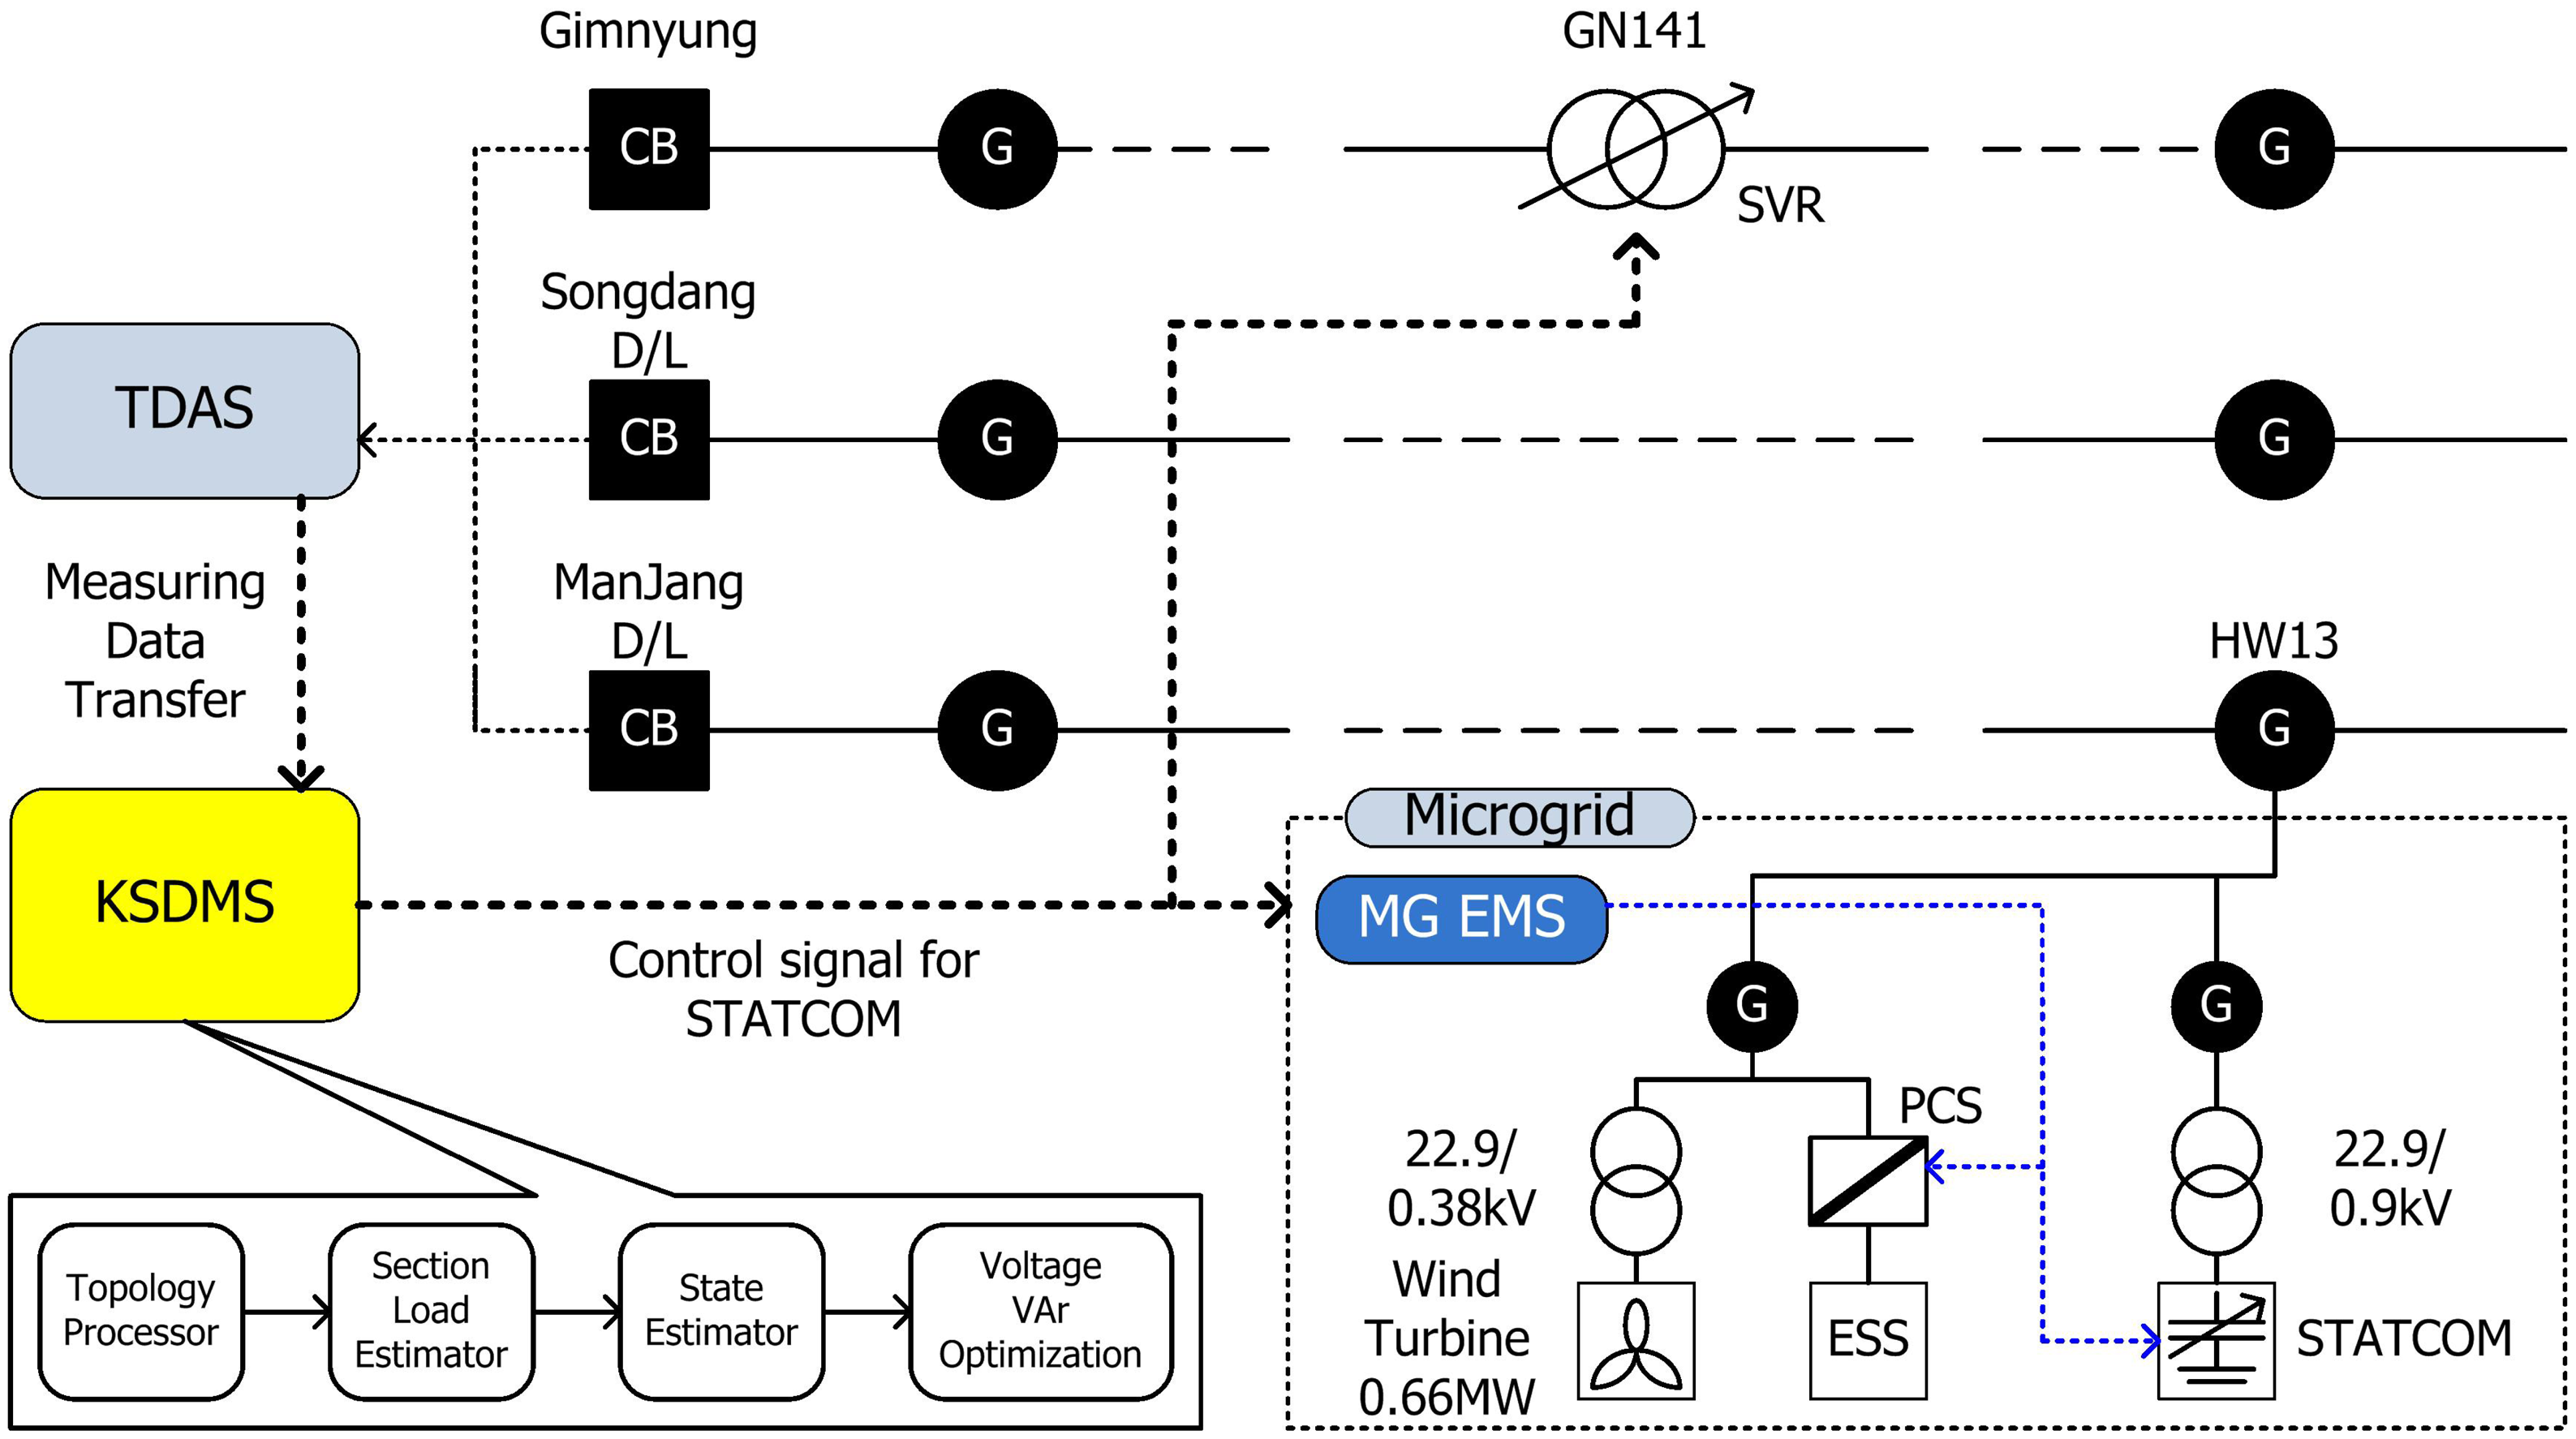
Control tests on field devices were conducted, by running real-time application programs on the systems around Sungsan and Jocheon S/S on Jeju. Figure 16 shows the overall structure of the test system. In this figure, at the end of the Manjang D/L in the Sungsan S/S, the distributed power, ESS, and system-interconnected Microgrid (MG), where STATCOM is installed, are configured. In addition, an SVR is installed at the Gimnyung D/L in the Jocheon S/S. The following parts were tested extensively, during the empirical test on the Jeju system.
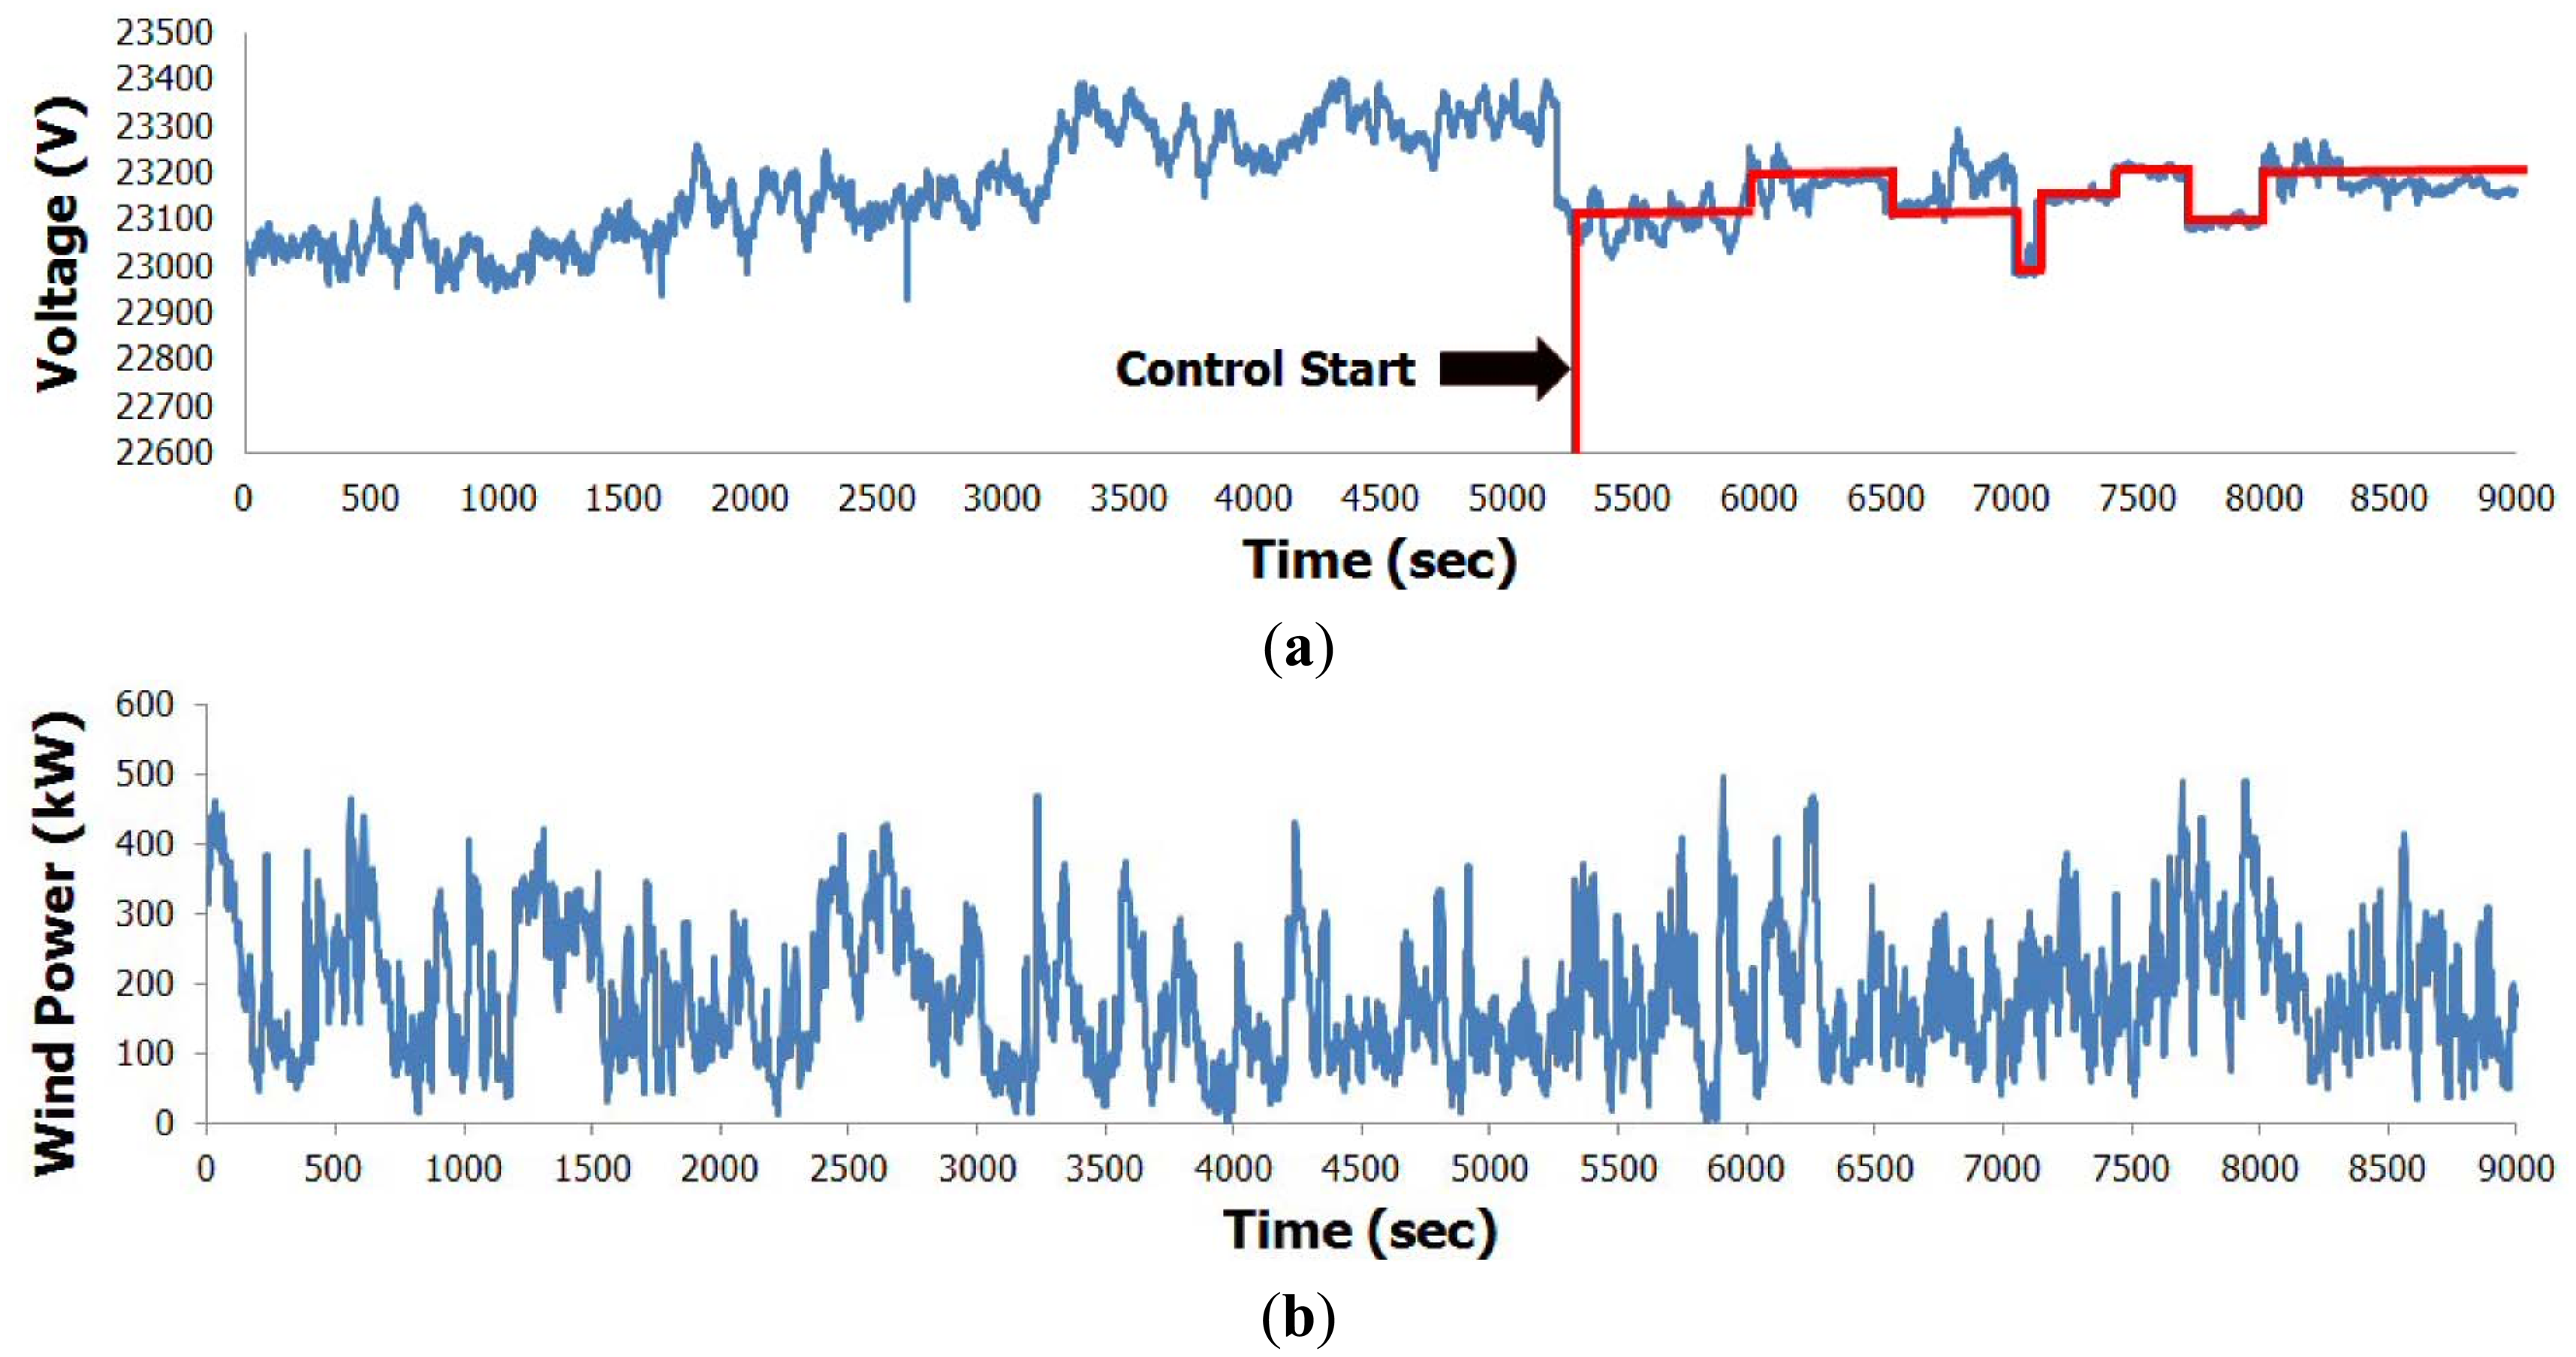
To verify the continuous controllability of the KSDMS VVO, we had it perform some operations. These included generating the recommended voltages, transmitting them to the connected equipment, and waiting for the equipment to respond, every five minutes. Once the equipment received the recommended voltage, we verified how it operated, based on the voltages. Figure 17 and Table 12 show the results of voltage control, at every five minutes. VVO in the KSDMS calculated the recommended voltages, which were transmitted to the MG EMS, and then to the STATCOM.
Figure 17a represents the voltage control results using KSDMS VVO, for the HW13 switch point of Figure 16. As shown in this figure, after the voltage control of VVO, the voltage fluctuation of connection point (HW13) of MG voltage is reduced. Figure 17b represents the wind power output, during the same time of voltage control. This figure shows significant fluctuation of the wind power output.
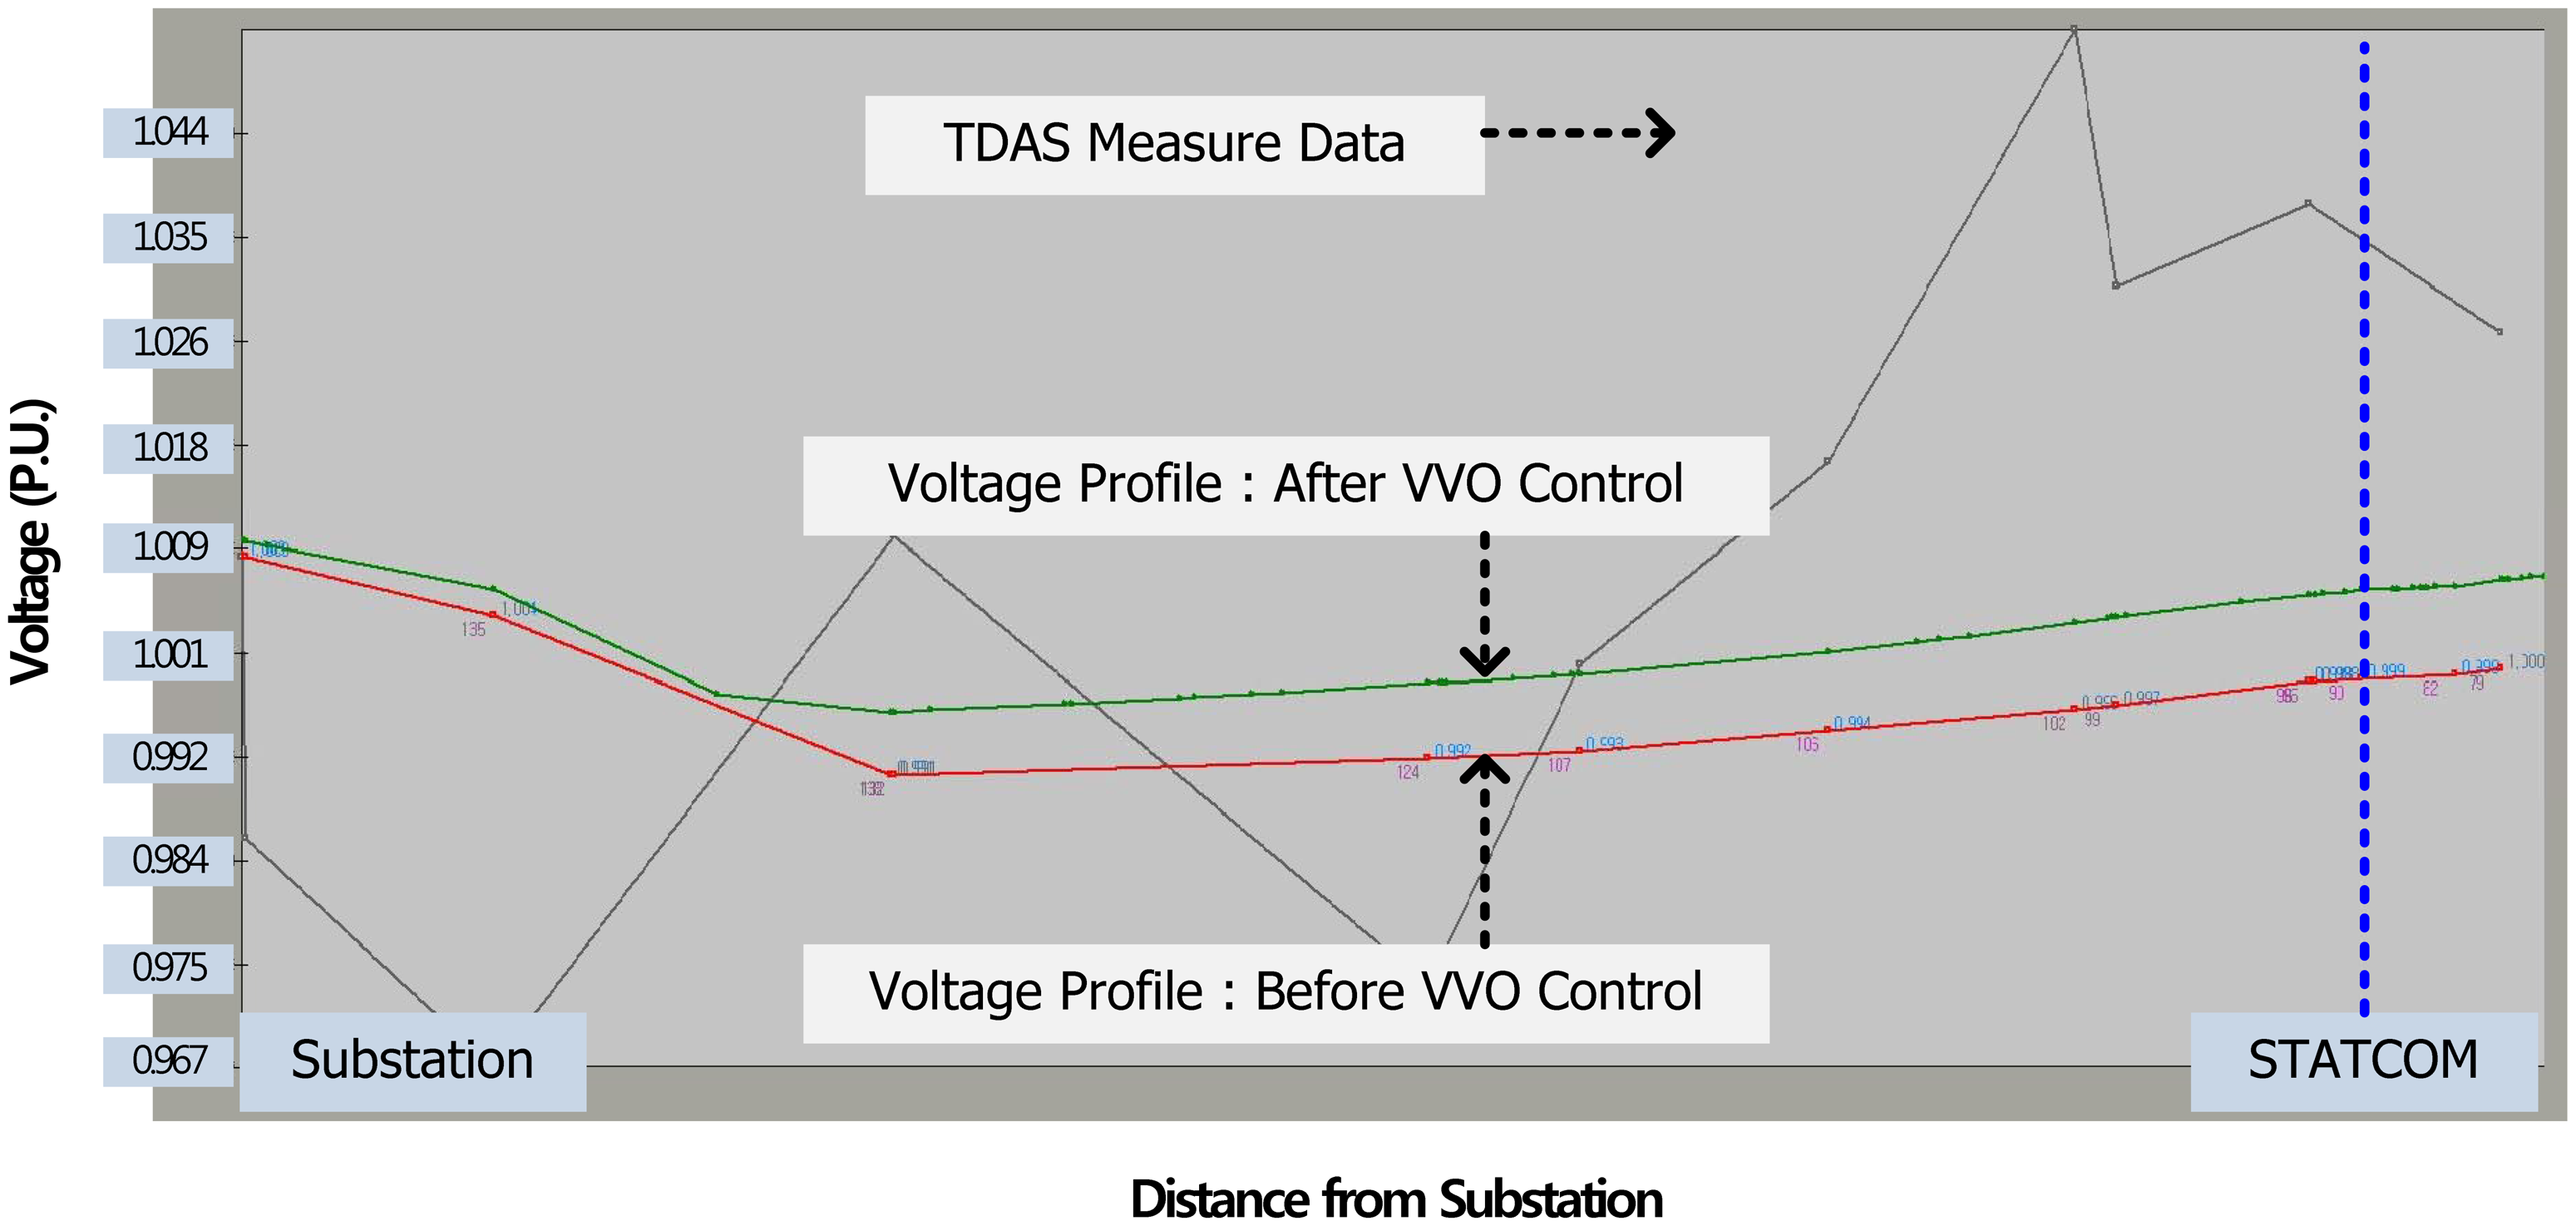
Figure 18 shows the result of the controlling reactive power of VVO on the STATCOM. Figure 18 shows the voltage profiles before, and after, the VVO control. The X-axis represents the location of the distribution line, from substation to end point. The STATCOM is located at the dotted line point. As shown in this figure, VVO was recommended to increase the reactive power output of the STACOM from 104 kVAr to 403 kVAr, which confirmed that the voltage profile increased slightly. The control frequency varied from 1 min to 15 min, and the minimum of 5 min frequency for periodical analysis and control was determined to be appropriate for the application programs of the KSDMS. This was based on the response and action tests of the field devices, data transmission, and confirmation over the HMI.
The above test results showed the field applicability of the developed system. The minimum period for real-time system analysis and control was determined to be approximately 5 min. In the KSDMS, a cycle of 5 to 15 min was designed for real-time control. The functional test demonstrated that a shorter cycle (<1 min) could be achieved, in terms of the execution speed of the application program, and the data processing size of the system. However, by the empirical test conducted on systems in Gochang and Jeju, the optimal minimum cycle was around 5 min for real-time control, taking into account the response speed of the field equipment, and the communication environment.
5. Conclusions
This paper summarized the development results of a next-generation distribution and operation system. Various functions for the next-generation DMS were developed and tested, to solve several problems of the existing distribution automation system. The application programs for real-time mode analysis and control, and a platform structure to receive the programs, as well as its functions, were developed and tested, to increase the receptivity of the DER. Through tests, its field applicability was examined, and it was determined that there were no major problems. In addition, international-standard-based systems were developed, to secure the standardization and compatibility of the system. The automation of fault restoration using IEC61850-based communication between the field devices was implemented, and the empirical test at the Gochang PTC showed no field applicability problems, regarding its functions.
The conversion of the existing systems to the next-generation DMS has been accelerated, for two main reasons: First, the existing operation systems have deteriorated, and cannot accept DER interconnection or AMI, which has become an issue of concern. Thus, a distribution company prefers a system that can accept all the expected models of inflow in the future, and that has advanced functions. Second, the operators are rapidly changing. In order to suit newly employed experienced operators in the field, various application programs are required, to assist them in decision-making.
The development and testing of the KSDMS prototype were completed. A long-term empirical test and tuning projects are underway, with the distribution system (three D/L) at the Shinan region of Jeonnam Province in Korea, which started November, 2012. This region where the empirical project is now underway has more capacity of DER per D/L (7 MW on average of DER per D/L), than any other region in Korea. Therefore, the KSDMS will be implemented at all offices of KEPCO, starting from 2015, after the completion of the empirical test.
Acknowledgments
This work was supported by Korea Institute of Energy Technology Evaluation & Planning (KETEP) grant funded by Korea Government Ministry of Trade, Industry & Energy (No. 20123010020080).
Conflicts of Interest
The authors declare no conflict of interest.
References
- Seal, B.; Simmins, J.; McGranaghan, M.; Dugan, R.; Godfrey, T.; Uluski, B. Smart distribution feeders and control centers in a smart grid world. Proceedings of the DistribuTECH2013, San Diego, CA, USA, 29–31 January 2013; pp. 107–134.
- Ha, B.-N. Large-scale distribution automation system. Electr. J. 2002, 306, 18–26. [Google Scholar]
- Ha, B.-N.; Han, Y.-H.; Han, B.-S.; Lee, H.-H. The study on economic evaluation for investment cost when the distribution automation system is applied. Trans. Korean Inst. Electr. Eng. 2003, 52A, 407–413. [Google Scholar]
- Lee, S.-W.; Ha, B.-N.; Seo, I.-Y.; Jang, M.-J. Application of data processing technology on large clusters to distribution automation system. Trans. Korean Inst. Electr. Eng. 2011, 60, 245–251. [Google Scholar]
- Bishop, A.K. Control and supervision of Sellafield electrical distribution system using a computer-based telecontrol system. Power Eng. J. 1990, 4, 149–156. [Google Scholar]
- Oono, H.; Kawaharasaki, M.; Kawai, M.; Nishi, A.; Morishita, T.; Katsuyama, M. A new large scale DAS in CEPCO. IEEE Trans. Power Syst. 1992, 7, 558–564. [Google Scholar]
- Xing, W.; Yu, Y.; Xiao, J.; Wang, R. A PC-based distribution automated mapping/facility management system. Int. J. Electr. Power Energy Syst. 1998, 20, 405–409. [Google Scholar]
- Ha, B.-N. Comparison with DAS technologies of domestic and foreign countries. Electrical J. 2002, 308, 47–56. [Google Scholar]
- Park, J.-S.; Lim, S.-I. CIM based distribution automation simulator. J. Korean Inst. Illum. Electr. Install. Eng. 2013, 27, 87–94. [Google Scholar]
- Patton, J.B.; Rizy, D.T.; Lawler, J.S. Applications software for modeling distribution automation operations on the Athens utilities board. IEEE Trans. Power Deliv. 1990, 5, 1019–1025. [Google Scholar]
- Cassel, W.R. Distribution management systems: Functions and payback. IEEE Trans. Power Syst. 1993, 8, 796–801. [Google Scholar]
- Roytelman, I.; Wee, B.K.; Lugtu, R.L. Volt/VAr control algorithm for modern distribution management system. IEEE Trans. Power Syst. 1995, 10, 1454–1460. [Google Scholar]
- Singh, N.; Kliokys, E.; Feldmann, H.; Kussel, R.; Chrustowski, R.; Jaborowicz, C. Power system modeling and analysis in a mixed energy management and distribution management system. IEEE Trans. Power Syst. 1998, 13, 1143–1149. [Google Scholar]
- Saric, A.T.; Ciric, R.M. Multi-objective integration of real-time functions in distribution management system. Int. J. Electr. Power Energy Syst. 2003, 25, 247–256. [Google Scholar]
- Shafiu, A.; Jenkins, N.; Strbac, G. Measurement location for state estimation of distribution networks with generation. IEE Proc. Gener. Transm. Distrib. 2005, 152, 240–246. [Google Scholar]
- Baxevanos, I.S.; Labridis, D.P. Software agents situated in primary distribution networks: A cooperative system for fault and power restoration management. IEEE Trans. Power Deliv. 2007, 22, 2378–2385. [Google Scholar]
- Fan, J.; Borlase, S. The evolution of distribution. IEEE Power Energy Mag. 2009, 7, 63–68. [Google Scholar]
- Hu, Y.; Kuh, A.; Kavcic, A.; Yang, T. A belief propagation based power distribution system state estimator. IEEE Comput. Intel. Mag. 2011, 6, 36–46. [Google Scholar]
- Dugan, R.C.; McGranaghan, M. Sim city. IEEE Power Energy Mag. 2011, 9, 74–81. [Google Scholar]
- Vargas, A.; Samper, M.E. Real-time monitoring and economic dispatch of smart distribution grids: High performance algorithms for DMS applications. IEEE Trans. Smart Gird 2012, 3, 866–877. [Google Scholar]
- Song, I.-K.; Jung, W.-W.; Kim, J.-Y.; Yun, S.-Y.; Choi, J.-H.; Ahn, S.-J. Operation schemes of smart distribution networks with distributed energy resources for loss reduction and service restoration. IEEE Trans. Smart Gird 2013, 4, 367–374. [Google Scholar]
- Ren, F.; Zhang, M.; Sutanto, D. A multi-agent solution to distribution system management by considering distributed generators. IEEE Trans. Power Syst. 2013, 28, 1442–1451. [Google Scholar]
- Li, Z.; Yang, F.; Mohagheghi, S.; Wang, Z.; Tournier, J.C.; Wang, Y. Toward smart distribution management by integrating advanced metering infrastructure. Electr. Power Syst. Res. 2013, 105, 51–55. [Google Scholar]
- Song, I.-K. Smart Distribution Management System; TR.1324.S2012.0346; Korea Electric Power Corporation: Daejeon, Korea, 2012. [Google Scholar]
- Yun, S.-Y.; Cho, Y.-S.; Lee, W.-H.; Lee, J.; Sohn, J.-M. Data modeling for developing the baseline network analysis software of Korean EMS system. Trans. Korean Inst. Electr. Eng. 2009, 58, 1842–1848. [Google Scholar]
- Yun, S.-Y.; Chu, C.-M.; Kwan, S.-C.; Song, I.-K.; Lim, S.-I. Development of section load estimation program for smart distribution management system. Trans. Korean Inst. Electr. Eng. 2012, 61, 1083–1090. [Google Scholar]
- Yun, S.-Y.; Cho, Y.-S. Development of real-time load flow program for Korean energy management system. Trans. Korean Inst. Electr. Eng. 2010, 59, 242–247. [Google Scholar]
- Hwang, P.-I.; Jeong, M.-G.; Moon, S.-I.; Song, I.-K. Volt/Var optimization of the smart distribution management system. Proceedings of the International Conference on Electricity Distribution (CIRED), Stockholm, Sweden, 10–13 June 2013; pp. 1–5.
- Lim, S.-I.; Lee, S.-J.; Choi, M.-S.; Lim, D.-J.; Ha, B.-N. Service restoration methodology for multiple fault case in distribution systems. IEEE Trans. Power Syst. 2006, 21, 1638–1644. [Google Scholar]
- Cho, S.-M.; Shin, H.-S.; Cho, B.-H.; Park, J.-H.; Kim, J.-C. Power distribution network reconfiguration for loss minimization using low current switch opening methods. ICIC Express Lett. 2012, 6, 1247–1251. [Google Scholar]
- Chu, C.-M.; Yun, S.-Y.; Kwan, S.-C.; Chu, K.-Y.; Jin, Y.-K.; Choi, M.-S. Development of protection coordination algorithm for smart distribution management system using communication method based on IEC61850. Trans. Korean Inst. Electr. Eng. 2012, 61, 1412–1419. [Google Scholar]
- International Electrotechnical Commission. Short Circuit Currents in Three-Phase a.c. Systems—Part0: Calculation of Currents; IEC Standard 60909-0; IEC: Geneva, Switzerland, 2001. [Google Scholar]
- Yun, S.-Y. SDMS Technical Specification (Version 2.0) (TM.1324.S2012.0346); Korea Electric Power Corporation: Daejeon, Korea, 2011. [Google Scholar]
- Soman, S.A.; Khaparde, S.A.; Pandit, S. Computational Methods for Large Sparse Power Systems Analysis—An Object Oriented Approach; Kluwer Academic Publishers: Boston, MA, USA, 2002. [Google Scholar]
- International Electrotechnical Commission. Application Integration at Electric Utilities-System Interfaces for Distribution Management-Part3: Interface for Network Operations; IEC Standard 61968-3; IEC: Geneva, Switzerland, 2004. [Google Scholar]
- Mahnke, M.; Leitner, S.-H.; Damm, M. OPC Unified Architecture; Springer: Berlin, Germany, 2009. [Google Scholar]
- International Electrotechnical Commission. Communication Networks and Systems in Substations-All Parts; IEC Standard 61850-SER; IEC: Geneva, Switzerland, 2012. [Google Scholar]
- Institute of Electrical and Electronics Engineers. IEEE Standard for Electric Power Systems Communications-Distributed Network Protocol (DNP3); IEEE Standard 1815; IEEE: New York, NY, USA, 2012. [Google Scholar]


| No. | Items | Statistics |
|---|---|---|
| 1 | Number of Distribution Lines | 7,493 (overhead)/1,608 (underground) |
| 2 | Length (circuit-km) | 213,687 (HV)/233,449 (LV) |
| 3 | Number of Pole/Pad Transformer | 2,042,631 (105,090 MVA) |
| 4 | Capacity of Transformer | 10∼150 kVA |
| 5 | Interruptions | 0.115 (SAIFI)/3.2 min (SAIDI) |
| 6 | Number of Line Cap./Step Voltage Regulator | 11 (1,100 kVAr)/662 |
| 7 | Underground (%) | 15.29 |
| 8 | Communication (%) | Optical fiber (68), telephone wires (15), trunked radio system (TRS, 8), mobile data (8), CDMA (1) |
| 9 | Automatic switches (%) | 35% of total 127,000 line switches |
| No | Objects | Development |
| 1 | Increase of DER receptivity | Development of application software and common platform, for real-time analysis and control of network status |
| 2 | Increase of standardization and compatibility | Development of system architecture and IED (intelligent electronic device), based on international standards (IEC61970/61968/61850) |
| 3 | Automatic fault detection, isolation and restoration (FDIR) | Fault detection and isolation between IEDs communication, and development and field test of FDIR applications and processes |
| Mode | Application | Description |
|---|---|---|
| Real-time | Topology processor | Creation of buses and islands using connectivity information and switch status, and checking the live/dead status of devices [25] |
| Section load estimator | Section (between automatic switches) load estimation, using automatic switch measurements [26] | |
| State estimator | State estimation using switch measurements (voltage, current, angle), and the results of section load estimator. Uses the Weighted Least Square (WLS) algorithm and network reduction method [26] | |
| Power flow | Real-time power flow, based on the result of state estimator (Newton-Raphson method, Full coupled Jacobean) [27] | |
| Voltage VAr optimization | Recommendation of voltage control devices (OLTC, SVR, Shunt Cap (Sh. C), Static VAr Compensator (SVC)/Static Synchronous Compensator (STATCOM), DER P/Q), for voltage violation removal and loss minimization. Uses the mixed integer linear programming (MILP) algorithm, and result of power flow results for the basecase [28] | |
| Section load pattern | Creation of section load pattern (per 15 min, per day type (workday, weekend, holiday), per season type (spring/fall, summer, winter)), using the results of state estimator or power flow | |
| Event driven | Fault location | Detection of fault section, using fault indicator (FI) and DER interconnection information |
| Service restoration | Provision of switch operation sequence for interruption area, excluding fault sections [29] | |
| Study | Network reconfiguration | Recommendation of switching sequence for loss minimization and load balancing. Uses the Genetic Algorithm (GA) [30] |
| Protection coordination | Recalculation of setting values of protective devices (communication and over current), for network topology change [31] | |
| Short circuit analysis | Calculation of fault current (including the contribution of renewable energy), using IEC60909 [32] |
| Test | Object | Test Conditions |
|---|---|---|
| Unit function test (June 2010–May 2011) | Individual function tests of platforms, applications, and field devices (IEDs) | Use of simulation data from the example system, and the actual system |
| Integration test (June 2011–May 2012) | Interlocking function tests of platforms, applications, and terminal equipment | |
| Practical field test (June 2012–May 2013) | Actual systems in Gochang and Jeju were examined, using the data from actual system measurements |
| Items | Performance Criteria | |
|---|---|---|
| Application program | Accuracy | Within 0.5% accuracy for commercial programs, or complete inspection |
| Operation speed | Execution within 5 s, on a system consisting of 5,000 buses | |
| platform | Maximum Accommodation capacity | Maximum acceptable number of nodes is 100,000 |
| Synchronous data acquisition | Synchronization acquisition frequency is within 5 s (200 RTUs per DCP) | |
| Feeder IEDs | Standardization | Protection and restoration, using IEC61850 applied communication between devices. |
| Items | Test Details |
|---|---|
| Application program |
|
| Platform |
|
| Feeder IEDs |
|
| Case | Test Conditions (Bad data injection) | Test results | |
|---|---|---|---|
| λBad | λEsti | ||
| 1 | Voltage by manual (11 points) | 15.31 | 1.40 |
| 2 | Voltage random noise 5% | 63.00 | 7.69 |
| 3 | Voltage random noise 10% | 106.00 | 7.75 |
| 4 | Voltage random noise 15% | 197.00 | 7.56 |
| 5 | Current random noise 5% | 66.99 | 16.25 |
| 6 | Current random noise 10% | 127.00 | 22.01 |
| 7 | Current random noise 15% | 216.00 | 71.36 |
| 8 | Voltage random noise 10%, current 5% | 113.00 (Voltage)/ 71.99 (Current) | 7.53 (Voltage)/ 20.47 (Current) |
| 9 | Voltage random noise 15%, current 10% | 229.00 (Voltage)/ 129.00 (Current) | 6.46 (Voltage)/ 26.74 (Current) |
| Case | KSDMS VVO Result | Complete Enumeration Test |
|---|---|---|
| Voltage Violation Removal Case(Low-voltage violation in Chochun S/S, Kimnying D/L) |
|
|
| Voltage Violation Removal and Switching Cost Minimization Case(Over-voltage violation in Sungsan S/S, Songdang D/L) |
|
|
| Overload Violation Removal and Loss Minimization Case(Overload violation in Chochun S/S, Kimnying D/L) |
|
|
| Voltage and Overload Violation Removal and Loss Minimization Case (Over-voltage and Overload violation in Chochun S/S, Kimnying D/L) |
|
|
| Test | Items | Description |
|---|---|---|
| Application Program Accuracy, and Operation Speed | Accuracy |
|
| Operation Speed |
| |
| Maximum Accommodation Capacity of Platform | Maximum Accommodation Capacity |
|
| Synchronous DataAcquisition |
| |
| Protection and Restoration, using IEC61850 Communication between IEDs |
| |
| Test | Test Details |
|---|---|
| Platform |
|
| Device control |
|
| Fault processing |
|
| Case | Fault Location | Noise Data Injection | Test Results |
|---|---|---|---|
| Case1 | M9_H – M1_H | - | FDIR Success |
| Case2 | M18_H – M9_H | - | FDIR Success |
| Case3 | M9_H – M1_H | Error FI (fault indicator) in M1_H | FDIR Success |
| Case4 | M18_H – M9_H | Error FI (fault indicator) in M1_H and M9_H | FDIR Success |
| Voltage (before VVO) | Recommendation of VVO | Voltage (after VVO) | |||||||||
|---|---|---|---|---|---|---|---|---|---|---|---|
| Time | Voltage (V) | Voltage (V) | P.U. | Rise/Drop | Voltage (V) | Rise/Drop | |||||
| A | B | C | Line | Phase | A | B | C | ||||
| 12:53 | 13,635 | 13,637 | 14,110 | 23,316 | 13,461 | 1.018 | Drop | 13,609 | 13,611 | 14,077 | Drop |
| 12:58 | 13,448 | 13,463 | 13,904 | 23,316 | 13,538 | 1.024 | Rise | 13,466 | 13,485 | 13,922 | Rise |
| 13:03 | 13,543 | 13,561 | 13,990 | 23,511 | 13,574 | 1.027 | Drop | 13,545 | 13,554 | 13,983 | Drop |
| 13:08 | 13,578 | 13,581 | 14,048 | 23,402 | 13,511 | 1.022 | Drop | 13,570 | 13,586 | 14,040 | Drop |
| 13:13 | 13,499 | 13,517 | 13,955 | 23,562 | 13,603 | 1.029 | Rise | 13,507 | 13,528 | 13,956 | Rise |
© 2014 by the authors; licensee MDPI, Basel, Switzerland. This article is an open access article distributed under the terms and conditions of the Creative Commons Attribution license ( http://creativecommons.org/licenses/by/3.0/).
Share and Cite
Yun, S.-Y.; Chu, C.-M.; Kwon, S.-C.; Song, I.-K.; Choi, J.-H. The Development and Empirical Evaluation of the Korean Smart Distribution Management System. Energies 2014, 7, 1332-1362. https://doi.org/10.3390/en7031332
Yun S-Y, Chu C-M, Kwon S-C, Song I-K, Choi J-H. The Development and Empirical Evaluation of the Korean Smart Distribution Management System. Energies. 2014; 7(3):1332-1362. https://doi.org/10.3390/en7031332
Chicago/Turabian StyleYun, Sang-Yun, Chul-Min Chu, Seong-Chul Kwon, Il-Keun Song, and Joon-Ho Choi. 2014. "The Development and Empirical Evaluation of the Korean Smart Distribution Management System" Energies 7, no. 3: 1332-1362. https://doi.org/10.3390/en7031332