Abstract
Industries, which are mainly responsible for high energy consumption, need to invest in research projects in order to develop new managing systems for rational energy use, and to tackle the devastating effects of climate change caused by human behavior. The study described in this paper concerns the forging industry, where the production processes generally start with the heating of steel in furnaces, and continue with other processes, such as heat treatments and different forms of machining. One of the most critical operations, in terms of energy loss, is the opening of the furnace doors for insertion and extraction operations. During this time, the temperature of the furnaces decreases by hundreds of degrees in a few minutes. Because the dispersed heat needs to be supplied again through the combustion of fuel, increasing the consumption of energy and the pollutant emissions, the evaluation of the amount of lost energy is crucial for the development of systems which can contain this loss. To perform this study, CFD simulation software was used. Results show that when the door opens, because of temperature and pressure differences between the furnace and the ambient air, turbulence is created. Results also show that the amount of energy lost for an opening of 10 min for radiation, convection and conduction is equal to 5606 MJ where convection is the main contributor, with 5020 MJ. The model created, after being validated, has been applied to perform other simulations, in order to improve the energy performance of the furnace. Results show that reducing the opening time of the door saves energy and limits pollutant emissions.
1. Introduction
Global carbon dioxide emissions reduction is becoming a key target for government policies, which is resulting in a reduction of fossil fuel usage [1]. Global greenhouse gases are produced by several economic activities, mainly electricity generation, heat production and industry activities [2], as well as agriculture and breeding [3], transportation [4], buildings [5] and fuel extraction, processing and transportation [6].
Greenhouse gas emissions from industry primarily involve fossil fuels burned on-site at facilities for producing energy, and the iron and steel industry is among the top five most energy-intensive industry sectors, as reported in the Energy Technology Perspectives 2014 [7]. The main challenge for this sector is lowering energy consumption, greenhouse gas emissions and pollutant emissions [8].
Iron and steel industries need to invest resources to limit their environmental footprint. The most used methods to determine energy consumption and efficiency of the production processes involved, are numerical thermal simulations and Life Cycle Analysis (LCA) [9,10].
Most of the works reported in the literature refer to walking beam furnaces and have the objective of predicting the temperature distribution in the slabs, which plays a major role in the quality of the final product, and the heating efficiency of the furnace [11,12,13,14,15,16,17]. Most of these works have relied on mathematical models, since experiments are quite difficult to perform due to the large size of real furnaces, limited physical access and the harsh environmental conditions of the furnace [18].
A recent and interesting work about the modeling of a conjugate heat transfer and fluid flows inside an industrial furnace with a CFD software, has been done [19]. The study presents a model able to simulate the heat transfer flow of convection, conduction and radiation in a 3D furnace with the presence of six conducting steel solids [20].
Instead, this paper focuses on the thermal analysis of a forging furnace, and discusses the results of joint research between the University of Perugia and Divisione Fucine di Acciai Speciali Terni (SdF), a worldwide leader in the steel forging industry.
At SdF the forged products are obtained through a production process, which involves furnaces and presses. Generally several cycles of heating and machinery are needed to achieve the right geometry. However these processes generate internal stresses and defects that compromise the products’ quality. For this reason, the forged steel is subjected to other thermal and finishing treatments to release stresses, modify the molecular structure and improve the quality and performance of the final materials.
From several analyses made in SdF, it has emerged that the overuse of the furnaces throughout the production processes is one of the main factors responsible for the high energy consumption. An improvement of their energy efficiency would allow the company to reduce pollutant emissions, save energy and decrease the cost of the final product.
All the furnaces in SdF are fueled with natural gas but differ from each other in their dimensions, number of burners, refractory properties and so on. It is, however, possible to classify them into two main categories. The heat treatment furnaces that are generally turned off when the processing is finished, and the forging furnaces which are always turned on at maximum temperature, and are used for the heating of the ingots. The continuous operation of the forging furnaces is the main contributory reason for the high energy consumption, since a continuous energy supply is required to compensate the energy loss during the furnace opening and maintain the operating temperature conditions.
A typical insertion/extraction operation starts with the opening of the furnace door, continues with the movement of an extractable bogie hearth, then the positioning or the picking up of the products by means of an overhead travelling crane, and finally finishing with the insertion of the bogie hearth and the door closing. The time necessary to perform these operations depends on many factors, such as the dimensions of the ingots, the maneuvering time, the presence of faults and so on. From the analysis of the data available to SdF, it emerged that the time varies from about 10 min up to 1 h. In this time interval the furnace temperature decreases by hundreds of degrees, from 300 °C for brief openings, up to 700 °C for longer openings.
To the best of our knowledge, in the literature there are no other studies on the assessment of the thermal behavior of forging furnaces during transient insertion and extraction periods, even though the evaluation of energy losses and other parameters, such as the velocity and the directions of the gases, represents a valid decisional instrument to reduce energy consumption. The complexity of the phenomena that occur in real conditions makes difficult to analyse the study where conduction, convection and radiation occur concurrently [21]. For this reason, the present paper discusses the results of three dimensional transient simulations, done with CFD Software, of a forging furnace, considering a total opening time of 10 min. The first simulation was done with a lifting time of the door of 157 s, which represents the real operating condition of the furnace in SdF. The model created was then validated through an experimental test carried out in SdF with the same operating condition applied to the model. Successively, in order to improve the energy efficiency of the furnace, two other simulations with a different door opening speed were conducted and in this paper discussed. In particular, an opening time of 40 s and 60 s were considered. The results obtained were also used to determine the carbon footprint of the process.
2. Model Settings
The model creation started with the drawing of the geometry and its discretization through a meshing process. It continued with the definition of the simulation setup, and ended with the analyses of the results [22].
2.1. Geometry Creation
The geometry of this case of study is composed only by the fluid domains involved in the heat fluxes and by the furnace door. Since the furnace is under operating conditions when the door is lifted up, and all the burners are turned off, the model can be created with a very clean geometry, without drawing components that do not influence the motion of the fluid and the heat fluxes. In Figure 1 two particulars of the geometry created are shown, specifically the position of the furnace geometry is considered from one corner of the entire domain to enable the complete view of the model.
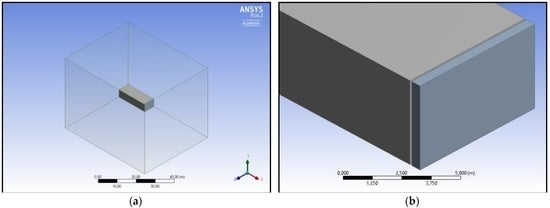
Figure 1.
Geometry used for the simulation: (a) The entire domain considered for the analysis, consisting of a fluid domain of the furnace enclosed in another fluid domain which represents the ambient air; (b) Particular of the geometry where the fluid domain of the furnace is shown in grey, while the door is showed in blue.
The furnace is 4.7 m height × 6.9 m width × 18.55 m depth. These dimensions are relative to the internal space of the furnace, which is the space occupied by the fluid. The door has been drawn at a distance of 10 cm from the furnace border, since at the moment of opening it slides in a horizontal direction before being lifted up. This movement reduces friction between the door and the furnace borders. The width and the height of the door are the same as the furnace, while the depth is 50 cm. Finally the enclosure, which represents the ambient air outside the furnace, has been drawn with a distance of 20 m from the upper surface of the furnace, 1 m from the lower and back surfaces, and 5 m from the lateral surfaces. The following Table 1 shows the dimensions of the model components.

Table 1.
Model components dimensions.
The representation of the furnace contained in an enclosure, allows us to characterize the motion of the fluids between the furnace and the environment.
2.2. Meshing Process
To guarantee the continuity between the two domains: furnace and the environment, a conformal mesh has been used (Figure 2a). Because the door does not influence significantly the heat fluxes, it has not been subject to the meshing process, as it demonstrated by Figure 2b. In addition, being a transient simulation with a dynamic mesh, the entire domain has been meshed with a tetrahedral mesh that supports the operation of remeshing at every time step.
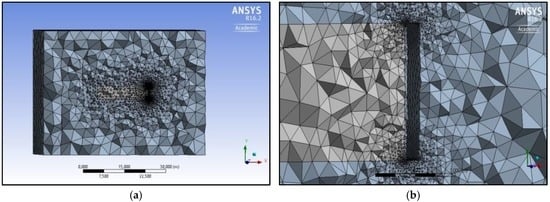
Figure 2.
Drawings of a meshed domain: (a) Representation of the entire domain meshed with a conformal method; (b) Particular of the meshed domain near the door which is not included in the meshing process.
2.3. Models for Convection and Radiation
To model the turbulent flows which occur during the door opening, the Reynolds-Averaged Navier-Stokes (RANS) approach was used. Recent studies demonstrate that it represents the most commonly accepted model for turbulence modeling, especially for industrial applications [18]. This model is derived from the formulation of the standard k-ε model proposed by Launder and Spalding which is based on two transport equations which includes the two variables of the turbulent kinetic energy (k), and the turbulent dissipation rate (ε) [23]. With the standard k-ε model it is possible to predict the behavior of a flow in presence of turbulences with high accuracy. However, the realizable k-ε model, developed after the standard k-ε model, proposes a different formulation giving more accurate results than the first one, for turbulent flows [24]. With the use of the “enhanced wall treatments” option, simplified formulas for turbulence quantities in the cells near the wall are used.
For the modeling of the radiative heat flux a preliminary analysis about the concentration of the flue gases inside the chamber of the furnace at the door opening has been done. Results showed that the burners work with an excess of air avoiding soot formation. For this reason, the assumption of an optical thickness equal to zero was done and the model Surface to Surface has been used [25]. In this model, the energy exchange between surfaces depends on their size and position with respect to the others. The model considers these geometric factors through the computation of the view factors [26].
The S2S model also assumes that the surfaces are gray and diffuse, and the emissivity and the absorptivity do not depend on the wavelength. It is well known that for the gray bodies, the total energy incident (E) on a surface is partly reflected (ρE), partly absorbed (αE) and partly transmitted (τE). Since this model is often used with opaque surfaces to thermal radiation in the infrared spectrum, the fraction of energy transmitted can be not considered. With these assumptions, from the Kirchoff’s law [27] results that α + ρ + ε = 1, but α = ε, therefore ρ = 1 − ε [26].
2.4. Boundary Conditions
The boundary condition at wall boundaries was given using Fluent’s “enhanced wall treatment” which allows us to predict the flows in the near-wall region where laminar and turbulent flows are blended [28]. The boundary and cell conditions given for the initial time were provided by SdF, in particular the temperature of the furnace is at the operating condition of 1500 K, while the ambient temperature is at 300 K. The pressure is set at 101,325 Pa for the environment and an over pressure of 40 Pa respect to the ambience, for the furnace.
2.5. Dynamic Mesh
The use of a dynamic mesh allowed us to do a transient simulation with the movement of the door. Through the use of the first-order backward difference formula it was possible to calculate the conservative energy equation for each time step, considering two steps concurrently [29]. For the motion of the door, a profile has been defined and applied. In particular, the door has been set as a “rigid body” using the profile for motion, while the adjacent cells have been set as “deforming” with the application of remeshing and smoothing methods.
2.6. Control Surfaces
In order to monitor and evaluate the fluid motion, and the heat fluxes that occur during the opening of the door, three control surfaces were created. As shown in Figure 3a the first surface A, having dimensions equal to 6.9 m × 4.7 m, has been positioned in correspondence of the exit of the gases from the furnace. This surface allows us to quantify the amount of the total convective flow that leaves the furnace during all the transient time considered. As it is intuitive to expect that the hot gases leaving the furnace tend to move upwards, passing through the space between the door and the edge of the furnace formed because the scrolling of the door, a new surface B was created. This surface with dimensions of 6.9 m × 0.1 m is shown in Figure 3b. To capture the flows deflected in the other directions the last control surface C was positioned behind the door with a larger dimension than the others of 6.3 m × 9.2 m (Figure 3c). The orientation of the geometry in the figures has been chosen to show a clear view of the surfaces created.
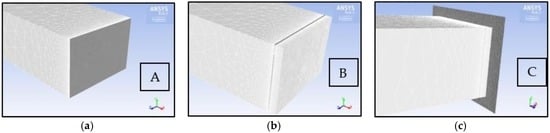
Figure 3.
The three control surfaces created for the evaluation of the convective flow in different zones: (a) Control surface A positioned in correspondence of the exit of the gases from the furnace; (b) Control surface B created in the upper section between the door and the furnace edge; (c) Control surface C created outside the door.
3. Results
The period of 10 min from the opening of the door with a time step of 0.1 s was considered. In particular, the first simulation, related to the real operating condition of the furnace in the plant with a complete opening in 157 s, was conducted and validated through an experimental test done in the real furnace in SdF.
3.1. Fluids Behavior
The first parameter monitored with the simulation was the maximum temperature reached on the two control surfaces B and C during the opening. This trend is shown in Figure 4 where it is possible to see that the highest temperature is registered on surface B, which reaches values of about 1200 K after a few seconds from opening and then decreases, reaching values of 800 K. Instead, the maximum temperature registered on surface C starts from the ambient value, up to values of around 700 K.
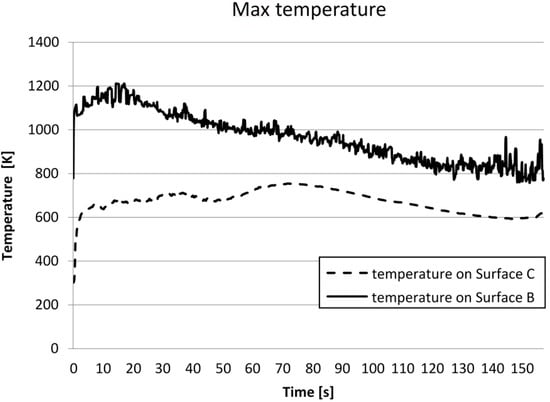
Figure 4.
The trend of the maximum temperature reached in the surface B and C during the 157 s of the door opening.
The values of the max temperature registered in the two surfaces depend on the motion of the fluid leaving the furnace. For example Figure 5 shows a sequence of velocity vectors from the initial time, up to 1 s. This sequence of frames demonstrates how the hot gases inside the chamber move upwards and leave the furnace through the upper section with a velocity that reaches 12 m/s. Meanwhile, the external air, at ambient temperature, moves towards the furnace through the bottom section.
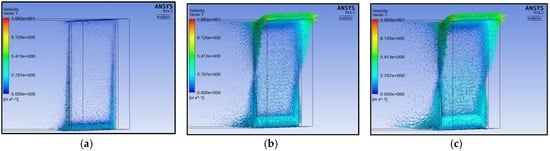
Figure 5.
Sequence of the velocity vectors at different time at the exit of the furnace: (a) Velocity vectors at 0 s; (b) Velocity vectors at 0.5 s; (c) Velocity vectors at 1 s.
Continuing the anlyses of the fluid dynamics of the model, it can be observed from Figure 6 that the hot gases which cannot be released from the upper section, are recalled downwards, forming a convective motion when they meet the cold air coming from outside.
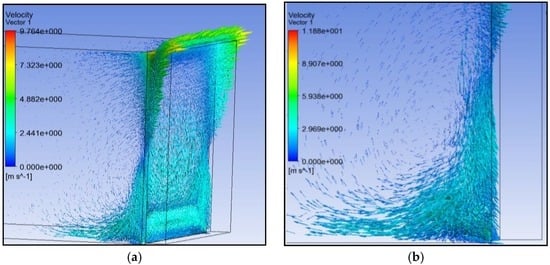
Figure 6.
Velocity vectors of the gases for an opening of 3 cm: (a) Velocity vectors and formation of convective motion; (b) Particular of convective motion at the bottom of the furnace.
As the door continues to open, the vortexes disappear, the velocity vectors decrease, and the hot gases leaving the furnace start to pass under the door (Figure 7). The complete motion of the convective fluxes for the transient time of 157 s, relative to the furnace domain, is shown in the attached video.
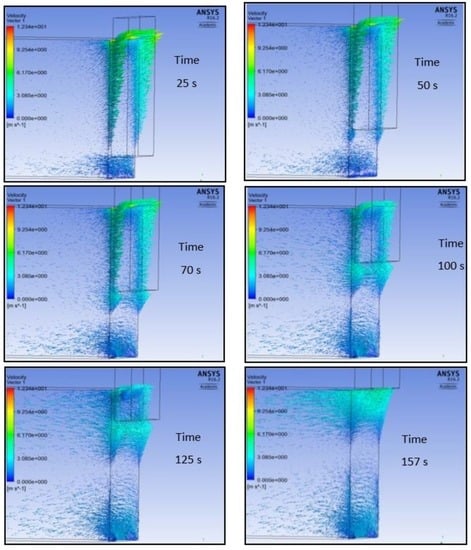
Figure 7.
Fluid motion during the transient time from the opening of the door, up to the complete opening of 4.7 m at 157 s.
It is important to underline that the vectors reported in the previous images refer to the gases that move in the furnace domain. For example, observing the picture relating to the motion of 50 s, it might seem that the vectors pass through the door. In reality this does not occur, in so far as when the gases pass through the air domain, the presence of the door deflects the motion of the vectors in other directions, as it is possible to see from Figure 8.
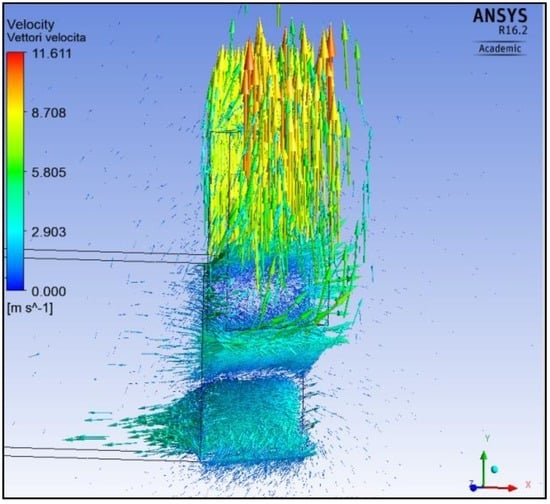
Figure 8.
The velocity vectors’ directions in the air domain that move vertically upwards between the door and the furnace, and immediately outside the door.
3.2. Heat Flux Evaluation
In order to evaluate the energy fluxes, the contributions of the three forms of heat exchange: convection, radiation and conduction, were identified. With the aid of the CFD Software, the amount of the heat flux during the opening for convection and radiation has been evaluated, while a spreadsheet for the conduction was used.
3.2.1. Radiative Heat Flux
The values of the radiative energy, which passes through the opening of the door evaluated for the first 157 s and related to the complete opening of the door of 4.7 m, are reported in Figure 9.
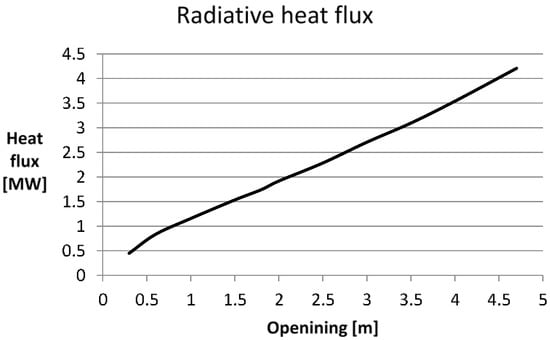
Figure 9.
The graph reports the trend of the radiative heat flux through the door during the 157 s.
The values obtained show that the flux grows linearly with time and so with the opening. Even if during the opening the walls start to cool down, the radiative heat flux per unit of area remains about the same because the difference of temperature changes slightly. These values have been verified through the analytical calculation for several time steps, using the view factors given by Fluent.
3.2.2. Convective Heat Flux
The evaluation of the convective heat flux is carried out through the calculation of the mass flow rate of enthalpy as the following Equation (1):
where H is the Enthalpy, and is the mass flow.
The knowledge of the values calculated for every time step in the simulation allows us to obtain the total convective heat flux. The trend of the fluxes for the complete opening of the door of 4.7 m in 157 s is shown in Figure 10. It is possible to see that the heat flux on the door is given from the sum of the others. By comparing the two types of heat flux for the first 157 s, it is possible to see that the convective heat flux is higher than the radiative, even if the latter depends on the fourth power of the temperature. This behavior is due to the fact that the turbulence generated from the opening creates a motion of air with a high Reynolds number.
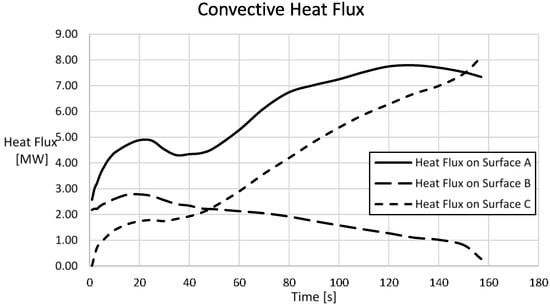
Figure 10.
The convective heat flux evaluated in the three control surfaces created for a complete opening of the door of 4.7 m.
3.2.3. Conductive Heat Flux
It was possible to calculate the amount of the conductive heat flux through the walls of the furnace from data relating to the stratification of the walls as shown in Figure 11, and from the trend of the temperature obtained from the simulation.
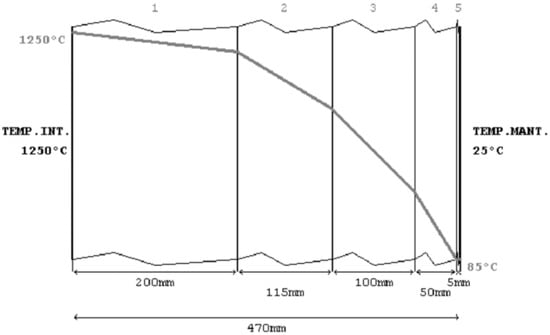
Figure 11.
Drawing showing the stratigraphy of the walls of the furnace with the decrease of the temperature when the furnace is under operating conditions.
The application of the following gives the values of the heat flux in function of the time:
where U is the equivalent transmittance of the wall, ΔT is the difference of temperature and A is the area of the surface. However, this formulation does not consider the thermal bridges.
3.3. Total Energy Loss and Validation of the Model
The knowledge of the trends of the heat fluxes in function of the time allowed the calculation of the energy loss. In particular, Table 2 gives the energy for the three heat fluxes.
Table 2.
Amount of energy lost for an opening of 600 s for radiation, convection and conduction.
To evaluate the accuracy of these values, an indirect analysis through the knowledge of the methane consumption of the furnace was made. Assuming a lower calorific value of the natural gas equal to 34 MJ/m3, the flow rate is equal to 165 Nm3 of methane. However the methane consumption calculated is relative to the model created with the ideal operating condition of the furnace. The real behavior instead is conditioned by many parameters such as, for example, the presence of thermal bridges and damaged refractories, which increase the heat flux through the walls. Another aspect is the presence of an interstice between the bogie hearth and the lateral walls of the furnace, which is necessary to avoid friction during movement, but allows part of the heat to exit from the furnace increasing the losses. These, and other phenomena, influence the real consumption of natural gas, increasing the total amount of fuel necessary to maintain the furnace chamber at a certain temperature.
The validation of the model was carried out through an experimental test made in SdF. The test started with the opening of the door of an empty forging furnace at the operating temperature of 1230 °C. The furnace remained open for 10 min with the bogie hearth inside, and then closed again. When the door was completely closed the burners started to call up to reach again the operating temperature. Two instant photographs of this experimental test are reported in Figure 12 from which it is possible to see the variation of the intensity of the furnace color which corresponds to a sudden fall in temperature.
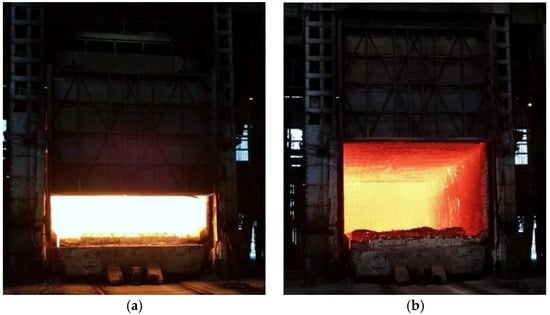
Figure 12.
Pictures taken during the experimental test made in SdF: (a) The picture is related to a partial opening at 60 s; (b) The picture is related to a complete opening at 157 s.
The consumption of methane was monitored between the closing time, after the 10 min, and the time it takes to return at its operating conditions. Taking into account the simplification of the model, the two values of methane consumption were compared and resulted that the values are of the same order of magnitude. This validation guarantees the accuracy of the model and allows us to use it as a decisional instrument for future developments which will allow us to develop more efficient processes.
In order to characterize the footprint of this phenomenon, the emission of CO2 caused by the combustion of the 165 Nm3 of methane is evaluated. From the stoichiometric equation of the methane combustion results that 1 mol of CH4 produces 1 mol of CO2 (Equation (3)):
Being the molar mass of the methane equal to 16 g/mol and the molar mass of the CO2 equal to 44 g/mol, results that the combustion of 1 kg of CH4 produces 2.75 kg of CO2. For a density of the methane equal to 0.73 kg/m3 results that 1 kg of CH4 corresponds to 1.4 m3 of CH4. So the kg of CO2 produced by the combustion of 165 Nm3 of methane are 331 kg, where 309 kg are due to the combustion of natural gas for the heat lost for convection.
4. Application of the Model
As shown by Table 2, the major contribution to the total heat loss is due to convection. For this reason the model created has been applied to evaluate how an increase of the door speed can influence the convective fluxes of the furnace and the consequent global energy performance. For this reason two other simulations of a complete opening of 40 s and 60 s were carried out. Figure 13 shows the trend of the convective heat flux on Surface A for the three different openings.
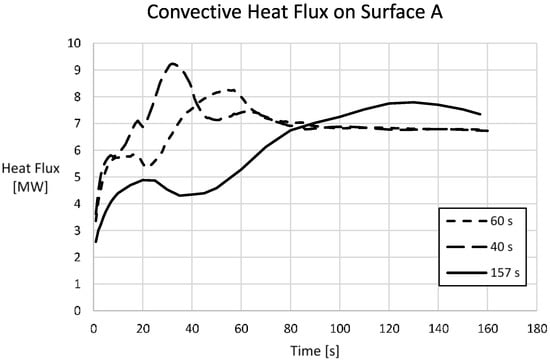
Figure 13.
Convective heat flux evaluated on the control surface A for the three different opening of 40 s, 60 s and 157 s.
As it is possible to see, a reduction of the opening time entails an increase of the maximum value of convective heat flux calculated, which exceeds 9 MW for a 40 s opening. From the evaluation of the amount of the energy lost during the lifting time of the door and in the next 10 min for the three different case studies, the results show that the opening of 40 s minimizes the heat loss, with a total of 4324 MJ for a total time of 640 s. In the following Table 3 the values of the convective heat flux for the different openings are shown.
Table 3.
Energy fluxes evaluated on the control Surface A in the three different case studies for the time of the door opening and the total time.
Thanks to this study the company made their production process more efficient, saving fuel and limiting pollutant emissions, simply by reducing the opening time of the door, from 157 s to 40 s. An amount of about 60 kg of CO2 is saved simply with the implementation of a reduced door opening time. A further reduction of this time is not allowed due to the mechanical limits of the door lifting system. The data obtained from this study is also being used for other studies concerning the design of an air knife system to install close to the door.
5. Conclusions
In this study the behavior of a real industrial furnace used in the forging industry was analyzed. The CFD simulation of a typical insertion/extraction operation done in a forging furnace showed that the amount of energy lost for a total time of 10 min is equal to 5606 MJ, where the main contributory factor is the convective heat flux, with a value of 5252 MJ. In order to characterize the heat flows during all the transient time, other variables were also monitored. In particular, results showed that at the opening, because of the differences in temperature and pressure internally and externally, turbulences were generated constituting the main reason for the heat loss. The validation of the model, carried out through an experimental test done in SdF, has allowed the use of the model as a decisional instrument. For this reason two other simulations were also conducted. Results showed that a reduction of the door opening time from 157 s to 40 s reduces the energy loss, limiting the fuel consumption and pollutant emissions. The importance of this study is due also to the fact that the model created is applicable to a very large variety of furnaces, as it depends only on the geometry and on the operating conditions. The model can be used for furnaces of every dimension and powered by any kind of energy.
Acknowledgments
This work was supported by the research funding of Divisione Fucine di Acciai Speciali Terni and CIRIAF. The authors are grateful for this support.
Author Contributions
All the authors equally contributed to this work.
Conflicts of Interest
The authors declare no conflict of interest.
References
- Nastasi, B.; Lo Basso, G. Hydrogen to link heat and electricity in the transition towards future Smart Energy Systems. Energy 2016, 110, 5–22. [Google Scholar] [CrossRef]
- Intergovernmental Panel on Climate Change (IPCC). Climate Change 2014: Mitigation of Climate Change. Contribution of Working Group III to the Fifth Assessment Report of the Intergovernmental Panel on Climate Change IPCC (2014); Cambridge University Press: Cambridge, UK; New York, NY, USA, 2014. [Google Scholar]
- Castellani, B.; Rossi, F.; Filipponi, M.; Nicolini, A. Hydrate-based removal of carbon dioxide and hydrogen sulphide from biogas mixtures: Experimental investigation and energy evaluations. Biomass Bioenergy 2014, 70, 330–338. [Google Scholar] [CrossRef]
- Cotana, F.; Rossi, F.; Nicolini, A.; Rinaldi, S.; Merico, M.C. Electric vehicles for postal service equipped with a kinetic energy recovery system. Int. J. Green Energy 2015, 12, 485–492. [Google Scholar] [CrossRef]
- Rossi, F.; Castellani, B.; Presciutti, A.; Morini, E.; Anderini, E.; Filipponi, M.; Nicolini, A. Experimental evaluation of urban heat island mitigation potential of retro-reflective pavement in urban canyons. Energy Build. 2016, 126, 340–352. [Google Scholar] [CrossRef]
- Brinchi, L.; Castellani, B.; Rossi, F.; Cotana, F.; Morini, E.; Nicolini, A.; Filipponi, M. Experimental investigations on scaled-up methane hydrate production with surfactant promotion: Energy considerations. J. Pet. Sci. Eng. 2014, 120, 187–193. [Google Scholar]
- International Energy Agency. Energy Technology Perspectives 2015; OECD Publishing: Paris, France, 2015. [Google Scholar]
- Castellani, B.; Morini, E.; Filipponi, M.; Nicolini, A.; Palombo, M.; Cotana, F.; Rossi, F. Comparative analysis of monitoring devices for particulate content in exhaust gases. Sustainability 2014, 6, 4287–4307. [Google Scholar] [CrossRef]
- Han, S.H.; Chang, D.; Huh, C. Efficiency analysis of radiative slab heating in a walking-beam-type reheating furnace. Energy 2011, 36, 1265–1272. [Google Scholar] [CrossRef]
- Zhang, L.; Huang, H.; Hu, D.; Li, B.; Zhang, C. Greenhouse gases (GHG) emissions analysis of manufacturing of the hydraulic press slider within forging machine in China. J. Clean. Prod. 2016, 113, 565–576. [Google Scholar] [CrossRef]
- Kim, J.G.; Huh, K.Y.; Kim, I.T. Three-dimensional analysis of the walking-beam type slab reheating furnace in hot strip mills. Numer. Heat Transf. A Appl. 2000, 38, 589–609. [Google Scholar]
- Jaklič, A.; Kolenko, T.; Zupančič, B. The influence of the space between the billets on the productivity of a continuous walking-beam furnace. Appl. Therm. Eng. 2005, 25, 783–795. [Google Scholar] [CrossRef]
- Kim, M.Y. A heat transfer model for the analysis of transient heating of the slab in a direct-fired walking beam type reheating furnace. Int. J. Heat Mass Transf. 2007, 50, 3740–3748. [Google Scholar] [CrossRef]
- Jang, J.H.; Lee, D.E.; Kim, M.Y.; Kim, H.-G. Investigation of the slab heating characteristics in a reheating furnace with the formation and growth of scale on the slab surface. Int. J. Heat Mass Transf. 2010, 53, 4326–4332. [Google Scholar] [CrossRef]
- Han, S.H.; Chang, D.; Kim, C.Y. A numerical analysis of slab heating characteristics in a walking beam type reheating furnace. Int. J. Heat Mass Transf. 2010, 53, 3855–3861. [Google Scholar] [CrossRef]
- Han, S.H.; Chang, D. Radiative slab heating analysis for various fuel gas compositions in an axial-fired reheating furnace. Int. J. Heat Mass Transf. 2012, 55, 4029–4036. [Google Scholar] [CrossRef]
- Han, S.H.; Chang, D. Optimum residence time analysis for a walking beam type reheating furnace. Int. J. Heat Mass Transf. 2012, 55, 4079–4087. [Google Scholar] [CrossRef]
- Bhuiyan, A.B.; Karim, M.R.; Naser, J. Modeling of Solid and Bio-Fuel Combustion Technologies. In Thermofluid Modeling for Energy Efficiency Applications; Elsevier: London, UK, 2015; pp. 259–309. [Google Scholar]
- ANSYS Fluent Academic Research 16.2; ANSYS: Canonsburg, PA, USA.
- Hachem, E.; Jannoun, G.; Veysset, J.; Henri, M.; Pierrot, R.; Poitrault, I.; Massoni, E.; Coupez, T. Modeling of heat transfer and turbulent flows inside industrial furnaces. Simul. Model. Pract. Theory 2013, 30, 35–53. [Google Scholar] [CrossRef]
- Song, G.; Bjorge, T.; Holen, J.; Magnussen, B.F. Simulation of fluid flow and gaseous radiation heat transfer in a natural gas-fired furnace. Int. J. Numer. Methods Heat Fluid Flow 1997, 7, 169–182. [Google Scholar] [CrossRef]
- Tu, J.; Yeoh, G.H.; Liu, C. Computational Fluid Dynamics, 2nd ed.; Butterworth-Heinemann: Woburn, MA, USA, 2013. [Google Scholar]
- Launder, B.E.; Spalding, D.B. Lectures in Mathematical Models of Turbulence; Academic Press: London, UK, 1972. [Google Scholar]
- Shih, T.H.; Liou, W.W.; Shabbir, A.; Yang, Z.; Zhu, J. A New k-ε Eddy-Viscosity Model for High Reynolds Number Turbulent Flows—Model Development and Validation. Comput. Fluids 1995, 24, 227–238. [Google Scholar] [CrossRef]
- Siegel, R.; Howell, J.R. Thermal Radiation Heat Transfer; Hemisphere Publishing Corporation: Washington, DC, USA, 1992. [Google Scholar]
- Surface-to-Surface (S2S) Radiation Model Theory. In ANSYS® Academic Research, Release 16.2, Help System; ANSYS: Canonsburg, PA, USA, 2015; pp. 162–164.
- Modest, M.F. Radiative Heat Transfer; Series in Mechanical Engineering; Academic Press: New York, NY, USA, 1993. [Google Scholar]
- Near Walls treatments for Wall-Bounded turbulent flows. In ANSYS® Academic Research, Release 16.2, Help System; ANSYS: Canonsburg, PA, USA, 2015; p. 107.
- Dynamic Mesh Theory. In ANSYS® Academic Research, Release 16.2, Help System; ANSYS: Canonsburg, PA, USA, 2015; pp. 34–36.
© 2016 by the authors; licensee MDPI, Basel, Switzerland. This article is an open access article distributed under the terms and conditions of the Creative Commons Attribution (CC-BY) license (http://creativecommons.org/licenses/by/4.0/).