1. Introduction
Buildings are the largest energy-consuming sector in the world, and account for over one-third of total final energy consumption and an equally important source of carbon dioxide (CO
) emissions. The International Energy Agency (IEA) defined, among the strategies and opportunities to 2050, energy and emissions reduction in the buildings sector as an achievable policy goal. The field of sustainable design seeks to balance these needs by using an integrated approach to create sustainable design solutions [
1].
When dealing with sustainable design concepts in new construction or in retrofitting existing buildings, it is useful to define both economic and environmental performance indicators, in order to select the optimal technical solutions. Generalized decision support models may be useful to define design alternatives for developing energy-efficient building, by offering a ready reference to generalized cases for both architects and engineers that allows them to zero in on a set of effective design solutions. Among these efficient solutions, the definition of the optimal strategy is not trivial because it is necessary to solve a multi-objective problem with a high number of variables subjected to nonlinear constraints. Classical optimization methods suggest converting the multi-objective optimization problem to a single-objective optimization problem by emphasizing one particular Pareto-optimal solution at a time. On a large scale, multi-criteria decision analysis (MCDA) methods have become increasingly popular in decision-making for sustainable energy, mainly to define national or regional strategies for the implementation of sustainable development policies [
2]. However, the design of sustainable buildings is a very complex issue because there are many physical processes that lead to conflicting objectives. These challenges have made it advantageous to apply computational methods of design optimization for large-scale building optimization problems [
3,
4]. In [
5], a multi-objective optimization model using a genetic algorithm (GA) and artificial neural network (ANN) is proposed to quantitatively assess technology choices in a building retrofit project. Three objectives (energy consumption, retrofit cost, and thermal discomfort hours) are optimized and the potential of GA for the solution of multi-objective building retrofit is shown.
Here, a multi-objective optimization genetic algorithm, NSGAII, is used to derive the Pareto optimal solutions of a five objective optimization problem of sustainable design of a new building. The proposed method can be used to define an optimized strategy both in design of new buildings and in defining optimal strategies for retrofitting existing buildings [
6,
7]. In the following,
Section 2 formalizes the optimization method and describes controllable parameters, fixed parameters and objectives. Then, the application to a case study is reported in
Section 3 and
Section 4. Finally,
Section 5 describes a method to introduce uncertainty evaluation in the optimization procedure. Conclusions are reported in
Section 6.
2. The Optimization Method
Classical optimization methods suggest converting the multi-objective optimization problem to a single-objective optimization problem by emphasizing one particular Pareto-optimal solution at a time. On a large scale, MCDA methods have become increasingly popular in decision-making for sustainable energy [
8], mainly to define national or regional strategies for the implementation of sustainable development policies or to support decisions in sustainable energy fields [
9,
10].
In this study, a powerful multi-objective optimization genetic algorithm, NSGAII, is used to derive the Pareto optimal solutions, which can illustrate the whole trade-off relationship between objectives. The algorithm was selected because the simulation results of the constrained NSGAII showed the high potential of this optimizer when compared with other constrained multi-objective optimizers [
11].
The proposed approach consists of applying an MCDA to obtain optimized strategies, by evaluating their performance objectives.
The first step of this analysis is the description of the building through
n controllable parameters:
A constrained multiobjective optimization problem (CMOP) consists of finding the minimum of the function:
subject to:
constraints on decision values:
constraints on objectives:
The n controllable parameters are used to describe the configuration of the building relative to the energy performances and the characteristics of the installations.
The controllable parameters considered here are:
Building parameters: the results of the building energy simulations are used to define the building energy demand depending on the characteristics of windows and building envelope. For each building configuration, a relative cost and a comfort level are defined;
Installation parameters: the configuration of installations is defined by a set of parameters that describe the energy performances of each system, the relative costs and the comfort level. For a specific site, only feasible solutions are evaluated, depending on the availability of the fuel (i.e., natural gas, diesel fuel, etc.) and on specific constraints of the building (available space, minimum noise level, etc.). The installations here considered are: energy generation system, fluid distribution system, end devices and building automation control system;
Renewables parameters: renewable energy technologies are described by their energy performances (i.e., energy per year generated for each square meter of surface occupied by a specific solar panel) and by their relative costs. Specific constraints can be added by imposing minima and maxima depending on legal limits and on available space for the installation;
Electric parameters: for each configuration (i.e., use of inverters, type of lighting, etc.) a specific efficiency, a relative cost and a comfort level are defined.
In addition to the controllable parameters, a set of fixed parameters must be defined to evaluate the performances of each configuration.
The fixed parameters considered here are:
The minimum percentage of electric green energy: legal restrictions may impose that a minimum percentage of the electric energy absorbed by a new building is generated by renewable sources. If the renewable system installed on the building generates less energy than the required amount, the purchase of the remaining renewable energy must be considered when evaluating the energy costs;
The costs of electric energy and fuels;
The years and the rate of interest considered for the evaluation of the economic indicators;
The pollutants corresponding to each kind of energy consumed (i.e., CO emissions for each kWh of methane consumed).
Each combination of the controllable parameters describes a specific strategy, that must be evaluated considering multiple objectives.
Five objectives are evaluated simultaneously:
OB1—Thermal energy consumption;
OB2—Electric Energy consumption;
OB3—Net present value of the investment;
OB4—Emissions of CO;
OB5—Comfort level.
Once parameters and objectives are defined, the genetic optimization algorithm generates the Pareto optimal solutions, from whose analysis it is possible to define the optimal strategy for the specific building.
3. Case Study
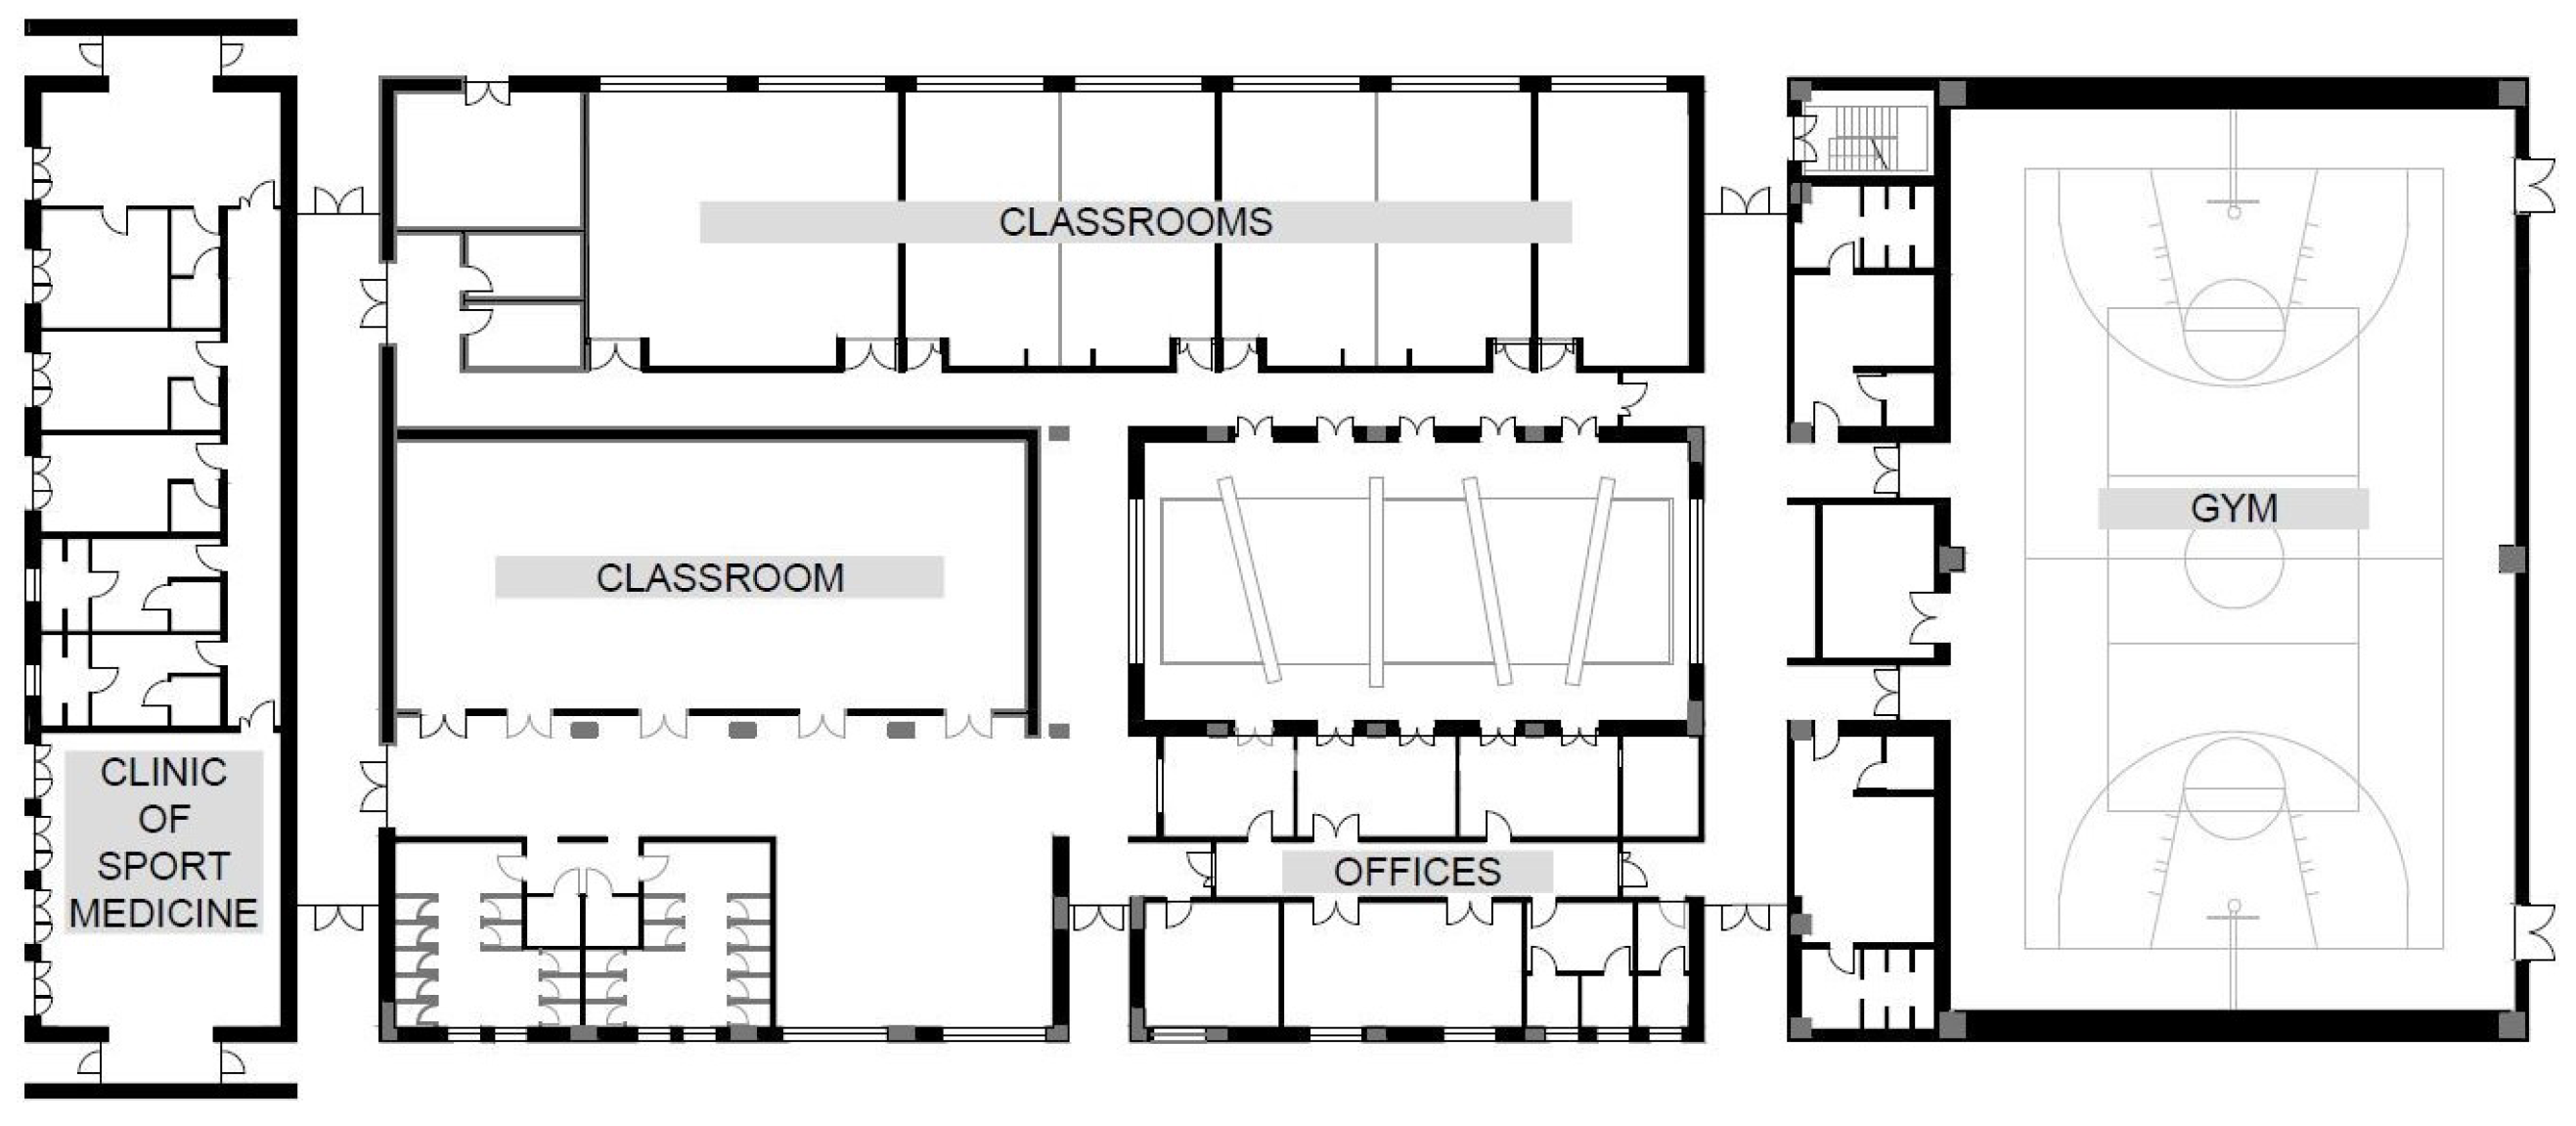
The optimization method described above is applied to the design of a new university building with an area of approximately 2500 m
(
Figure 1). The new building will replace the current Master of Science in Sports and Sports Sciences facilities and Sports Medicine facilities of the University of Perugia. There will be offices and classrooms and a specific area for the clinic of Sports Medicine. The building will incorporate also a multipurpose gym for both the university and the general public. Outside of the building, an “energy” area will include the main heating and cooling systems and the electrical substation.
The site is in the city of Perugia, in the Center of Italy, in a suitable position for exploiting solar energy because of the absence of higher buildings in the neighborhood. The maximum available area for the solar systems is 2000 m on the roof of the new building. Eventually, extra areas can be found in the adjacent car park, provided that ad hoc structures are built for the installation of the solar panels.
For the case study analysis, the following configurations are considered:
Building parameters—building configuration (
Table A1): the results of building modeling are used to evaluate the energy demand of the building. Two different configurations were evaluated:
- -
BC1—base case scenario: standard insulation and standard windows characteristics;
- -
BC2—increased insulation: high insulation and high-performance windows.
Installation parameters—energy generation systems (
Table A2): typical values of efficiencies of different heating/cooling generation systems are adopted to define four possible configurations:
- -
EGS1—base case scenario: standard gas boiler for heating, standard electric chiller for cooling;
- -
EGS2—first upgrade: condensing gas boiler for heating, standard electric chiller for cooling;
- -
EGS3—second upgrade: condensing gas boiler for heating, high efficiency electric chiller for cooling;
- -
EGS4—third upgrade: multi-function electric heat pump for heating and cooling.
Installation parameters—fluid distribution system (
Table A3): two different configurations are defined, considering standard and increased insulation on main pipes connecting the “energy” area with the building and the substation with the air handling units:
- -
FDS1—base case scenario: standard pipe insulation thickness;
- -
FDS2—increased insulation: increased pipe insulation thickness.
Installation parameters—end devices (
Table A4): two different systems are considered for the end devices:
- -
ED1—base case scenario: standard end devices (low efficiency fan coils and air handling units);
- -
ED2—increased efficiency: high efficiency end devices (high efficiency fan coils and air handling units).
Installation parameters— building automation control system (
Table A5): The impact of building automation control systems (BACS) and technical building management (TBM) systems on the energy performance of the building is evaluated analogously with what is proposed in [
12]. For the estimation of the impact of BACS and TBM systems on the energy performance of the buildings, the BAC factors method proposed by the European Norm EN 15232 is used. The European Standard EN 15232 introduces four different efficiency classes for buildings according to BACS and TBM systems installation. Because the case study is a new building, class D (Non-energy efficient BACS ) is not considered feasible. Thus, three different configurations are evaluated:
- -
BA1—base case scenario: Class C—Standard BACS;
- -
BA2—first upgrade: Class B—Advanced BACS and TBM systems;
- -
BA3—second upgrade: Class A—High energy performance BACS and TBM systems.
Renewable parameters—photovoltaic system (
Table A6): two different technologies are considered for the photovoltaic panels
- -
PS1—base case scenario: low efficiency photovoltaic panels;
- -
PS2—increased efficiency: high efficiency photovoltaic panels.
Renewable parameters—solar thermal system (
Table A7): two different technologies are considered for the solar thermal panels
- -
ST1—base case scenario: low efficiency solar thermal panels;
- -
ST2—increased efficiency: high efficiency solar thermal panels.
Electric parameters—electric system (
Table A8): three different configurations are considered:
- -
ES1—base case scenario: standard electric installation;
- -
ES2—first upgrade: inverter installation + standard lighting system;
- -
ES3—second upgrade: inverter installation + low consumption lighting system.
The interventions described above also result in an improvement of the comfort of building occupants. For example, upgrading the efficiency of the generation and distribution systems involve both benefits in terms of service continuity and uniformity of temperature and relative humidity, and an increased insulation of the building reduces discomfort due to radiant surfaces (radiant ceilings, floors, etc.). Thus, for each intervention proposed, a qualitative analysis of the expected level of comfort is made and a score from zero to three is assigned, where zero is no effect on comfort level and three is a high effect on comfort level. The costs of the interventions are estimated through parametric evaluations made for the test building and based on the price list adopted by the administrator of the building. The fixed parameters (
Table A9) are defined considering the specific case study. The minimum percentage of electric green energy, the costs of electric energy and fuels, the number of years and the rate of interest considered for the evaluation of the economic indicators depend on the building administrator and on legal limits. The CO
emissions corresponding to each kind of energy consumed is obtained by the ISPRA (the Italian National Institute for Environmental Protection and Research) database [
13].
The controlled and fixed parameters are summarized in the annexed tables.
Because the test building is a new construction, the Italian Law (Italian Legislative Decree No. 28—3 March 2011) imposes limits for the renewable energies. The minimum photovoltaic peak power is then calculated as (variables are defined in
Table 1):
The minimum solar thermal energy is calculated as:
and another limit is imposed to all renewables:
The minimum percentage of electric green energy is set to 50%, following the regulations of the Administration.
4. Discussion and Results
The analysis of the Pareto front can be done by looking at the configurations that generated each point of the front. To observe the five objectives (thermal energy consumption; electric energy consumption; Net Present Value of the investment; emissions of CO
; comfort level), a representation of the Pareto front on a diagram that can represent all the objectives at the same time is useful. By analyzing this diagram, an optimized strategy for the specific building may be defined. In
Figure 2, a diagram that represents the five objectives at the same time is proposed. The diagram is easily readable: the tradeoff between the Net Present Value of the investment and the other four objectives is clear. By interrogating each point, it is possible to select the best compromise to reach high standards in sustainability and energy efficiency. The procedure for selecting the optimized strategy can be customized depending on the needs of the user. In this specific case study, the following procedure is adopted:
prefer solutions with low thermal energy conpsumption, in order to reduce localized emissions;
avoid low comfort solutions, considering the use of the new building;
minimize the Net Present Value of the investment;
minimize emissions of CO.
When analyzing more complex cases, multiple criteria sorting based methods may be used to select the optimized strategy [
14].
Figure 2 shows how the selected strategy permits obtaining a building characterized by high energy and environmental performances, with an investment that can be feasible for the Administration.
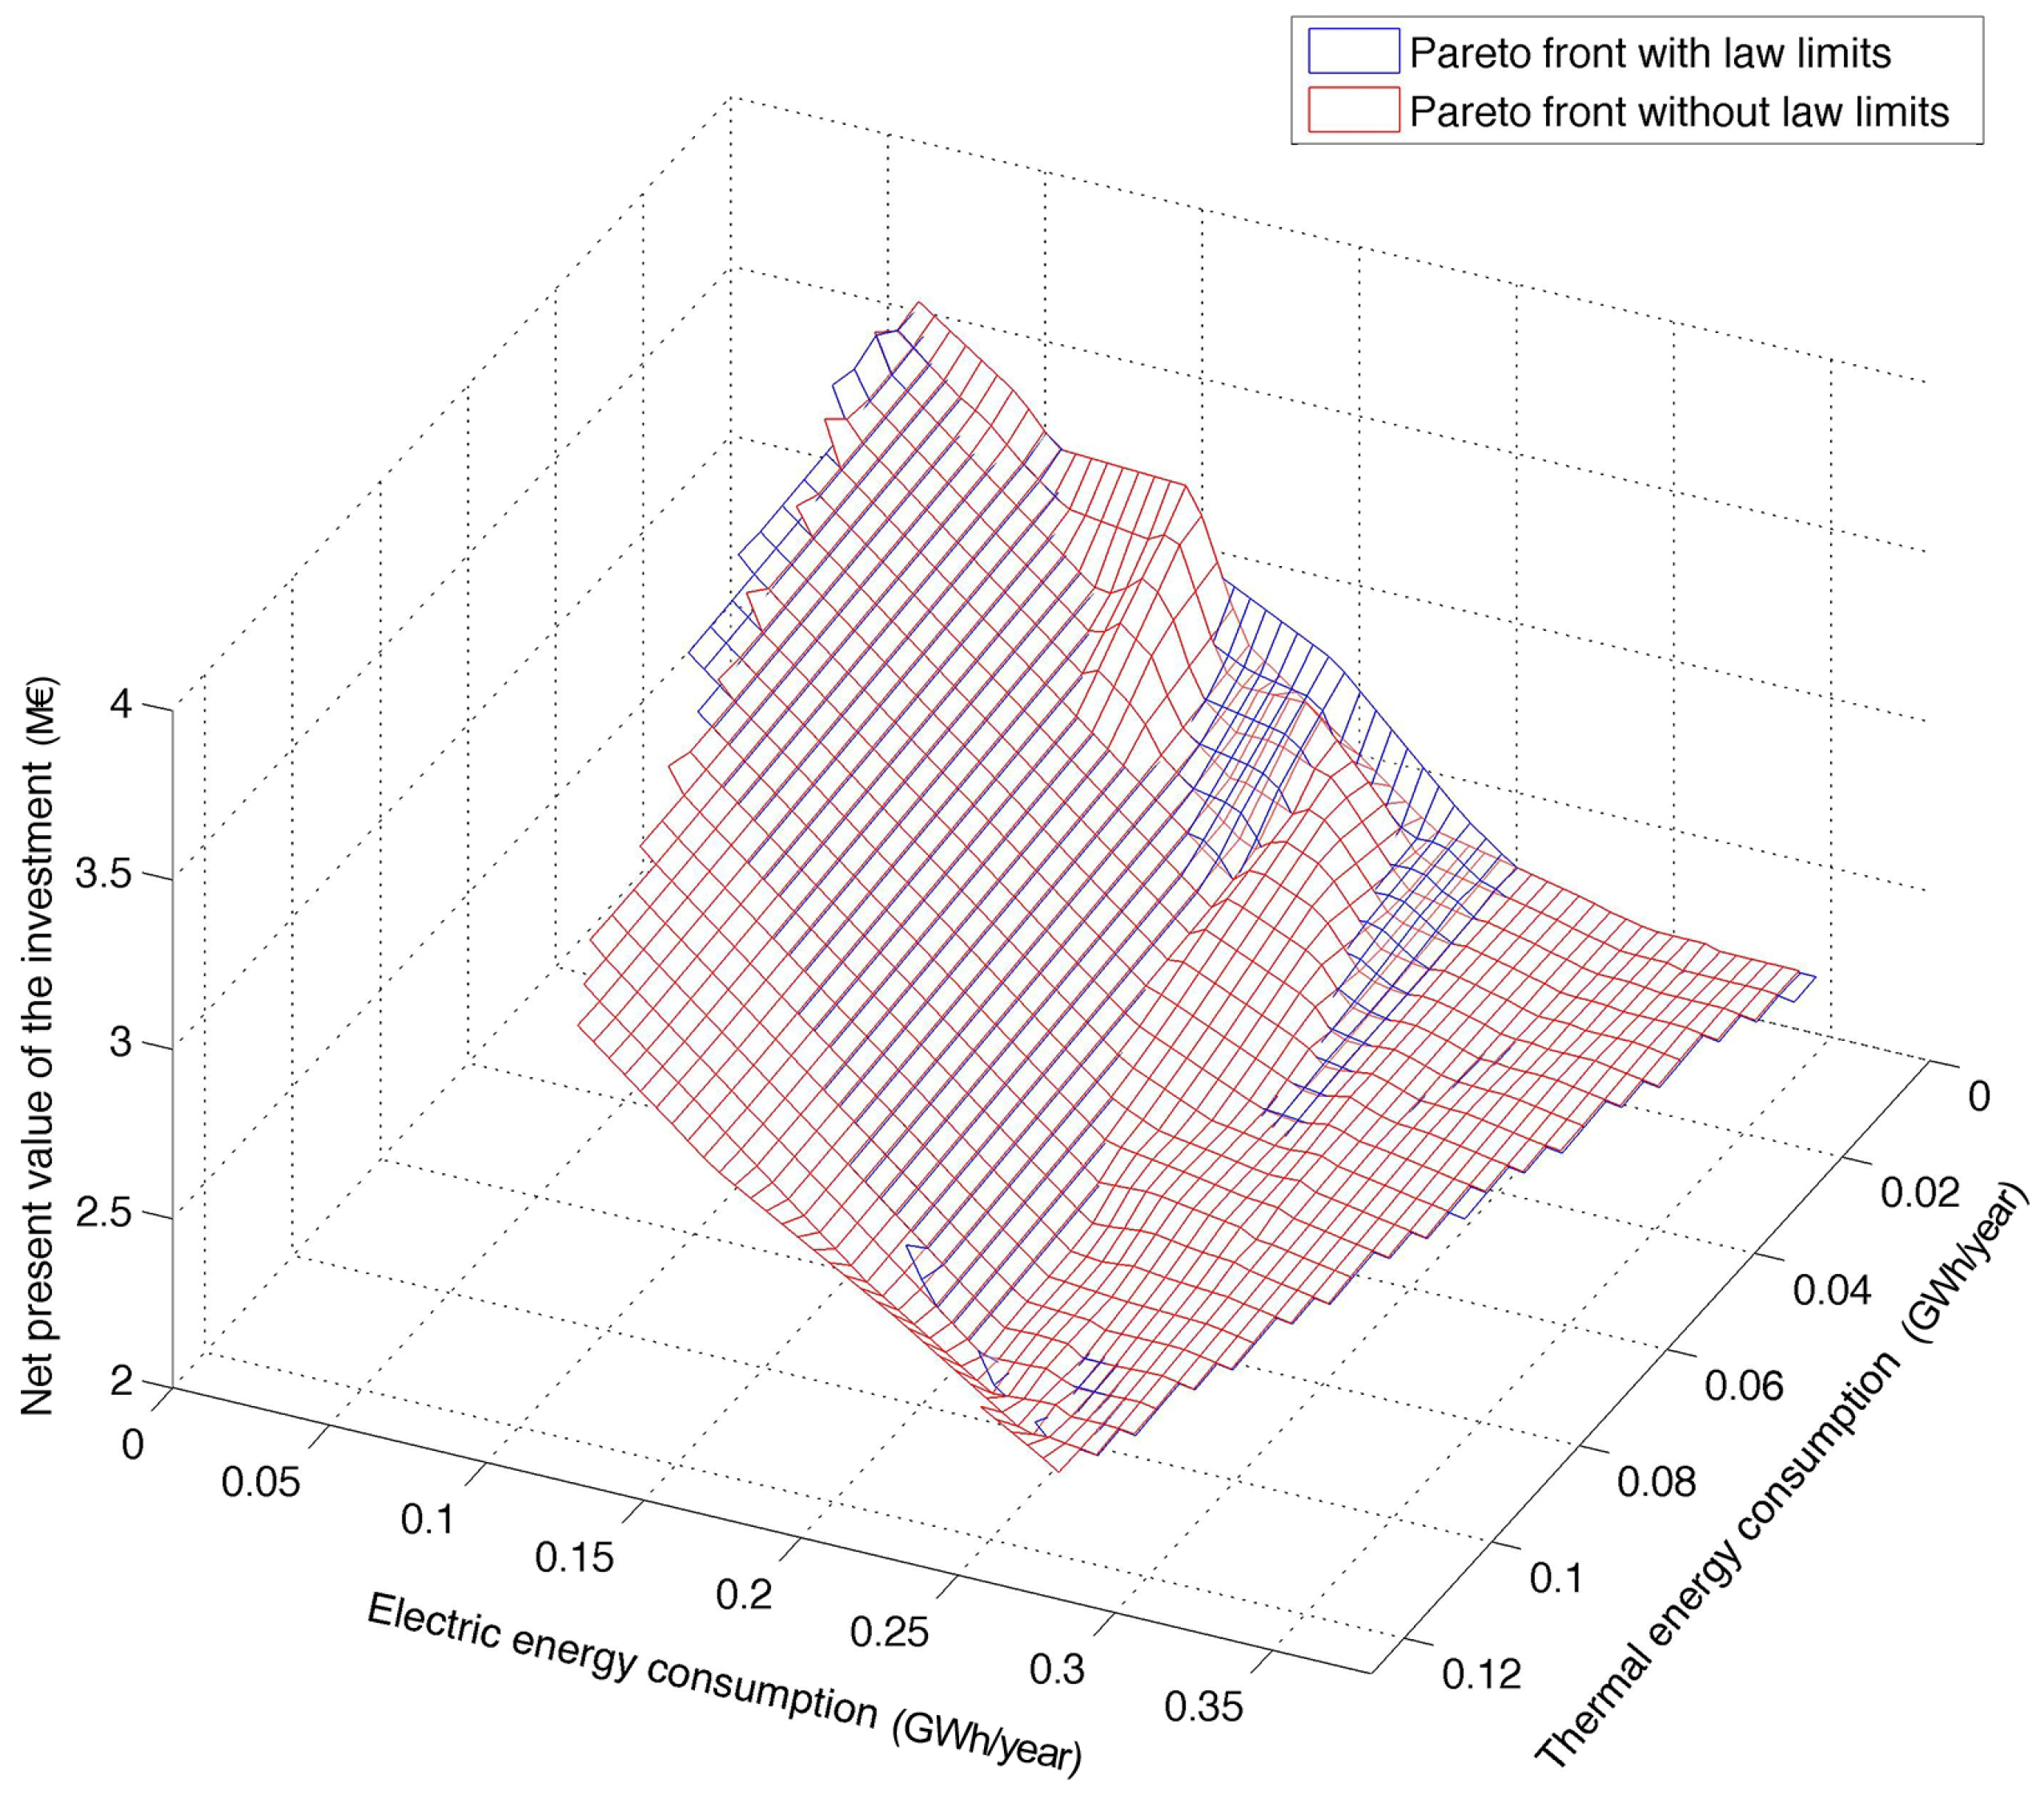
It is also possible to represent the effects of a specific strategy with respect to the Pareto front. This can be useful when dealing with external constraints that were not considered in the modelling (for example architectural constraints), or when analyzing the performances of a base case scenario in an existing building. The method also permits observation of the effects of the limits imposed by the Law for the renewable energies and those imposed by the Administration on the minimum percentage of electric green energy, as described in
Section 4. In
Figure 3, the simulations with and without those limits are shown. It can be observed that imposing legal limits slightly modify the Pareto front, thus legal limits are well defined for the case study. This conclusion is not trivial because the limits imposed by the Law do not consider the characteristics of the building and of the site. For example, Equation (
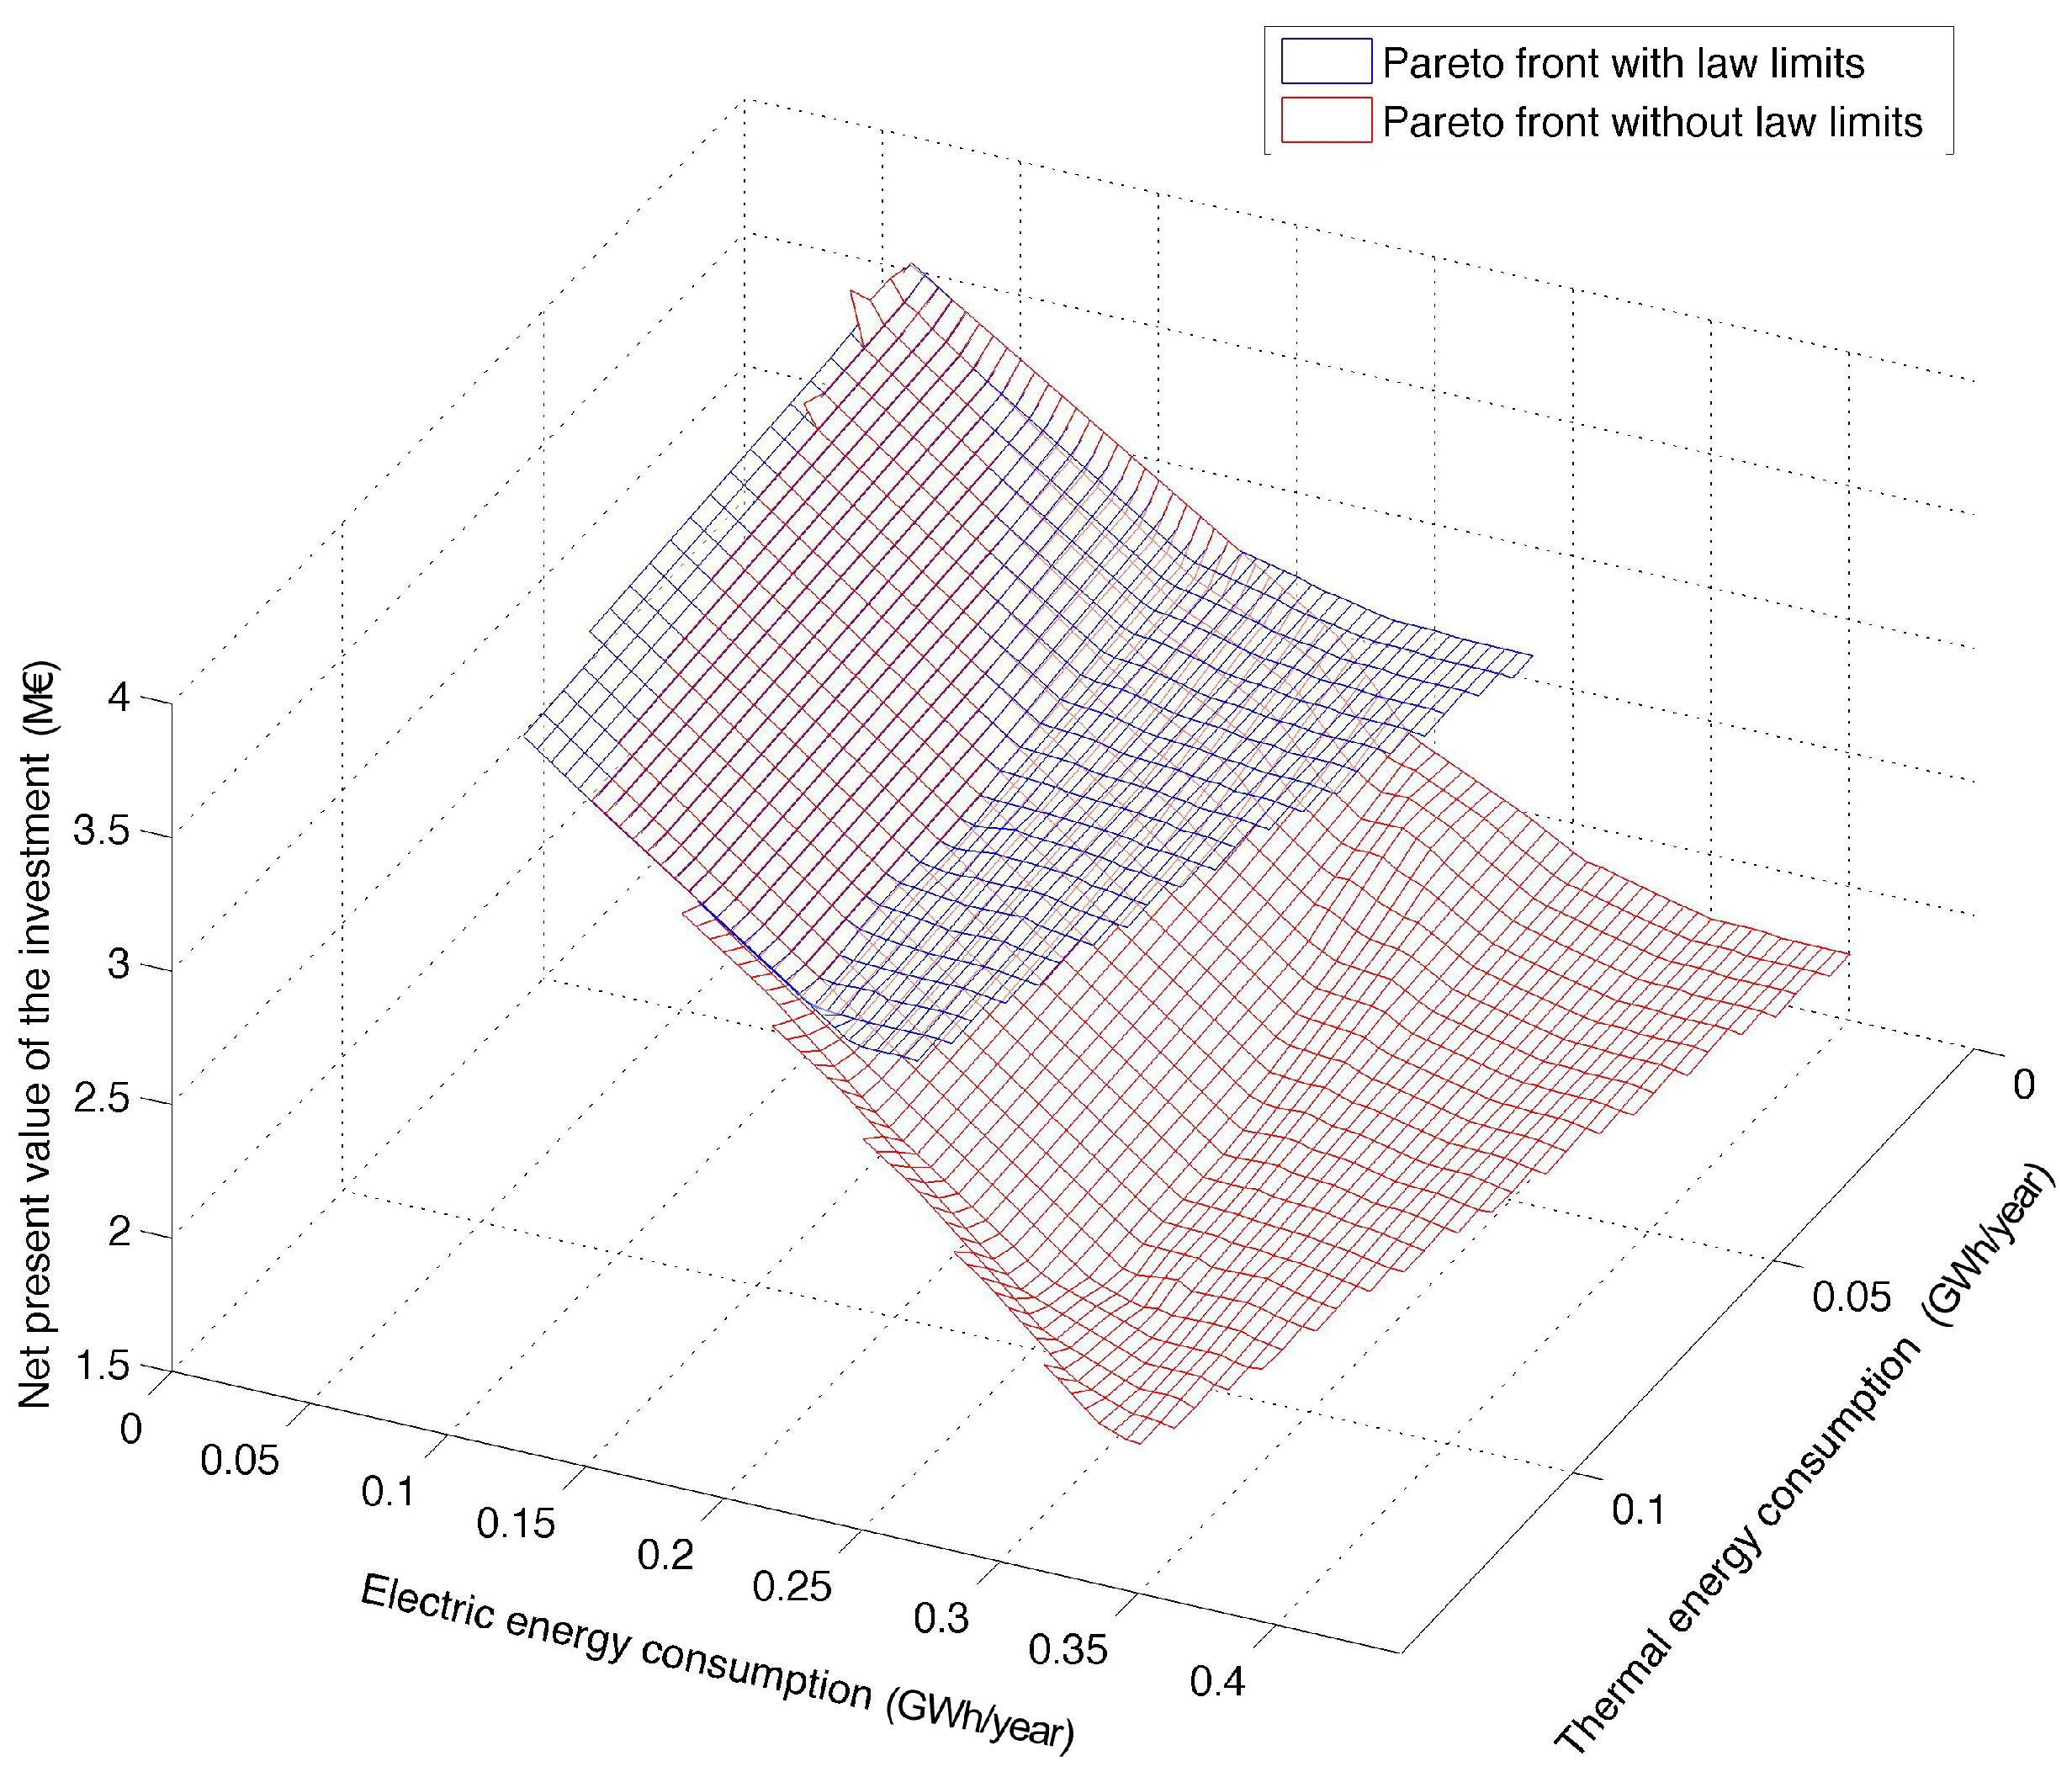
9) imposes calculation of the photovoltaic peak power as a function of the building footprint. It is clear that this parameter cannot describe both the characteristics of the building and those of the site, as shown in
Figure 4, where a different layout of the building, with an increase of the building footprint, highly modify the Pareto front, with a corresponding limited number of feasible strategies, with respect to the ones obtained without imposing legal limits.
5. Uncertainty Evaluation
Currently, building energy modeling may give good average energy use over populations of buildings, but, for individual buildings, there can be large discrepancies between modeled and actual use [
15]. Disagreement between simulated and metered energy consumption represents a common issue in building simulation [
16]. When dealing with existing buildings, models are usually calibrated in order to obtain low values of the Coefficient of Variation of Root Mean Squared Error (CV (RMSE)) and of Normalized Mean Bias Error (NMBE) for the whole building’s monthly use [
17,
18]. Those standard metrics are usually applied to compare the outputs from the calibrated model with observed values of energy consumption:
where:
= measured data; and
= simulation results.
The so-called calibrated simulation (CS) is required for operational optimization of existing buildings in order to obtain energy savings, and a properly calibrated model may accurately simulate the building energy process at multiple levels [
19]. Probabilistic outputs can be straightforwardly translated to quantify risks of under-performance associated with retrofit interventions. A calibrated model should reach the minimum values of the metrics described above according to [
20,
21].
When dealing with design of a new building, the model cannot be calibrated with measured data [
22], thus the uncertainties and the bias of the simulations must be defined based on previous experiences of modeling similar building. Moreover, climate data of a test reference year are usually applied to the energy simulation of a building, but new reference years should be considered for future time horizons and carbon scenario assumptions. Even using last generation probabilistic weather generators [
23], an uncertainty must be associated with climate data used for the energy simulations and for renewable energy production estimation, which is also characterized by other uncertainties that can be estimated, for example, by using measurement performed during long-term monitoring of photovoltaic plants with different technologies and architectures [
24,
25]. In addition, the other parameters (for example, the fixed parameters described above) used for the evaluation of the objectives may also be characterized by their uncertainties. When the uncertainties described above are taken into account in multi-objective optimization problems, the set of optimal solutions may be defined to reduce the amount of uncertainty. Many approaches can be applied to perform optimization under uncertainty. The uncertainty may be explicitly taken into account when defining the domination between sets [
26], or by evaluating user defined metrics for the generation of the Pareto front.
In order to evaluate the goodness of the optimization process, the effects of uncertainty associated with the building energy simulation on the evaluation of the objectives, and thus on the generation of the front of Pareto, should be analyzed. In the following, a method is proposed to introduce uncertainty evaluation in the optimization procedure, in order to obtain a comprehensive analysis tool, which permits not only identifying the optimal strategy, but also assessing the uncertainty of the objectives analyzed.
Let us consider a set of objective functions , where represents a vector of design variables and a vector of random variables.
The multi-objective problem can be defined as
where
is a vector of
m independent objectives.
Each
is a random quantity induced by
. It is possible to introduce an operator Φ, applied to
in order to obtain a deterministic attribute of it, reducing the problem as
Different definitions for Φ might be used—for example,
can be the statistical moments of
. When applying this method to define the optimal design of a new building, a prudential approach may be used, in order to avoid underestimation of the energy demand and thus overestimation of the energetic performance of the system. This can be done by using:
where
is the standard deviation of
and
is the mean value of
. In this case, the optimization under uncertainty seeks to minimize the mean plus standard deviation. The problem can be formulated as:
and the resulting non-dominated solutions are the Pareto front in design under uncertainty.
To show how this method affects the results of the optimization process, the effects of the uncertainties related to two of the main design variables of the energy modeling (annual heating energy and annual cooling energy demand) are evaluated. Therefore, based on the results obtained from similar simulations, the annual heating energy and the annual cooling energy required were both characterized by a mean value error of
% and by a uniform probability distribution with limits of
%. The mean value error effect is considered by increasing the annual heating and cooling energy simulated by the model. Each objective is then characterized by a combined uncertainty that must be estimated to properly evaluate the optimal strategy because high uncertainty could lead to high probable objective values that can be very far from the mean value. The determination of combined uncertainty is performed via Monte Carlo simulation, by considering only the uncertainties associated with evaluation of annual heating and cooling energy values. The problem is solved numerically, generating a large number “M” of values for the probability distribution of each variable
, and calculating each
with all combinations of the
values obtained using, for the
variables, the “M” values previously generated. Using this Monte Carlo method of error propagation, a distribution of
values that corresponds to the distributions of the starting variables
is obtained. Then, the mean value and the standard deviation of
are calculated and used to evaluate the solutions of Equation (
15). The Monte Carlo simulation is thus performed inside the fitness function used for the optimization. This leads to a high computational effort that is reduced by the use of a simple parametric model for the evaluation of the objective functions.
The same procedure may be applied to more detailed simulation models, as in [
27], where it is shown how equation-based languages may be used to generate efficient codes for simulation and optimization.
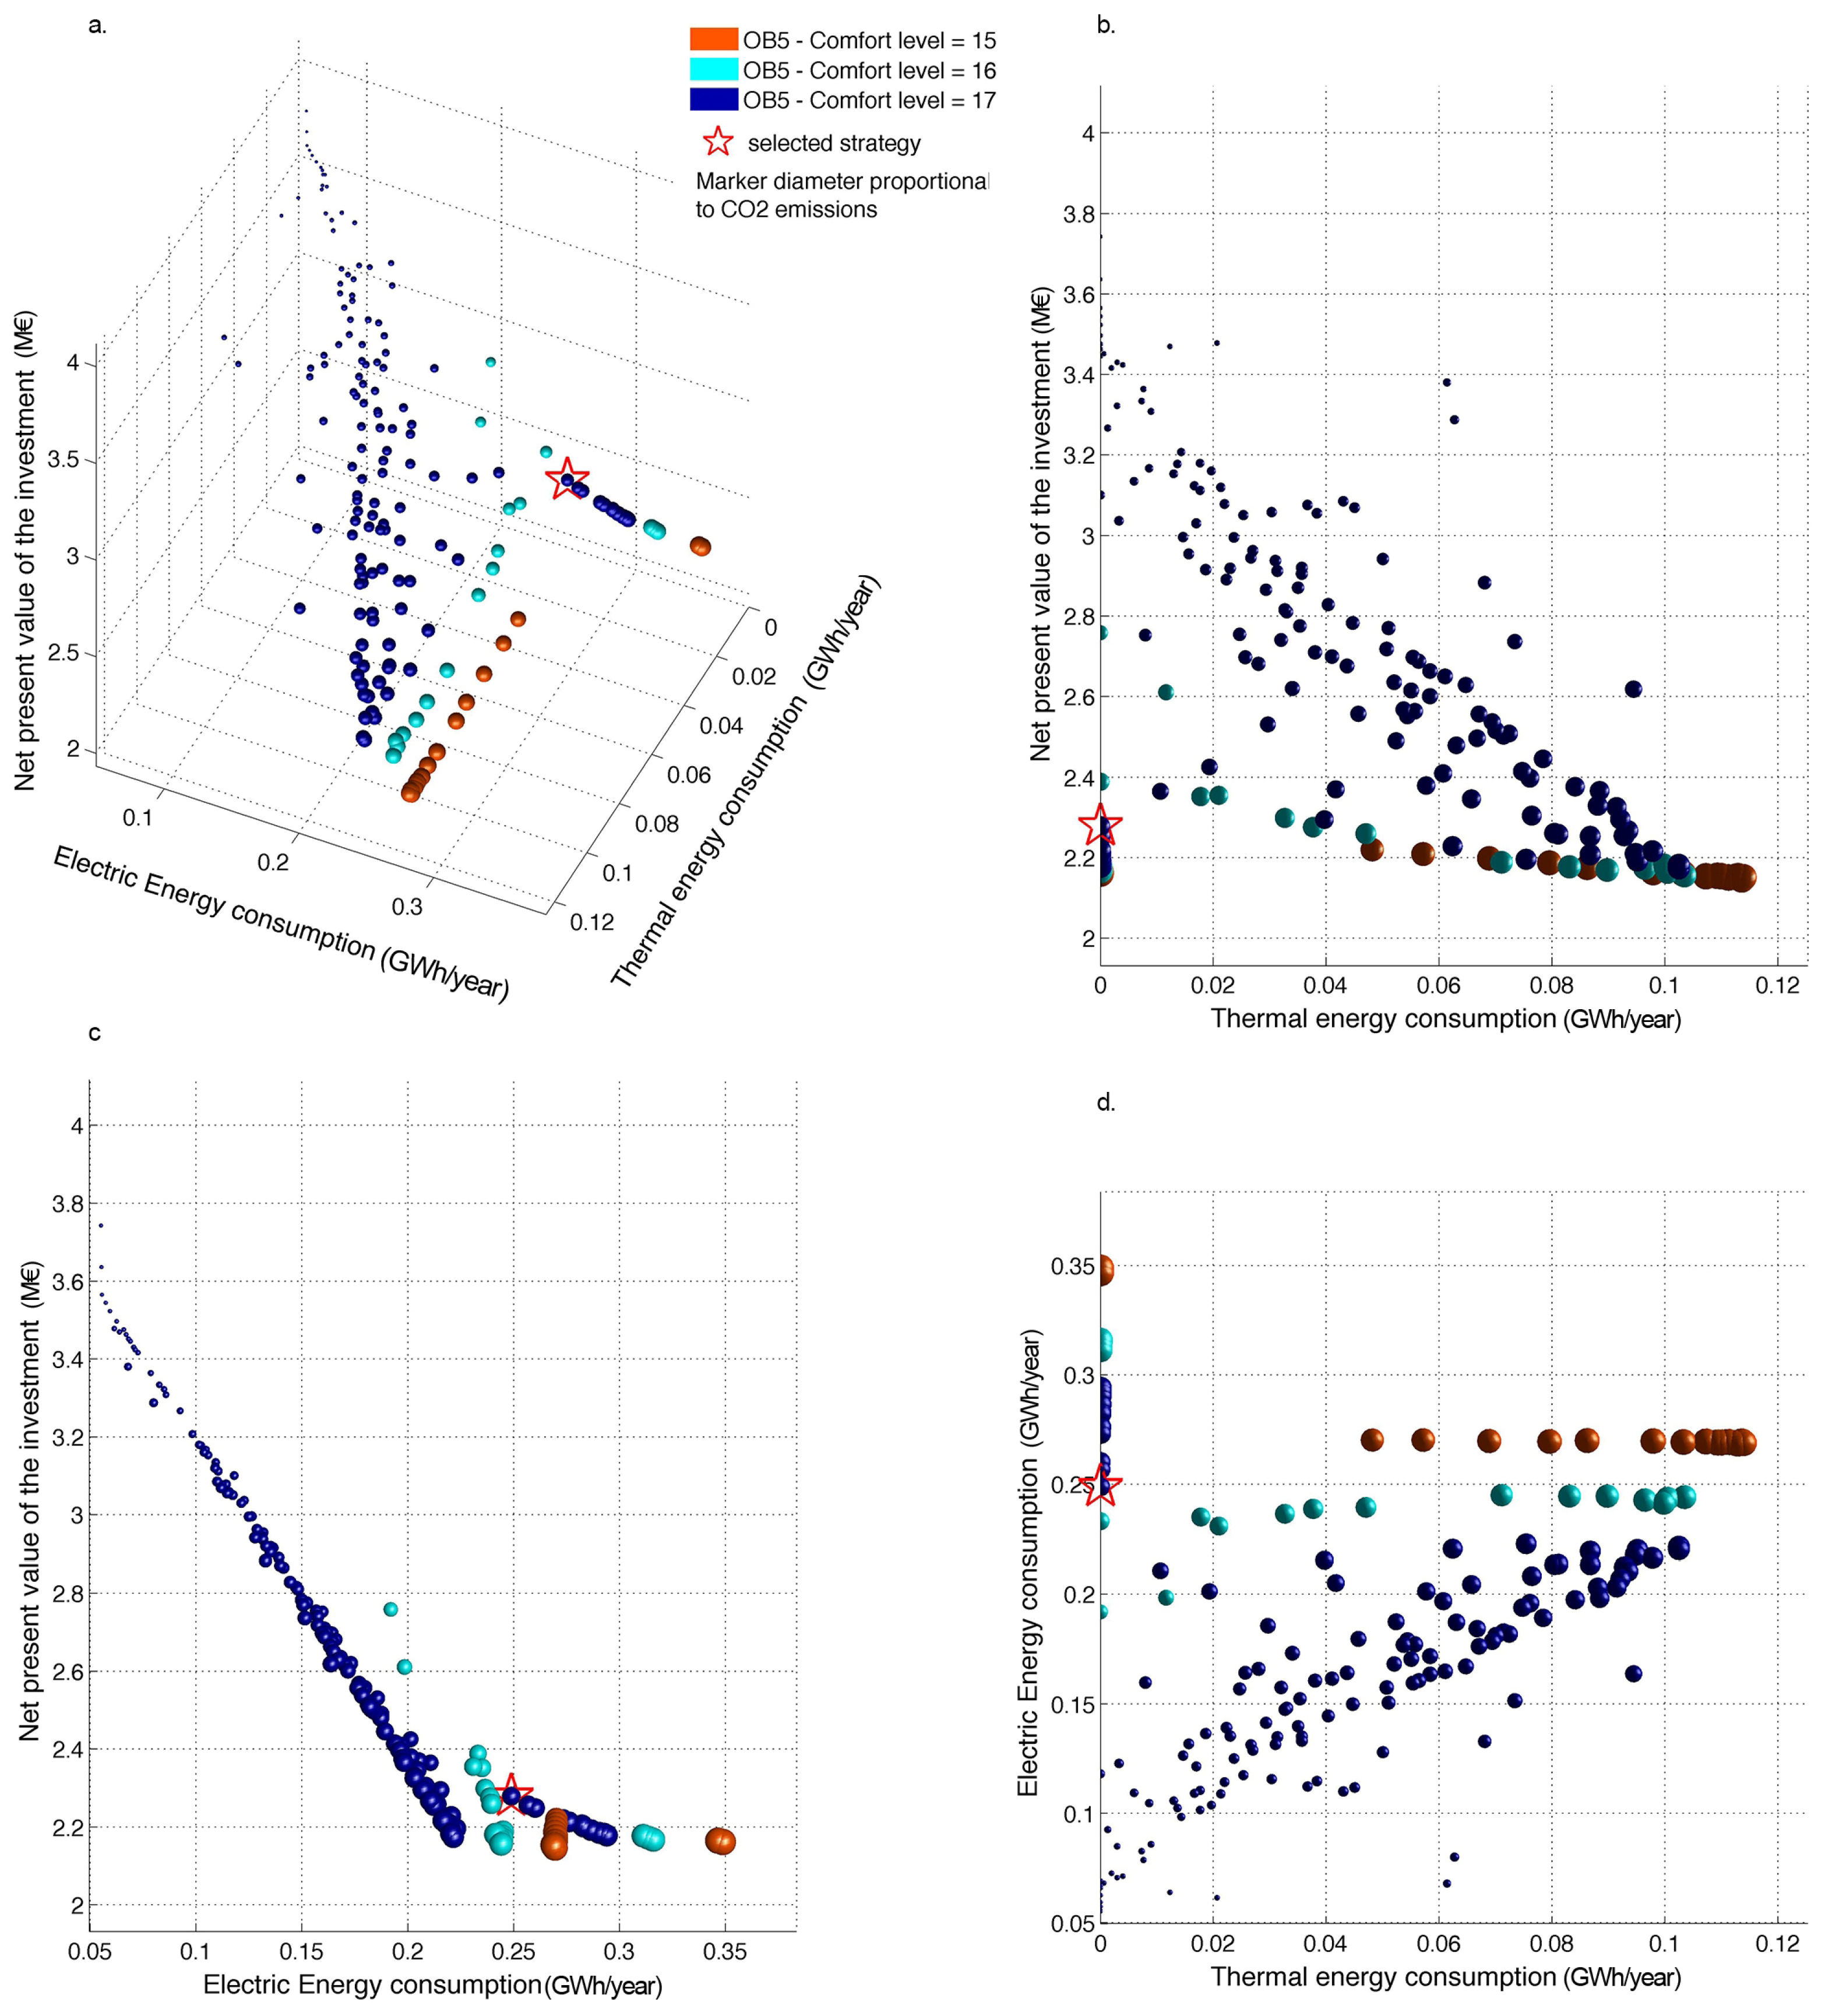
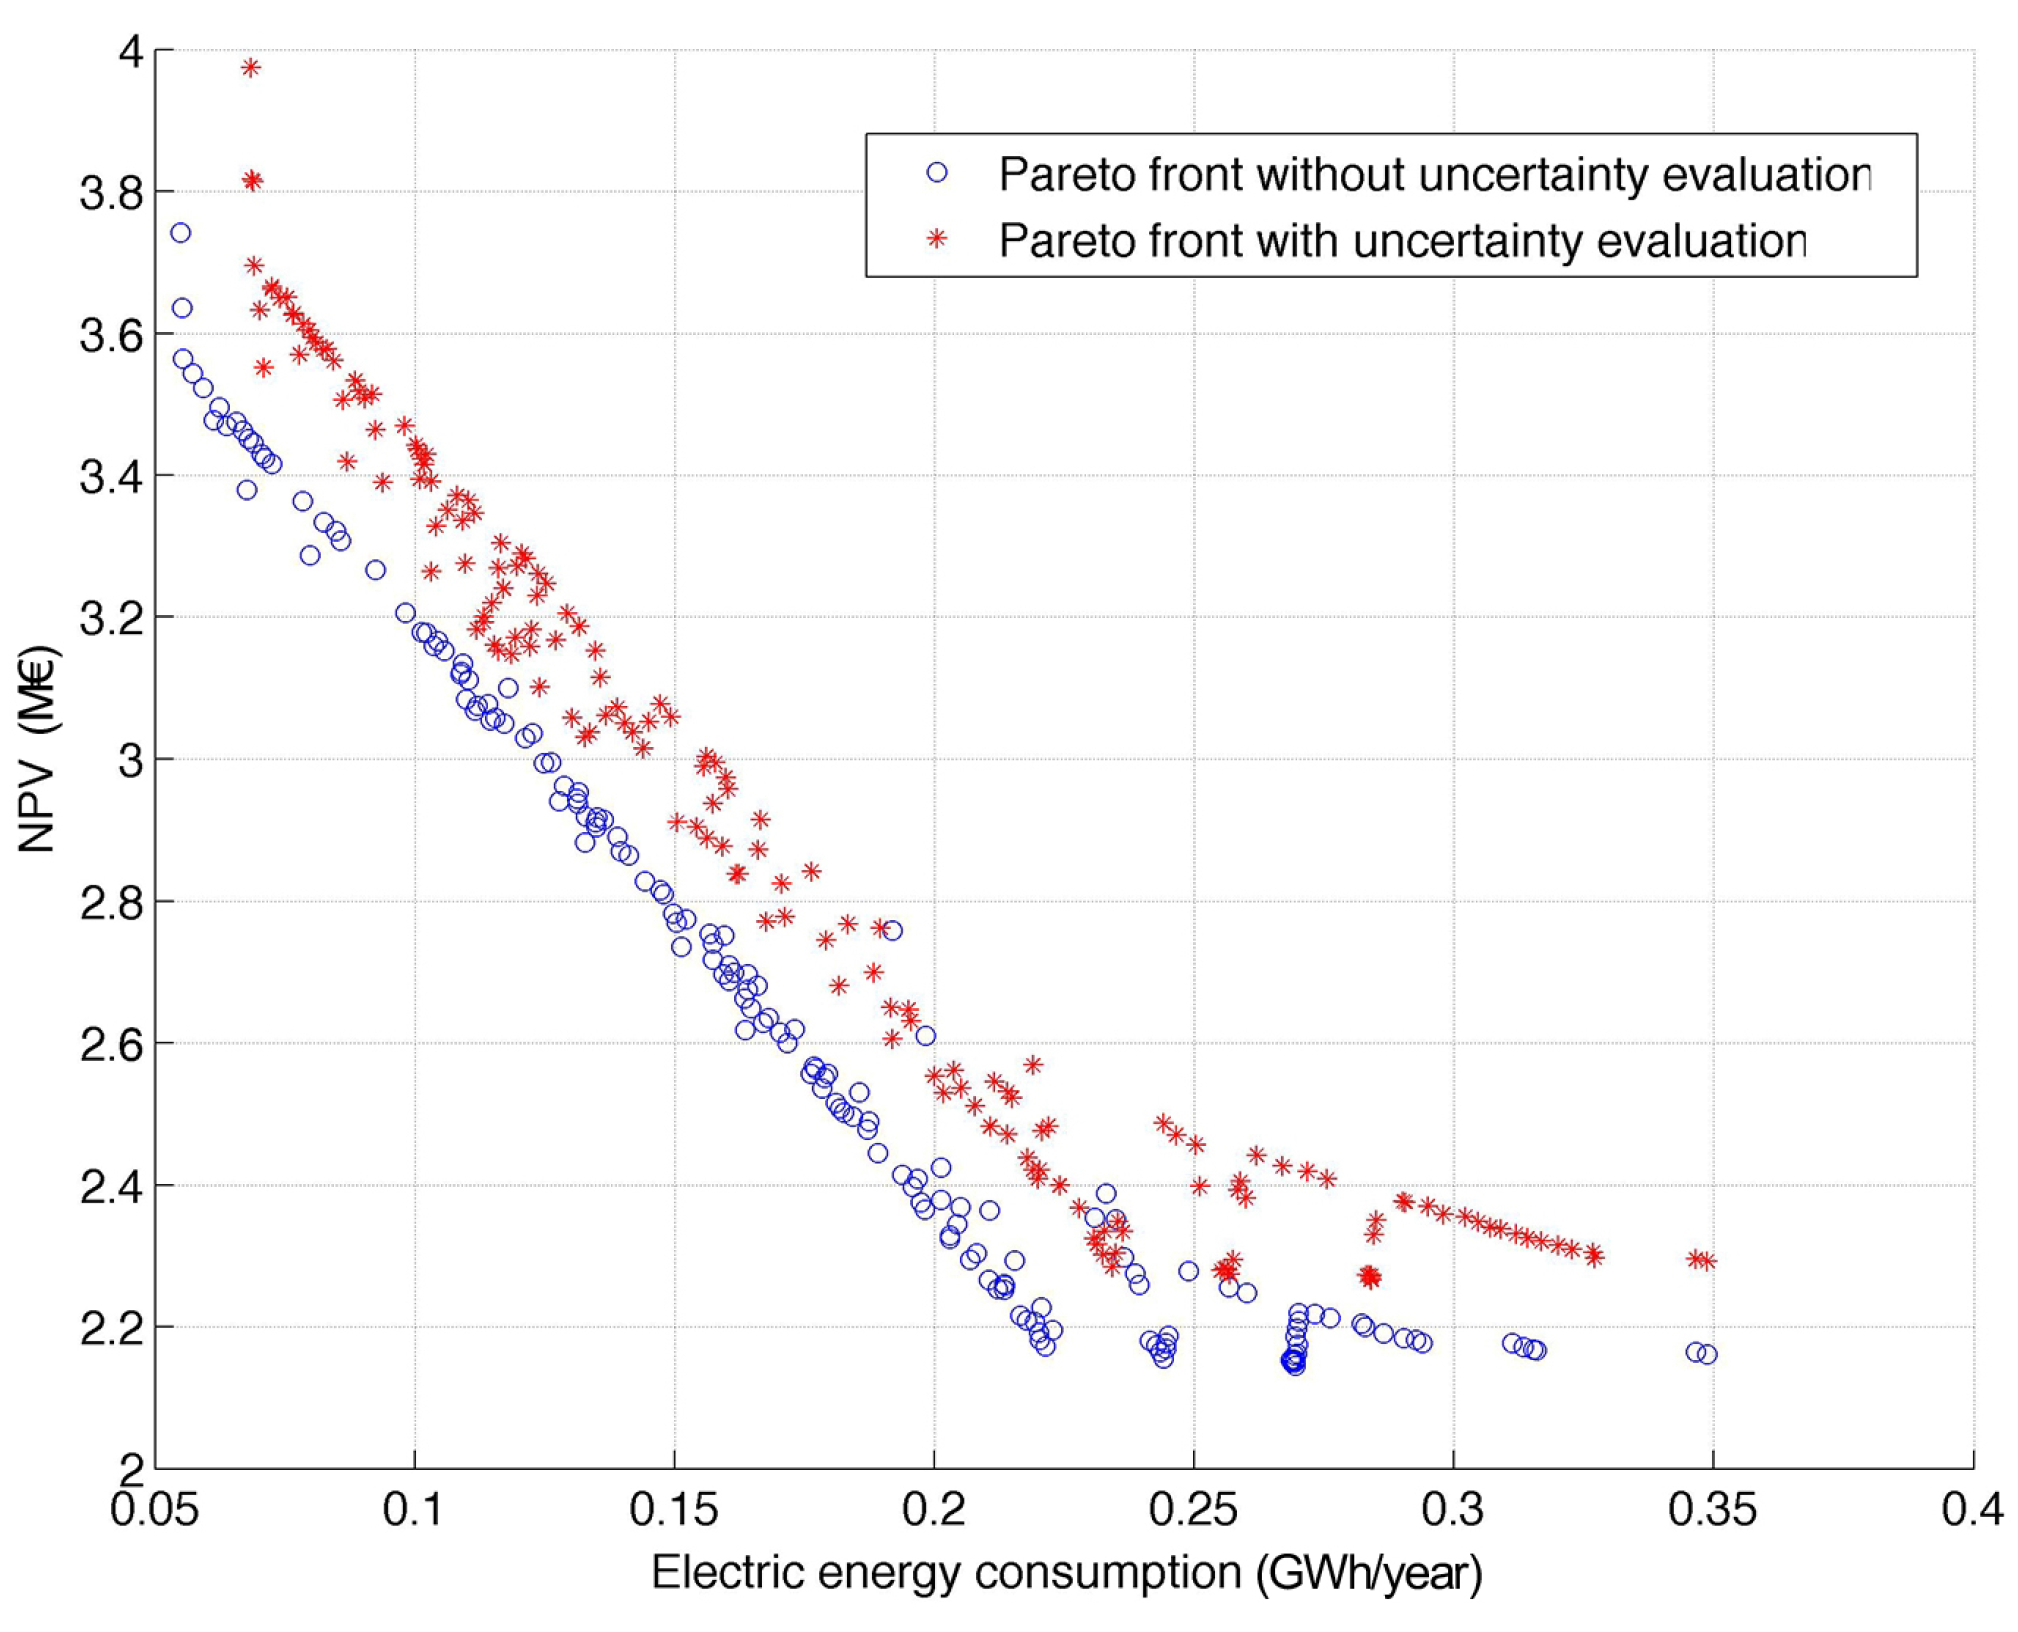
The results of the optimization under uncertainty are highlighted in
Figure 5, where the Pareto front is clearly shifted with respect to the one obtained without considering the uncertainties of the design variables, as in
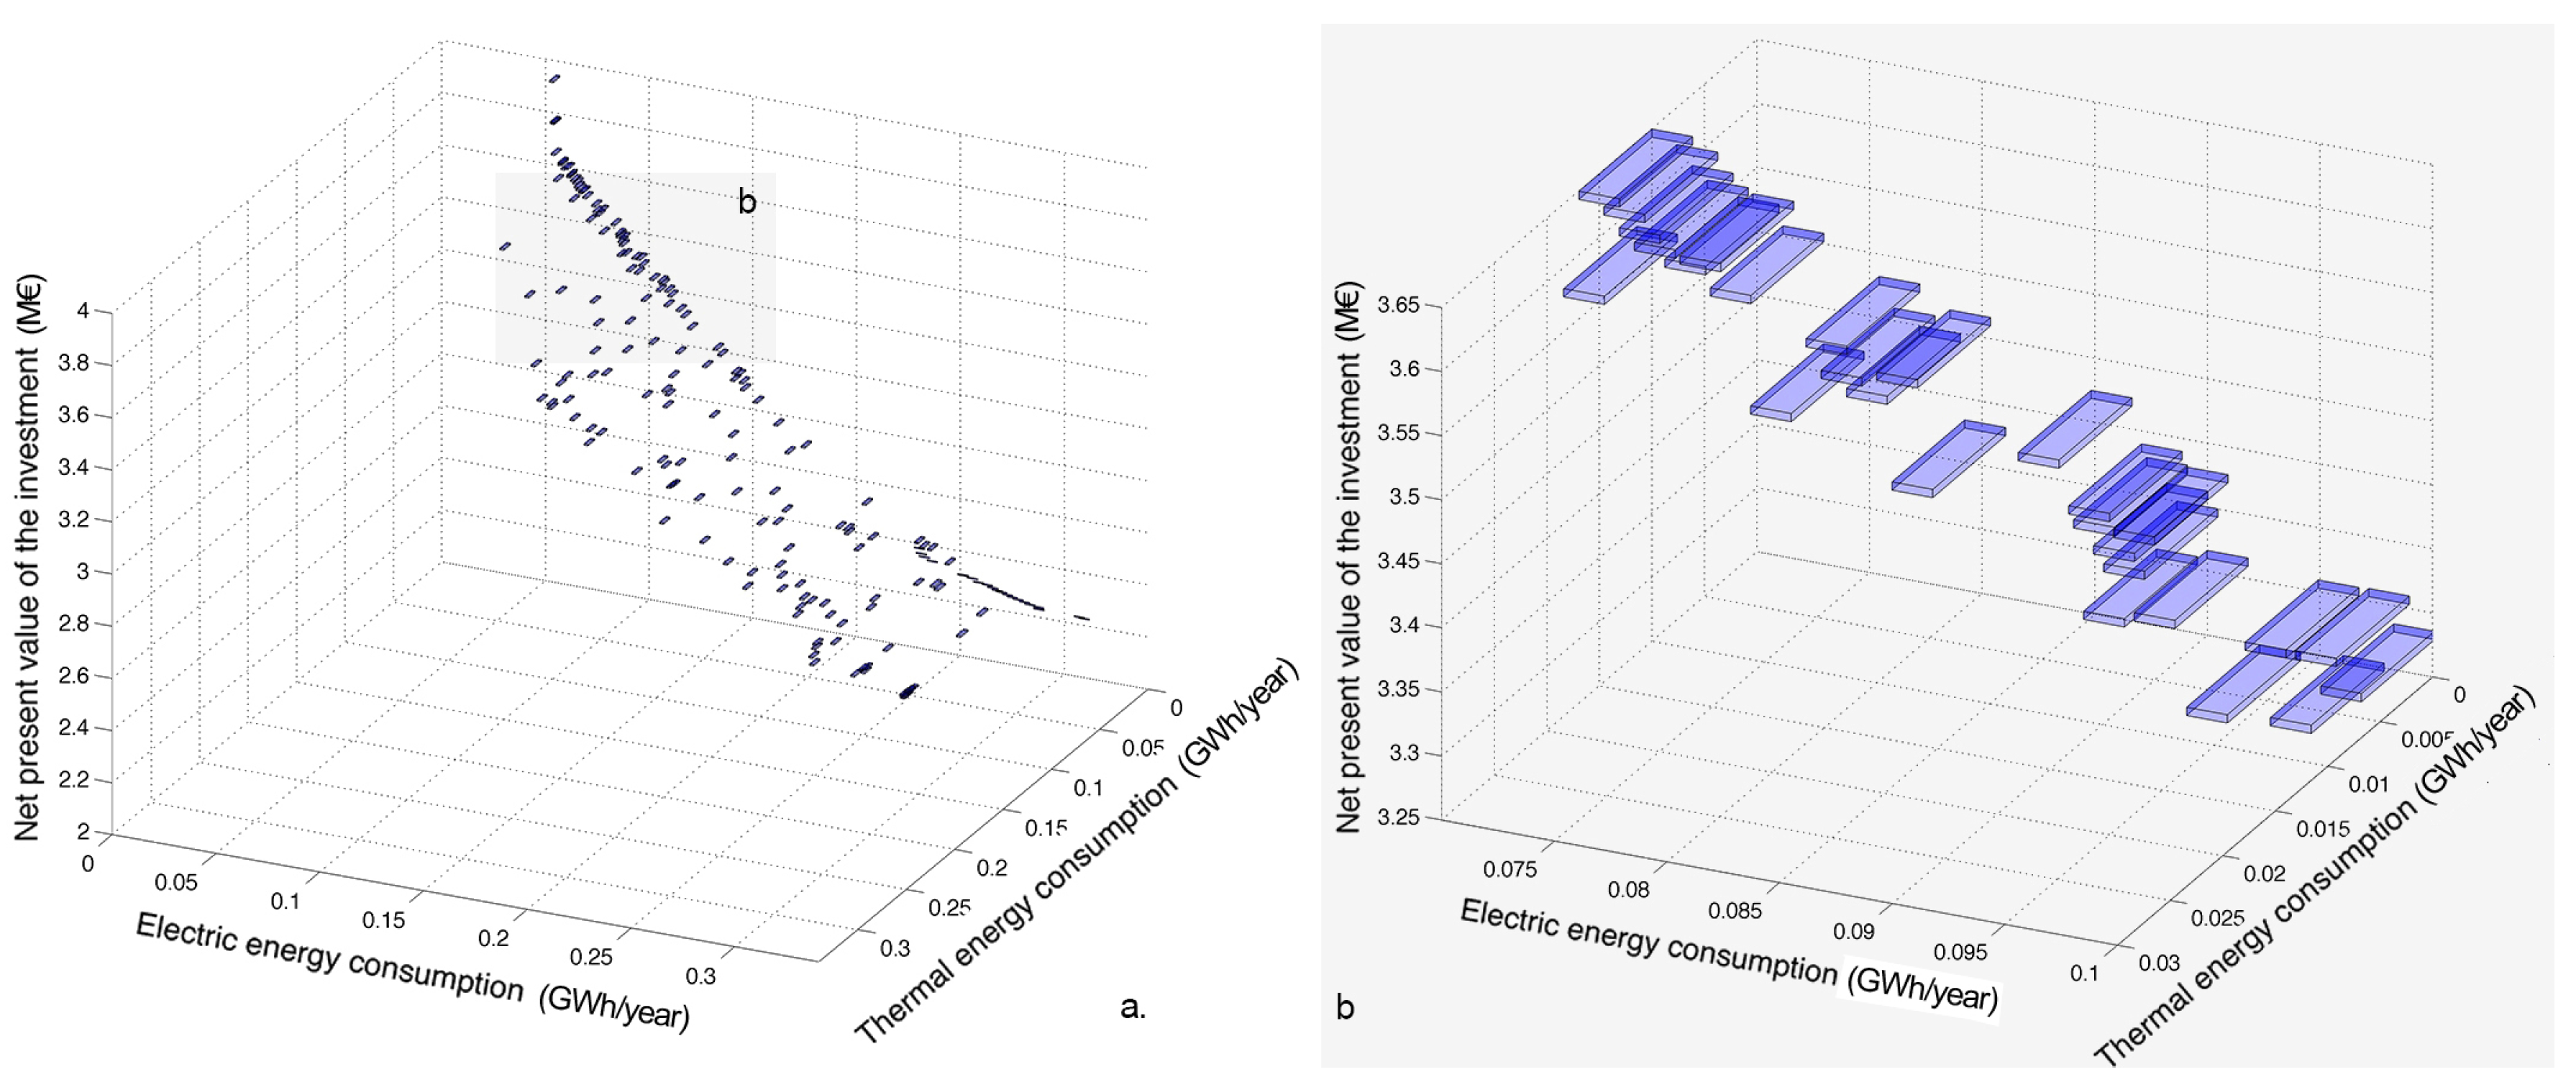
Section 4. After the optimization process, an a posteriori analysis may be performed, in order to evaluate the uncertainties of the optimized objective functions. Because each objective is characterized by its uncertainty, the representation of all the objectives in the same diagram is not feasible. The visualization of the Pareto front can be done by selecting a set of maximum three objectives, whose confidence intervals are represented as a parallelepiped for each configuration. For example, in
Figure 6a , three objectives (thermal energy consumption; electric energy consumption; Net Present Value of the investment) are represented: each side of the parallelepipeds represents the standard deviation of the three variables.
Because only the uncertainties related to the annual heating and cooling energy values are evaluated here, the size of the parallelepipeds is small, but it may happen that two volumes partially overlap each other (
Figure 6b). In that case, it is impossible to tell which of the two corresponding strategies gives better results. When taking into account the uncertainties of other parameters, the overall combined uncertainty, and thus the size of the parallelepipeds, will increase, eventually showing infeasible solutions (for example, NPV (Net Present Value) too high for the Administration). The procedure described above permits obtaining a comprehensive analysis tool, which allows not only to identify the optimal strategy, but also to evaluate the uncertainty of the objectives. This is essential to properly assess the effectiveness of the proposed interventions. The parameters corresponding to the identified optimal solution may then be used to perform detailed simulations of the complete building model, which can be also used for real-time simulations as proposed in [
28].
6. Conclusions
A procedure for sustainable design concepts in new construction or in retrofitting existing buildings has been presented. The design of a new test building has been taken as a case study to describe the proposed method. A set of controllable and fixed parameters has been used to represent the configuration of the test building and five objectives have been identified: minimization of thermal energy consumption, electric energy consumption, NPV of the investment, emissions of CO and maximization of the comfort level. A powerful multi-objective optimization genetic algorithm, NSGAII, has been used to define the optimized configuration of the test building. The algorithm is tested on the design of a new university building and a procedure is proposed for the selection of the optimized strategy for the specific case study. This procedure may be customized depending on the needs of the decision-makers and consists of a set of evaluation criteria that permit selection of the optimal strategy among all of the strategies proposed by the algorithm. This is done by analyzing, through multidimensional diagrams, the effects of all of the optimal strategies on all the objectives simultaneously. Then, a method to evaluate the effects of external constraints (for example, legal limits) has been presented. To show the potential of the proposed method, the test building optimization has been performed with and without imposing legal limits. The comparison between the performances with and without imposing these constraints has been allowed to evaluate the effects of legal limits on the performance of the building. The low connection between parameters adopted by the Administration and those affecting the performances of the building have been highlighted. This suggests that a systematic use of such method may improve national or regional strategies for the implementation of sustainable development policies. Finally, the effects of the uncertainty of the parameters of the model have been simulated through the Monte Carlo method of error propagation. The resulting effects modify the optimization process, as shown for the test building, where a clear shift of the front of Pareto is the result of having considered the uncertainty of two of the main parameters, the annual heating and cooling energy demand, used in the building model. Then, a representation through 3D diagrams has been used to show the uncertainties of the objective functions. Through the analysis of these diagrams obtained for the test building, it has been shown that, as a consequence of the uncertainty assessment, for some of the objective function values on the front of Pareto, it is impossible to tell which of the corresponding strategies leads to the best performance. These results have been obtained for the test building considering only the uncertainties related to two of the main parameters. When taking into account the uncertainties of all of the controlled and fixed parameters of the building model, the overall combined uncertainty necessarily may show, in the worst case, infeasible solutions. These evaluations have been used to point out how the uncertainty assessment is crucial for the entire optimization process. The results achieved turn out to be reliable and show the sustainability of this procedure to define both economic and environmental performance indicators, in order to select the optimal technical solutions for new or existing buildings. Moreover, further similar analysis on a set of buildings representative of a specific region, might be used to assist local/national administrations in the definition of appropriate legal limits, which will permit a strategic optimized extension of renewable energy production. Finally, the proposed approach could be applied to similar optimization models for the optimal planning of sustainable buildings, in order to define the best solutions among non-optimal ones.


