Article

Numerical Investigation on the Effect of Cementing Properties on the Thermal and Mechanical Stability of Geothermal Wells

1
School of Civil & Environmental Engineering, Georgia Institute of Technology, Atlanta, GA 30332, USA
2
School of Civil, Environmental, & Architectural Engineering, Korea University, Anam-Dong, Seongbuk-Gu, Seoul 02841, Korea
*
Author to whom correspondence should be addressed.
Energies 2016, 9(12), 1016; https://doi.org/10.3390/en9121016
Submission received: 9 August 2016 / Revised: 22 November 2016 / Accepted: 22 November 2016 / Published: 2 December 2016

Abstract

:
In this paper, a two-dimensional (2-D) Finite Element (FE) analysis of a geothermal well was performed with respect to five different cross-sections corresponding to the design specifications for the geothermal well that is currently constructed in Pohang, South Korea. Among the essential components (such as ground formation, casing, and cementing) of a geothermal well, the thermal and mechanical stability of the cementing component was discussed based on a series of parametric studies with consideration of the thermal conductivity and Young’s modulus of the cementing component. With increasing number of casing layers, the cementing component experiences less stress concentration. In addition, the lower thermal conductivity of the cementing material is advantageous for effectively controlling radial displacement. Consequently, it should be noted in geothermal well cementing construction that long-term strength degradation of the cementing might cause the severe structural instability of an entire geothermal well.

1. Introduction

At the World Summits on Sustainable Development (June 1992 in Rio, December 1997 in Kyoto, August 2002 in Johannesburg, and December 2015 in Paris), considerable emphasis has been placed on greenhouse gas emissions; strong recommendations have also been given to reduce the global consumption of fossil fuels and to make better use of the new and renewable energy sources, one of which is geothermal energy. Geothermal energy is the natural heat in the deep subsurface that can be extracted economically for the purpose of using as an energy source (Leibowitz, 1978) [1].
Since economically feasible geothermal resources in the Korean Peninsula are insufficient (Lee et al., 2010) [2], the Enhanced Geothermal System (EGS) can potentially be a promising renewable energy resources for generating electricity. The EGS concept is based on the enhancement of the porosity and the permeability of Hot Dry Rock (HDR) by injecting fluid. Since HDR has been hydro-fractured or stimulated, production wells can be drilled into the stimulated zone (refer to Figure 1).
In order to successfully complete and operate the geothermal power plant constructed by the EGS, extensive studies have been performed with respect to the stabilization of the transmission fluid (mostly water) (Xu et al., 2005) [3], improving thermodynamic cycles (Chen et al., 2010) [4], use of carbon dioxide (CO2) instead of water for subsidiary benefits (Brown, 2000; Pruess, 2006) [5,6] and hydraulic stimulation techniques for HDR (Sasaki, 1998; Pearson, 1981) [7,8]. Among these studies, the completion of geothermal well cementing is of considerable importance for the following reasons: (1) the hydrated cement slurry must have sufficient strength to support the steel casing that tends to elongate due to the temperature changes; (2) the cement slurry should pre-flash and displace the water-based drilling fluids; and (3) complete cementing is needed to protect the steel casing from corrosive fluids (Edward et al., 1982) [9]. Therefore, the cement material for completing geothermal wells also mechanically supports the steel casing and protects it from initial corrosion or erosion by geothermal fluids that are heated to a maximum of 320 °C (Sugama, 2006) [10].
In order to evaluate the thermal and mechanical stability of the geothermal well cementing, a 2-D FE analysis of the geothermal well was performed using ABAQUS according to five different cross-sections based on the design of the geothermal well that is constructed at Pohang, South Korea. As input parameters in the numerical model, the thermal conductivity and Young’s modulus of cured cement samples were measured in the laboratory experiments. These parameters are crucial in characterizing thermal and mechanical behavior of the geothermal well cementing. G-class cement, which is most frequently used as oil well cement, was adopted for the laboratory experiments since the design components and considerations of the geothermal well are similar to an oil well in many aspects such as construction procedures, well stability, and drilling depth. Finally, a parameter study for the cementing component was performed with respect to thermal conductivity and Young’s modulus to investigate the effect of each property on a mechanical stability of the well.

2. Laboratory Experiments

Each experiment for the G-class cement was performed based on the mixture design proposed by Philippacopoulos and Berndt (2000) [11] (Table 1).
The thermal conductivity of G-class cement was measured using a QTM-500 thermal conductivity meter equipped with a PD-13 probe (Kyoto Electronics, Kyoto, Japan). The cement specimen was cured in the mold with dimensions of 50 mm × 100 mm × 50 mm to measure the thermal conductivity. The QTM-500 thermal conductivity meter adopts the transient hot wire method corresponding to the following line source model (Kestin and Wakeham 1978; Roder 1981; Coquard et al., 2006) [12,13,14]:
k = Q 4 π ( T 2 T 1 ) ln ( t 2 t 1 )
where k is the thermal conductivity (W/mK), Q is the applied heating power per unit length (W/m), t1 and t2 are the two arbitrary elapse times after applying the power, and T1 and T2 are the temperatures at t1 and t2 (°C). The wire equipped in the probe both generates a certain amount of heating power and measures response temperatures (T1 and T2) from the specimen at times t1 and t2.
To investigate the temperature effect on the thermal conductivity of the specimen the thermal conductivity of the G-class cement specimens was measured under two different surrounding temperature conditions (20 and 50 °C) established using a constant temperature water bath. An acrylic cell was designed to circulate water around the cement specimen for a few hours with the two target temperatures before measuring the thermal conductivity (see details in Won et al. (2015) [15]). The measurement was limited to the two temperature conditions due to the restricted specification of the water bath. The results of the thermal conductivity measurement are shown in Table 2. As seen in Table 2, the thermal conductivity is lower at the surrounding temperature of 50 °C than 20 °C.
Due to the complexity of subsurface formation and the well construction procedure, the curing of cementing in geothermal wells can potentially take place under different temperature and moisture conditions. Depending on the curing condition, the mechanical properties of cementing may vary, possibly causing a mechanical stability problem in the well. Therefore, the uniaxial compressive strength test for G-class cement specimens was performed under two different curing conditions for 28 days. One is the dry curing condition at 100 °C and the other is the wet condition in a water bath at 21 °C. Cement specimens of 100 mm diameter and 200 mm height were used for the uniaxial compressive strength test, and three strain gauges were attached to each specimen (two in the longitudinal direction and one in the lateral direction), to evaluate the Young’s modulus from the stress-strain relationship. Four specimens using each curing condition were tested to obtain an average value of the Young’s modulus (E) and unconfined compressive strength (qu). An automatic compression testing machine was used for the test, and the Young’s modulus was evaluated from the stress-strain curve by drawing the secant slope between the strain corresponding to 40% of the ultimate compressive strength and the strain of 5.0 × 10⁻⁵ (ASTM, 2014) [16]. An arithmetic mean of the measured Young’s modulus and unconfined compressive strength are presented in Table 3. These values provide a reasonable range of material properties for the following parameter study (Won et al., 2015) [15]. The results, presented in Table 3, indicate that curing of the cement specimen under the wet condition leads to higher E and qu.

3. 2-D Numerical Modeling of the Geothermal Well

3.1. Preliminary Investigation

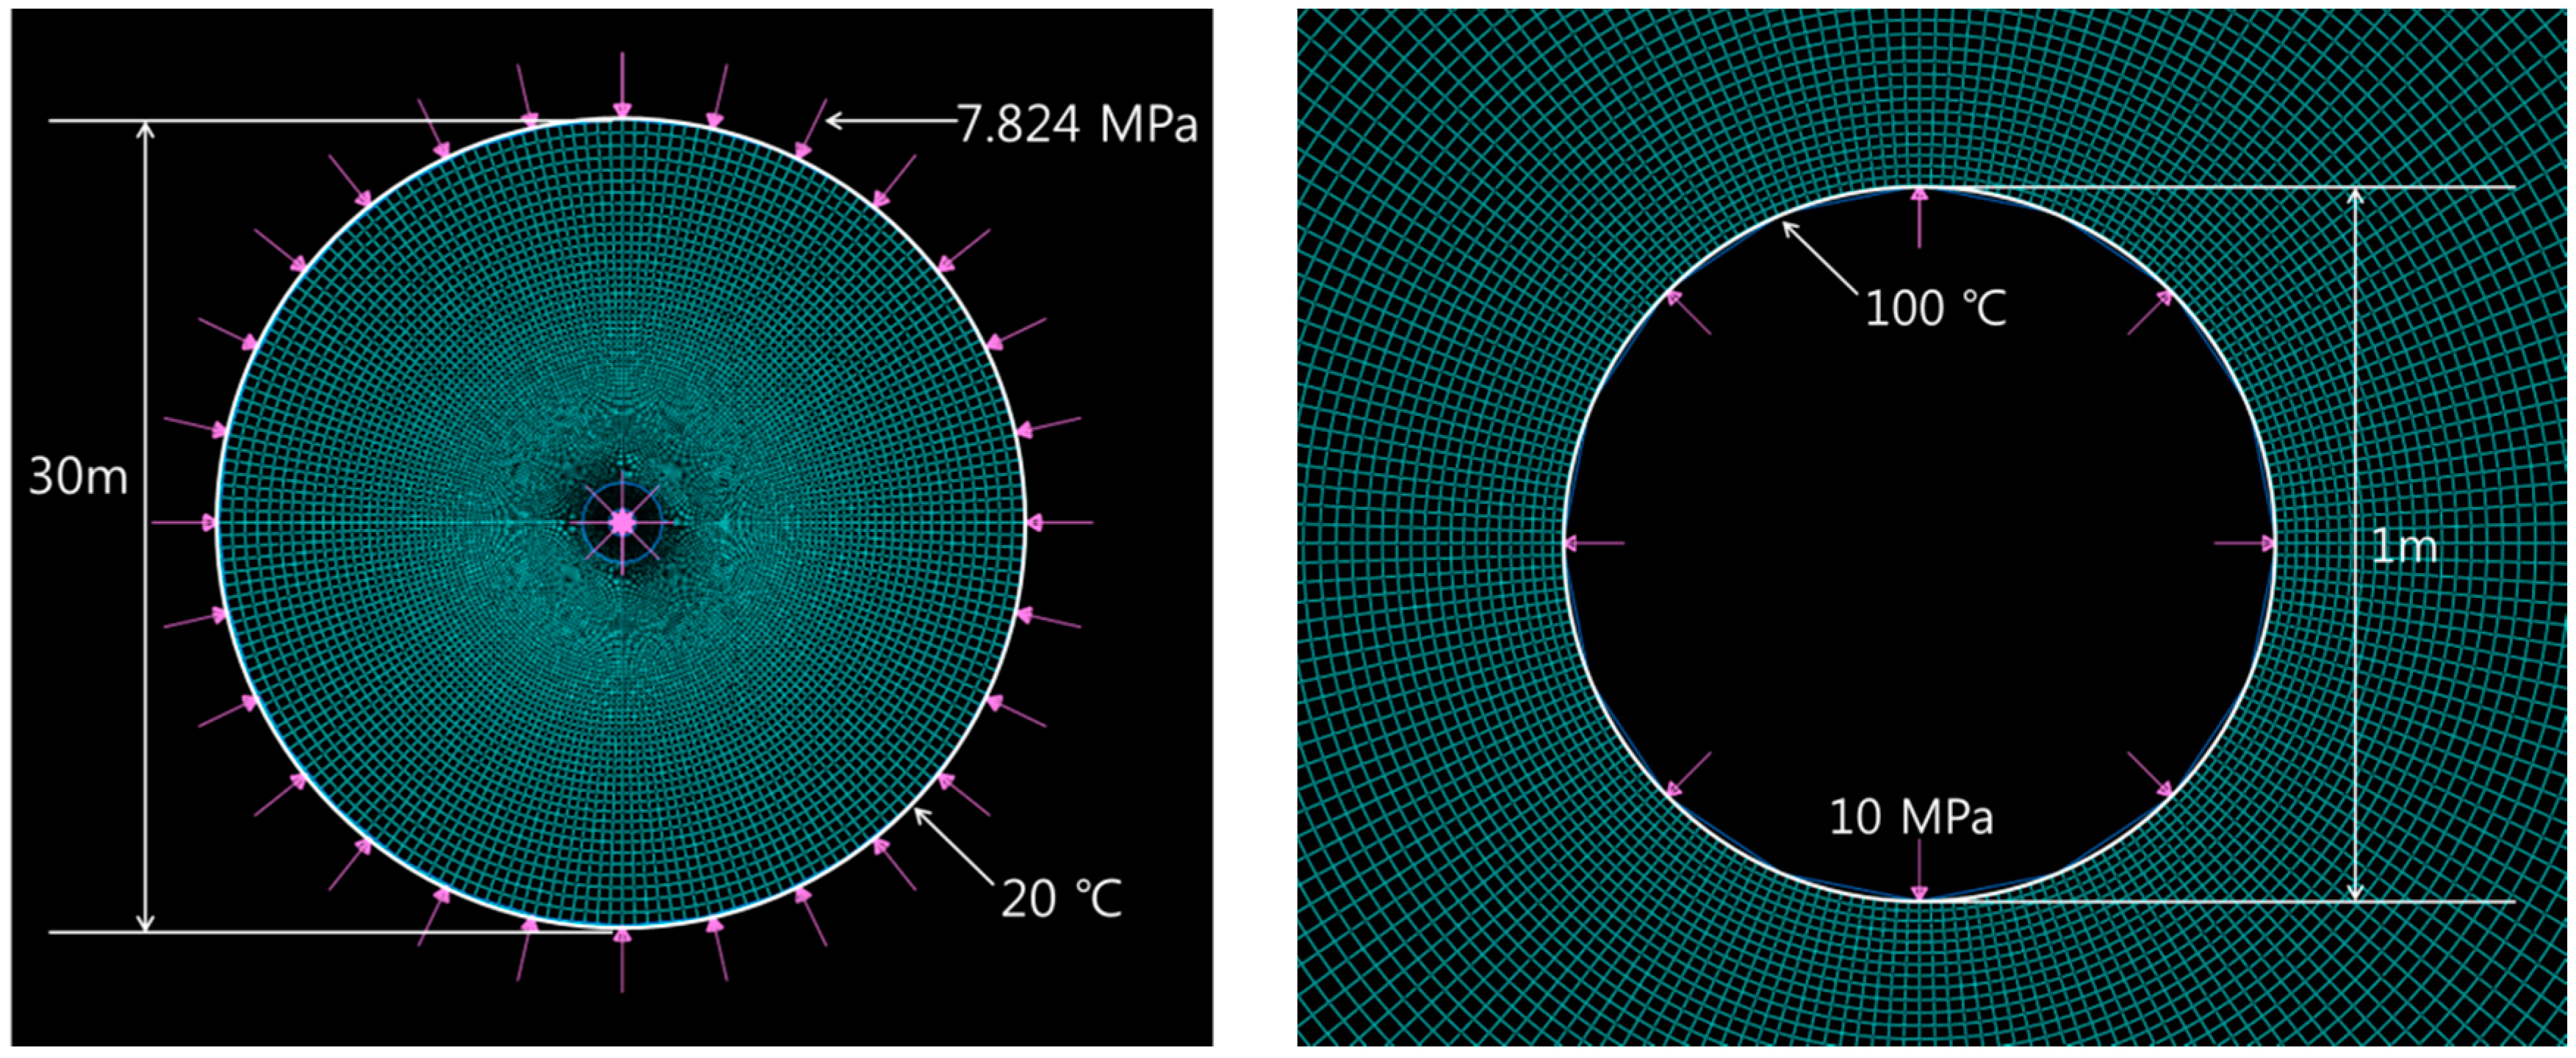
In order to verify boundary conditions around a geothermal wall, a 2-D plane strain model of a geothermal well under internal and external pressure loadings was generated in the domain (Figure 2), which will be adopted in the numerical analysis for the geothermal well. The well diameter is modeled to be 1.0 m corresponding to the diameter of the geothermal well at 200 m depth. The diameter of the model domain is 30.0 m, which is considerably greater than the well diameter to avoid boundary effects.
Four different boundary conditions applied to the model are presented in Table 4. The first boundary condition (Case 1) implies the first stage of well excavation only with horizontal earth stress (i.e., pressure). The second boundary condition (Case 2) represents an addition of internal fluid pressure to Case 1 to simulate well operation with no installation of the casing and cementing. In Case 3 and 4, thermal stress is applied to Case 1 and 2, respectively, by maintaining the temperature inside well at 100°C and in the ground formation at 20 °C.
The analytical closed-form solutions to Cases 1 and 2 are well referred and compared with results of the numerical analyses to verify the numerical model of the geothermal well. Kirsch’s solution to Case 1 provides the radial stress (σr), tangential stress (σθ), and radial displacement (ur) along with the normalized distance (r/a) from the center of well as follows (Hoek and Brown, 1980) [17]:
σ r = 0.5 σ v 0 { ( 1 + K 0 ) ( 1 ( a r ) 2 ) ( 1 K 0 ) ( 1 4 ( a r ) 2 + 3 ( a r ) 4 cos 2 θ ) }
σ θ = 0.5 σ v 0 { ( 1 + K 0 ) ( 1 + ( a r ) 2 ) ( 1 K 0 ) ( 1 + 3 ( a r ) 4 cos 2 θ ) }
u r = σ v 0 a 2 4 G r { ( 1 + K 0 ) ( 1 K 0 ) ( 4 ( 1 ν ) ( a r ) 2 ) cos 2 θ }
where σv0 is the initial in-situ vertical stress (Pa), K0 is the coefficient of earth pressure at rest (-) and assumed to be unity, a is the radius of well (m), r is the radial distance from the center of well (m), θ is the angle from the horizontal line (-), and G is the shear modulus of ground formation (Pa). When the model domain is much larger than the radius of well (r >> a), which corresponds to the numerical domain presented herein (refer to Figure 2), The analytical solutions to the boundary condition of Case 2 are obtained with consideration of internal fluid pressure (Pi) exerted inside the well described as follows:
σ r = P i ( a r ) 2 P 0 { 1 ( a r ) 2 }
σ θ = P i ( a r ) 2 P 0 { 1 + ( a r ) 2 }
u r = r 2 G [ P i ( a r ) 2 P 0 { 1 ν 1 + ν + ( a r ) 2 } ]
where P0 is the external pressure applied to outside boundary (Pa), and ν is the Poisson’s ratio of ground (-).
The effect of boundary conditions for Cases 3 and 4 was exclusively evaluated by numerical analysis since there is no appropriate analytical solution relevant to such boundary conditions. The material properties input in the numerical model are summarized in Table 5, which corresponds to the result of the site investigation in the Pohang site (Lee, 2007) [18]. In other to apply thermal stress in Cases 3 and 4, the ground temperature was set to 20 °C representing the temperature at shallow depth (less than 200 m), and the temperature inside well of 100 °C was applied to consider high fluid temperature during operation of a production well.
Figure 3 compares the four boundary conditions demonstrating the tangential stress (σθ), radial stress (σr) and radial displacement (ur) along with the normalized radial distance (r/a). For Cases 1 and 2, the σθ, σr, and ur profiles obtained from the numerical analyses are in a good agreement with the analytical solutions (Equations (2)–(4) for Case 1 and Equations (5)–(7) for Case 2). In Case 1, representing the first stage of well excavation without internal fluid pressure, it is observed that the tangential stress is concentrated around the well perimeter, and the radial stress has vanished, which are typical in the elastic solution for a circular hole. In Case 2 with application of internal fluid pressure (10 MPa), the tangential stress decreases, and the radial stress increases substantially by applying the inner pressure. Both the tangential and radial stresses asymptotically converge to the horizontal earth pressure with increasing the radial distance (r/a > 5).
The largest value of tangential stress around the well perimeter is observed in Case 3 due to the induced thermal stress by applying the temperature inside well at 100 °C and in the ground formation at 20 °C, respectively. However, Case 4 that approximately represents a real geothermal well in operation shows less tangential stress concentration than Case 3 because the induced thermal stress seems to be counterbalanced with the inner pressure. The radial displacement, which is one of the crucial considerations for the well stability, is compared in Figure 3c. The positive signed displacement means convergence into the well or inward displacement. Both Cases 1 and 2 show a positive radial displacement, with smaller convergence in Case 2 due to the application of internal fluid pressure. However, the induced temperature boundary conditions (i.e., Cases 3 and 4) yield thermal expansion, which causes a negative signed displacement. Similar to the tangential stress profile, Case 3 shows the steepest change in radial displacement due to the absence of inner pressure, which indicates well stability can be undermined without the application of proper internal fluid pressure.

3.2. Geothermal Well Modeling

A series of numerical analyses were performed for simulating a production well with five different cross-sections at depths of 200, 1000, 1500, 2000 and 2500 m from the ground surface. The configuration of each cross-section was determined based on the schematic drawing of the geothermal well (as shown in Figure 4), which is under construction in Pohang, South Korea. The number of casing and cementing component layers decreases as the well goes deeper reflecting the configuration of cross sections at each depth. The dimension of the entire model domain is more than 15 times as large as the well diameter to minimize the boundary effect.
A large deformation analysis was performed using the ABAQUS/Standard program with generating 26,200 quad structured meshes in the domain. Sequentially, a series of coupled thermal stress analyses was implemented to observe thermo-mechanical behavior of the geothermal well. An axisymmetric model was adopted in this paper for computational efficiency (a quarter of Figure 2). Meshes were made smaller and more compact approaching from the outer ground boundary to the center of the well by applying the proper bias ratio at the straight edge of the domain. The convergence of the analysis was obtained until the largest residual force at any node is less than 0.5%. Bae et al. (2008) [19] reported the range of horizontal stress distribution with depth by performing a linear regression of the measured data adjacent to the Pohang area. In this paper, the in-situ horizontal stress for each depth was determined by averaging the upper and lower bound of horizontal stresses, which was applied to the outer boundary of the model domain corresponding to the five designated depths (200, 1000, 1500, 2000 and 2500 m). The in-situ ground temperature profile was obtained by adopting the Bullard method as follows (Bullard 1939; Beck and Sass 1966) [20,21]:
T ( z ) = T 0 + q i = 1 N Δ z i k i
where T(z) is the in-situ ground temperature at depth z (°C), T0 is the ground surface temperature (°C), q is the heat flow (W/m2), ∆zi is ith depth interval (m), and ki is the average thermal conductivity at ∆zi (W/mK or W/m·°C). According to the thermal characteristics of the Pohang area, T0 = 15 °C, q = 78.3 MW/m2 and ki = 2.8 W/mK were applied in the model.
Refering to Table 5, the thermal and mechanical properties of the ground formation were obained from the experimental data for the Pohang area (Lee, 2007) [18]. The typical thermal and mechanical properties of the casing and cementing adopted in the model are summarized in Table 6. In addition, the thermal conductivity of the cementing component was selected to be 0.5 W/mK, which reflects the decreasing trend of thermal conductivity with an increase in the surrounding temperature (refer to Table 2). Young’s modulus and Poisson’s ratio of cementing were determined by the uniaxial strength test presented in the previous section and density of cementing was applied based on the mixture design presented in Table 1 (Philippacopoulos and Berndt, 2000 [11]). The coefficient of thermal expansion and specific heat of cementing were referred to typical ranges of two properties presented in Cruz and Gillen (1980) [22] and Fu and Chung (1997) [23], respectively, and properties of casing were referred to steel properties presented in Eurocode 3 (1993) [24].
The inner pressure was assumed to be 10 MPa regardless of the depth with consideration of the Soultz project case in France (Tester et al., 2006) [25], and the temperature in the well was fixed to 180 °C at 5 km, which is the target temperature of the Pohang project at the depth of 5 km (Lee et al., 2011) [26]. The maximum temperature difference between the geothermal reservoir and circulating fluid at the ground surface was assumed to be 20 °C. In other words, the thermal energy is dissipated in the production well while the circulating fluid transports from the deep subsurface to the ground surface with the final temperature of 160 °C at the surface.

3.3. Numerical Simulation of Geothermal Well

The numerical simulation results are compared in Figure 5, which shows the profiles of tangential stress, radial stress, and radial displacement at the different depths. All results are plotted herein from the first layer of inner casing (r/a = 1) to the far field of the ground with r/a ratio of 4. The positive sign indicates compressive stress to the material, and the negative signed radial displacement indicates the expansion of the geothermal well.
At all five designated depths, the tangential stress concentration is much greater than the radial stress in terms of the thermo-mechanical behavior of the geothermal well. As shown in Figure 5a, the first inner casing component is most vulnerable to tangential stress concentration with the maximum tangential stress of about 110 MPa at 1000 m depth, which is slightly lower than the compressive strength of ordinary steel normally, that is about 150 MPa. Note that the geothermal well undergoes tensile stress in some parts at the depth of 200 m. On the other hand, at the depths of 1000, 1500, and 2000 m, the outer cementing component undergoes relatively high tangential stress compared with the surrounding ground formation due to the relatively higher Young’s modulus. Since steel possesses high tensile strength (normally about 400 MPa), mechanical stability should be considered in the most outer cementing component at 200 m depth because cement only has a tensile strength of a few MPa. As the number of casing components increases, the less tangential stress concentration is exerted to the cementing component, so the steel casing can take the role of protecting the cementing component.
As shown in Figure 5b, the radial stress at the first inner casing (r/a = 1) is equal to the applied inner pressure of 10 MPa. With exhibiting radial stress concentration at the streel casings due to high modulus, the radial stress is asymptotically converged to the horizontal earth pressure exerted at each designated depth.
The radial displacement shows a negative sign (i.e., the geothermal well is expanded) at all designated depths and all components of the geothermal well due to the application of inner fluid pressure and the thermal expansion. The deeper the designated depth is, the less radial displacement is induced. That is to say, the radial displacement is greatest at the depth of 200 m because of the relatively high thermal expansion (the high temperature difference between the inside well and surrounding ground formation). One additional reason for this is that increasing of in-situ horizontal stress with depth may compensate the effect of the inner fluid pressure and thermal expansion.

4. Parametric Study for Cementing Component

In this paper, a parametric study was performed to investigate the effect of the thermal conductivity and Young’s modulus of cementing components. All of the properties were varied from the standard values that are obtained from the experimental data (Table 2 and Table 3). Only the results at the designated depths of 200, 1000, and 2500 m are presented in this paper because those at 1000, 1500, and 2000 m depth show the similar trend. Under the same properties (thermal conductivity and Young’s modulus) of the cementing part, slightly different stress and displacement between those three depths were observed, which is attributed to applying the different inner and ground temperatures.

4.1. Effect of Thermal Conductivity

Figure 6, Figure 7 and Figure 8 show the tangential and radial stress, and radial displacement at the different depths of the geothermal well with a variation of the thermal conductivity in the cementing component. The standard thermal conductivity of the cementing component was assumed to be 0.5 W/mK at 100 °C by referring to the experimental results of G-class cement in Table 2. The parametric study was performed with the thermal conductivity of 0.5, 1.0, 1.5 and 2.0 W/mK to investigate the effect of thermal conductivity of the cementing component on the mechanical behavior of geothermal wells.
The temperature difference between the geothermal well and the surrounding ground formation increases when the thermal conductivity of the cementing material decreases, which results in a marginal increase in the tangential stress and radial stress. As a result, the largest concentration of tangential stress takes place at the most inner casing when the thermal conductivity of cementing is 0.5 W/mK regardless of depth (Figure 6a, Figure 7a and Figure 8a). On the other hand, the variation of the tangential and radial stress, and radial displacement according to the thermal conductivity decreases as the depth of the geothermal well increases, which increases the temperature of the surrounding ground formation (i.e., the temperature difference between the geothermal well and the surrounding ground formation becomes lessened). This implies that the geothermal well at relatively deep underground should be less affected by the thermal properties of cementing than the well at shallow depth.
Moreover, it should be pointed out that the radial stress in the inner cementing components (Cementing No. 1 and 2 at depth of 200 m, and Cementing No. 1 at depth of 1000 m) increases as the thermal conductivity decreases. However, this trend becomes reversed in the outmost cementing component and the ground formation. This is because the inner cementing may be more significantly affected by the internal fluid pressure, which yields compensation between the inner fluid pressure and thermal expansion.
On the other hand, the low thermal conductivity of the cementing component is effective in terms of the radial displacement control. Note that the thermal conductivity of cementing component directly affects the thermal expansion of the geothermal well (refer to Figure 6a, Figure 7a and Figure 8a). In addition, using the cementing material with lower thermal conductivity is known to be more advantageous with respect to the efficiency of electric power generation in geothermal wells because the cementing can more successfully insulate the geothermal well from heat. Consequently, the low thermal conductivity of cementing material is effective not only for the efficiency of electric power generation, but also for the radial displacement control of geothermal wells.

4.2. Effect of Young’s Modulus

Figure 9, Figure 10 and Figure 11 show the tangential and radial stress, and radial displacement at the different depths of the geothermal well with a variation of the Young’s modulus of the cementing component. The Young’s modulus of 26,000 MPa for the cementing component was selected for the standard value according to the experimental result in Table 3 (i.e., cured in the water bath at 21 °C for 28 days). The parametric study was performed with the Young’s modulus of 10,000, 15,000, 20,000, and 26,000 MPa to investigate the effect of the Young’s modulus of the cementing component on the mechanical behavior of geothermal wells.
The tangential and radial stress exerted in the geothermal well increase with an increase in the Young’s modulus of the cementing component (Figure 9, Figure 10 and Figure 11). In addition, a smaller stress and displacement variation was observed at the deeper position of the geothermal well, which is similar to the results obtained with different thermal conductivities of the cementing. Unlike less expansion of the well under low thermal conductivity of the cementing as presented in Figure 6c, a clear crossover point of radial displacement profiles was observed under different Young’s modulus values at all depths as presented in Figure 9c, Figure 10c and Figure 11c. Overall, it can be concluded that a lower Young’s modulus of the cementing is more advantageous in the concentration of stress at the casing, while it is not always beneficial to control the radial displacement of the well.

5. Conclusions

In this paper, a two-dimensional (2-D) FE analysis of a geothermal well was performed with consideration of the thermal and mechanical properties of the G-class cement. In addition, a series of parametric studies for the thermal conductivity and Young’s modulus of the cementing component has been performed. The findings in the current study are summarized as follows:
(1)
The FE analysis of the geothermal well at five different depths revealed that the outer cementing undergoes relatively high tangential stress compared with the surrounding ground formation due to the relatively higher Young’s modulus. In addition, increasing the number of casings can lessen the tangential stress concentration in the cementing component.
(2)
During numerically simulating operation of the geothermal power plants, the geothermal well experiences expansion outward (i.e., negative-signed radial displacement) at all designated depths and all components of the geothermal well because of the combined effect of the inner fluid pressure and the thermal expansion.
(3)
Relatively low thermal conductivity of G-class cement (0.62–0.68 W/mK) might be suitable for geothermal wells to prevent heat loss in the production well, but it may still induce more concentration of tangential stress at the most inner casing based on the FE analysis. However, the low thermal conductivity of the cementing is effective to decrease the well expansion.
(4)
The variation of the tangential and radial stress, and radial displacement according to the thermal conductivity decreases as the depth of the geothermal well increases, which is caused by the temperature difference between the geothermal well and the surrounding ground formation.
(5)
The tangential and radial stress exerted in the geothermal well increase with an increase in the Young’s modulus of the cementing component. However, the variation of the stress and displacement along with the Young’s modulus decreases as the depth of the geothermal well increases.

Acknowledgments

The authors appreciate the support partially by the Korea Agency for Infrastructure Technology Advancement under the Ministry of Land, Infrastructure and Transport of the Korean government (Project No. 13SCIP-B066321-01, Development of Key Subsea Tunneling Technology) and by National Research Foundation of Korea Government (NRF-2014R1A2A2A01007883).

Author Contributions

All of the authors have equal contribution to the work presented in this article. Especially, Jongmuk Won and Hangseok Choi played a major role in performing the numerical analyses and writing the manuscript.

Conflicts of Interest

The authors declare no conflict of interest.

References

  1. Leibowitz, L.P. California’s geothermal resource potential. Energy Sources 1978, 3, 293–311. [Google Scholar] [CrossRef]
  2. Lee, Y.; Park, S.; Kim, J.; Kim, H.C.; Koo, M.H. Geothermal resource assessment in Korea. Renew. Sustain. Energy Rev. 2010, 14, 2392–2400. [Google Scholar] [CrossRef]
  3. Xu, T.; Apps, J.A.; Pruess, K. Mineral sequestration of carbon dioxide in a sandstone-shale system. Chem. Geol. 2005, 217, 295–318. [Google Scholar] [CrossRef]
  4. Chen, H.; Goswami, D.Y.; Stefanakos, E.K. A review of thermodynamic cycles and working fluids for the conversion of low-grade heat. Renew. Sustain. Energy Rev. 2010, 14, 3059–3067. [Google Scholar] [CrossRef]
  5. Brown, D.W. A hot dry rock geothermal energy concept utilizing supercritical CO2 instead of water. In Proceedings of the Twenty-Fifth Workshop on Geothermal Reservoir Engineering, Stanford, CA, USA, 24–26 January 2000; pp. 233–238.
  6. Pruess, K. Enhanced geothermal systems (EGS) using CO2 as working fluid—A novel approach for generating renewable energy with simultaneous sequestration of carbon. Geothermics 2006, 35, 351–367. [Google Scholar] [CrossRef]
  7. Sasaki, S. Characteristics of microseismic events induced during hydraulic fracturing experiments at the Hijiori hot dry rock geothermal energy site, Yamagata, Japan. Tectonophysics 1998, 289, 171–188. [Google Scholar] [CrossRef]
  8. Pearson, C. The relationship between microseismicity and high pore pressures during hydraulic stimulation experiments in low permeability granitic rocks. J. Geophys. Res. Solid Earth 1981, 86, 7855–7864. [Google Scholar] [CrossRef]
  9. Edwards, L.M.; Chilingar, G.V.; Rieke, H.H., III; Fertl, W.H. Handbook of Geothermal Energy; Gulf Publishing Co.: Houston, TX, USA, 1982. [Google Scholar]
  10. Sugama, T. Advanced Cements for Geothermal Wells; Brookhaven Science Laboratories under Contract No. DEAC02-98Ch10886 with the US Department of Energy; Brookhaven Science Laboratories: Upton, NY, USA, 2006. [Google Scholar]
  11. Philippacopoulos, A.J.; Berndt, M.L. Characterization and modeling of cements for geothermal well casing remediation. Trans. Geotherm. Resour. Counc. 2000, 24, 81–86. [Google Scholar]
  12. Kestin, J.; Wakeham, W.A. A contribution to the theory of the transient hot-wire technique for thermal conductivity measurements. Phys. A Stat. Mech. Appl. 1978, 92, 102–116. [Google Scholar] [CrossRef]
  13. Roder, H.M. A transient hot wire thermal conductivity apparatus for fluids. J. Res. Natl. Bur. Stand 1981, 86, 457–493. [Google Scholar] [CrossRef]
  14. Coquard, R.; Baillis, D.; Quenard, D. Experimental and theoretical study of the hot-wire method applied to low-density thermal insulators. Int. J. Heat Mass Transf. 2006, 49, 4511–4524. [Google Scholar] [CrossRef]
  15. Won, J.; Lee, D.; Na, K.; Lee, I.M.; Choi, H. Physical properties of G-class cement for geothermal well cementing in South Korea. Renew. Energy 2015, 80, 123–131. [Google Scholar] [CrossRef]
  16. ASTM International. Standard Test Method for Compressive Strength and Elastic Moduli of Intact Rock Core Specimens under Varying States of Stress and Temperatures; ASTM D7012-14; ASTM International: West Conshohocken, PA, USA, 2014. [Google Scholar]
  17. Hoek, E.; Brown, E.T. Underground Excavations in Rock; No. Monograph; CRC Press: Boca Raton, FL, USA, 1980. [Google Scholar]
  18. Lee, T.J. Development of Exploitation Technologies for Geothermal Resources; Research Report GP2007-002-01-2007; Korea Institute of Geoscience and Mineral Resources (KIGAM): Daejeon, Korea, 2007; p. 161. [Google Scholar]
  19. Bae, S.H.; Jeon, S.W.; Kim, J.M.; Kim, J.S. Characteristics of the regional rock stress field at shallow depth in the Kyungsang Basin with in-situ rock stress measurement. J. Korean Soc. Rock Mech. 2008, 18, 149–161. [Google Scholar]
  20. Bullard, E.C. Heat flow in South Africa. Proc. R. Soc. Lond. Ser. A Math. Phys. Sci. 1939, 173, 474–502. [Google Scholar] [CrossRef]
  21. Beck, A.E.; Sass, J.H. A preliminary value of heat flow at the Muskox Intrusion near Coppermine, N.W.T., Canada. Earth Planet. Sci. Lett. 1966, 1, 123–129. [Google Scholar] [CrossRef]
  22. Cruz, C.R.; Gillen, M. Thermal expansion of Portland cement paste, mortar and concrete at high temperatures. Fire Mater. 1980, 4, 66–70. [Google Scholar] [CrossRef]
  23. Fu, X.; Chung, D.D.L. Effects of silica fume, latex, methylcellulose, and carbon fibers on the thermal conductivity and specific heat of cement paste. Cem. Concr. Res. 1997, 27, 1799–1804. [Google Scholar] [CrossRef]
  24. European Committee. Eurocode 3: Design of Steel Structures—Part 1.2: General Rules—Structural Fire Design; European Committee for Standardization: Brussels, Belgium, 1993; pp. 1–2. [Google Scholar]
  25. Tester, J.W.; Anderson, B.; Batchelor, A.; Blackwell, D.; DiPippo, R.; Drake, E.; Petty, S. The Future of Geothermal Energy: Impact of Enhanced Geothermal Systems (EGS) on the United States in the 21st Century; Massachusetts Institute of Technology: Cambridge, MA, USA, 2006; p. 209. [Google Scholar]
  26. Lee, T.J.; Song, Y.; Yoon, W.S.; Kim, K.; Jeon, J.; Min, K.; Cho, Y. The first enhanced geothermal system project in Korea. In Proceedings of the 9th Asian Geothermal Symposium, Kagoshima, Japan, 7–9 November 2011; Volume 7, p. 9.
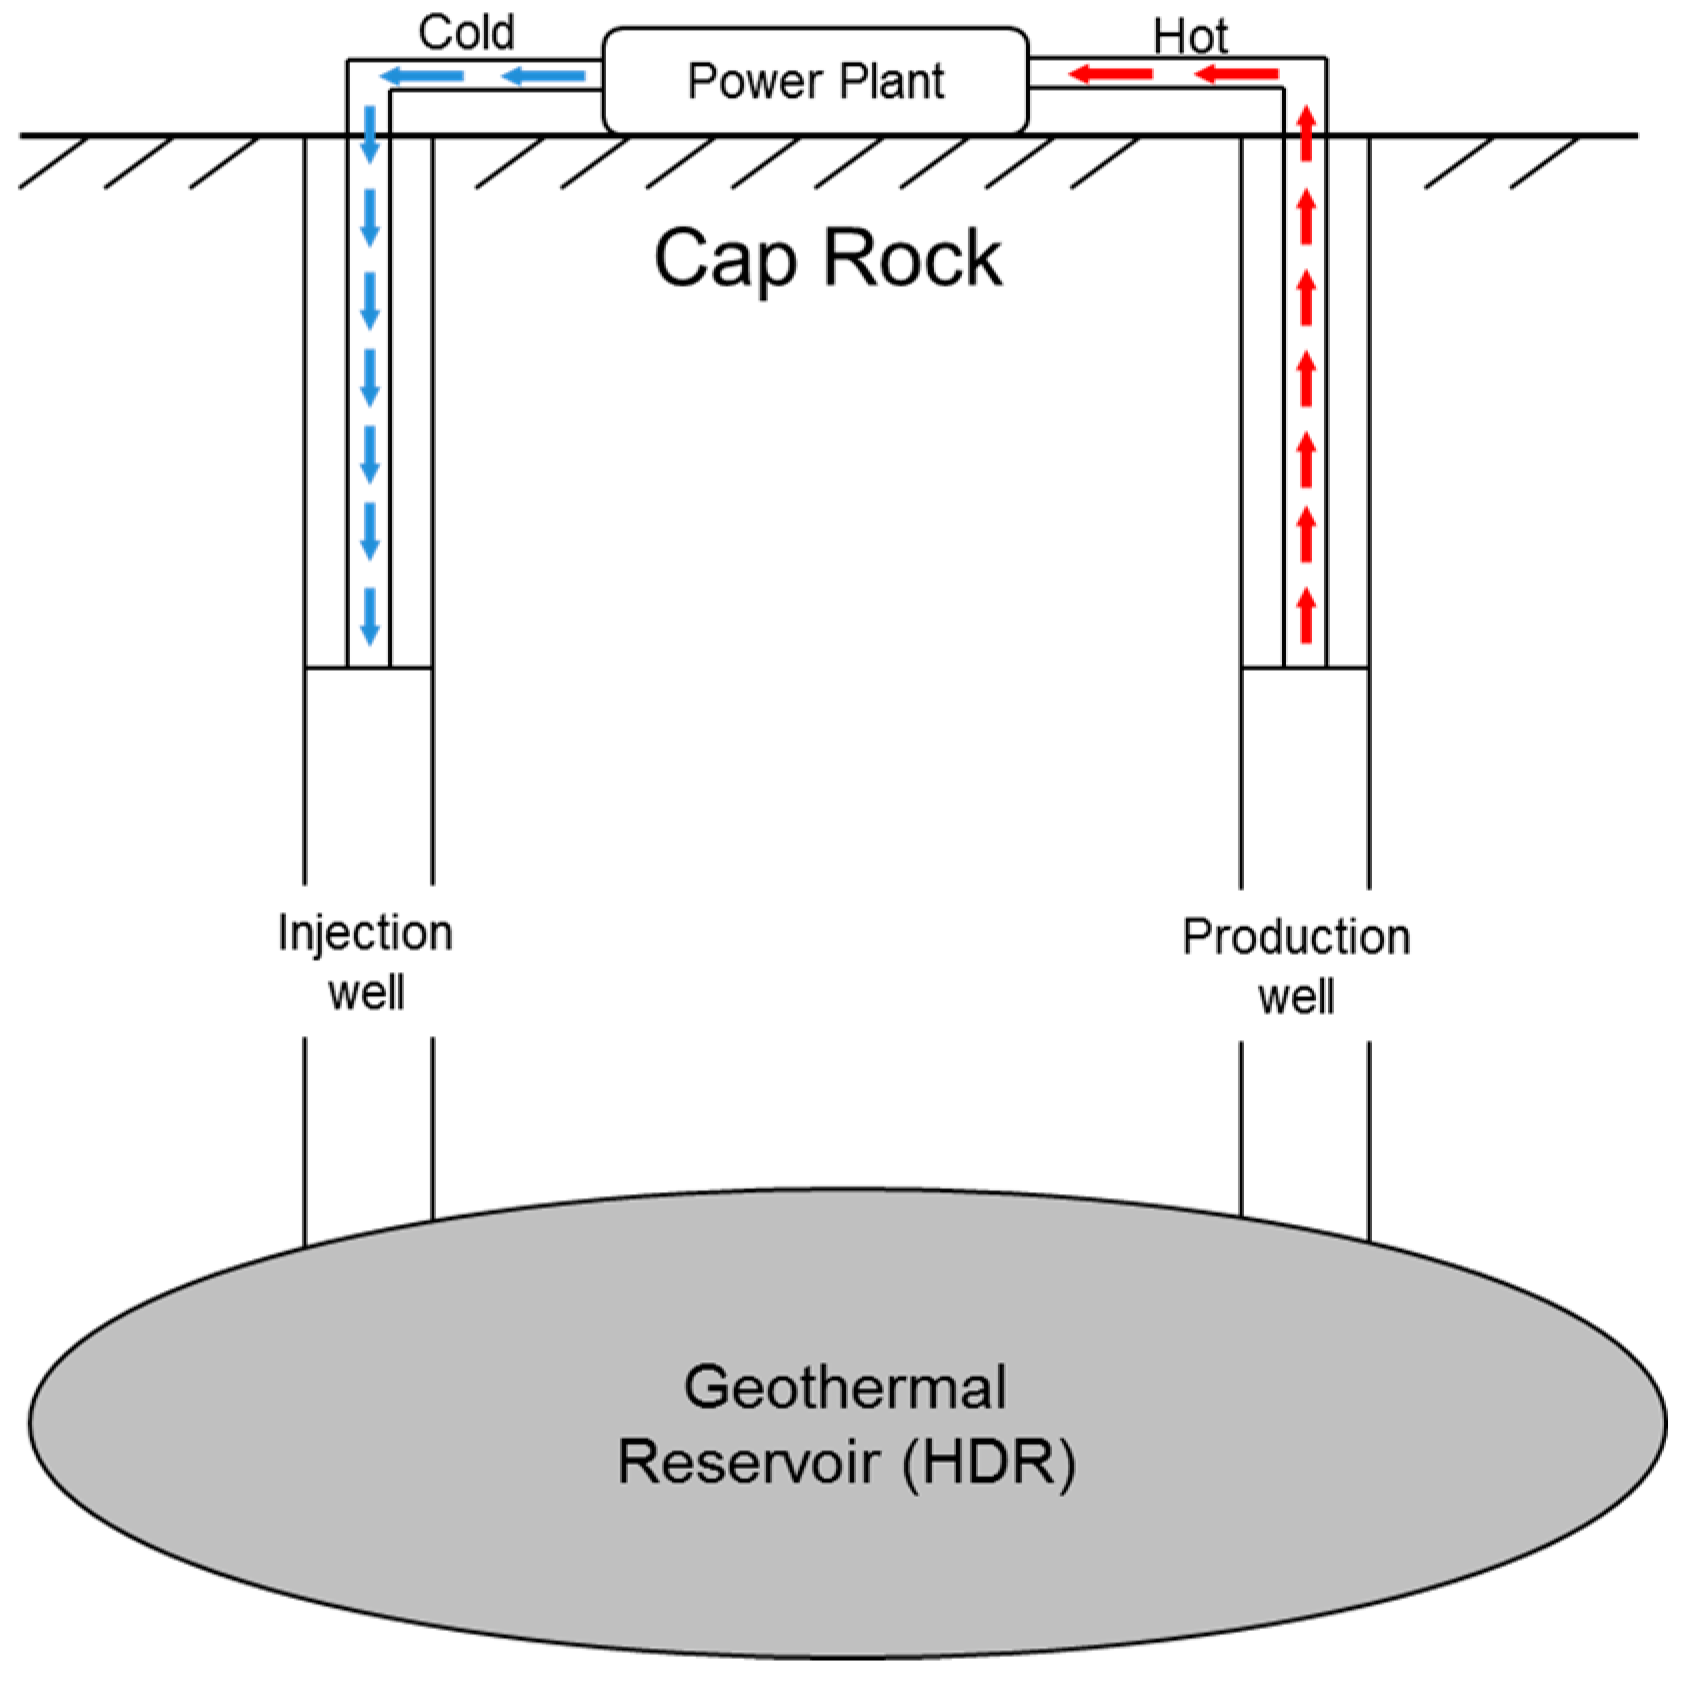
Figure 1. Ideal hot dry rock production scheme for Enhanced Geothermal System (EGS).
Energies 09 01016 g001
Figure 2. Configuration of the Finite Element (FE) model with applied boundary conditions (in ABAQUS).
Energies 09 01016 g002
Figure 3. Comparison of (a) Tangential stress σθ, (b) Radial stress σr and (c) Radial displacement ur.
Energies 09 01016 g003
Figure 4. Schematics of geothermal well design adopted in numerical analyses: rdrilling and rcasing represent radius of drilled borehole and casing.
Energies 09 01016 g004
Figure 5. Stress and displacement of geothermal well.
Energies 09 01016 g005
Figure 6. Stress and displacement at 200 m with variation of thermal conductivity of the cementing component.
Energies 09 01016 g006
Figure 7. Stress and displacement at 1000m with variation of thermal conductivity of the cementing component.
Energies 09 01016 g007
Figure 8. Stress and displacement at 2500 m with variation of thermal conductivity of the cementing component.
Energies 09 01016 g008
Figure 9. Stress and displacement at 200 m with variation of Young’s modulus of the cementing component.
Energies 09 01016 g009
Figure 10. Stress and displacement at 1000 m with variation of Young’s modulus of the cementing component.
Energies 09 01016 g010
Figure 11. Stress and displacement at 2500 m with variation of Young’s modulus of the cementing component.
Energies 09 01016 g011
Table 1. Mixture design of G-class cement slurry (by mass).
Mix TypeCementSilica FlourWaterBentoniteDispersant
40SF10.40.550.0340.012
Table 2. Thermal conductivity of G-class cement specimen.
Surrounding Temperature (°C)Thermal Conductivity (W/mK)
200.6798
500.6243
Table 3. Young’s modulus and uniaxial compressive strength of G-class cement specimens.
Curing MethodDry (100 °C)Water (21 °C)
E (MPa)622426216
qu (MPa)23.0428.97
Table 4. Classification of applied boundary conditions.
Case No.Boundary Conditions
1Horizontal stress only (7.824 MPa)
2Horizontal stress + inner fluid pressure (10 MPa)
3Horizontal stress + thermal stress
4Horizontal stress + inner fluid pressure + temperature stress
Table 5. Material properties for model verification.
Themal Conductivity (W/mK)Thermal Expansion Coefficient (/°C)Young’s Modulus (GPa)Poisson’s RatioSpecific Heat (J/kg·°C)
2.81.345 × 10−59.70.3818.0
Table 6. Thermal and mechanical properties of casing and cementing adopted in the model.
PropertyCasingCementing
Thermal conductivity(W/mK)750.5 (1.0, 1.5, 2.0)
Coefficient of thermal expansion(/°C)1.2 × 10−51 × 10−5
Specific heat(J/kg·°C)460.24750
Young’s modulus(GPa)205.626 (20, 15, 10)
Poisson’s ratio0.290.21
Density (kg/m3)78501920
Note: Properties in parenthesis ( ) were used in parametric study.