Article

Forecasting the State of Health of Electric Vehicle Batteries to Evaluate the Viability of Car Sharing Practices

Department of Telecommunications and Information Processing, Ghent University, St-Pietersnieuwstraat 41, B-9000 Gent, Belgium
*
Author to whom correspondence should be addressed.
Energies 2016, 9(12), 1025; https://doi.org/10.3390/en9121025
Submission received: 14 July 2016 / Revised: 16 November 2016 / Accepted: 28 November 2016 / Published: 3 December 2016
(This article belongs to the Special Issue Energy Time Series Forecasting)

Abstract

:
Car-sharing practices are introducing electric vehicles (EVs) into their fleet. However, the literature suggests that at this point shared EV systems are failing to reach satisfactory commercial viability. A potential reason for this is the effect of higher vehicle usage, which is characteristic of car sharing, and the implications on the battery’s state of health (SoH). In this paper, we forecast the SoH of two identical EVs being used in different car-sharing practices. For this purpose, we use real life transaction data from charging stations and different EV sensors. The results indicate that insight into users’ driving and charging behavior can provide a valuable point of reference for car-sharing system designers. In particular, the forecasting results show that the moment when an EV battery reaches its theoretical end of life can differ in as much as a quarter of the time when vehicles are shared under different conditions.

1. Introduction

In recent years, experts have been rethinking personal mobility. There are two main motivations for this. First, after decades of car-oriented transport planning, we have reached a point where transport is responsible for 23% of world energy-related greenhouse gas emissions, with about three-quarters coming from road vehicles [1]. It became evident that the existing mobility system is unsustainable in its current form and that new, more sustainable and energy-efficient solutions are needed. In order to balance the need for personal mobility and increase the sustainability of mobility systems as a whole, much has been done in promoting active transport modes such as biking and walking. However, overall results are still unsatisfactory [2], and results seem to be limited, as many are not motivated by topics such as fitness or environment, and are continuing to use personal vehicles for their mobility needs even when other feasible solutions exist [3]. Secondly, studies have shown that personal vehicles are used on average around an hour per day [4,5]. Being parked most of the time, they take up valuable space from society. This effect is particularly noticeable in urban areas where population is continuing to grow. According to the World Health Organization, 54% of the total global population lived in urban areas in 2014, growing steadily from 34% in 1960, and is expected to continue to grow by 1.84% per year [6]. Just in Europe, urban areas are home to over two-thirds of the European Union’s population [7]. Combining this trend with high car use has multiplying effects mainly evident in increased pollution, congestion, noise, and time loss (both travel time due to delays in transport network and prolonged time needed to search for available parking space).
One of the solutions that tackles both of the above-mentioned issues is car sharing. Car sharing aims at satisfying the need for personal mobility with cars while ensuring lower costs for individuals and higher usability of vehicles, thus making cars more cost-efficient [8]. In general, the car sharing as a concept relies on shared ownership of the car where every owner is free to use the vehicle, upon reservation, for considerably low cost. Musso et al. [9] took a deeper look at the car-sharing experiences in Rome, Italy, and Stasko et al. [10] examined the impact of the car-sharing service in a university setting, while Shaheen et al. [11] reported on experiences in North America. Kent et al. [12], Prettenthaler et al. [13], and Morency et al. [14] explored behavioral aspects of car sharing such as its effect on average car use and cost, while Graham et al. [15] provided a literature review on the topic highlighting that more methodologically sound research is needed in this area. European project MOMO summarises car shaping-related experiences, indicating that car sharing reduces parking pressure, cuts out unnecessary car journeys, and helps to combat pollution and congestion [16]. Fellows and Pitfield [8] utilized a cost–benefit analysis to evaluate car sharing and found that individuals benefit economically by reducing journey costs up to 50%, and the economy as a whole benefits greatly in reduced vehicle kilometers, increased average speeds, and savings in fuel, accidents, and emissions. Catalano et al. [17] used stated preference techniques to estimate the car-sharing demand in urban area of Palermo and found that the car-sharing market share has potential to increase up to 10%. Katzev [18] took a deeper look at the early adopters of car sharing and reports that they were primarily motivated to do so because they need vehicle sporadically, and secondarily because of they expect to gain some financial savings. In addition, he reports that the two most important predictors of the car-sharing trip usage were the distance to the nearest vehicle station and the length of membership, and that both factors had a greater influence on vehicle owners than on non-owners. Frost and Sullivan report that, on average, car-sharing members drove 31% fewer kilometers than before they used the service and that, in 2009, car sharing contributed to 482,170 fewer tons of carbon dioxide emissions [19]. Although Katzev’s results [18] show a different trend in North America regarding kilometers driven, he reports that 26% of users sold their personal vehicles and 53% were able to avoid an intended purchase after starting to use car-sharing service. Meijkamp [4] analyzed the effects of car sharing in the Netherlands and found that car use was reduced in frequency, down from 3.5 to 2.0 times a week, and kilometers driven reduced in average for 33% for those users who participated in car sharing. More systematic results on a geographically larger scale can be found in a study by Shaheen and Cohen [5], who determined that every car shared reduced the need for 4–10 privately owned vehicles in Europe, 6–23 in North America, and 7–10 in Australia.
Very little research has examined the effects of car sharing when the vehicle shared is electric. The scarce literature includes mainly preliminary results of ongoing project activities. Kitamura [20] reported on the shared electric vehicle (EV) project in Kyoto and found that 25% of users shared an EV at a rate of at least once a week and 30% at a rate of at least once a month, while 3% of users checked out an EV at a rate higher than four times a week. These frequent users tended to have shorter use durations and used EVs for commuting and chauffeuring others more often than the rest of the members. Fukuda et al. [21] evaluated the results of the EV sharing experiment in Tokyo and found that most shared EV systems have not reached satisfactory commercial viability, mainly due to budget limitations and an insufficient recruitment of users to compensate monthly operating costs. They also determined that implementation of the EV car sharing in combination with advanced technological systems could be a marketing strategy that leads to successfully attracting people to becoming members of the system. Following this indication, Lee et al. [22] and Luè et al. [23] reported on the design of a shared EV service that relies on the use of mobile technology as a potentially more attractive option for users. Furthermore, Xia et al. [24] and Chen et al. [25] took a deeper look into charging management system designs for EVs and pricing strategies. Some research has focused primary on shared EVs, highlighting the potential they exhibit as a more sustainable option for car sharing when compared to conventional vehicles [26,27]. Furthermore, the market potential of EVs in the Baltic Region has been explored by Raslavičius et al. [28], in Flanders by Lebeau et al. [29], and in Germany by Propfe et al. [30] and Kihm and Trommer [31]. Plötz et al. [32] and Bühler et al. [33] identified the early adopters of EVs in Germany, while Wan et al. [34] reported on challenges regarding EV acceptance in China. In addition, Larson et al. [35] examined consumer attitudes about EVs, particularly the pricing and policy implications. EV lithium-ion battery cell degradation phenomena were examined by Dubarry et al. [36], who used incremental capacity analysis to derive temporally resolved information on how cells degrade under cycle aging conditions. They observed two stages of degradation. In the first stage, the loss of lithium inventory was the cause of capacity fade, while in the second stage the positive electrode kinetics were hampered and the capacity loss accelerated. Ning and Popov [37] developed a first-principles-based charge–discharge model to simulate the capacity fade of Lithium-ion batteries. The results indicate that both the dimensionless loss of lithium and the surface film resistance increase with the increase in the overpotential and the duration of the parasitic reaction. Furthermore, Hooper et al. [38] investigated whether Lithium-ion battery cells can be degraded by road induced vibration, typical of an EV application, and found that both the electrical performance and the mechanical properties of the Lithium-ion cells were relatively unaffected when exposed to vibrations similar to a typical vehicle life. Lacey et al. [39] analyzed the experimental results available for Lithium-ion battery degradation, which has been used to create a model of the effect of the identified parameters on the aging of an EV battery. They indicate that delayed charging and vehicle-to-grid slow down the rate of battery degradation, while fast charging appears to accelerate battery degradation. These results go in line with the findings of Nikolian et al. [40], who developed advanced equivalent circuit models for EV Lithium-ion battery cells by using Coulomb counting and extended Kalman Filter for state of charge (SoC) estimations. Le and Tang [41] investigated several methods for Lithium-ion battery state of health (SoH) estimations, including modeling of linear and nonlinear regions of the Ah–V curve using Richard’s equation, correlating the slope of the Ah–V curve with battery capacity and estimating useable energy using quadratic fit. Their simulation results indicate the effectiveness of the methods for SoH estimation. EV lithium-ion battery cell models and simulations, among others, were also explored by Ramadesigan et al. [42], Peterson et al. [43], Zhang et al. [44], and Huang et al. [45]. Summarizing the results from the literature on EV Lithium-ion battery degradation, the capacity loss in lithium-ion batteries ( C L Lithium ion ) may be attributed to two main elements:
C L Lithium ion = ( l c a l e n d a r , l c y c l e )
where l c a l e n d a r stands for calendar life loss, which is the continuous slow degradation of the battery due to the passage of time, regardless of whether the battery is being used or not. l c y c l e stands for cycle life los, which depends on the chemistry of the battery as well as the way the battery is being used during charging and discharging. Furthermore, the calendar life loss is considered to be largely affected by the storage temperature ( s t e m p ) and the charge state ( S o C ) :
l c a l e n d a r = ( s t e m p , S o C )
while the cycle life loss is considered to be affected by four main interlinked factors: the charging–discharging current rate ( c r ) , the battery temperature b t e m p , S o C , and the depth of discharge ( D o D ):
l c y c l e = ( c r a t e , b t e m p ,   S o C ,   D o D )
These parameters seem to be interlinked, and it is difficult to exactly quantify the individual impact of each of them [39].
The longevity of the EV battery was explored by Conti et al. [46]. They present a mix of original modeling, simulation, and laboratory experimentation studies, as well as a review of the academic and policy literature. They conclude that the toughest challenge to the large-scale uptake of EVs in the forthcoming years is the development of battery technology, as batteries amount to a major part of the cost and value of the vehicle. They also indicate that the second-life span and use of these batteries will also be of significance. The second-life span and use of EV batteries is explored in more detail by Narula et al. [47], who took a deeper look at the cost competitiveness of EV batteries for power grid applications and various possible markets for the secondary use of Lithium-ion batteries removed from electric or hybrid EVs. Based on the economic analysis, they proposed a sale price for secondary-use batteries and indicated that the secondary life is largely dependent on application. They identified area regulation, transmission and distribution upgrade deferral, and electric service power quality as applications that offer the most attractive value proposition for the secondary use of EV batteries. Furthermore, Delucchi and Lipman [48] analyzed the retail and lifecycle cost of battery-powered EVs and found that EVs are still failing to be cost-competitive with conventional vehicles, mainly due to the high manufacturing cost of batteries and a short lifecycle.
None of the previous research has examined the impact of different car-sharing practices, or related driving and charging behavior, on EV battery performance. This economical element is not present when sharing conventional vehicles; for this reason, it may have been overlooked. However, since the cost of an EV battery is the greatest single cost in the purchase of EVs, it seems crucial to consider it when designing shared EV practices. Furthermore, consumer insight in the shared EV market is still just starting and in an early stage [49]. Most of the above-mentioned shared EV market studies, with the exception of Gautama et al. [49] and Morency et al. [14], rely on user surveys when characterizing car-sharing systems. Thus, they are based on findings of stated preferences and self-reported insights into mobility behavior. However, the literature suggests that preferences derived from such surveys are contingent on context [50], for instance, the response mode [51] or framing of alternatives [52], while self-reported mobility behavior deviates systematically from actual behavior [53,54]. Thus, existing studies on shared mobility are failing to provide deeper, data-driven insight into consumers’ behavior that is based on recorded actual behavior.
Extending the current research on shared EVs, and in the meantime addressing the above-mentioned limitations, in this paper, we aim to compare the impact of two different car-sharing practices on EV battery performance. We do this by using detailed EV and charging station transaction data to forecast the EV battery SoH for two identical EVs shared under different practices. The fundamental research contributions of this work can be situated in the following areas: (i) We provide detailed insight into sharing EV users’ driving and charging behavior by reporting on EV sensors and charging station transaction data. We hope in this way to provide a valuable point of reference for transport system planners and business practitioners in the field; (ii) We examine the impact of two different EV sharing practices on the EV battery SoH to evaluate the viability of these practices; (iii) We extend existing SoH estimation models by providing experimental results where so far only simulated models have been reported.

2. Car-Sharing Practices and Their Users

In this paper, we compare two identical EVs shared under two different car-sharing practices. The first car-sharing practice is a car-sharing company that owns more than 800 electric and conventional vehicles. These vehicles are available to more than 24,000 members [55]. Rules of sharing, defined by contract, state that, upon returning an EV to a car-sharing station, a user is obliged to plug it in for recharging. This way, it is ensured that every next user has a maximally charged EV battery at their disposal. The vehicle reservation system is an online platform where users indicate their preferences (e.g., for EV), approximately how many kilometers they will drive, and when they will return the vehicle. This information facilitates organization, and planning, of the car-sharing service. The second car-sharing practice is co-housing. A co-housing community is a type of collaborative housing in which residents actively participate in the management of their own neighbourhood and care of common property. It is based on the notion of a collaborative economy where items that individuals, or households, do not use often can be co-owned and utilized among members of the co-housing community. An example of this is a shared garden or shared utilities as a washing machine placed in common space. The co-housing community, from our study, owns two conventional cars and one EV that are shared among 35 members. The reservation system is also an online system where members indicate time slots in which they will use the vehicles. There were no specific rules regarding EV battery recharging practice, so it was left for every individual to assess a battery’s SoC and to decide whether they think the battery needs recharging or not. Both car-sharing practices were based on a round-trip car-sharing model, meaning that the user needs to return the vehicle at the same location where it was collected. For the co-housing community, this was a shared parking space situated in the central part of the community. For the car-sharing company, this was a car-sharing station.
Table 1 gives more detailed insight into the two user groups’ demographics. The user groups differed in size (the number of users, although the number of drives and recharging events for the selected vehicles were quite similar) and slightly in age distribution (and in the number of children that live in the household with the car users).
Both groups shared more than one vehicle among them; however, for the purpose of this research, we only analyzed data for two identical EVs (one owned by the car-sharing company and one owned by the co-housing community). Table 2 summarizes the vehicle and battery characteristics.
Furthermore, both EVs were utilized in the same geographic location (Flanders, Belgium) where the average temperature was 3 °C in January and 18 °C in July [56]. The data collection process lasted from 1 December 2013 to 17 January 2014. During this period, both vehicles were recharged and parked in an open parking space, meaning that the potential effect of the outside temperature on battery degradation was similar. In addition, both vehicles were new at the beginning of this study and equipped with new battery packs.

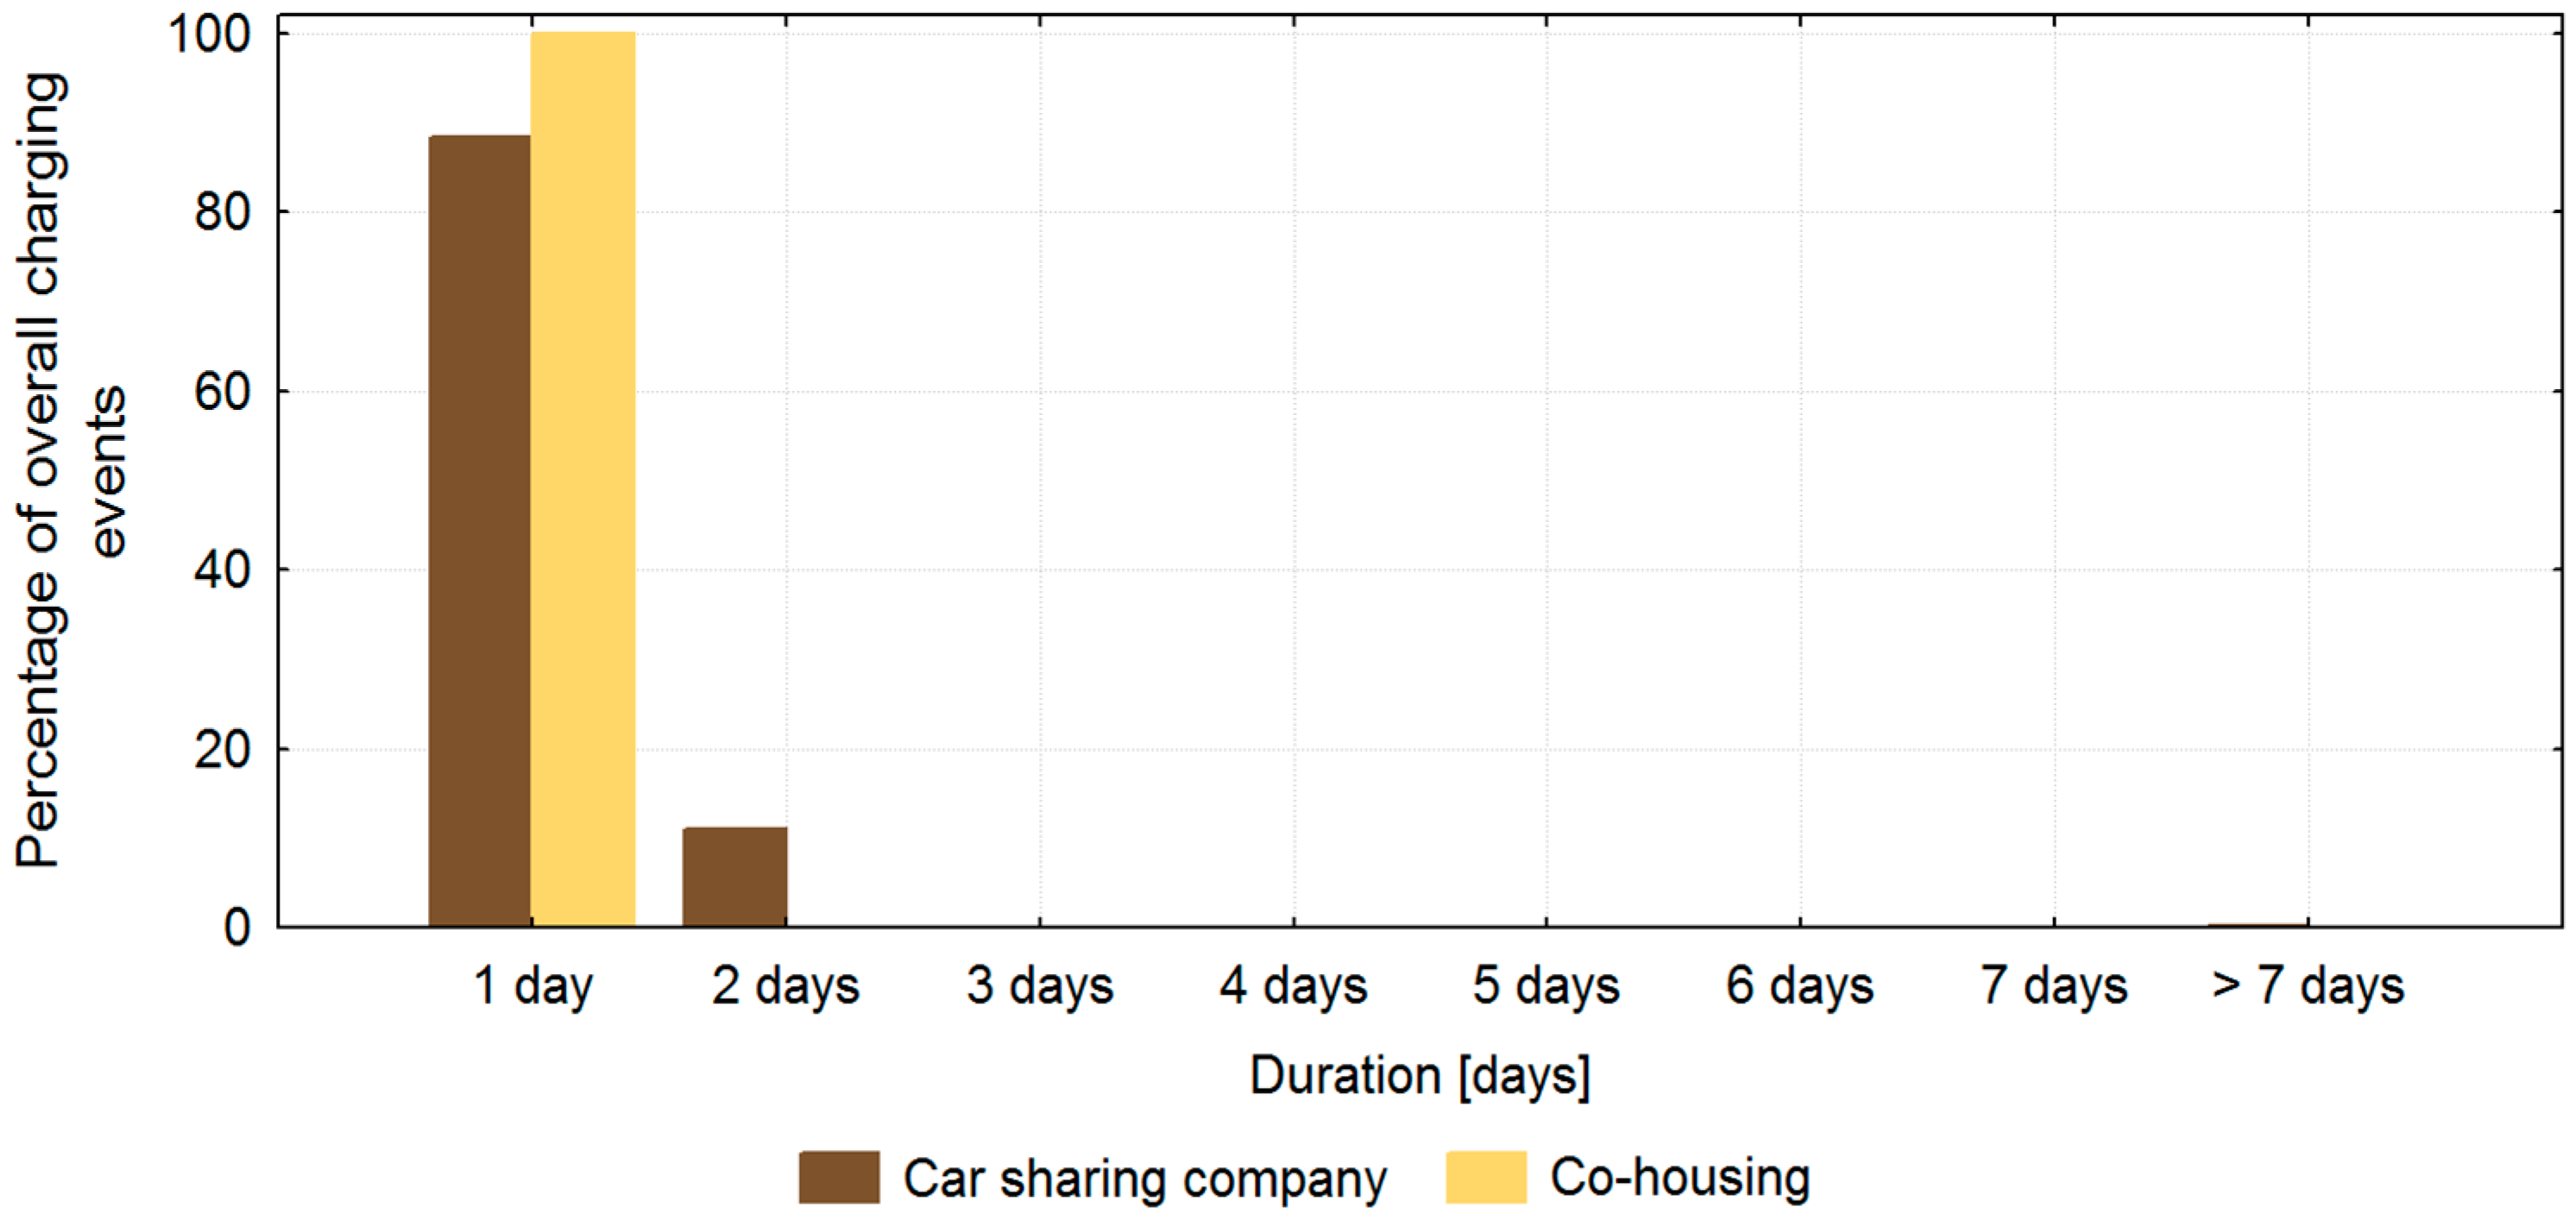
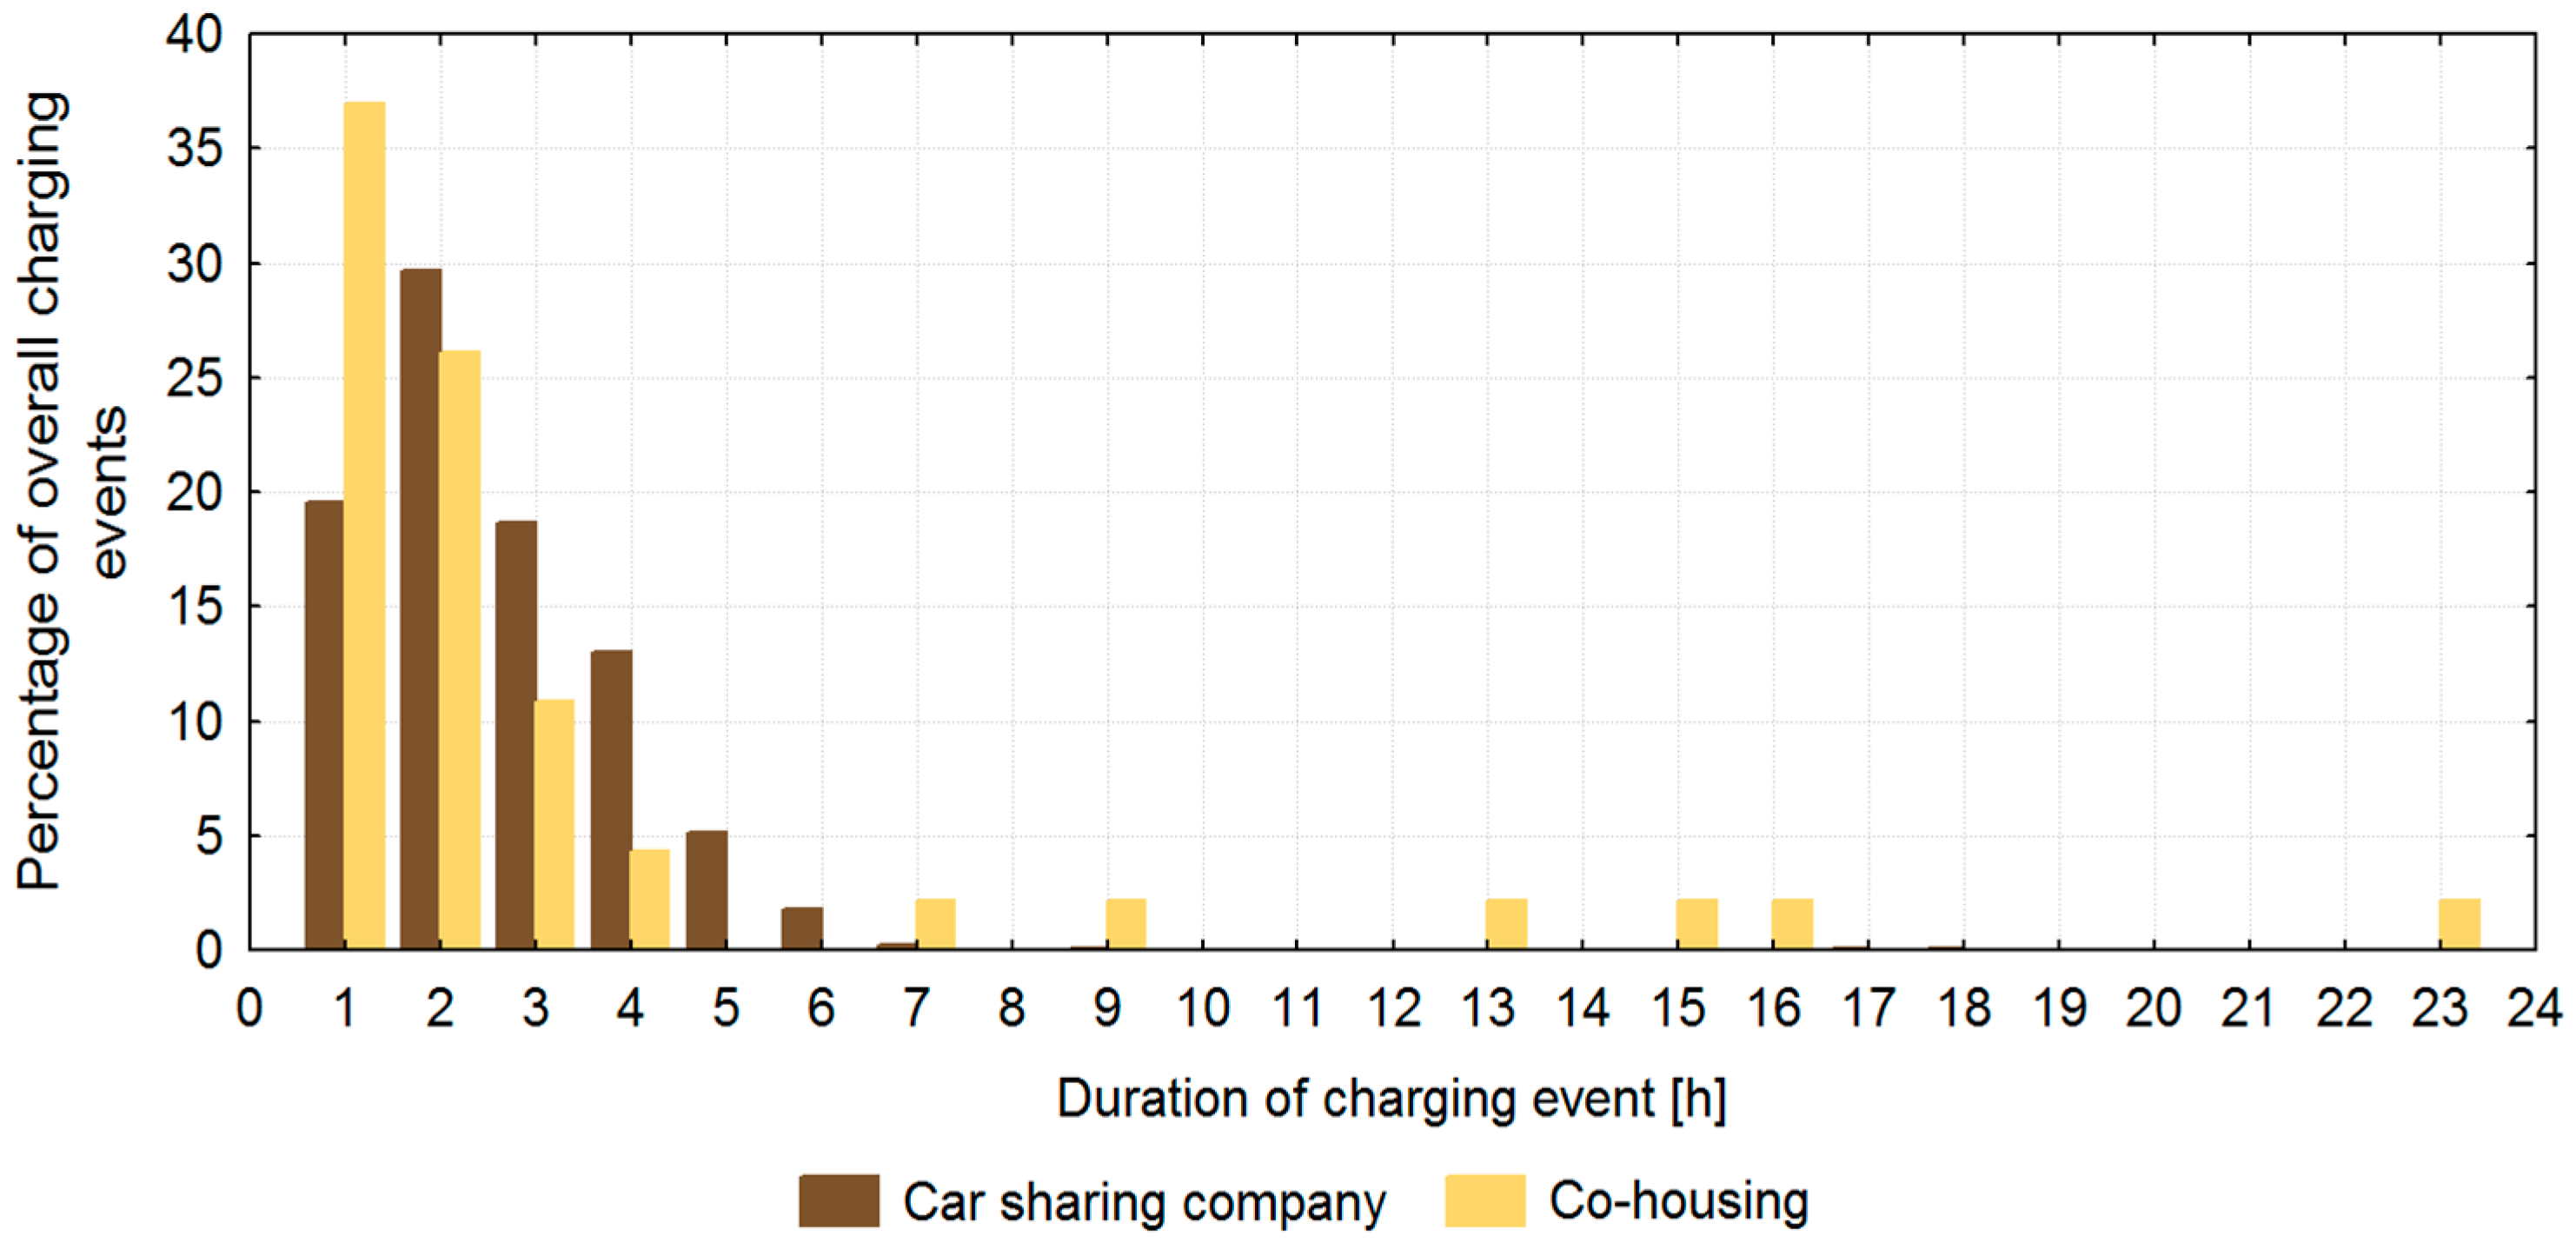
3. Consumer Insight—Driving and Charging Behavior

In order to provide an insight as complete as possible in terms of how the EVs were used, we examined in more detail the driving and charging behavior of both user groups. Charging data was collected from charging stations and matched to our vehicles based on their identification numbers (IDs). Driving data was collected from the vehicles’ sensors, i.e., from the global positioning system (GPS) that recorded vehicle location with a timestamp, speed, and acceleration, and from the vehicles’ Controller Area Network bus (CAN bus) from which data on the vehicle battery such as current, voltage, timestamp, SoC, and engine status (running/not running) were acquired (Figure 1).
Considering the usage of the shared EVs, the car-sharing company members tended to use it mainly as a second car, with a high frequency in afternoon and weekend drives (22% of all drives were made on Saturdays). The co-housing members were more likely to use the shared EV in the morning hours (Figure 2). When considering the length of the undertaken trips, 72% of the co-housing users’ trips were shorter than 10 km. On the other hand, 81% of the car-sharing company users’ trips were actually longer than 10 km (Figure 3). Official statistics state that the average car trip in Flanders [58] is approximately 34.4 km long; the average trip made by the EVs owned by the car-sharing company was 32.56 km, and by co-housing, 8.4 km.
Considering the recharging practises, the co-housing members tended to recharge the shared EV prior to use (same day, in the morning) or late in the evening (if they were planning to use it early next morning). The car-sharing company members were obliged, as previously mentioned, to plug in the vehicle for recharge after every use (Figure 4). In the same manner, the EV would not be unplugged from the charger until the next user shared it, and this sometimes could take more than a week (Figure 5). Overall, 7.6% of recharging events were made with fast chargers. Alternatively, all recharging events registered by the co-housing members were shorter than a day, where 33% of them were shorter than half an hour (Figure 6), and 4% were made by fast chargers.
The sharing rules also affected the number of recharging events per day. For the car-sharing company members, the number of recharging events basically corresponds to the number of uses per day (mainly once). For the co-housing community, the vehicle was often recharged more than once per day (Figure 7). However, considering the battery SoC, it is evident that, in 20% of cases, the car-sharing company’s vehicle was recharged, but its battery SoC was higher than 90%. Almost always, the battery was left to fully recharge. For the co-housing members, the EV battery was fully recharged only half of the time, while the values of the SoC, at which the battery was plugged in for recharging, were more evenly distributed (Figure 8).

4. Methodology

To evaluate the impact of the car-sharing practices and driving and charging behavior on the EV battery, we examined the battery SoH. Battery SoH is defined as the difference between the usable capacity and the end of life capacity [59]. The SoH is usually expressed as a percentage of the rated capacity and is a measure of the long-term capability of the battery [40,41]. Compared to the SoH, the SoC is defined as the percentage of the available capacity [60] and is a measure of the short-term capability of the battery. In more detail, the SoC gives an indication of the energy left in a battery, at a given moment, compared with the energy it had when it was full and thus gives the user an indication of how much longer a battery will continue to perform before it needs recharging. Using the analogy of conventional vehicles, the SoC would correspond to the fuel gauge function, while the SoH would represent the capability of a fuel tank to store fuel. In this analogy, the fuel tank would have variable volume available (e.g., when the SoH is low, the SoC would indicate full tank, but it would contain less fuel than when the car was new), which is not a case for conventional vehicles; for this reason, it is not always so easy for EV users to have a clear understanding of SoH meaning and importance.
In this paper, the SoH is calculated from the driving data, while the SoC information is collected from the vehicles’ CAN bus. The data from the vehicles’ CAN bus are collected with the frequency of 10 Hz. Figure 9 shows the instantaneous battery power transfer (W) over time during the EV drive. Under regenerative braking conditions, the EV battery will be charged if the deceleration provides more power than is used by the constant base load. Literature reports that around 7% of the energy is regained via regenerative braking during an EV drive [43].
Based on the instantaneous battery power transfer the total net energy supplied by the battery can be calculated by trapezoidal numerical integration of the battery current (I) and voltage (V) over time as indicated by Equation (4):
Total   net   energy   supplied   by   the   battery = V I   d t
Furthermore, knowing the S o C , at the beginning ( S o C 1 ) and at the end ( S o C 2 ) of every drive, SoH can be determined based on Equation (5):
S o H = Total   net   energy   supplied   by   the   battery Battery   capacity   at   100 %   S o H ( S o C 1 S o C 2 )
Figure 10 and Equation (6) provide an example of the SoH calculation for the second cycle, where Figure 10 shows the process of determining the instantaneous battery power transfer W for the second discharge cycle from the battery voltage and current measurements.
S o H = 0.707796677   kWh 14.2   kWh   × ( 0.995 0.945 ) = 0.9969 = 99.69 %
Based on Equation (4), the total net energy supplied by the battery is calculated to be 0.7078 kWh. Knowing that, for the second discharge cycle, the SoC at the beginning of a drive was 99.5% (SoC1); at the end, 94.5% (SoC2). Taking into account the usable battery capacity at 100% SoH (Table 2) of 14.2 kWh, we now have sufficient data to calculate the SoH from the driving data. Based on Equation (5), the SoH is 99.69%, meaning that the battery is able to store and deliver 0.31% less of the electrical energy compared to when it was new.

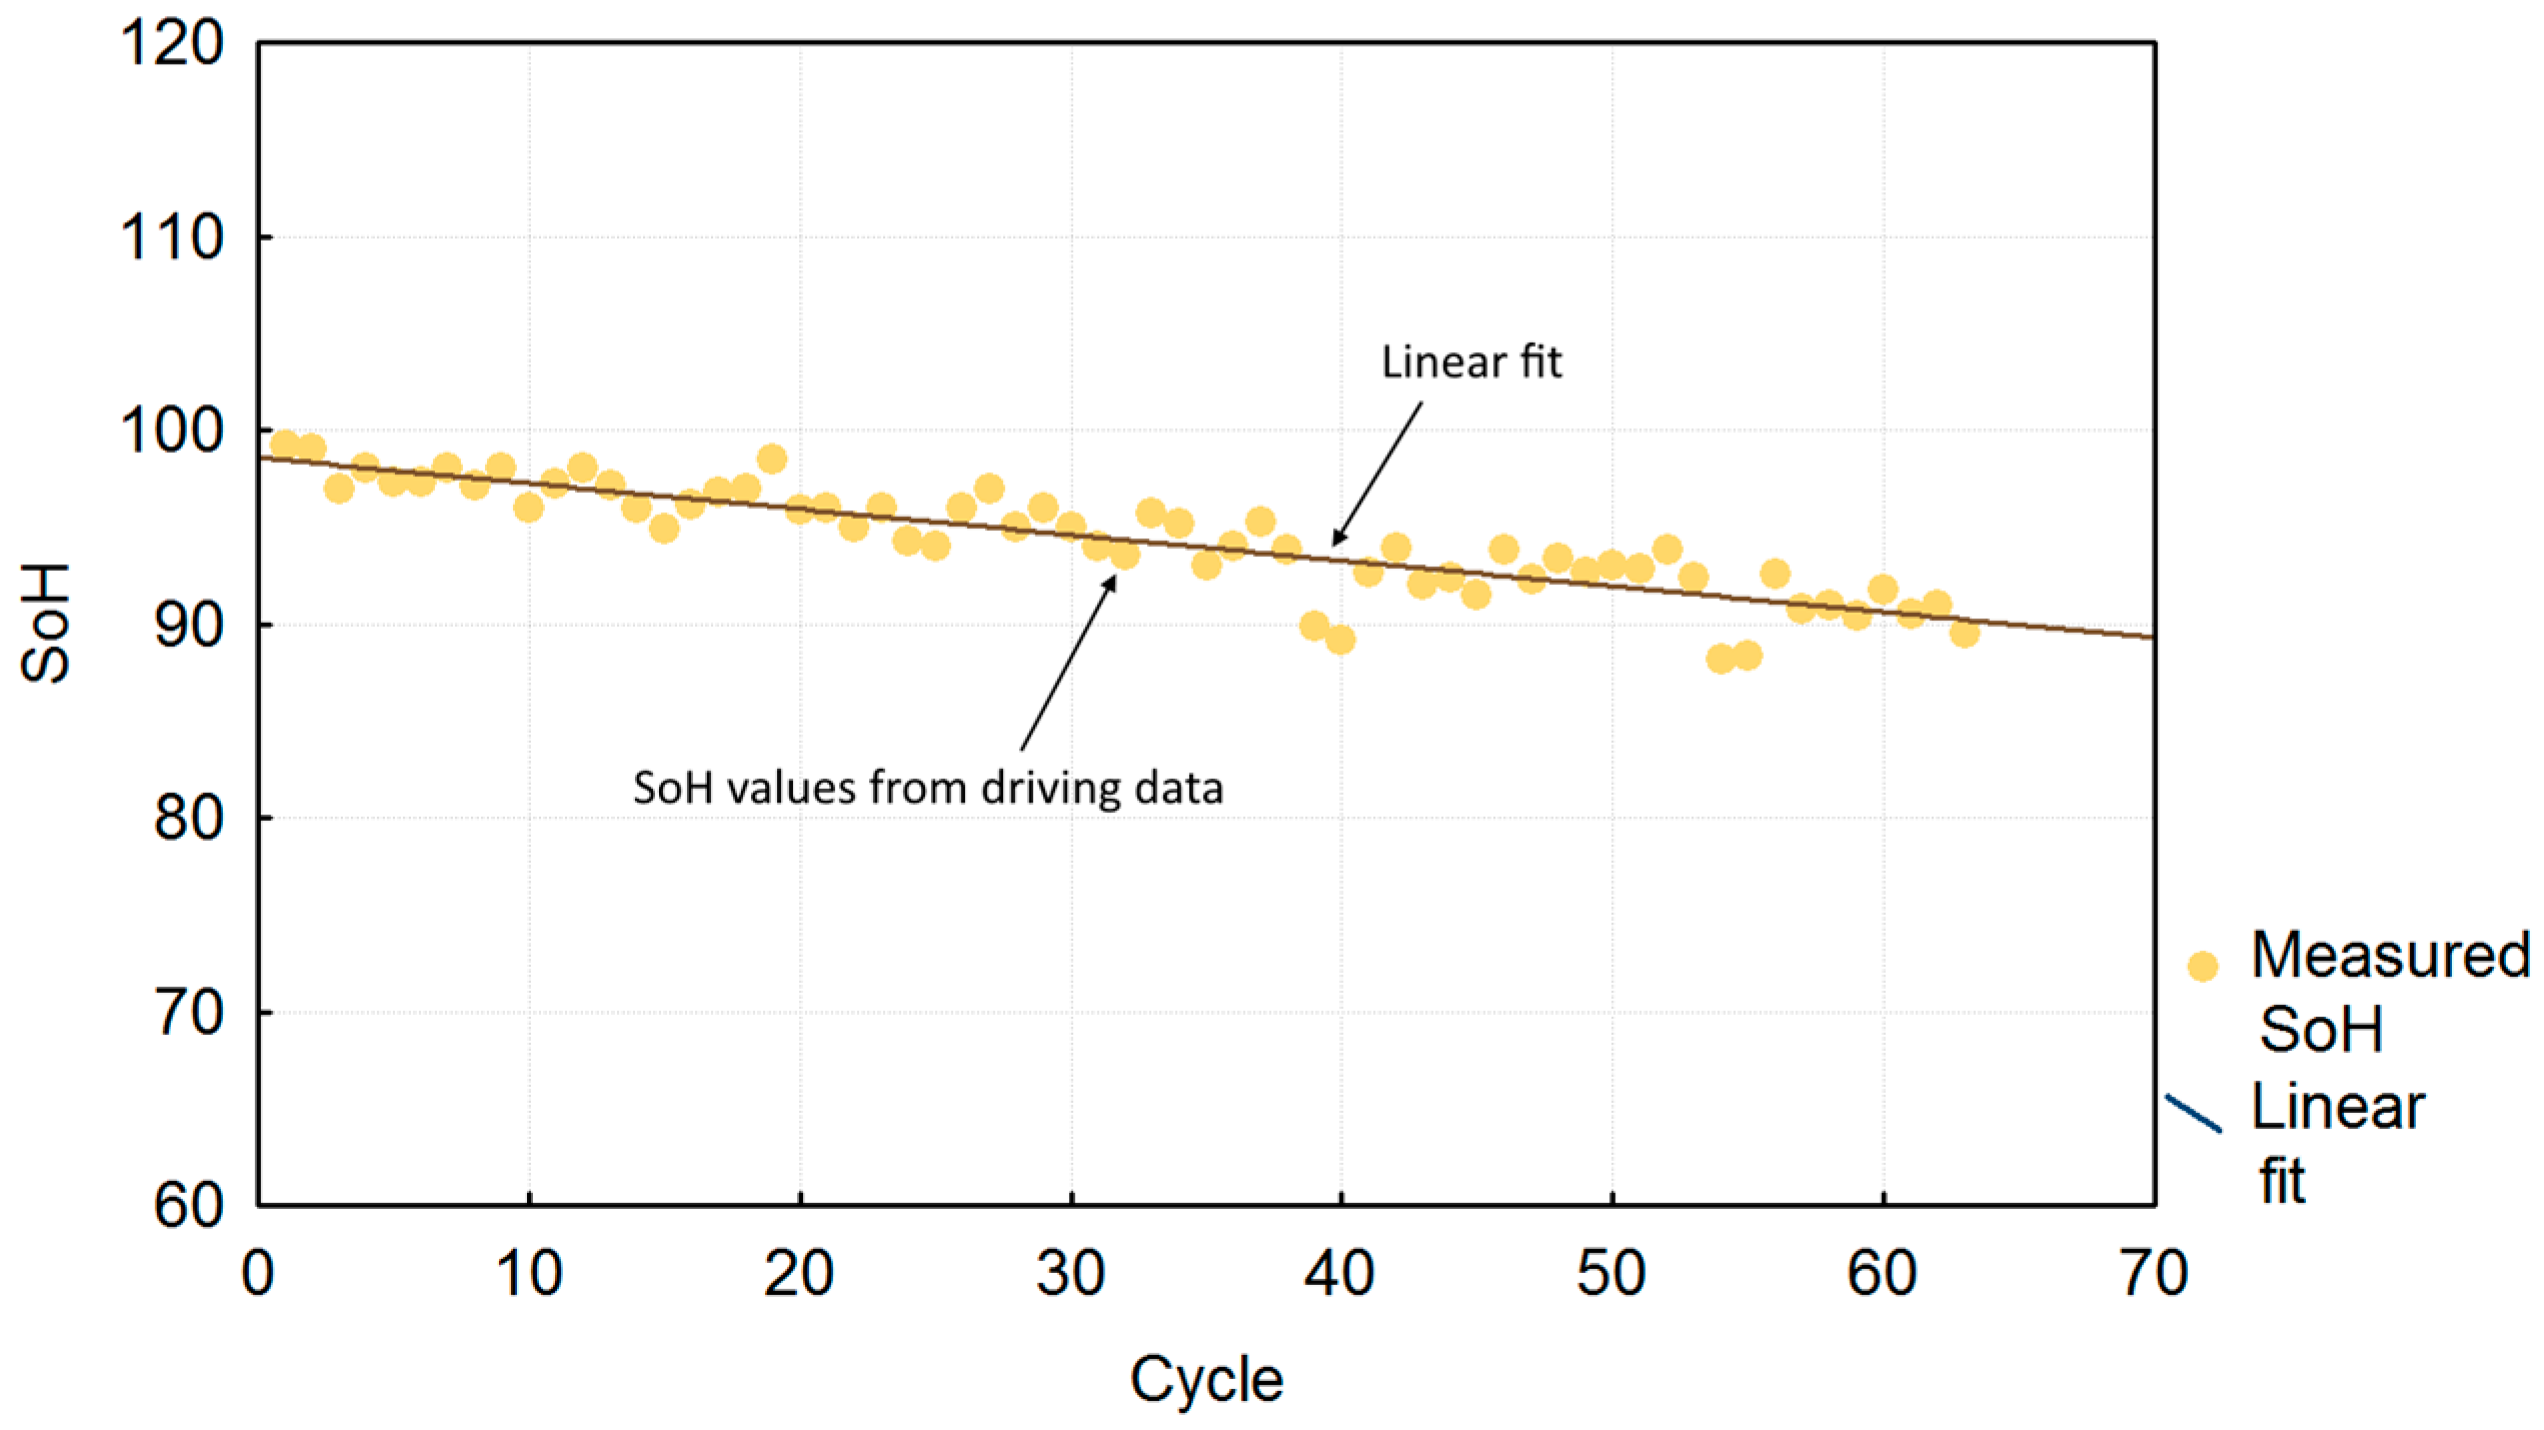
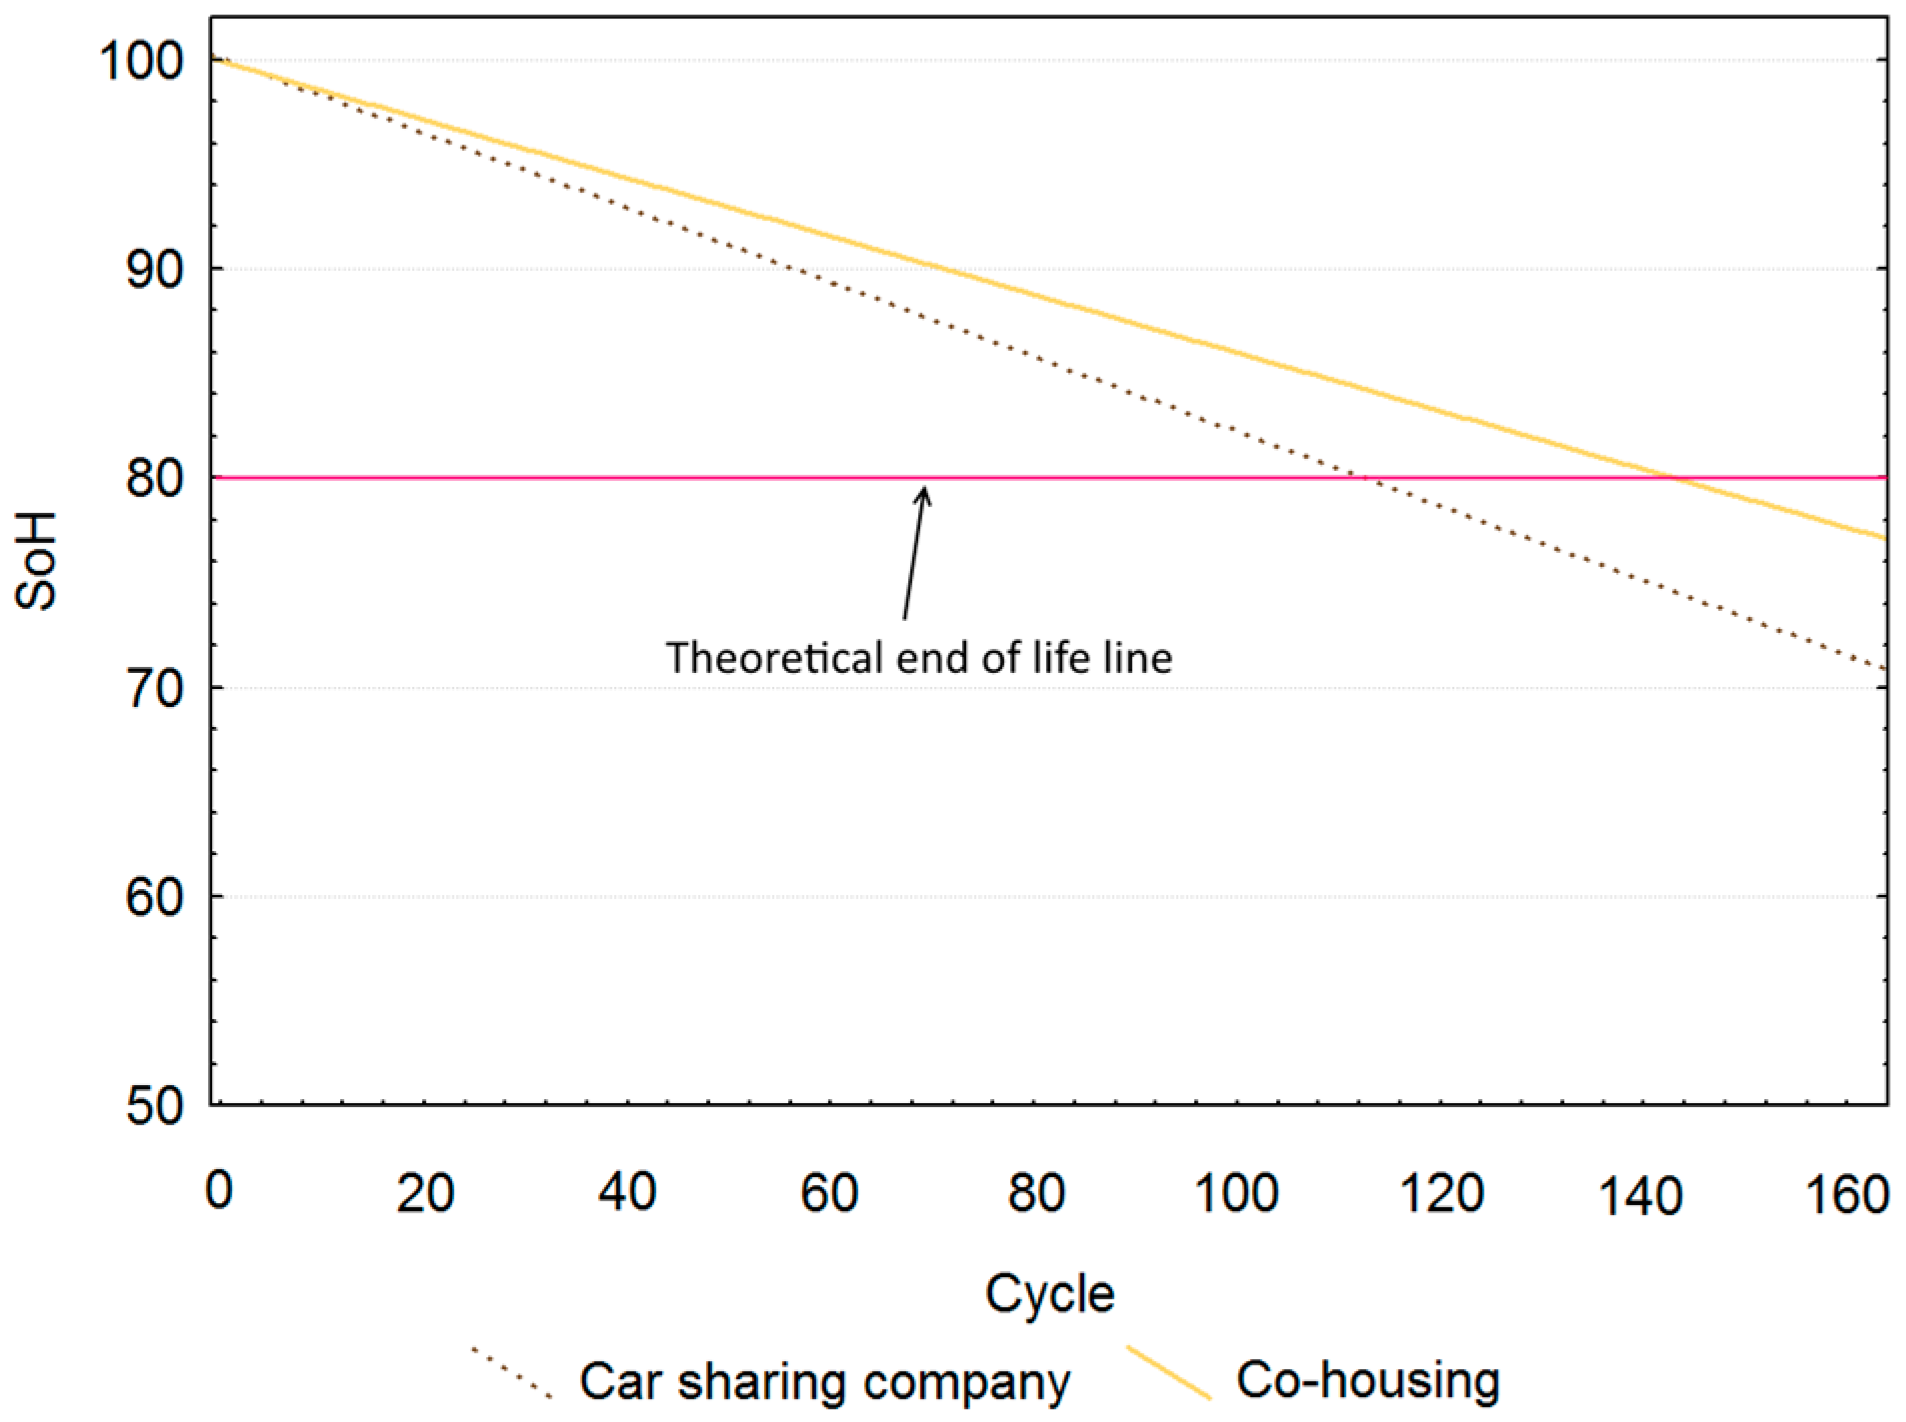
5. Effect of Car-Sharing Practices on Battery State of Health

For both EVs, using the SoH calculation from the methodology section, we determined the SoH value for every discharging cycle recorded. The number of the recorded cycles slightly differed, for the vehicle owned by the car-sharing company, there were 59 and for the vehicle owned by the co-housing community 63. As the literature indicates that, for the first 500 cycles or so, the capacity fade is linear [36,37], the calculated SoH values were used to determine this linear trend (Figure 11).
To evaluate the linear trend goodness of fit and its applicability for forecasting future batteries’ SoH, we calculated the least squares deviation, as defined by Equation (7), the average deviation (Equation (8)), the relative squared error (Equation (9)), and the relative absolute deviation (Equation (10)).
Least   squares   deviation   ( L S D ) = i = 1 N ( E i O i ) 2 N 1
Average   deviation   ( A D ) = i = 1 N | E i O i | N 1
Relative   squared   error   ( R S E ) = i = 1 N [ ( E i O i ) / E i ] 2 N 1
Relative   absolute   deviation   ( R A D ) = i = 1 N | E i O i | / E i   N 1
where: N is the number of observations or sum of weights; Ei is the predicted value of case i; and Oi is the observed value of case i.
Table 3 provides more detailed insight into the goodness of fit for linear trend estimation for both vehicles.
As a general rule, it is accepted in the automotive industry that a battery’s end of life is a number of complete charge–discharge cycles, a battery can perform before its nominal capacity falls below 80% of its initial rated capacity [40,46,47,61]. Figure 12 provides the extrapolation of linear trends for both EV batteries until it crosses the end of life border.

6. Discussion

By forecasting the linear trend for two identical EVs shared under different car-sharing practices, we found that, when it comes to EVs, different car-sharing practices and driving and charging behaviors influence the EV battery performance. Based on the linearly extrapolated data, the vehicle shared under conditions similar to the car-sharing company conditions from our example would need 78% of the time to reach its theoretical end of life limit when compared to the vehicle shared under conditions similar to those of the co-housing community. On a scale of five years (a typical battery pack warranties), this would mean that the battery of a vehicle shared by a car-sharing company will reach its theoretical end of life limit more than a year sooner than the one shared in a car-sharing practice similar to that of the co-housing community. For consideration of the elements identified in the literature that impact battery degradation (Equations (1)–(3)), Table 4 provides an overview of comparability between conditions in which both EV batteries were used. It should be noted that both EVs were used under uncontrollable real life conditions, but some conclusions can still be drawn regarding their utilization. For one, both vehicles were equally old and kept under similar conditions (on an open parking space in the same geographic area). Thus, considering the calendar life loss and impact of ambient temperature, the conditions for both batteries are considered to be similar. The average SoC was lower for the EV shared among the co-housing members as it was mainly recharged just before using rather than immediately at the end of a trip. Literature suggests that the average SoC should be kept as low as possible and ideally around 50% [62]; however, in real life conditions (and probably due to the range anxiety), users were more prone to recharge the battery even if the SoC was higher than 50% (Figure 8). The charging–discharging current rate affects the cyclic aging due to mechanical stresses (due to the volume change of the active material). Data show that 7.6% of recharging events for the vehicle used by car-sharing company members were made with fast chargers, while this was the case for fewer (4.6%) recharging events for the EV used by the co-housing group. Regarding the depth of discharge (DoD), from driving and charging data, it is evident that the EV shared by members of the car-sharing company was used, on average, for longer trips; thus, the DoD was on average higher. However, our results derived from empirical data analysis confirm findings from Lacey et al. [39], Peterson et al. [43], and Le et al. [41], where, based on experimental results under controllable conditions, the SoC and DoD were found to affect battery degradation significantly. Given that a literature review reveals that most of the published work on battery SoH is simulation with very little verification with the experimental results [38,41,42,43,44,45,63], this insight seems particularly valuable.
From a business point of view, knowing that the battery is the most expensive part of an EV and accounts for about 54% of the total production costs of the vehicle [64], this research provides a valuable reference on the effects of different car-sharing practices and driving and charging behaviors on EV battery degradation. This element was not present when sharing conventional vehicles and for this reason was so far overlooked. However, our findings suggest that it is worth extending existing system designs to incorporate the impact of driving and charging behavior, as well as the cost of the battery, when introducing EVs into car-sharing schemes. The effect of this extension is potentially twofold. Firstly, the economic implications should be carefully assessed. Literature suggests how a used EV battery, at the end of life, can be sold at 50% of the current price of a new battery on the secondhand market [47]. Considering that shared vehicles are used at a higher rate than private ones, it is essential to evaluate how this translates in terms of EV battery-related costs (for example, whether a battery will reach its end of life while still under warranty). Future research in this field is desired, as it could clarify and quantify these economic impacts and provide practitioners with valuable points of reference. Secondly, our results suggest that it is worth examining how car-sharing system members use vehicles at their disposal. If a car-sharing practice already exists and is considering extending its car park with EVs, analyzing how existing members utilize the service can be a good basis for extrapolating their driving behavior on considered EV models. This way, a decision-making process can be supported with simulation results and a more informed decision can be made regarding the selection of EVs at the market. Furthermore, by examining how EVs are used by car-sharing members, recharging rules can be adjusted in order to ensure a longer viability of the EV battery.
Overall, although our sample is quite limited in the number of vehicles that were at our disposal for analysis, the availability of identical EVs, equally old and used in the same geographic area by different car-sharing practices is also quite a rare opportunity to gain insights into the potential impacts these practices can have on EV battery performance in uncontrolled real life conditions. These insights seem especially relevant in the context of the car-sharing market that is expanding at annual rates of as much as 30% [65]. Furthermore, since existing literature reports [21] that most shared EV systems are failing to reach satisfactory commercial viability at this point, our research successfully implements a SoH forecasting model to shed light on potential improvements that implementers of car-sharing practices can consider to improve their commercial viability.

7. Conclusions

We have found that detailed transaction data from charging stations and EV sensors can be successfully implemented to forecast EV battery SoH. In addition, we have enriched existing simulation models in the field of SoH estimation with empirical analysis confirmation. The empirical analysis was based on real life driving and charging data, from two identical and equally old EVs, utilized in the same geographic area, whose use differed in the average SoC, DoD, and the percentage of fast charger utilization. Our results indicate that delayed charging (for example, prior rather than right after the use) and lower utilization of fast chargers have the potential to slow down the rate of battery degradation. While the utilization of fast chargers and delayed charging can to some level be influential (for example, by implementing smart chargers, providing different user-oriented incentives, or creating a contract between user and car-sharing organization), the third element that differed, the DoD, is mainly a result of basic users’ need for mobility (e.g., trip distance).
Furthermore, battery degradation is related to the cost of the battery and hence the cost of the EV (battery accounts for about 54% of the total production costs of the vehicle [64]) and, respectively, the commercial viability of car-sharing practices. The latter has been recognized in the existing literature as one of the main challenges that EV sharing practices are facing. From this point of view, our findings can be a valuable reference for EV sharing practitioners, as they indicate potential extensions that can be integrated into existing car-sharing system designs. These potential extensions should incorporate additional elements that were not present in conventional car-sharing practices, such as (i) the economic effect of a higher car usage rate on EV battery degradation, related expenses, and viability of such practices and (ii) potential adjustments in terms of recharging practices and an improved match between customers’ driving and charging behavior and available vehicles.

Acknowledgments

This research is funded by INTERREG North-West Europe project New Integrated Smart Transport Options (NISTO) and INTERREG IVB North Sea Region project North Sea Region Electric Mobility Network (E-Mobility), the Flemish government agency for Innovation by Science and Technology and the Flemish Institute for Mobility.

Author Contributions

Ivana Semanjski contributed by electric vehicles data analytics, interpreted the data and wrote the paper. Sidharta Gautama contributed by conception and designing of research activities, data interpretation and manuscript revision.

Conflicts of Interest

The authors declare no conflict of interest. The founding sponsors had no role in the design of the study; in the collection, analyses, or interpretation of data; in the writing of the manuscript; or in the decision to publish the results.

References

  1. Intergovernmental Panel on Climate Change. Transport and Its Infrastructure. In IPCC Fourth Assessment Report: Mitigation of Climate Change; Cambridge University Press: Cambridge, UK; New York, NY, USA, 2007; Chapter 5. [Google Scholar]
  2. Chillón, P.; Evenson, K.R.; Vaughn, A.; Ward, D.S. A systematic review of interventions for promoting active transportation to school. Int. J. Behav. Nutr. Phys. Act. 2011, 8. [Google Scholar] [CrossRef] [PubMed]
  3. Semanjski, I.; Aguirre, A.J.L.; de Mol, J.; Gautama, S. Policy 2.0 Platform for mobile sensing and incentivized targeted shifts in mobility behavior. Sensors 2016, 16, 1035. [Google Scholar] [CrossRef] [PubMed] [Green Version]
  4. Meijkamp, R. Changing consumer behaviour through eco-efficient services : An empirical study of car sharing in the Nerherlands. Bus. Strategy Environ. 1998, 7, 234–244. [Google Scholar] [CrossRef]
  5. Shaheen, S.A.; Cohen, A.P. Growth in worldwide carsharing: An international comparison. Transp. Res. Rec. J. Transp. Res. Board 2007, 1992, 81–89. [Google Scholar] [CrossRef]
  6. Global Report on Urban Health: Equitable, Healthier Cities for Sustainable Development; World Health Organisation (WHO): Kobe, Japan, 2016.
  7. Focus on European Cities; Eurostat: Luxemburg, 2014.
  8. Fellows, N.; Pitfield, D. An economic and operational evaluation of urban car-sharing. Transp. Res. D Transp. Environ. 2000, 5, 1–10. [Google Scholar] [CrossRef]
  9. Musso, A.; Corazza, M.V.; Tozzi, M. Car sharing in Rome: A case study to support sustainable mobility. Procedia Soc. Behav. Sci. 2012, 48, 3482–3491. [Google Scholar] [CrossRef]
  10. Stasko, T.H.; Buck, A.B.; Gao, O.H. Carsharing in a university setting: Impacts on vehicle ownership, parking demand, and mobility in Ithaca, NY. Transp. Policy 2013, 30, 262–268. [Google Scholar] [CrossRef]
  11. Shaheen, S.A.; Mallery, M.A.; Kingsley, K.J. Personal vehicle sharing services in North America. Res. Transp. Bus. Manag. 2012, 3, 71–81. [Google Scholar] [CrossRef]
  12. Kent, J.L.; Dowling, R. Puncturing automobility? Carsharing practices. J. Transp. Geogr. 2013, 32, 86–92. [Google Scholar] [CrossRef]
  13. Prettenthaler, F.; Steininger, K. From ownership to service use lifestyle: The potential of car sharing. Ecol. Econ. 1999, 28, 443–453. [Google Scholar] [CrossRef]
  14. Morency, C.; Trépanier, M.; Agard, B.; Martin, B.; Quashie, J. Car sharing system: What transaction datasets reveal on users’ behaviors. In Proceedings of the IEEE Conference on Intelligent Transportation Systems (ITSC), Washington, DC, USA, 30 September–3 October 2007.
  15. Graham-Rowe, E.; Skippon, S.; Gardner, B.; Abraham, C. Can we reduce car use and, if so, how? A review of available evidence. Transp. Res. A Policy Pract. 2011, 45, 401–418. [Google Scholar] [CrossRef]
  16. Loose, W. The State of European Car-Sharing, MOMO Project; Bundesverband CarSharing: Freiburg, Germany, 2010. [Google Scholar]
  17. Catalano, M.; Casto, B.L.; Miglio, M. Car sharing demand estimation and urban transport demand modelling using stated preference techniques. Eur. Trans. 2008, 40, 33–50. [Google Scholar]
  18. Katzev, R. Car sharing: A new approach to urban transportation problems. Anal. Soc. Issues Public Policy 2003, 3, 65–86. [Google Scholar] [CrossRef]
  19. Analysis of the Market for Carsharing in North America; Frost & Sullivan Research Service: San Antonio, TX, USA, 2010.
  20. Kitamura, R. Sharing electric vehicles in Kyoto: Kyoto public car system. Int. Assoc. Traffic Saf. Sci. Res. 2001, 26, 86–89. [Google Scholar] [CrossRef]
  21. Fukuda, T.; Kashima, S.; Barth, M. Evaluating second car system, an electric vehicle sharing experiment in Tama New Town District, Inagi City, Tokyo. In Proceedings of the TRB 2003 Annual Meeting, Washington, DC, USA, 12–16 January 2003.
  22. Lee, J.; Nah, J.; Park, Y.; Sugumaran, V. Electric car sharing service using mobile technology. In Proceedings of the International Conference on Information Resources Management, Seoul, Korea, 12–14 June 2011.
  23. Luè, A.; Colorni, A.; Nocerino, R.; Paruscio, V. Green move: An innovative electric vehicle-sharing system. Procedia Soc. Behav. Sci. 2012, 48, 2978–2987. [Google Scholar] [CrossRef]
  24. Xia, M.; Lai, Q.; Zhong, Y.; Li, C.; Chiang, H.D. Aggregator-based interactive charging management system for electric vehicle charging. Energies 2016, 9, 159. [Google Scholar] [CrossRef]
  25. Chen, L.; Chen, Z.; Huang, X.; Jin, L. A study on price-based charging strategy for electric vehicles on expressways. Energies 2016, 9, 385. [Google Scholar] [CrossRef]
  26. Wappelhorst, S.; Sauer, M.; Hinkeldein, D.; Bocherding, A.; Glaß, T. Potential of electric carsharing in urban and rural areas. Transp. Res. Procedia 2014, 4, 374–386. [Google Scholar] [CrossRef]
  27. Barth, M.J.; Todd, M. UCR INTELLISHARE: An intelligent shared electric vehicle testbed at the University of California, Riverside. IATSS Res. 2003, 27, 48–57. [Google Scholar] [CrossRef]
  28. Raslavičius, L.; Azzopardi, B.; Keršys, A.; Starevičius, M.; Bazaras, Ž.; Makaras, R. Electric vehicles challenges and opportunities: Lithuanian review. Renew. Sustain. Energy Rev. 2015, 42, 786–800. [Google Scholar] [CrossRef]
  29. Lebeau, K.; van Mierlo, J.; Lebeau, P.; Mairesse, O.; Macharis, C. The market potential for plug-in hybrid and battery electric vehicles in Flanders: A choice-based conjoint analysis. Transp. Res. D Transp. Environ. 2012, 17, 592–597. [Google Scholar] [CrossRef]
  30. Propfe, B.; Kreyenberg, D.; Wind, J.; Schmid, S. Market penetration analysis of electric vehicles in the German passenger car market towards 2030. Int. J. Hydrogen Energy 2013, 38, 5201–5208. [Google Scholar] [CrossRef]
  31. Kihm, A.; Trommer, S. The new car market for electric vehicles and the potential for fuel substitution. Energy Policy 2014, 73, 147–157. [Google Scholar] [CrossRef]
  32. Plötz, P.; Schneider, U.; Globisch, J.; Dütschke, E. Who will buy electric vehicles? Identifying early adopters in Germany. Transp. Res. A Policy Pract. 2014, 67, 96–109. [Google Scholar] [CrossRef]
  33. Bühler, F.; Cocron, P.; Neumann, I.; Franke, T.; Krems, J.F. Is EV experience related to EV acceptance? Results from a German field study. Transp. Res. F Traffic Psychol. Behav. 2014, 25, 34–49. [Google Scholar] [CrossRef]
  34. Wan, Z.; Sperling, D.; Wang, Y. China’s electric car frustrations. Transp. Res. D Transp. Environ. 2015, 34, 116–121. [Google Scholar] [CrossRef]
  35. Larson, P.D.; Viáfara, J.; Parsons, R.V.; Elias, A. Consumer attitudes about electric cars: Pricing analysis and policy implications. Transp. Res. A Policy Pract. 2014, 69, 299–314. [Google Scholar] [CrossRef]
  36. Dubarry, M.; Truchot, C.; Liaw, B.Y.; Gering, K.; Sazhin, S.; Jamison, D.; Michelbacher, C. Evaluation of commercial lithium-ion cells based on composite positive electrode. J. Power Sources 2011, 196, 10336–10343. [Google Scholar] [CrossRef]
  37. Ning, G.; Popov, B.N. Cycle life modeling of lithium-ion batteries. J. Electrochem. Soc. 2004, 151, A1584–A1591. [Google Scholar] [CrossRef]
  38. Hooper, J.M.; Marco, J.; Chouchelamane, G.H.; Lyness, C.; Taylor, J. Vibration durability testing of nickel cobalt aluminum oxide (NCA) lithium-ion 18650 battery cells. Energies 2016, 9, 281. [Google Scholar] [CrossRef] [Green Version]
  39. Lacey, G.; Putrus, G.; Jiang, T.; Kotter, R. The effect of cycling on the state of health of the electric vehicle battery. In Proceedings of the 48th International Universities Power Engineering Conference (UPEC), Dublin, Ireland, 2–5 September 2013.
  40. Nikolian, A.; Firouz, Y.; Gopalakrishnan, R.; Timmermans, J.-M.; Omar, N.; van den Bossche, P.; van Mierlo, J. Lithium ion batteries—Development of advanced electrical equivalent circuit models for nickel manganese cobalt lithium-ion. Energies 2016, 9, 360. [Google Scholar] [CrossRef]
  41. Le, D.; Tang, X. Lithium-ion battery state of health estimation using Ah-V characterization. In Proceedings of the Annual Conference of Prognostics and Health Management (PHM) Society, Montreal, QC, Canada, 20–23 June 2011.
  42. Ramadesigan, V.; Northrop, P.W.C.; De, S.; Santhanagopalan, S.; Braatz, R.D.; Subramanian, R.V. Modeling and simulation of lithium-ion batteries from a systems engineering perspective. J. Electrochem. Soc. 2012, 159, R31–R45. [Google Scholar] [CrossRef]
  43. Peterson, S.B.; Apt, J.; Whitacre, J. Lithium-ion battery cell degradation resulting from realistic vehicle and vehicle-to-grid utilization. J. Power Sources 2010, 195, 2385–2392. [Google Scholar] [CrossRef]
  44. Zhang, H.; Pei, L.; Sun, J.; Song, K.; Lu, R.; Zhao, Y.; Zhu, C.; Wang, T. Online diagnosis for the capacity fade fault of a parallel-connected lithium ion battery group. Energies 2016, 9, 387. [Google Scholar] [CrossRef]
  45. Huang, Y.; Guo, C.; Ding, Y.; Wang, L.; Zhu, B.; Xu, L. A multi-period framework for coordinated dispatch of plug-in electric vehicles. Energies 2016, 9, 370. [Google Scholar] [CrossRef]
  46. Conti, M.; Kotter, R.; Putrus, G. Energy efficiency in electric and plug-in hybrid electric vehicles and its impact on total cost of ownership. In Electric Vehicle Business Models; Springer: Cham, Switzerland, 2014; pp. 147–165. [Google Scholar]
  47. Narula, C.; Martinez, R.; Onar, O.; Starke, M.; Andrews, G. Economic Analysis of Deploying Used Batteries in Power Systems; Oak Ridge National Labaratory: Oak Ridge, TN, USA, 2011.
  48. Delucchi, M.; Lipman, T.E. An analysis of the retail and lifecycle cost of battery-powered electric vehicles. Transp. Res. D Transp. Environ. 2001, 6, 371–404. [Google Scholar] [CrossRef]
  49. Gautama, S.; Gillis, D.; Pace, G.; Semanjski, I. Cohousing and EV sharing: Field-tests in Flanders. In E-Mobility in Europe: Trends and Good Practice; Filho, W.L., Kotter, R., Eds.; Springer: Berlin, Germany, 2015; pp. 85–107. [Google Scholar]
  50. Fujii, S.; Garling, T. Application of attitude theory for improved predictive accuracy of stated preference methods in travel demand analysis. Transp. Res. A Policy Pract. 2003, 37, 389–402. [Google Scholar] [CrossRef]
  51. Tversky, A.; Slovic, P.; Kahneman, D. The causes of preference reversal. Am. Econ. Rev. 1990, 80, 204–217. [Google Scholar]
  52. Kahneman, D.; Knetsch, J.L.; Thaler, R.H. Anomalies: The endowment effect, loss aversion, and status quo bias. J. Econ. Perspect. 1991, 5, 193–206. [Google Scholar] [CrossRef]
  53. Ettema, D.; Timmermans, H.; van Veghel, L. Effects of Data Collection Methods in Travel and Activity Research; European Institute of Retailing and Services Studies: Eindhoven, The Netherlands, 1996. [Google Scholar]
  54. Witlox, F. Evaluating the reliability of reported distance data in urban travel behaviour analysis. J. Transp. Geogr. 2007, 15, 172–183. [Google Scholar] [CrossRef]
  55. Cambio. 2015. Available online: https://www.cambio.be/cms/carsharing/en/2/cms?cms_knuuid=383ac52d-6f2d-4bcf-a2ec-6db0ff9defc5&cms_f4=1&cms_f8= (accessed on 3 February 2015).
  56. Royal Meteorological Institute of Belgium. Climate and Weather. 2015. Available online: http://www.meteo.be (accessed on 15 February 2015).
  57. North Sea Region Electric Mobility Network—E-Mobility NSR. Available online: http://e-mobility-nsr.eu/ (accessed on 18 October 2016).
  58. Rapporten OVG Vlaanderen; Mobiel Vlaanderen: Hasselt, Belgium, 2012.
  59. Marra, F.; Træholt, C.; Larsen, E.; Wu, Q. Average behavior of battery-electric vehicles for distributed energy studies. In Proceedings of the 2010 IEEE PES Innovative Smart Grid Technologies Conference Europe (ISGT Europe), Gothenburg, Sweden, 11–13 October 2010.
  60. Battery and Energy Technologies; Woodbank Communications Ltd.: Chester, UK, 2005.
  61. Magnor, D.; Gerschler, J.B.; Ecker, M.; Merk, P.; Sauer, D.U. Concept of a battery aging model for lithium-ion batteries considering the lifetime dependency on the operation strategy. In Proceedings of the European Photovoltaic Solar Energy Conference, Hamburg, Germany, 21–25 September 2009.
  62. Lunz, B.; Walz, H.; Sauer, D.U. Optimizing vehicle-to-grid charging strategies using genetic algorithms under the consideration of battery aging. In Proceedings of the 2011 IEEE Vehicle Power and Propulsion Conference (VPPC), Chicago, IL, USA, 6–9 September 2011.
  63. Lai, C.-M.; Yang, M.-J. A high-gain three-port power converter with fuel cell, battery sources and stacked output for hybrid electric vehicles and DC-microgrids. Energies 2016, 9, 180. [Google Scholar] [CrossRef]
  64. Cars 21. How to Reduce EV Production Costs? EV Battery Tech USA. 2011. Available online: http://www.cars21.com/news/view/670 (accessed on 18 October 2016).
  65. Horstkoetter, D.; Freese, C.; Schoenberg, T.; Abdo, O.; Wiesbock, F. Shared Mobility—How New Businesses Are Rewriting the Rules of the Private Transportation Game; Roland Berger Strategy Consultants: Munich, Germany, 2014. [Google Scholar]
Figure 1. (a) Electric vehicle (EV) shared by the co-housing community during the e-Mobility project [57]; and (b) equipment for the Controller Area Network bus (CAN bus) data acquiring.
Energies 09 01025 g001
Figure 2. Driving behavior—distribution of daily trips.
Energies 09 01025 g002
Figure 3. Driving behavior—distribution of trip lengths.
Energies 09 01025 g003
Figure 4. Charging behavior—an hour of a day when the charging event started.
Energies 09 01025 g004
Figure 5. Charging behavior—the duration of charging event in days.
Energies 09 01025 g005
Figure 6. Charging behavior—the duration of the charging event in hours.
Energies 09 01025 g006
Figure 7. Charging behavior—the number of charging events per day.
Energies 09 01025 g007
Figure 8. Charging behavior—state of charge (SoC) at the beginning and the end of charging events: (a) SoC at the start of charging event—car-sharing company; (b) SoC at the start of charging event—co-housing; (c) SoC at the end of charging event—car-sharing company; and (d) SoC at the end of charging event—co-housing.
Energies 09 01025 g008
Figure 9. Plot of V × I (W) rebased against time.
Energies 09 01025 g009
Figure 10. Determining the instantaneous battery power transfer W for one discharge cycle from battery voltage and current measurements.
Energies 09 01025 g010
Figure 11. Approximation of the state of health (SoH)’s linear trend from the driving data.
Energies 09 01025 g011
Figure 12. SoH’s linear trends extrapolation and theoretical end of life border.
Energies 09 01025 g012
Table 1. Demographic characteristics of the user groups.
DemographicCo-Housing Members Car-Sharing Company Members
Number of users3524,000
Users per vehicle1228
GenderMale47.06%58.43%
Female52.94%44.94%
Age18–2522.86%7.87%
26–4520.59%58.40%
45–6555.88%37.10%
Marital statusSingle26.47%33.71%
Married or co-habiting73.53%65.17%
Number of children020.59%65.17%
120.59%14.61%
211.76%16.85%
3+47.06%2.25%
Table 2. Vehicle and battery characteristics. NEDC: New European Driving Cycle.
EngineGeneralBattery
TypePowerMaximum SpeedAutonomyConsumptionTypeUsable CapacityQuoted Capacity
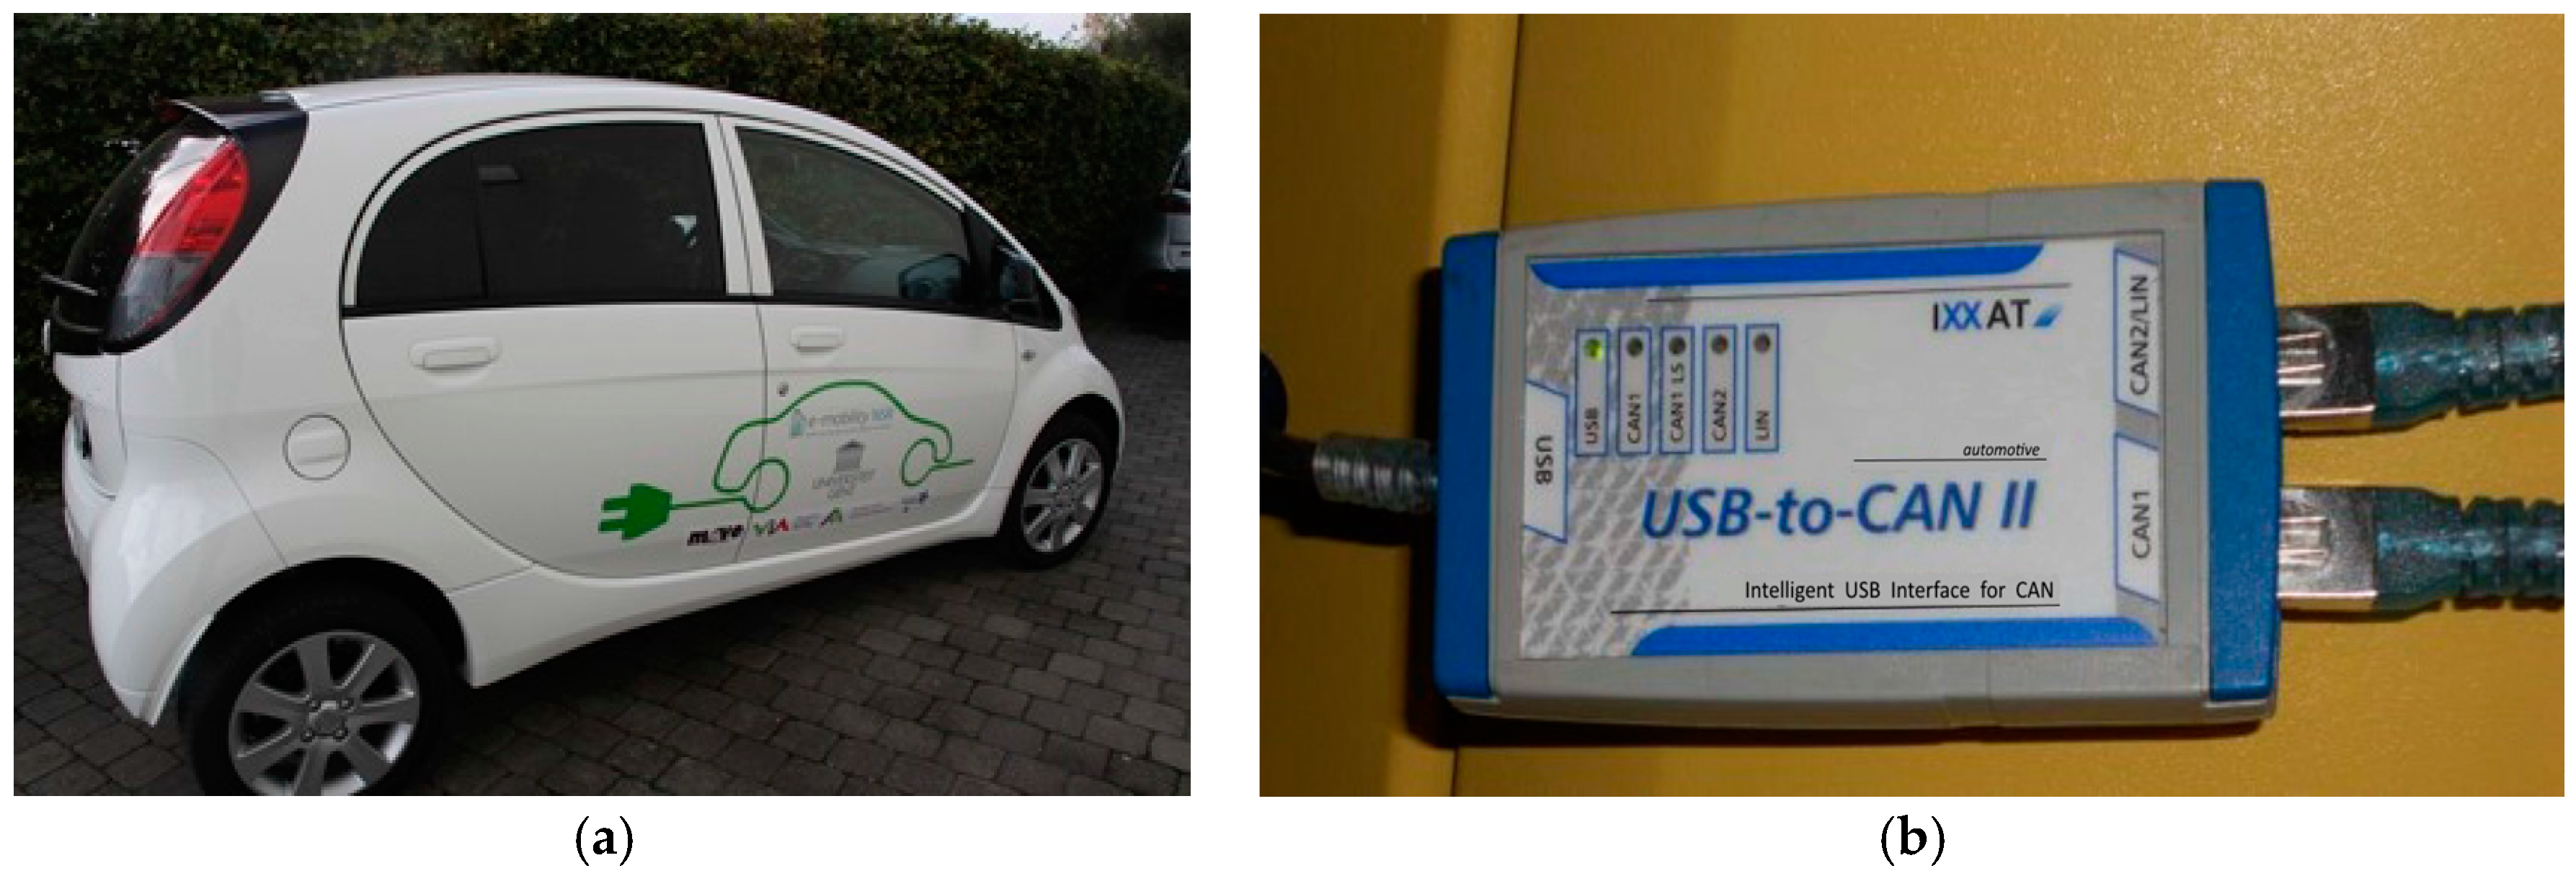
Synchronous motor/three-phase permanent magnet47 kW130 km/h160 km (according to Japanese 10–15 test mode)167 Wh/km (NEDC cycle)Lithium-ion14.2 kWh16 kWh
Table 3. Goodness of fit for linear estimation.
Goodness of Fit MeasureCo-HousingCar-Sharing Company
Least squares deviation1.6051821.699434
Average deviation0.9497031.07033
Relative squared error0.0001840.00030
Relative absolute deviation0.0101160.01410
Table 4. Comparison of the EV batteries utilization conditions. N/A: not available; and DoD: depth of discharge.
Capacity Loss ElementComponentEV (Co-Housing)EV (Car-Sharing Practice)
lcalendarStempSimilarSimilar
SoCIn average, lowerIn average, higher
lcycleCrLower percentage of fast rechargingHigher percentage of fast recharging
btempNot availableNot available
SoCIn average, lowerIn average, higher
DoDIn average, lowerIn average, higher

