Communication

Exploring Stochastic Sampling in Nuclear Data Uncertainties Assessment for Reactor Physics Applications and Validation Studies

Laboratory for Reactor Physics and Systems Behaviour, Paul Scherrer Institute, 5232 Villigen PSI, Switzerland
*
Author to whom correspondence should be addressed.
Energies 2016, 9(12), 1039; https://doi.org/10.3390/en9121039
Submission received: 25 September 2016 / Revised: 25 November 2016 / Accepted: 29 November 2016 / Published: 9 December 2016
(This article belongs to the Special Issue Advances in Predictive Modeling of Nuclear Energy Systems)

Abstract

:
The quantification of uncertainties of various calculation results, caused by the uncertainties associated with the input nuclear data, is a common task in nuclear reactor physics applications. Modern computation resources and improved knowledge on nuclear data allow nowadays to significantly advance the capabilities for practical investigations. Stochastic sampling is the method which has received recently a high momentum for its use and exploration in the domain of reactor design and safety analysis. An application of a stochastic sampling based tool towards nuclear reactor dosimetry studies is considered in the given paper with certain exemplary test evaluations. The stochastic sampling not only allows the input nuclear data uncertainties propagation through the calculations, but also an associated correlation analysis performance with no additional computation costs and for any parameters of interest can be done. Thus, an example of assessment of the Pearson correlation coefficients for several models, used in practical validation studies, is shown here. As a next step, the analysis of the obtained information is proposed for discussion, with focus on the systems similarities assessment. The benefits of the employed method and tools with respect to practical reactor dosimetry studies are consequently outlined.

1. Introduction

It is a very well established and principally important practice in the nuclear safety field to validate calculation methodologies and tools against experimentally-based reference data. In fact the validation process constitutes a key component of an overall qualification process of a methodology, accompanied by the calculation uncertainty quantification procedure and the methodology benchmarking as well (see e.g., [1,2]). For instance, in the domain of criticality safety assessment, a very comprehensive validation resource is already established thanks to large international efforts invested in the past decades to collect, evaluate and combine all publicly available critical experiments in a single database [3]. The work was done under the auspice of the Organization for Economic Co-operation and Development (OECD) and involved in total twenty different countries [3]. Similar databases exist for other classes of experimental data, like reactor measurements, spent nuclear fuel isotopic compositions (from post-irradiation examination campaigns) and dosimetry measurements. However, despite the good state of the publicly available experimental databases, it is often desired to increase in size the validation database to advance the comprehensive validation of some particular methodologies and to increase the calculated to experiment (C/E) sample size in order to avoid unnecessary conservative penalties in safety assessments. Therefore, it is a very important task to identify an existence and the reliability of any available experimental based information, appropriate for the validation of every specific calculation for a specific system.
There already exist computation tools, based on the deterministic approach, being intensively used in the field of nuclear criticality safety and recently updated validation practices, for mathematically grounded and efficient assessment of similarities of systems [4,5] (to advance the “engineering judgement” assessment of the systems design parameters similarities, as e.g., employed in [6]). From the validation point of view the systems similarity means that it is expected that biases associated with calculations of the benchmark and application systems with the same tools and databases (e.g., neutron cross-section libraries) will be similar [4]. Apparently, the commonly used measure for assessing the similarity is the Pearson correlation coefficient. The systems would be correlated, i.e., react in a similar manner on perturbations of, e.g., nuclear data (ND), if they consist of similar materials and have similar neutron spectra [4]. For instance, the USA Oak Ridge National Laboratory (ORNL) code Tools for Sensitivity and Uncertainty Analysis Methodology Implementation (TSUNAMI) [7,8] is based on the use of the first order sensitivity profile calculations for the response parameter to the variations in the input nuclear data and consequent folding this information with nuclear data covariance matrices (CM) [8]. In the field of criticality safety the integral parameter for assessment of the systems similarity is the system neutron multiplication factor, keff. The keff sensitivity vectors required by the TSUNAMI methodology originally were computed within the SCALE system with the help of the multigroup Monte Carlo (MC) particle transport code KENO [9]. Recently significant progress was also achieved in the continuous-energy sensitivity calculations, see e.g., [10,11].
There also exist formalisms, allowing analysis of, e.g., spatially distributed neutron spectrum related parameters. Such calculations can be done, for instance, with the differential operator perturbation capability realized in some MC codes, such as Monte Carlo N-Particle® codes MCNP® or MCNPX (hereafter MCNP(X) stands for both the MCNP6 and MCNPX versions of the codes owned by USA Los Alamos National Security, LLC, manager and operator of Los Alamos National Laboratory, being in use at Paul Scherer Institute (PSI)) [12,13], however the realization of this option in the standard versions of MCNP(X) is known to have deficiencies in the case of eigenmode calculations [11]. The generalized perturbation theory framework exists for both the deterministic [14] (see the link “Bibliography relative to Sensitivity and Uncertainty (S/U) Analysis” for a list of relevant references) and the MC based neutron transport solution options. For instance the continuous-energy MC calculation capability is already available [15], though such studies are still occasional in practice.
Typically the perturbation theory algorithms are based on the first-order approximation [16] and it is then the local linear sensitivity coefficients, which are required for the uncertainty analysis. Note however, that the differential sampling operator (as for instance is implemented in MCNP(X)) can also provide the second-order sensitivity coefficients. Deterministic methods for analysis of higher-order effects for non-linear responding system changes to variations of the input parameters, also exist (see e.g., [14,17,18]), and advanced methods are being developed [19,20]. Obviously, the growing computation resources will push forward this type of studies further because of the need in the accurate deterministic methods for variety of practical applications and studies, like data assimilation (e.g., “adjustment” or calibration of neutron cross-sections and/or the calculation results based on the validation results), development of efficient surrogate models, etc. [14,19,20,21,22,23,24,25,26].
In fact, the sensitivity and uncertainty analyses, and specifically the propagation of nuclear data related uncertainties, are traditional areas of investigation for reactor physics [14,21], originating from the perturbation theory developments [14], however the topic of automatized similarity assessment still needs enhancements. Since the development of the TSUNAMI modules of SCALE, a good set of demonstrative studies on assessment of the similarities between an application system and available critical benchmark experiments for consequent selection of an appropriate validation benchmark suite has been published [27,28], and application of this practice in the field of criticality safety evaluations (CSE) is being further developed [29,30]. Such methodology is most attractive for the cases where the amount of benchmark experiments directly simulating an application case is restricted. However, because of the above mentioned limitations, the practice of the systems similarity analysis does not seem to be well explored beyond the traditional keff responses.
With the modern computation capabilities the stochastic sampling approach became also attractive for uncertainty quantifications and in the last decade a number of computation tools has been developed over the world towards the propagation of nuclear data uncertainties in neutronic calculations, ranging from tools for “simple” criticality stationary calculations, up to time-dependent calculations (including isotopic kinetics/fuel depletion and reactor dynamics/transient modeling in the vocabulary of nuclear engineering community) [31,32,33,34,35,36,37,38,39,40,41,42,43,44]. When it is possible, the stochastic and deterministic methods are cross-verified against each other [33,37,39] or even work in combination to provide the best capabilities for calculation simulations and results analysis [44]. Naturally, the stochastic sampling simulations bring an alternative option for the correlation analysis, compared to the deterministic based assessments. Noticeably, the simple random sampling can be easily applied in a black box manner with any model/code for analysis of any system response of interest and with minimum associated approximations, while more advanced sampling techniques may be offered, e.g., for global sensitivity studies [45,46,47,48,49]. Nevertheless, the stochastic sampling based way for assessment of system similarities with respect to nuclear data effects is still novice and is also still mainly limited to keff value analysis, as e.g., applied in [50,51]. A prospective use of the stochastic sampling including the correlation assessment and enclosed with Bayesian updating algorithms [21] is pushing forward by the developers of Nuclear Data Uncertainty Analysis (NUDUNA) [34,51] and MOCABA (MOCABA is a combination of Monte Carlo sampling and Bayesian updating algorithms) [52] tools. The use of the Bayesian updating procedures has been already in place at PSI with the Total Monte Carlo (TMC) method and associated tools [53]. Thus, further adaptation of such techniques is foreseen at PSI and the given study is a step in this direction.

2. Subject of the Given Study

One of the recently appeared stochastic sampling based tools, Nuclear data Uncertainty Stochastic Sampling (NUSS) [40,47] was developed at PSI, with the primary purpose to facilitate CSE with a general purpose MC particle transport code such as MCNP(X) and general purpose nuclear data libraries. Details on the PSI CSE methodology can be found in publications [6,54,55]. NUSS is a tool specifically designed for sampling the pointwise-energy A Compact ENDF (ACE)-formatted nuclear data [13] using the Evaluated Nuclear Data File (ENDF) covariance matrices [56,57] and is therefore applicable for continuous-energy MC codes like MCNP(X). The methods used by NUSS are similar to those of XSUSA (Cross Section Uncertainty and Sensitivity Analysis) [31,32], NUDUNA [34], SANDY [35], TMC [58], SAMPLER [59], SHARK-X [39], though the practical realization and application focus may differ. More in-depth comparison of NUSS with the alternative and similar tools can be found in [40,47,48,49]. It is believed that the use of NUSS will allow performing more efficient CSE assessments in the future, finally resulting in optimized strategies for spent nuclear fuel operation in Switzerland [54,55]. Now, with the NUSS tool at hand, an exploration of its application for other than criticality safety calculations is considered at PSI and the present paper investigates thus the use of NUSS on examples of reactor dosimetry related calculations.
In the case of reactor dosimetry the quantities of calculation and validation interest are basically the neutron fluxes and fluence monitors’ reaction rates. Details and some illustrative examples on the topic can be found in [60,61,62,63]. For the case of the problems discussed in this paper the main parameter of interest is the fast neutron flux, i.e., the flux of neutrons above the energy threshold of 1 MeV (the fraction of neutrons with energy above ~20 MeV is negligible in nuclear reactors). In certain exercises the low energy, or thermal flux in reactor terminology (with E < 0.625 eV (“cadmium filter”), as applied in this study for consistency with the previous works [63,64,65,66]), will be considered too.
Thus, the given paper demonstrates an exploration of the nuclear data sampling application for consistent and integral correlation analysis of a set of different type models and outcome parameters. To start, the application of NUSS to the criticality benchmark calculations and consequent analysis of the critical benchmark correlations is discussed for the introductory purpose. Next, such type of investigations is further examined with nuclear reactor dosimetry simulations and validation studies. The asset of the shown exercises is that they go towards the systems similarity analysis beyond the traditionally considered response and field of applications (i.e., keff/criticality safety assessments).

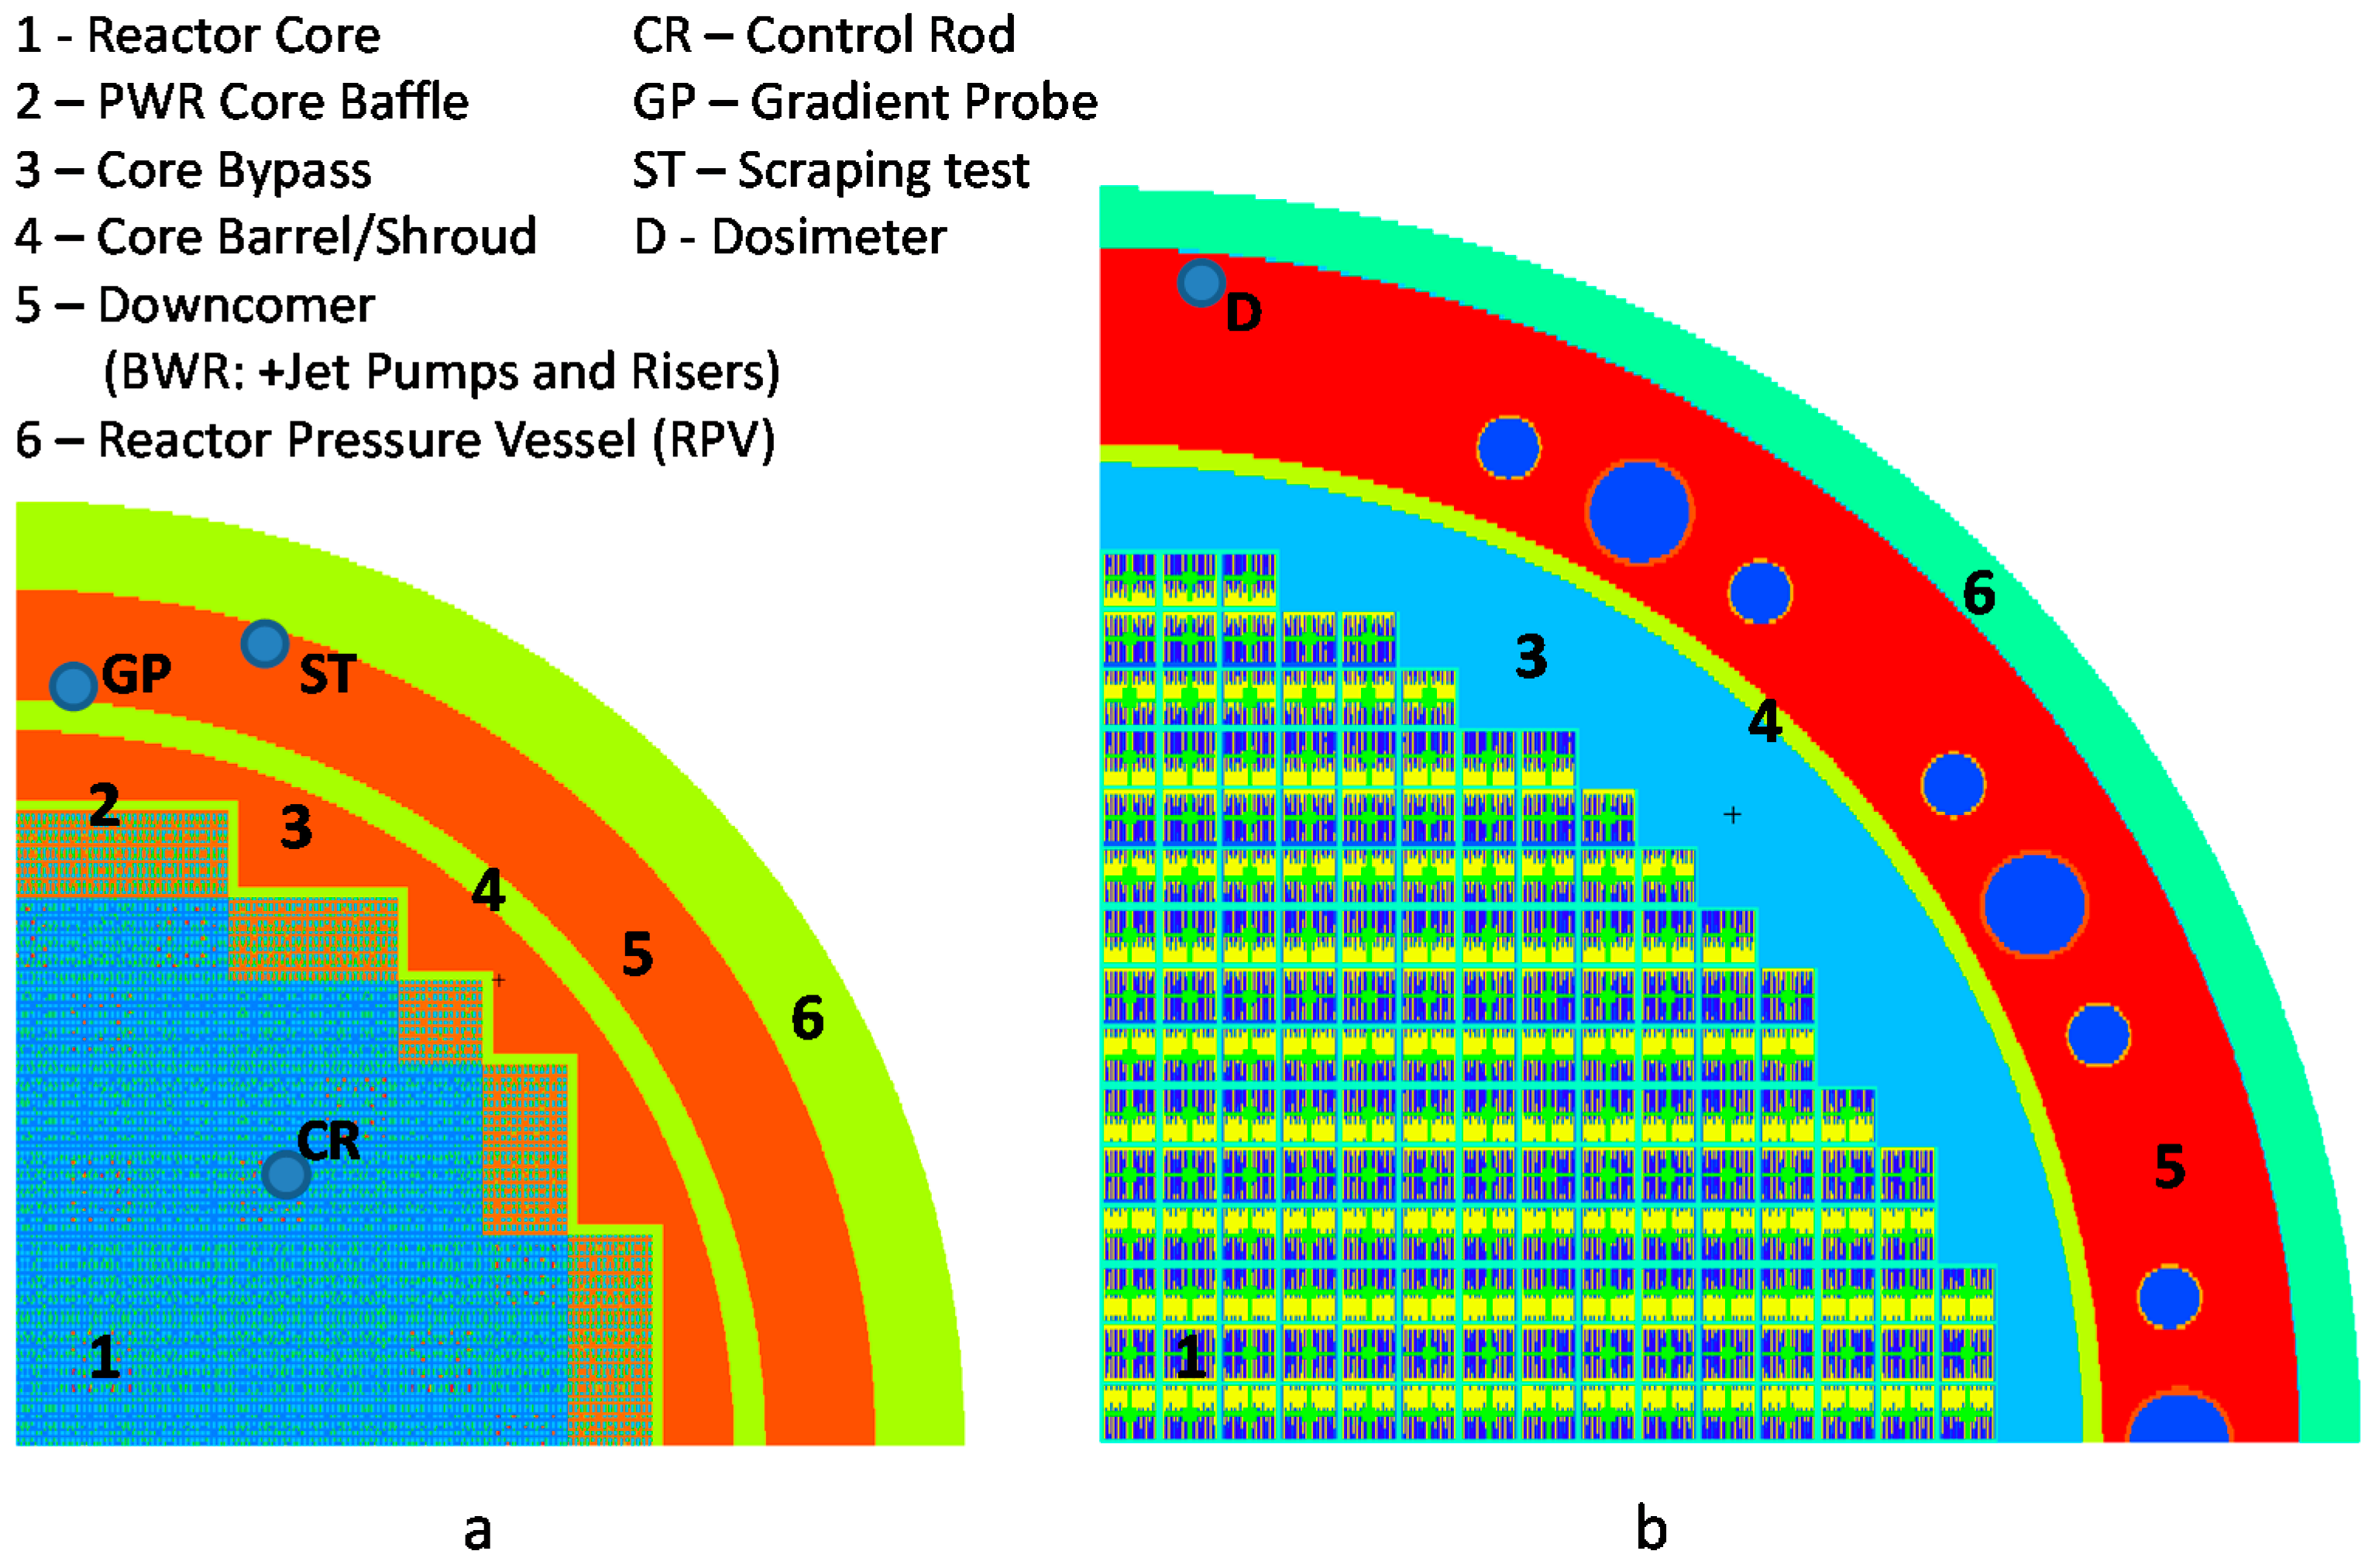
3. Description of the Calculation Models and the Calculation Methodologies

In the context of the given study the NUSS nuclear data sampling tool has been applied primary to analyze two nuclear power reactor models, one describing a pressurized water reactor (PWR) and one describing a boiling water reactor (BWR). The reference MCNP(X) reactor models were used in the past in particular for the analysis of specific reactor dosimetry experiments performed at the given Swiss nuclear power plants (NPPs).
It should be commented for clarity that in the MCNP(X)-based PSI methodology for neutron fluence calculations the fixed (external) source option of modeling is employed, i.e., the fission neutron specifications are given as input data in the MC model and therefore when the fission process is actually happening in the MC simulations, the number of generated neutrons is set to zero to avoid duplication of the same fission neutrons. This is a common choice of modeling for rector dosimetry applications and it differs from the “usual” eigenmode approach, which allows to find a pseudo equilibrium state of the system (by normalizing the fission source with the keff parameter) with a self-consistent fission source distribution [13]. Thus, the role of ND is not fully the same in the fixed-source and in the eigenmode calculations. In the first approach the uncertainties of the fuel isotopes which are related to the neutrons generation at the fission process can be accounted only in the given fission source specifications, but they cannot be propagated through the fixed-source simulations. However the fuel isotopes continue to affect the neutron transport through other than fission interactions with neutrons (and actually the fission cross-section remains to be a part of the absorption cross-section) and thus they still contribute (partly) to the calculated outcome uncertainties. In this sense only the impacts of the neutron multiplicity and the fission neutron spectra are missed. This said, one should notice that in the fixed-source model the source amplitude is always normalized to the same reference value (corresponding to the total reactor power) and therefore the neutron multiplicity perturbation is not much relevant for consideration in the neutron transport simulation. Thus, in the given study when using the fixed-source modeling option we consider the ND uncertainties effects only with respect to the neutron transport and we ignore the uncertainties in the fission source spatial-energy formation. Note that normally in the PSI methodology the neutron source for MC calculations with MCNP(X) is prepared based on the detailed and validated reactor core-follow calculations with deterministic codes CASMO/SIMULATE (see for details [67]). A special methodology was also developed at PSI for assessment of the ND-related uncertainties in the core-follow calculations [39,41,42]. Thus, in principle, the uncertainty of the neutron source specifications used in the MCNP(X) fixed-source calculations can be taken into account as well and such studies are planned.
Figure 1 demonstrates horizontal cross-sections of the MCNP(X) models employed in the study, which represent reactor quarter sectors. For simplicity, in the case of the PWR model (Figure 1a), only two types of the fuel assemblies—the ring of peripheral fuel assemblies and the rest of the core—have different thermo-hydraulic and thermal-mechanical properties (materials temperatures and densities). In case of the BWR model (Figure 1b), the core is artificially composed from the fuel assemblies of the same design, which is not realistic, but is sufficiently adequate for the sake of the given study. The positions of the detectors are schematically shown.
For the PWR reactor the first considered experimental program concerned the irradiation of the so-called “gradient probes” (GP) installed next to the core barrel, see Figure 1a for illustration. Details of the experimental set up and a recent PSI analysis of the measured data, including obtained C/E results, can be found in [68]. Secondly, other experimental programs, called “scrapping tests” (ST), performed at the same PWR reactor are also considered. The scrapping samples were taken from the inner surface of the reactor pressure vessel and allowed estimation of the fast neutron flucence (FNF) received by the vessel since the beginning of the reactor operation. Details of these experiments can be found in [61,67,68]. Following the extraction of the irradiated samples from the reactor, specific activities of the material samples have been analyzed (partly at the PSI Hotlab) and later used for validation studies, in particular also performed at PSI [61,67].
In the case of the BWR reactor (see Figure 1b), two different types of radiation dosimeters are considered here. At first the activity measurements were done for the dosimeters (fluence monitors) placed into the “surveillance capsule” which was irradiated during relatively long period of the reactor operation (eleven cycles, i.e., effectively ~10 years of full power irradiation). Secondly, several “short-term” fluence monitors were irradiated during shorter operation periods (during single reactor cycles). As in the case of the PWR, specific activities of the fluence monitors have been later measured (at the PSI Hotlab) and used for the validation studies [62]. Hereafter all considered sources of BWR experimental data for FNF modeling validation will be called “Dosimeters (D)”.
Apart from the analysis of the available experimental data, which is used for validation of the calculation methodology, a practical application of this methodology was performed for the assessment of the fast neutron radiation doses of the control rods during the PWR operation. More details on the previous studies on the control rod tips irradiation can be found in works [63,65,66]. To outline the topic, it could be mentioned that the control rods are the safety and operation control mechanism of nuclear reactors and high irradiation levels received during operation can cause a need to replace them. In the given calculations the control rods were partially inserted into the core, amplifying thus the radial and axial neutron flux non-uniformity entirely in the core and in the local vicinity of themselves in particular. The 3D local nature of responses of the neutron fluxes in the control rod absorber materials to variations of nuclear data is important for consideration in the results correlation analysis presented further in Section 5.
There is a very comprehensive database available on the reactor in-core measurements regularly performed at Swiss operating reactors and these experimental data is used for the PSI calculation models validation [69], however no experimental data is so far available at PSI for explicit validation of the modeling predictions for the fast neutron flux doses at the control rods. Note that the in-core measurements are not strictly appropriate for the validation of the considered PWR control rods (CR) FNF calculations for two main reasons. At first, as it was mentioned, the FNF includes neutrons above 1 MeV, while the in-core measurements are mainly representative for thermal neutrons. And secondly, the considered task is to validate the reference fixed-source based calculation methodology as is, for which the in-core detector measurements are not applicable again because the PSI MCNP(X) models for FNF may not be adequate (not detailed enough) for thermal flux calculations. However, the in-core measurements are valuable for validation of the core-follow calculations [69,70], which serve for definition of the neutron source [67] for MCNP(X) models. Thus, the C/E results associated with the in-core measurements could be treated as an additional component of the neutron source uncertainty in the MC neutron transport calculations.
The list of isotopes and neutron reactions included into stochastic sampling with NUSS covers all relevant uncertainty contributors: about 50 isotopes constituting the fuel, coolant and structural materials compositions, and the cross-sections of (n, n), (n, n′), (n, 2n) and (n, γ) reactions for non-actinides and in addition (n, f) cross-section, prompt nu-bar (νp) and the prompt fission neutron spectra (χp) for actinides (see for more details [54]). Thus, the dimension of the varied inputs is about ~50 isotopes times ~5 reactions times ~187 energy bins of covariance matrices (as applied for the calculations of Section 4, in consistency with one of the default group structures used in the NJOY nuclear data files processing code, applicable for light water reactor (LWR) lattices, see also for illustration [57]), i.e., about ~50,000 of “different” input parameters.
Finally, a recent application of the NUSS tool which was done for criticality safety methodology validation [54] is revised here towards identification of the correlations between the calculation results of the analyzed critical benchmarks. This exercise can be seen as an additional verification of the applied methodology with respect to meeting the expectations dictated by physical properties of the systems.

4. Obtained Uncertainties Results

4.1. General Description and Assessment

To introduce the NUSS tool performance for assessment of nuclear data related uncertainties, at first the level of keff ND-related uncertainties, typical for the LWR-type of fresh fuel critical benchmark configurations can be recalled. The average value obtained with the ENDF/B-VII.1 CM data for PSI CSE validation benchmark suite subset with UO2 fuel was: σ ¯ N D = 598 pcm (pcm: per cent mille, 1 × 10⁻⁵), there the SCALE 44-group structure was used for CM processing with NJOY [54]. For comparison, in work [71], presenting results of TSUNAMI/SCALE calculations, the ND-related uncertainties are close to the ones mentioned above. The σ ¯ N D values obtained for the UO2 cases (with not exactly the same set of benchmarks, comparing to [54]) with ENDF/B-VII.0 and SCALE 6.2 ND libraries were 583 pcm (see also [29] for details) and 597 pcm respectively. For the full set of 149 benchmarks from PSI validation suite, which includes 27 mixed oxide fuel (MOX) cases, the σ ¯ N D value was 614 pcm.
As concerns the accuracy of the critical benchmark calculations with modern tools like MCNP(X) and pointwise nuclear data libraries, it is typically very high. The values of mean bias, ( k e f f c a l c / k e f f b e n c h ¯ −1) and standard deviation of k e f f c a l c / k e f f b e n c h sample, achieved in [54] were −5 pcm and 321 pcm respectively for the complete set of 149 benchmark cases. The sample standard deviation (STD) value of 321 pcm is almost twice lower as compared to the σ ¯ N D results. Without further investigations, this situation can be tentatively explained by two main reasons: at first the STD includes only parts of the σ ¯ N D value and at second the use of general purpose ND uncertainties (not adjusted for a particular application type, like CSE for LWR) is expected to be over-conservative and therefore the techniques for ND/CM (or calculation bias and uncertainty) adjustments are in development and use [5,7,14,22,23,24,25,52]. Typical level of the Monte Carlo statistical precision in the individual benchmark calculations is below 20 pcm, however for the NUSS/MCNP(X) calculations the statistical uncertainty of the individual runs was about ~70–90 pcm to reduce the computation time.
Concerning the dosimetry type of calculations, resulting uncertainties for the several considered models are presented in Table 1. The nomenclature used in the Table 1 is as follows: CR—model for analysis of Control Rod fluence, GP—model for analysis of “Gradient Probes” measurements, ST—model for analysis of “Scraping Test” measurements. Low case letters mean: s—fixed source modeling option; k—eigenmode (self-consistent source) modeling option, t—thermal flux. That is, the names PWR-CRk and PWR-CRs in Table 1 mean the PWR models for the analysis of control rod fluence respectively with the eigenmode and the fixed source options. The first row in Table 1 gives the STD results obtained with 300 NUSS/MCNP(X) calculations. The average achieved statistical MC uncertainty for every type of calculations is shown in the next row.
As concerns the question of “uncertainty of uncertainty”, i.e., the statistical uncertainty of the STD values from Table 1, it can be assessed, for instance, using an approximation valid for standard error (SE) of standard deviation assuming normality of underlying population [72]:
S E ( S T D ) S T D 2 ( N 1 )
where N is the sample size. For the sample size 300 the relative SE of the STD becomes roughly about ~4.1%.
In principle it would be possible to expand Table 1 with two additional rows on the C/E-1 values and on the results of the alternative deterministic evaluations. However, the amount of presently available and fully consistent results is not yet sufficient for such extended comparison. The reasons are that at first, for simplicity and uniformity, Table 1 concerns the neutron flux calculations, while in case of dosimetry the C/E values are provided for different dosimeters specific activity measurements. The activity calculations depend on the particular dosimetry reaction rates, depending in turn on the neutron cross-sections and thus different dosimeters have different uncertainties due to the neutron flux uncertainties through the different dependencies of the reaction cross-sections (which are uncertain themselves) on the incident neutron energy. As such, the activity results are strongly dependent on the dosimetry reactions cross-sections’ source of origin (the dosimetry reactions may be found in different general purpose and in dedicated dosimetry libraries). Thus, detailed analysis of the C/E values obtained in the dosimetry validation studies goes far beyond its relevance for the given paper.
It can be noted that typically the C/E-1 values observed from the relevant validation studies in the dosimetry domain fall within ~±20% (see e.g., [62,67,68]) and this level of accuracy is considered normally as acceptable [1,60]. In more details, only a rather general and approximate assessment could be given here for demonstration purpose, based e.g., on the results published in [62,68]: for the 93Nb fluence monitor the average (C/E-1) values obtained with the PWR-GP, PWR-ST and BWR-D validation models (with ENDF/B-VII.0 in [62] and ENDF/B-VII.1 in [68] as the base ND and CM library) were respectively ~5%, ~5% and ~18%. For the same models and the 54Fe fluence monitors the (C/E-1) values were ~−1%, ~3% and ~9%. It should be noted that the given values are still preliminary since some improvements of the calculation models and the methodology are still on-going at PSI [73]. As it is seen from Table 1, the ND related uncertainties can have a significant contribution to the overall uncertainty of the calculations.
Furthermore, for some of the considered models the uncertainty results were already obtained with the help of the “sandwich rule” [21] matrix equation and based on MCNP(X) calculations with activated Differential Operator Sampling option [12] for the sensitivity coefficients derivation. However, in those previous calculations, slightly different calculation targets or different sources of ND and CM might be used, not allowing thus strict and direct comparison with the results given in Table 1 without repeating the past calculations. For instance, a simplified version of the given here model PWR-CRs was used in [64] for analysis of different neutron flux responses around the control rods. The uncertainty of the fast neutron flux in the control rod tip volume was estimated as slightly below 5%, which is not far from the value of 4% given here in Table 1 for the CR absorber materials. Actually, the sandwich rule operation and the stochastic sampling typically provide very close results for nuclear data uncertainty propagations in both criticality and dosimetry applications [37,39,40,47,48,49,64,74,75].
Nevertheless, it can be mentioned that in certain criticality calculations noticeable differences were observed between the nominal values of the calculation outputs obtained with nominal nuclear data libraries versus the sample mean values, obtained with randomly sampled libraries together with the sample skewness different from zero [38]. Similar observations are now under analysis for the dosimetry calculations. Such situations would notify on existence of second-order effects which may become important to be taken into account in deterministic assessments. However, the question of the results “convergence” in NUSS/MCNP(X) calculations also requires further investigations.

4.2. Observations and Trends Analysis

A few additional comments can be made to assess the results shown in Table 1. At first, the comparison of the cases PWR-CRs and PWR-CRk enables to quantify the influence of the fission neutrons generation process on the total resulting uncertainty of the fast neutron flux, noting that this effect is missed in the fixed-source case PWR-CRs. As it could be expected, the total uncertainty in the case PWR-CRk is higher (by about 1.3%), which thus shows the underestimation of overall modeling uncertainty related to ND with the fixed source model. A similar comparison of models PWR-CRs-t and PWR-CRk-t quantifies the uncertainty effect for the thermal neutron flux as 0.9%, however in this case the statistical uncertainty of MC calculations (see Table 1) is too high to make meaningful assessments. Nevertheless, the situation that in total the uncertainty of the fast flux is higher compared to the thermal flux is in line with previous findings [64].
A second observation is that the uncertainty is progressively growing from one case to another for the set PWR-CRs, PWR-GP, PWR-ST and BWR-D. It can be realized that for these models the location of the calculation response is moving from the inside the core position in the case PWR-CRs to the ex-core position close to the core barrel and finally to the reactor pressure vessel (RPV, see Figure 1) locations, noting that the BWR reactor is significantly larger in size compared to the PWR. The growing distance between the core and the calculation response location implies an increase of the thickness of the medium (water) between the neutron source and the response. Thus it is expected that the total uncertainty is also increasing from one model to another.
Finally, it is known from past studies that the isotope 1H is usually one of the major contributors to the uncertainty in the fast neutron flux calculations. As it was mentioned above, for the model analyzed in [64], which was very similar to the case PWR-CRs, the 1H related uncertainty was about ~1%, while the total uncertainty was about 4%–5% if compared with the same responses as considered here (note that the uncertainties shall be summed up as variances). The principle contributor for the in-core neutron transport was however the 238U inelastic scattering cross-section. Next, for the case PWR-GP, the impact of 1H was found about 2.5%, which gives approximately 12% to the total uncertainty for the fast flux, which was tentatively assessed about 5.5%. The major contributor was still the 238U inelastic scattering cross-section. Now, for the given study it was interesting to see the value of the 1H contribution for the case BWR-D, since it has the highest uncertainty together with the highest thickness of the water zones between the neutron source and the response location. To assess the effect of 1H impact, the NUSS/MCNP(X) calculations were repeated with perturbation of only the 1H cross-sections (200 sample calculations were done this time). The resulting sample standard deviation for the fast flux outputs was about ~13%. Therefore for the BWR dosimetry and from the point of view of only the neutron transport (without neutron source uncertainties considerations), the contribution of the single isotope 1H is dominant for the total uncertainty. This can be explained by the fact that 1H is a very strong moderator of neutrons and changing its elastic scattering cross-section significantly affect how many neutrons will be slowed down below the energy cut-off for the fast neutron flux of 1 MeV (note that the uncertainties on angular distributions are not considered yet).

5. Further Profits from the Stochastic Sampling Results

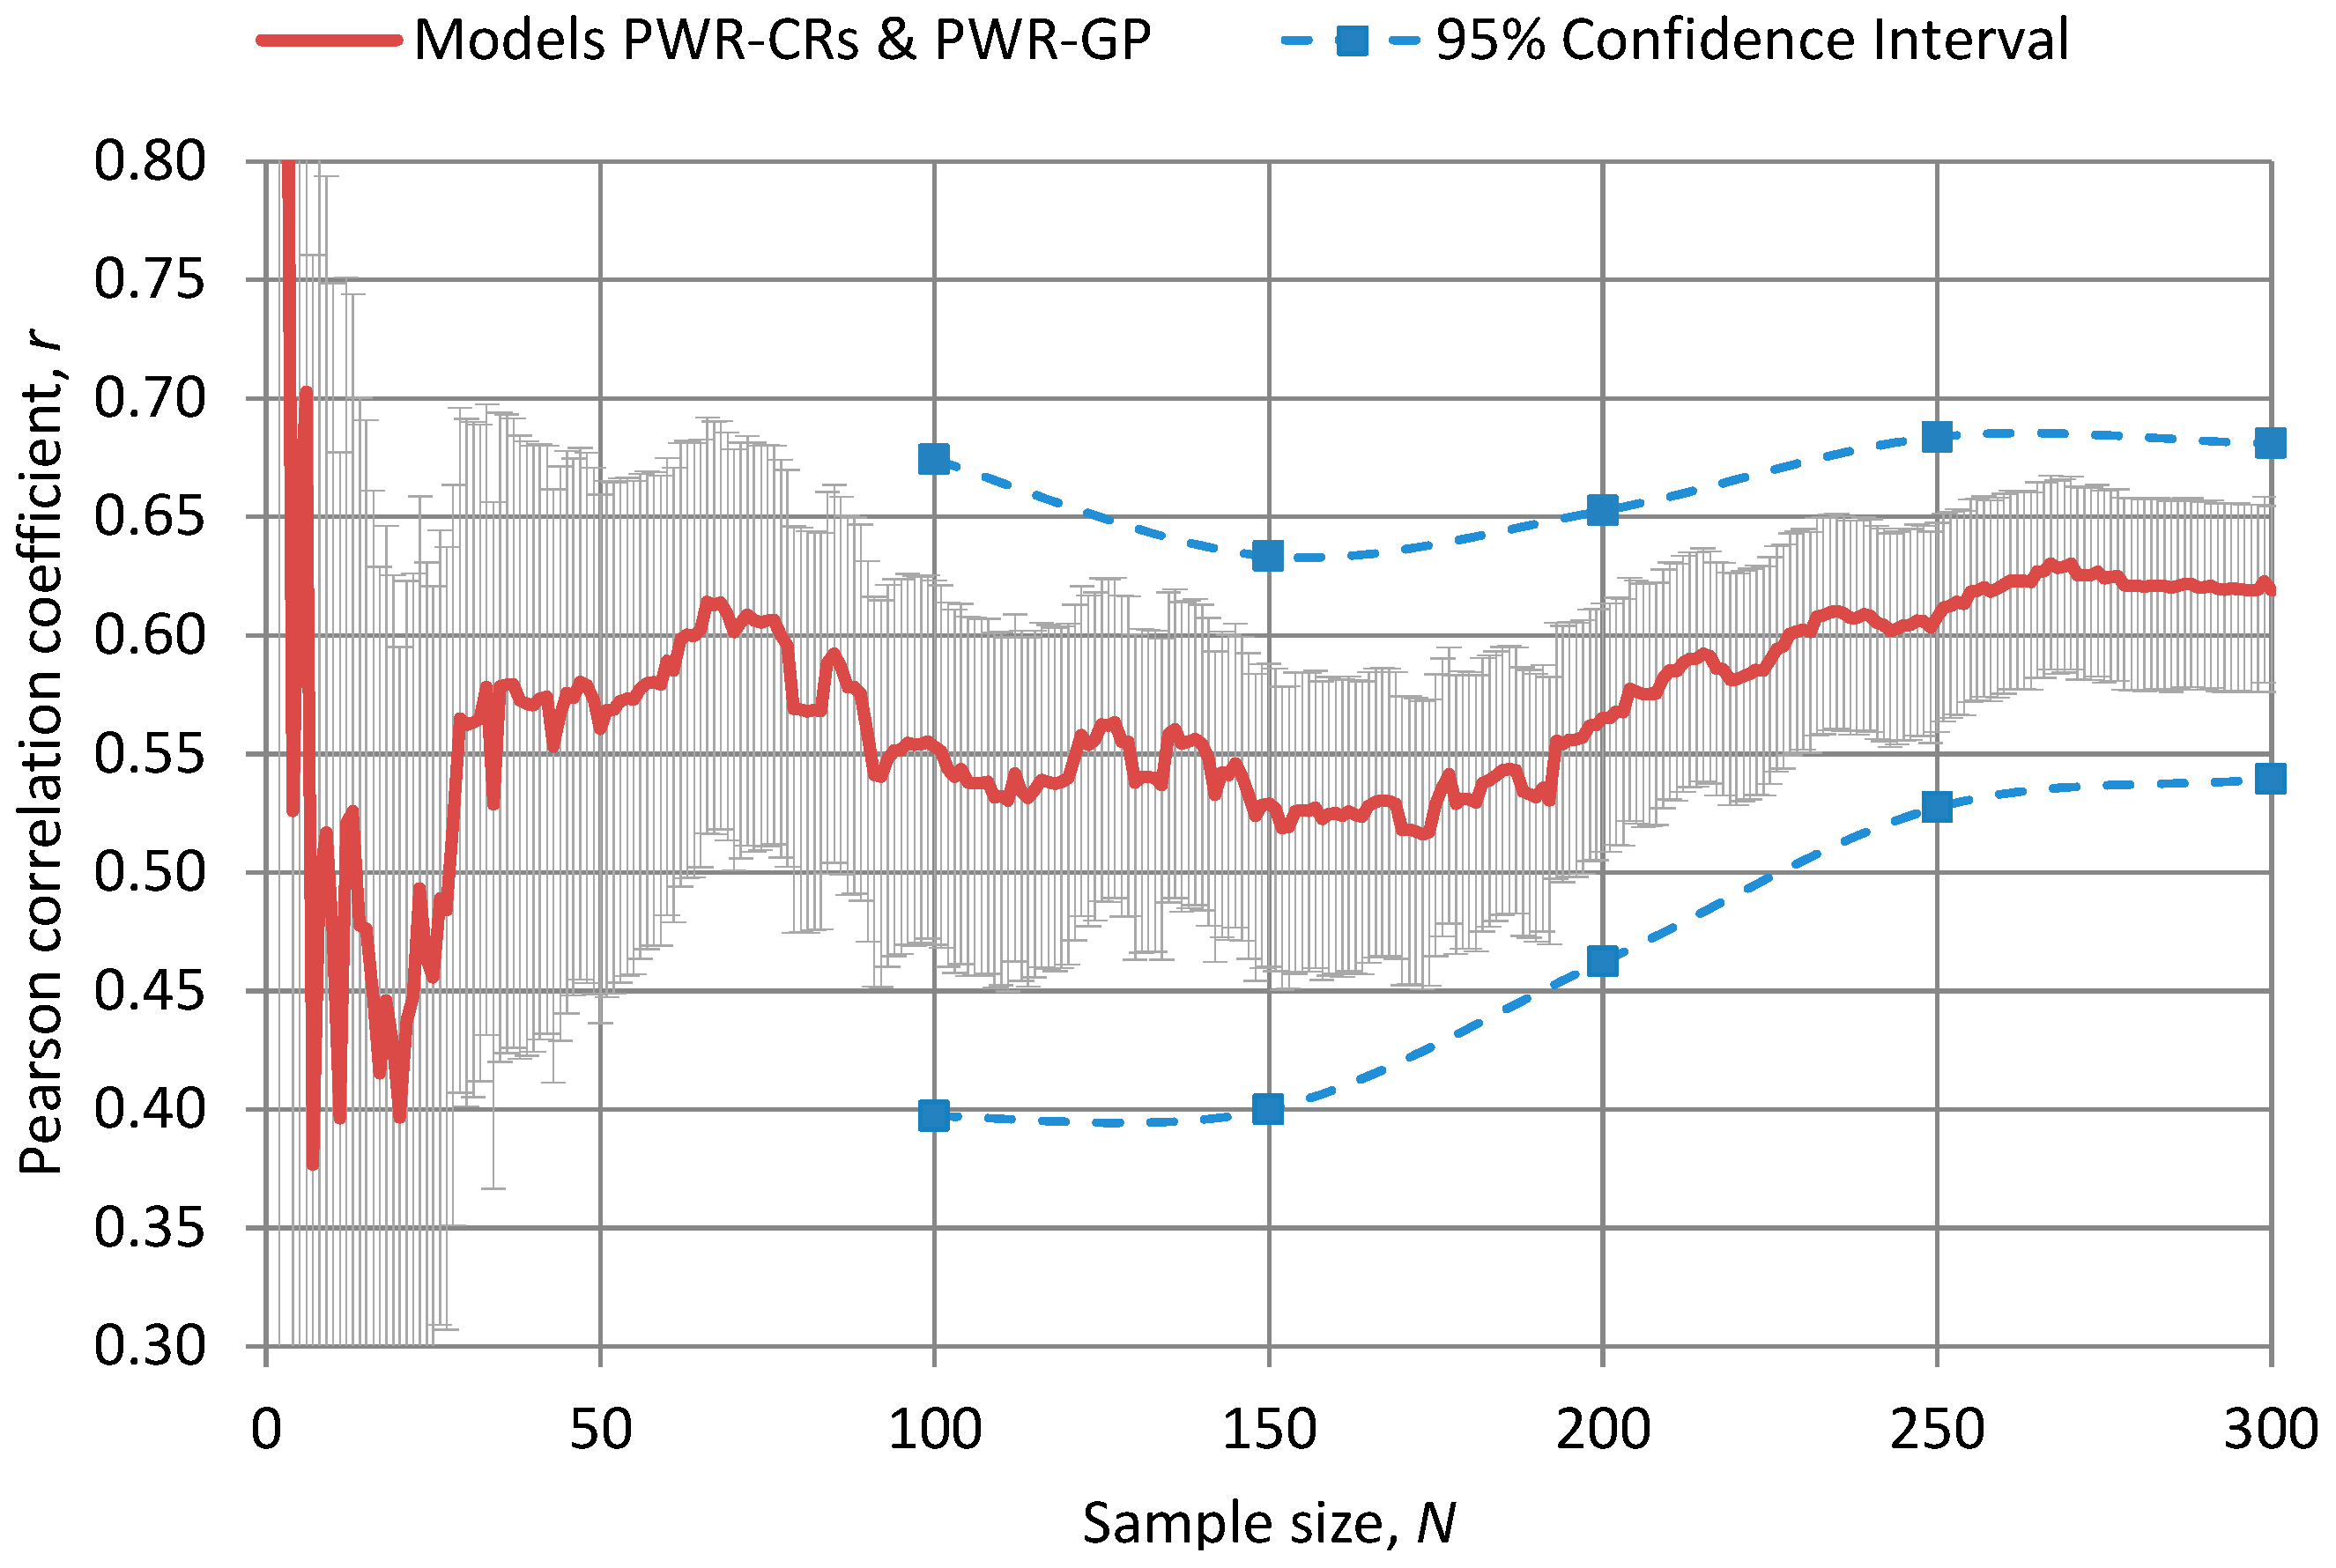
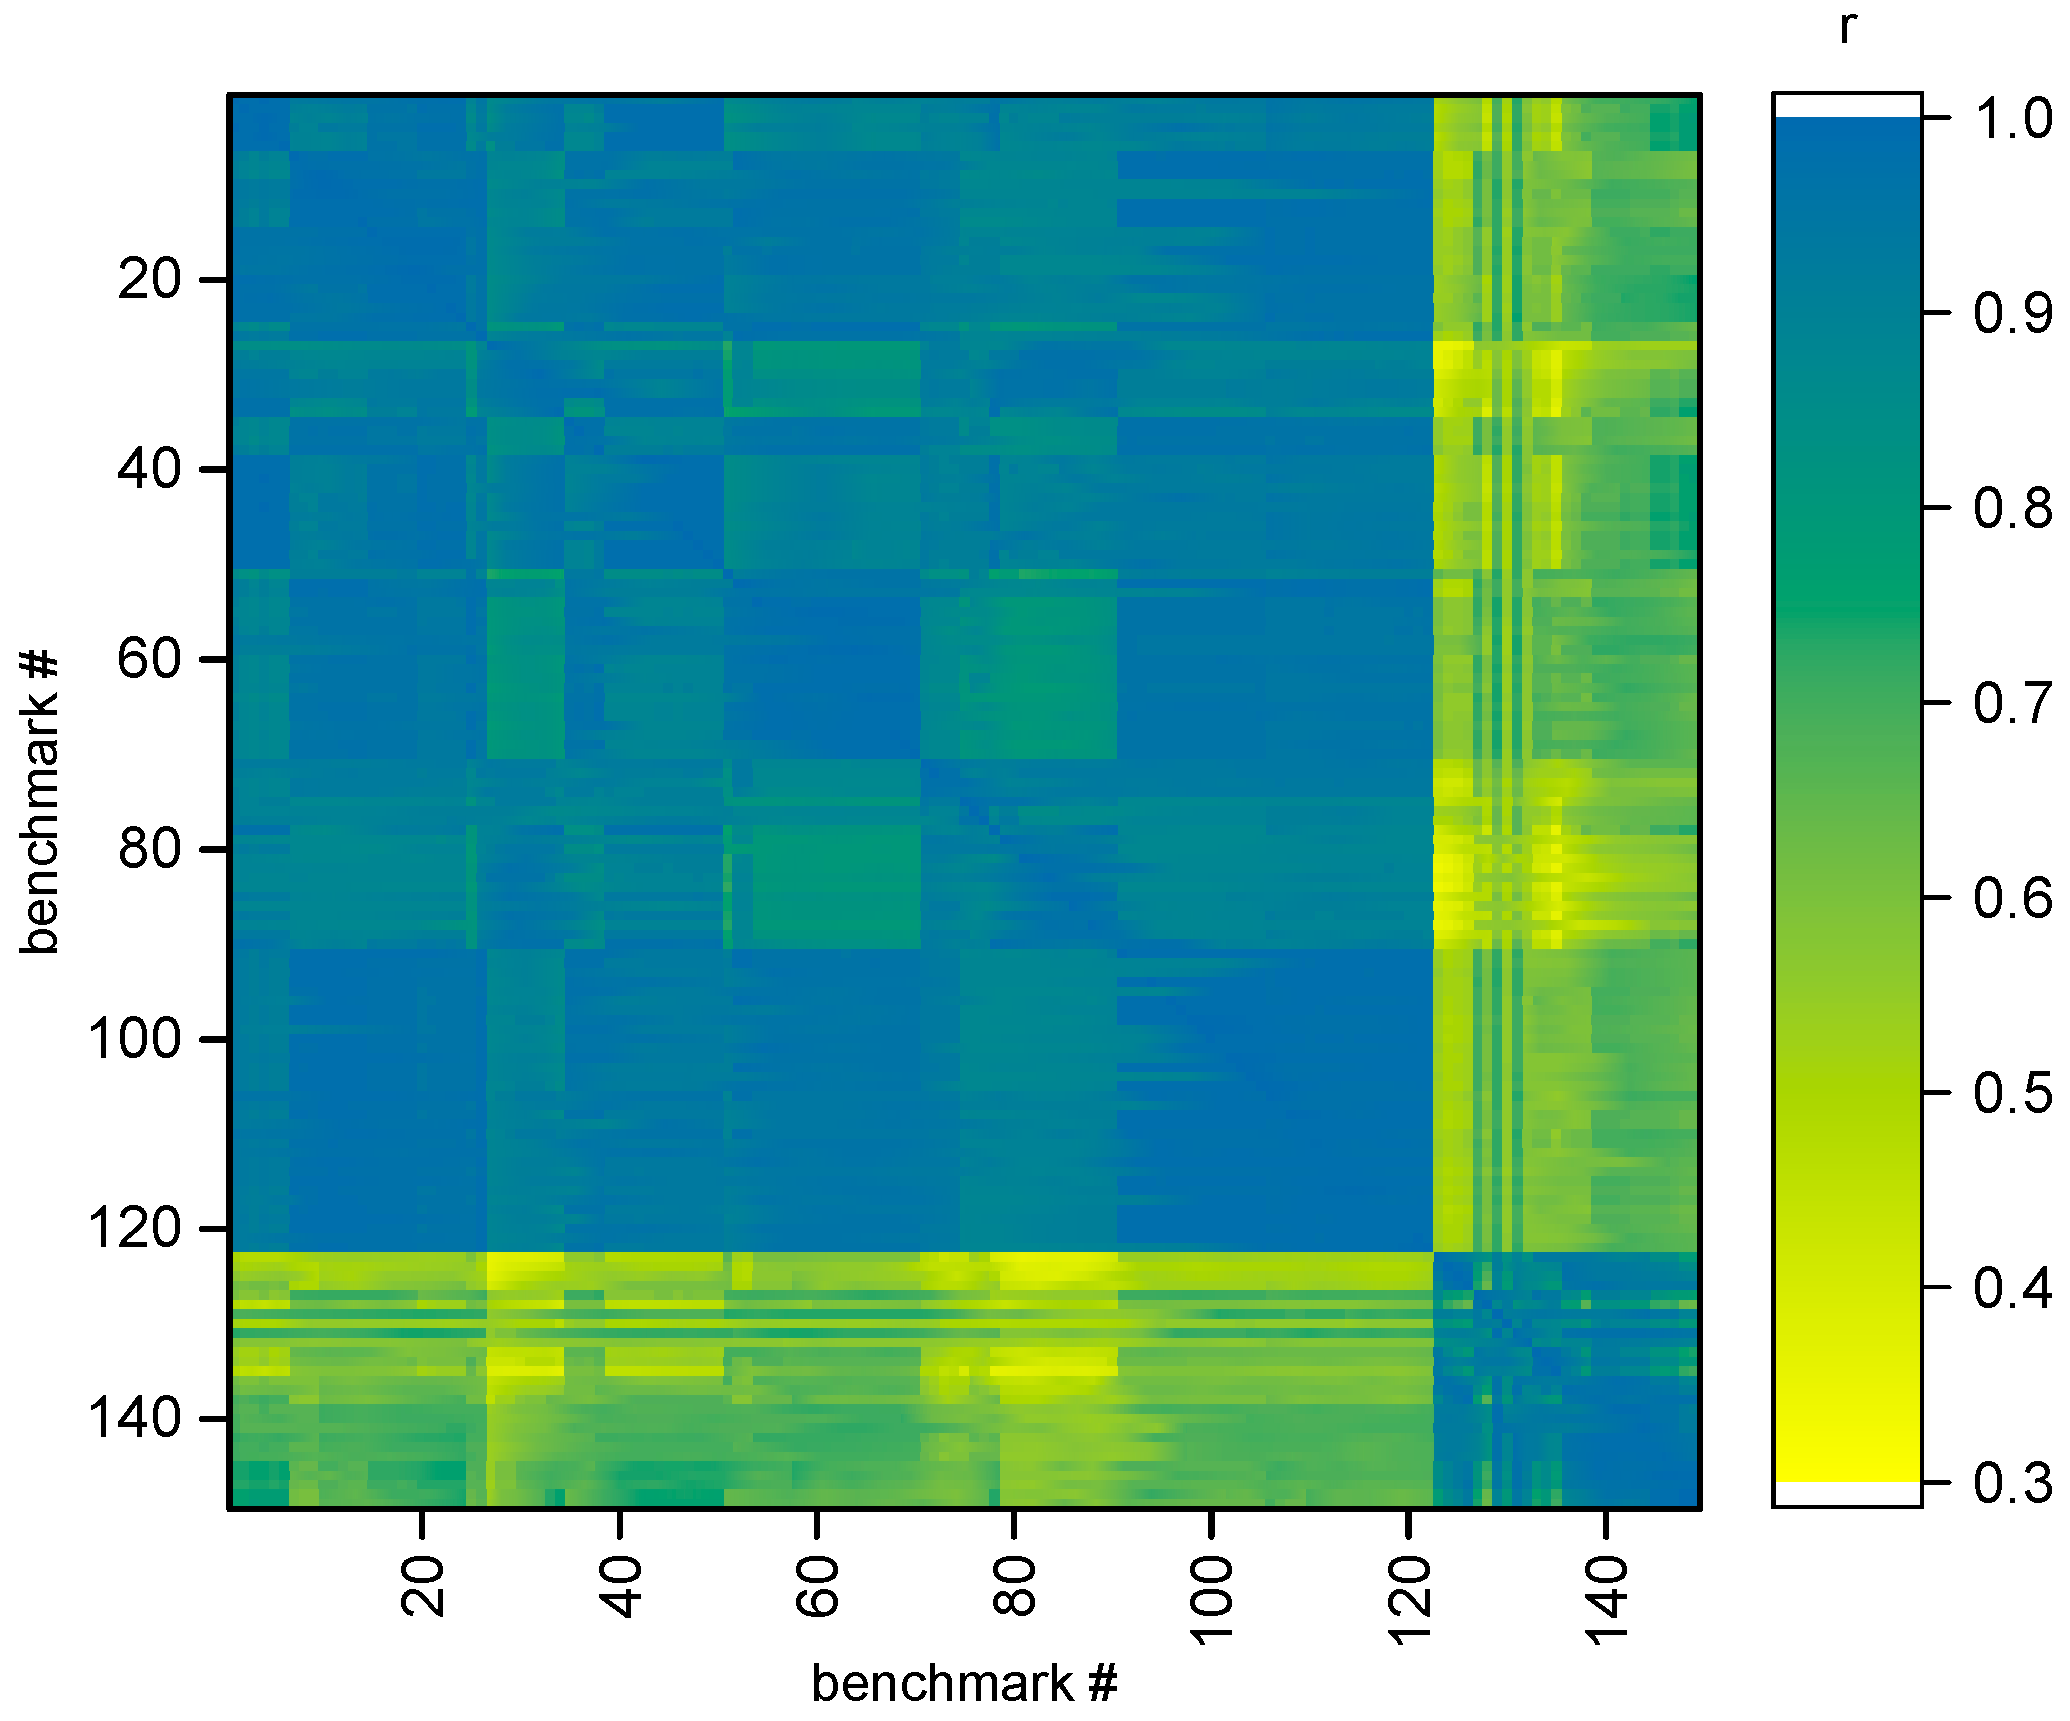
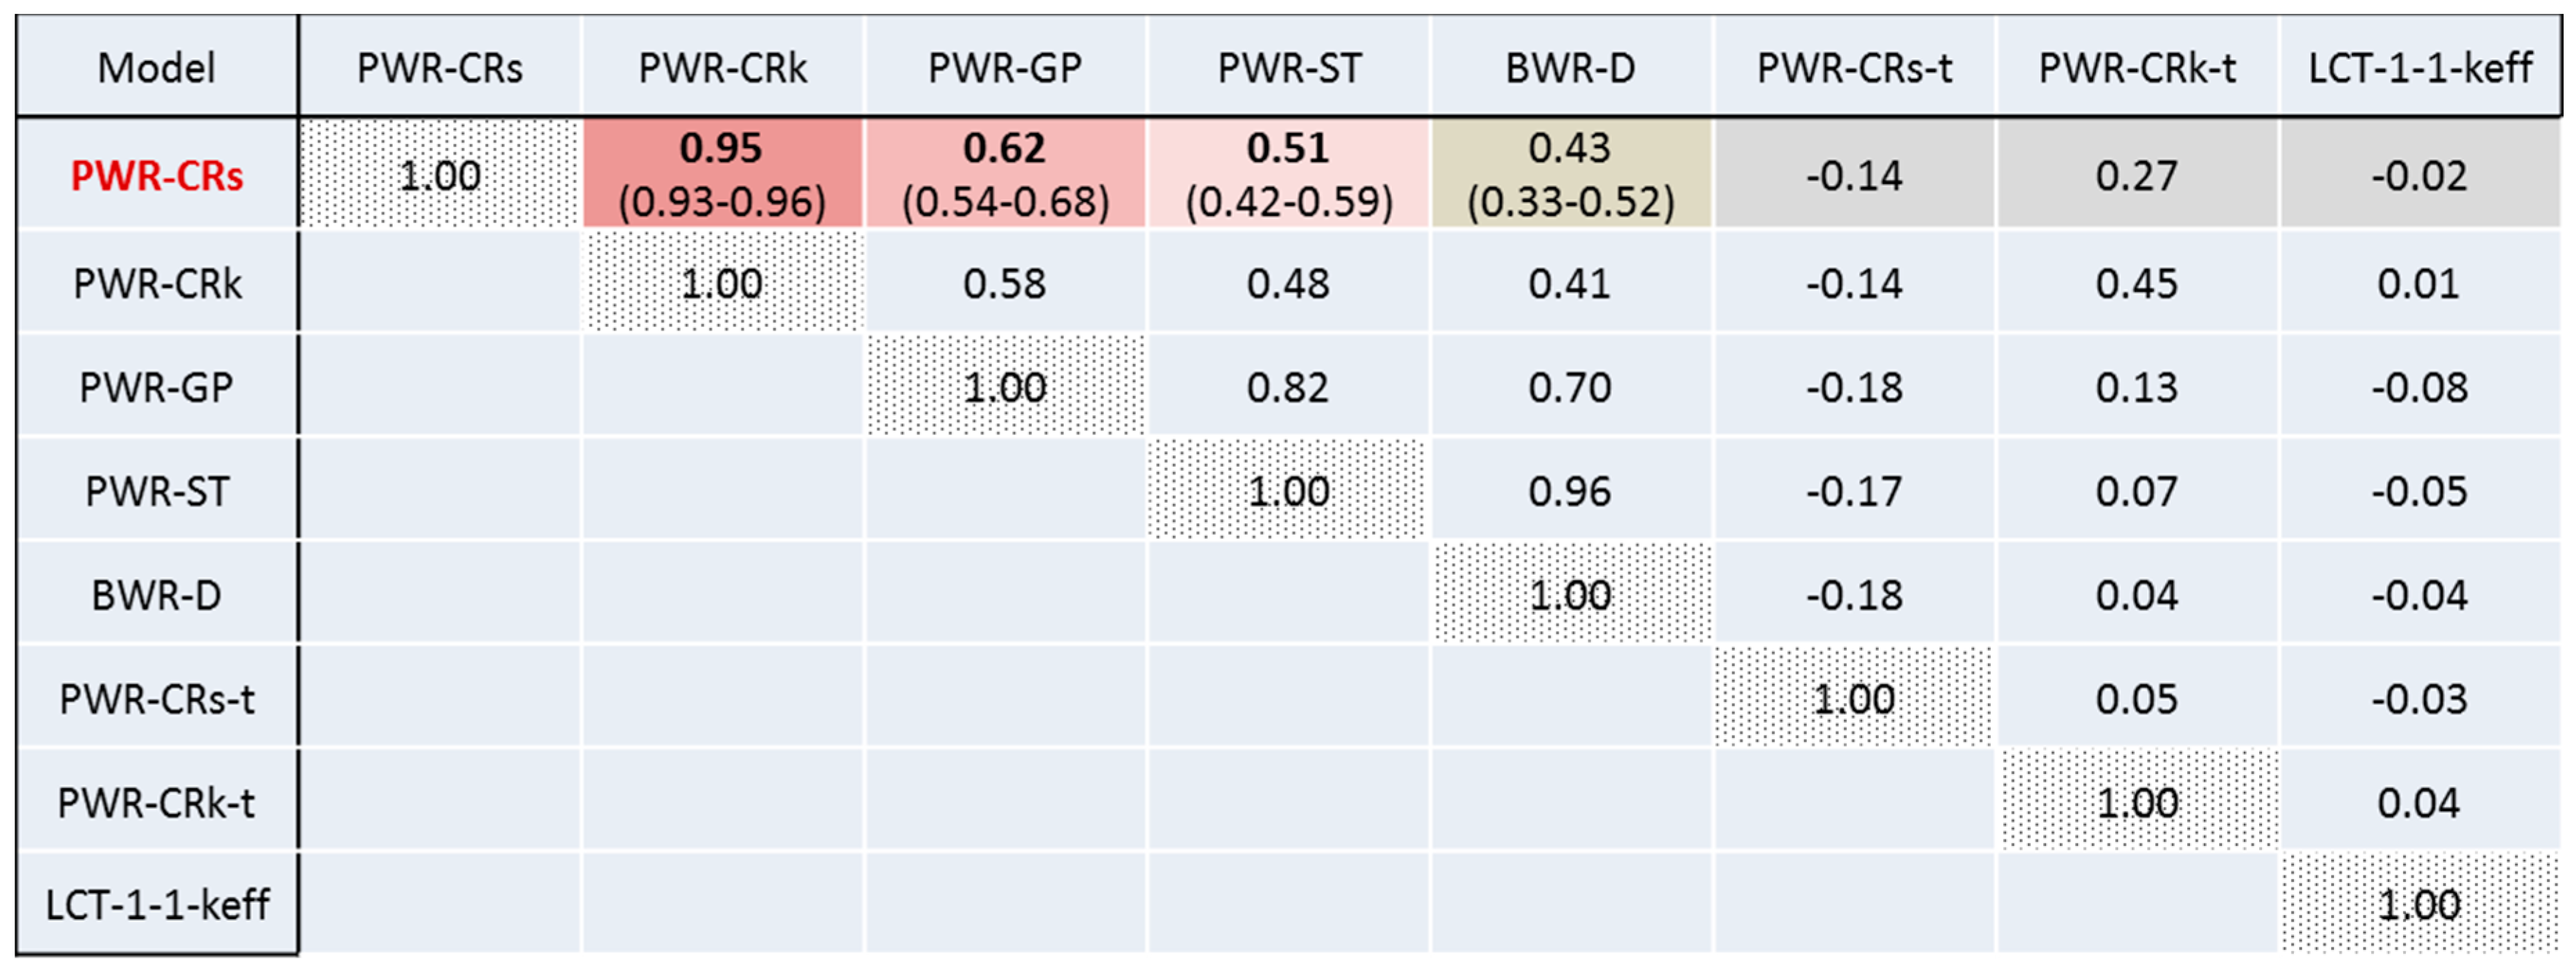
5.1. Evaluation and Preliminary Assessment of Correlations

As was outlined in the introduction, in the case of the criticality studies for configurations with fissile materials, the way to assess systems similarity is in particular to check whether the systems react in a correlated manner by the keff response to the perturbations of the input parameters, viz. nuclear data. Such analysis can be efficiently performed using the deterministic approaches (see e.g., [29]). However, in the case of consideration of arbitrary system responses, the way of computing the sensitivity coefficients in a production manner still needs further developments [15]. Alternatively, when, for instance, nuclear data stochastic sampling is performed with a tool like NUSS, it is straight forward to assess the Pearson correlation coefficient, r, for a pair of calculation sets, e.g., with different models and/or outputs [47,48,50,51,75] (note also that r2 is equivalent to the “coefficient of determination” [76], which can be used to assess linear relation between the output and input values, as demonstrated in [31,75], but here the discussion is limited to only different systems output correlations in which case r2 can be used to assess the proportion of variance in common between two outputs [76]; actually the NUSS tool has been further extended to the version NUSS-RF (where -RF stands for “Random balance design and Fourier amplitude sensitivity testing”) to allow performance of Global Sensitivity Analysis, which concerns the first order global sensitivity indices instead of the local (one at a time) linear sensitivity coefficients [21,46,48,49], but for the context of the given paper we limit the discussion by using only the regular NUSS tool.
The capability to evaluate the correlation coefficients using NUSS is demonstrated below at first for the case of criticality benchmark calculations. Details of the criticality validation benchmark suite, the criticality safety methodology and its validation concept can be seen in [6,77]. Here it should be only revealed that the validation database consists of two distinct types of the experimental systems—with uranium dioxide UO2 (“Low-enriched uranium Compound Thermal systems”—LCT cases category in [3]) and with mixed oxide (MOX, contains plutonium fraction) fuels (MOX cases correspond to “Mixed plutonium-uranium Compound Thermal systems”—MCT category in [3]). Presence of these two types of fuels in the validation suite is stipulated by the fact of use of both of them in Swiss reactors during their exploitation history. Figure 2 shows the complete correlation matrix obtained after 300 sample calculations for all the 149 benchmarks from the PSI validation suite. For clarity, the first 122 sequential benchmarks correspond to the LCT category and the next benchmarks from number 123 to 149 correspond respectively to the MCT category.
As concerns the statistical uncertainty of the r values reported in Figure 2, they can be assessed using an approximate formula for standard error of the correlation coefficient applicable for large samples (N > 100):
S E ( r ) 1 r 2 N 2  
For example, at sample size equals 300 and r = 0.3, the SE of r, SE(r) ≈ 5.3%; for r = 0.9, SE(r) ≈ 1.1%.
It shall be commented here that the generation and analysis of the covariance data for integral experiments, i.e., for criticality benchmarks from [3], is an objective of the ongoing benchmark exercise Phase IV of the OECD Nuclear Energy Agency (NEA)/Nuclear Science Committee (NSC)/Working Party on Nuclear Criticality Safety (WPNCS)/Expert Group on Uncertainty Analysis for Criticality Safety Assessment (UACSA) [78]. The main focus of the benchmark Phase IV is the analysis of correlations of critical experiments due to uncertainties of system technological parameters (materials/dimensions). An interesting observation on the impact of the MC uncertainties of keff values obtained for individual benchmarks on the resulting values of the benchmarks’ correlation coefficients was reported recently [79]. It indicates the need for further verification of the currently obtained results on the ND-related benchmark correlations, with respect to the MCNP(X) statistical uncertainty. It is also worth noting that in work [80] the correlations due to nuclear data uncertainties were analyzed as well for the set of benchmarks from the UACSA Phase-IV exercise, with the help of SCALE/TSUNAMI calculation sequences. For the verification purpose, NUSS methodology with the ENDF/B-VII.1 library has been also recently applied for such study [81] and preliminary results were found in a very reasonable agreement with those reported in work [80], noting that in the latter the ENDF/B-VII.0 library was used. That preliminary comparison can be seen as an additional justification of the NUSS workability for similarity assessments.
Concerning Figure 2, it is noticeable that the obtained matrix shows very strong correlations between the intrinsically similar systems, while correlations between the different fuel-type systems are weaker. This observation meets physics based expectations and serves as another indirect verification of the NUSS calculation outcomes.
Returning to the problem that no explicitly dedicated experimental data is yet available for the above mentioned CR FNF calculations, the question of interest is—can one identify appropriateness of available experiments originally performed for other types of response parameters/systems, for validation of CR FNF predictions, at least as concerns the ND effects? Indeed, regarding the ND effects, we consider that it should be possible to do with the help of the NUSS-based approach. The related results obtained for the set of models/response parameters, as defined in Table 1 are demonstrated in Figure 3 and Figure 4, presenting an example of behavior of the Pearson coefficients for selected model calculations as function of the sample size (Figure 3) and the matrix of the Pearson correlation coefficients (Figure 4).
In addition to the correlation coefficient, Figure 3 shows the statistical uncertainly calculated with Equation (1) and also the 95% confidence interval as a function of sample size, computed as suggested in [76]. It is evident from the provided results that the presently achieved statistical uncertainties of r values are rather high, however, for the context of the given illustrative study the sample size of 300 is assumed sufficient.
As concerns the results given on Figure 4, for the most important cases the 95% confidence intervals of the correlation coefficients are included in the parentheses (note that they are not symmetric around r [76]). For completeness, the statistical significance of the correlation coefficients has been assessed using Student’s t-test [76]. The results indicate that all correlation coefficients in Figure 4 which absolute values exceed 0.1 are statistically significant at 95% (two-sided) confidence level.

5.2. Results Examination and Verification

A few comments about Figure 4 shall be made. The cases PWR-CRs-t and PWR-CRk-t correspond to the results of the thermal neutron flux, which is not of primary interest in the context of the major study on the assessment of the fast neutron flux. However, it is useful to check the thermal flux results in order to assess the qualitative behavior of the correlation coefficients, as compared to the base case of the fast fluxes. Next, the case LCT-01-01-keff is completely outstanding here and it is included just on the purpose to verify, if the correlations between the outcomes of interest (fast flux) and an outcome which is by definition not expected to be correlated with the major outcomes of interest will be indeed found weak, as it should be. This exercise can serve as a “stress-test” for the computation procedures employed here on the basis of the NUSS tool. Finally, even if a better statistical precision of MC calculations and larger sample sizes are needed for more confident statements, there is an indication that the correlations between the cases PWR-CRs and the cases PWR-GP, PWR-ST and BWR-D are systematically higher than the correlations of the same cases and PWR-CRk model. This also looks logical since all the cases except PWR-CRk correspond to the fixed source option and thus shall demonstrate higher correlations compared to the eigenmode case PWR-CRk.
Concerning the assessment of the Pearson correlation coefficients with respect to their amplitude, there is obviously no universal “rule of thumb” which is valid for any field. For instance, the interpretation that |r| = 0.3, |r| = 0.5 and |r| = 0.7 are respectively weak, moderate and strong correlations can be found in [82]. In the case of validation studies in the field of criticality benchmarks, usually positive values above 0.8 are considered [4]. However, it can be noticed that when the Bayesian updating procedure is applied for adjustment of the calculation predictions based on the performed validation studies [52], the strength of the correlations between an application case and the validation benchmarks defines how much the validation results will contribute to the posterior estimations. Thus, any experimental benchmark with a correlation with the application case noticeably above zero is useful in such case. Although, it is clear that the higher r, the better.
Now, the following conclusions can be made from the analysis of Figure 4. The correlation between the cases PWR-CRs and PWR-CRk is very strong, as it should be expected, since the results are obtained for the same responses and reactor models, though with principally different neutron source options (see [65] for details). It is remarkable that on the contrary there is no correlation between the cases PWR-CRs-t and PWR-CRk-t (note also that the results on the thermal fluxes are less precise in terms of the achieved MCNP(X) uncertainties in individual sample calculations, as reported in Table 1). This phenomenon can be explained by the fundamental difference between the fixed source and the eigenmode simulation options. Note that fissions in LWR are mostly caused by thermal neutrons. For instance, for the considered PWR model the fraction of fissions caused by the thermal energy group neutrons is about 75%, according to the MCNP(X) results. Thus, the fission source distribution is highly determined by the thermal neutrons spatial-energy distribution in the reactor core, which in turns determines the fission and fast neutron distributions. Due to this feedback, there must be a significant correlation between all energy groups of the neutron fluxes in the eigenmode calculations. Note that the responses under analysis here are the spatially and energy localized neutron fluxes at the control rods. The neutron cross-sections themselves have no spatial dependency, but they affect the neutron flux shapes and the fission source distribution. Thus, the value given in Figure 4 for the cases PWR-CRk and PWR-CRk –t is noticeable, 0.45. On the contrary, in the fixed-source calculations, the neutron source is fully independent from the neutron flux in the simulation process, as was outlined in Section 2 and is not changing with the neutron cross-section perturbations. Therefore, there shall not be high correlations between the fast flux (highly defined by the fixed neutron source), and with the thermal flux. The value shown in Figure 4 for the cases PWR-CRs and PWR-CRs-t is actually −0.14, which is a weak anti-correlation (decrease of the fast neutron flux is slightly associated with increase of thermal flux, which can be probably explained by the neutron scattering slowing down effects, though such low value of correlation shall be treated with caution). At these conditions it is not surprising that the correlation between the thermal fluxes in the eigenmode and fixed source model is almost absent; see the value 0.05 in Figure 4 for the cases PWR-CRs-t and PWR-CRk-t. Finally, coming back to the strong fast flux correlation, it looks logical since even if the fission sources in the two models are different, the fast neutron fluxes shall react very similar to the cross-section perturbations because basically the fission neutrons have the same spectra in both models, (corresponding to the fissioning isotopes’ fission neutron spectra). Also confirming logical expectations, the correlation coefficients between the flux results in all listed cases and the LCT-1-1 keff results are weak, while the correlations among BWR-D, PWR-ST and PWR-GP are strong.
After the provided examination and justification of the obtained results, it is very important to notice now that the correlations between the cases PWR-CRs and PWR-GP, PWR-ST and even BWR-D are rather high, showing that the listed dosimetry experiments are appropriate for indirect validation of the PWR-CRs case of interest.

6. Discussion

Several recommendations can be done here concerning the priorities for future works. First of all, further enhancements of the NUSS(-RF) tool can be proposed, namely—including the angular distributions sampling at the neutron scattering reaction simulations, which would be especially important for dosimetry and shielding applications. Next, an analysis of the impact of the MC uncertainties on the results of the ND-related uncertainties and the output parameters correlations should be performed, as was outlined in Section 5.1.
An exact recipe of how to further use the obtained correlation coefficients goes beyond the scope of the given paper (see for example [52] for illustrations). It should be however mentioned that conventionally the validation C/E results are the subject of statistical evaluations, which allow quantifying the calculation methodology accuracy with certain confidence (e.g., by deriving the average C/E bias, its uncertainty and/or bounding C/E tolerance value [83]). It is also known that the existence of correlations between benchmark models involved in the methodology validation process (even if originated from the common sensitivities to nuclear data) should be taken into account to prevent errors in estimation of the calculation bias [84], and such use of the correlation coefficients is also foreseen at PSI [54]. If a weighting procedure is applied to the C/E values processing (e.g., to derive a weighted sample mean and variance), it should also take into account the experimental uncertainties CM as the weight components.
Note, however, that in future studies the influence of other than ND effects may also be considered. For instance the contribution of the system design/technological (material compositions and dimensions) uncertainties and their correlations can be included in the overall MC sampling procedure and related statistical analysis of the results, similarly to the ways discussed in [52] and using PSI in-house tool for manufacturing and technological parameters uncertainty quantification (MTUQ) developed recently for such purposes and for application with MC neutron transport codes [85].

7. Materials and Methods

This study was based on the analysis of Swiss reactor models, which cannot be made publicly available, as well as the employed MCNP code [13]. No other materials, data and tools used and obtained in the frame of the given study and/or associated with the given publication can be made available to readers without explicit agreement with the Paul Scherrer Institute (5232 Villigen PSI, Switzerland).

8. Conclusions

In the given paper an application of the ND stochastic sampling approach to a number of reactor physics calculations is demonstrated with the help of the NUSS tool [47]. The obtained results justify that the correlation analysis associated with the stochastic sampling can bring useful information in the sense of applicability of different experimental data for verification and validation of a particular calculation target with pre-defined calculation methodology, including related uncertainties quantifications. One can say that the ND-related correlation analysis has demonstrated its applicability for test examinations of the calculation methodologies and models, including those for uncertainties quantifications. Indeed, while the methods and options for the ND-related uncertainty evaluations have been already sufficiently well established, the question of verification of such uncertainty quantification methodologies is in many instances still open. The approach described in this paper is supposed to contribute to the solution of the posed question; and actually, one could notice that the test calculations shown in the paper have confirmed that the statistically obtained results are fully in line with the expectations one should have based on the physics point of view. Unless this had happened, one would have put the correctness of the applied methods and developed models under question. Therefore, another potential outcome of the presented study is an indirect justification of the calculated results obtained for the parameters which have no fully analogous experimental data for direct validation.
It should be recalled that the concept of using similarity measures between an application case and validation benchmarks is already well developed and integrated, e.g., in the field of criticality safety, see for instance [5,8,28]. Now, the use of stochastic sampling based on the application of the NUSS tool has been demonstrated in relation to dosimetry problems. Assessing the obtained results, it is possible to conclude (at least with respect to nuclear data effects) that the validation data obtained with the PWR-GP, PWR-ST and BWR-D models should be useful for the quantification and adjustment of the calculation uncertainties for the PWR CR FNF calculations with the PSI CASMO/SIMULATE/MCNP(X)-based methodology [67]. This is valuable information for practical use. Overall, the proposed approach goes in line with the modern trend in the nuclear safety to always provide when possible a best estimate plus uncertainty analysis assessments (BEPU), in addition to the more traditional “conservative estimations”. In general, the BEPU approach is important to ensure that commonly employed in practice different conservative assumptions really lead to most penalizing assessments at all situations and types of the safety analysis.

Acknowledgments

Authors acknowledge Martin Zimmermann, Rakesh Chawla and Andreas Pautz for their valuable scientific guidance and organizational support provided during the stages of the employed calculation methodologies development at the Laboratory for Reactor Physics and Systems Behaviour/Nuclear Energy and Safety Research Division of the Paul Scherrer Institute.

Author Contributions

The study was designed by the team of the authors. The calculations were done by Dimitri Rochman. Alexander Vasiliev processed the data and prepared the paper. All co-authors contributed to the development of the applied PSI calculation methodologies, models and processing scripts, analysis of the results and the paper edition.

Conflicts of Interest

The authors declare no conflict of interest.

References

  1. Calculational and Dosimetry Methods for Determining Pressure Vessel Neutron Fluence; Regulatory Guide 1.190; U.S. Nuclear Regulatory Commission (US NRC): Washington, DC, USA, 2001.
  2. Validation of Neutron Transport Methods for Nuclear Criticality Safety Calculations; ANSI/ANS-8.24-2007; American Nuclear Society (ANS): La Grange Park, IL, USA, 2007.
  3. Reprot NEA/NSC/DOC(95)03. In International Handbook of Evaluated Criticality Safety Benchmark Experiments; The Organization for Economic Co-operation and Development/Nuclear Energy Agency (OECD/NEA): Paris, France, 2012.
  4. Broadhead, B.L.; Rearden, B.T.; Hopper, C.M.; Wagschal, J.J.; Parks, C.V. Sensitivity-and uncertainty-based criticality safety validation techniques. Nucl. Sci. Eng. 2004, 146, 340–366. [Google Scholar] [CrossRef]
  5. Ivanova, T.; McKnight, R.; Mennerdahl, D.; Neuber, J.C.; Rearden, B.; Santamarina, A.; Vasiliev, A. Overview of Approaches Used to Determine Calculational Bias in Criticality Safety Assessment; NEA/NSC/WPNCS/DOC(2013)7; Organization for Economic Co-operation and Development/Nuclear Energy Agency (OECD/NEA): Boulogne-Billancourt, France, 2013. [Google Scholar]
  6. Vasiliev, A.; Kolbe, E.; Zimmermann, M.A. Towards the development of upper subcriticality limits on the basis of benchmark criticality calculations. Ann. Nucl. Energy 2008, 35, 1831–1841. [Google Scholar] [CrossRef]
  7. Rearden, B.T.; Mueller, D.E. Uncertainty quantification techniques of SCALE/TSUNAMI. Trans. Am. Nucl. Soc. 2011, 104, 371. [Google Scholar]
  8. Rearden, B.T.; Williams, M.L.; Jessee, M.A.; Mueller, D.E.; Wiarda, D.A. Sensitivity and uncertainty analysis capabilities and data in SCALE. Nucl. Technol. 2011, 17, 236–288. [Google Scholar] [CrossRef]
  9. Rearden, B.T. Perturbation Theory Eigenvalue Sensitivity Analysis with Monte Carlo Techniques. Nucl. Sci. Eng. 2004, 146, 367–382. [Google Scholar] [CrossRef]
  10. Perfetti, C.M.; Rearden, B.T.; Martin, W.R. SCALE continuous-energy eigenvalue sensitivity coefficient calculations. Nucl. Sci. Eng. 2016, 182, 332–353. [Google Scholar] [CrossRef]
  11. Kiedrowski, B.C.; Brown, F.B.; Wilson, P.P.H. Adjoint-Weighted Tallies for k-Eigenvalue Calculations with Continuous-Energy Monte Carlo. Nucl. Sci. Eng. 2011, 168, 226–241. [Google Scholar] [CrossRef]
  12. Pelowitz, D.B. (Ed.) MCNPX User’s Manual; LA-CP-11-00438, Version 2; Los Alamos National Laboratory (LANL): Los Alamos, NM, USA, 2011.
  13. A General Monte Carlo N-Particle (MCNP) Transport Code. Available online: https://laws.lanl.gov/vhosts/mcnp.lanl.gov/mcnp_how_to_get_to_mcnp.shtml (accessed on 6 November 2016).
  14. Organization for Economic Co-operation and Development/Nuclear Energy Agency (OECD) Nuclear Energy Agency (NEA)/Nuclear Science Committee (NSC)/Working Party on International Nuclear Data Evaluation Co-operation (WPEC) Subgroup 33. Methods and Issues for the Combined Use of Integral Experiments and Covariance Data. Available online: https://www.oecd-nea.org/science/wpec/sg33/ (accessed on 21 September 2016).
  15. Perfetti, C.M.; Rearden, B.T. Development of a generalized perturbation theory method for uncertainty and sensitivity analysis using continuous-energy Monte Carlo methods. Nucl. Sci. Eng. 2016, 182, 354–368. [Google Scholar] [CrossRef]
  16. Ionescu-Bujor, M.; Cacuci, D.G. Comparative review of sensitivity and uncertainty analysis of large-scale systems—I: Deterministic methods. Nucl. Sci. Eng. 2004, 147, 189–203. [Google Scholar]
  17. Cacuci, D.G. Second-order adjoint sensitivity analysis methodology (2nd-ASAM) for computing exactly and efficiently first-and second-order sensitivities in large-scale linear systems: I. Computational methodology. J. Comput. Phys. 2015, 284, 687–699. [Google Scholar] [CrossRef]
  18. Gandini, A. Implicit and explicit higher order perturbation methods for nuclear reactor analysis. Nucl. Sci. Eng. 1978, 67, 347–355. [Google Scholar] [CrossRef]
  19. Wang, C.; Abdel-Khalik, H.S. Exact-to-precision generalized perturbation theory for neutron transport calculation. Nucl. Eng. Des. 2015, 651–660. [Google Scholar] [CrossRef]
  20. Cacuci, D.G. The second-order adjoint sensitivity analysis methodology for nonlinear systems—I: Theory. Nucl. Sci. Eng. 2016, 184, 16–30. [Google Scholar] [CrossRef]
  21. Cacuci, D.G.; Ionescu-Bujor, M. Sensitivity and uncertainty analysis, data assimilation, and predictive best-estimate model calibration. In Handbook of Nuclear Engineering Volume I Nuclear Engineering Fundamentals; Cacuci, D.G., Ed.; Springer: Berlin, Germany, 2010. [Google Scholar]
  22. Salvatores, M.; Palmiotti, G.; Aliberti, G.; Archier, P.; De Saint Jean, C.; Dupont, E.; Herman, M.; Ishikawa, M.; Ivanova, T.; Ivanov, E.; et al. Methods and issues for the combined use of integral experiments and covariance data: Results of a NEA international collaborative study. Nucl. Data Sheets 2014, 118, 38–71. [Google Scholar] [CrossRef]
  23. Maerker, R.E.; Broadhead, B.L.; Wagschal, J.J. Theory of a new unfolding procedure in pressurized water reactor pressure vessel dosimetry and development of an associated benchmark data base. Nucl. Sci. Eng. 1985, 91, 369–392. [Google Scholar]
  24. Broadhead, B.L.; Williams, M.L.; Wagschal, J.J. Generalized linear least-squares adjustment, revisited. J. ASTM Int. 2006, 3, 340–347. [Google Scholar] [CrossRef]
  25. Ivanova, T.T.; Nikolaev, M.N.; Raskach, K.F.; Rozhikhin, E.V.; Tsiboulia, A.M. Use of international criticality safety benchmark evaluation project data for validation of the ABBN cross-section library with the MMK-KENO Code. Nucl. Sci. Eng. 2003, 145, 247–255. [Google Scholar] [CrossRef]
  26. Cacuci, D.G.; Ionescu-Bujor, M. Best-estimate model calibration and prediction through experimental data assimilation—I: Mathematical framework. Nucl. Sci. Eng. 2010, 165, 18–44. [Google Scholar] [CrossRef]
  27. Elam, K.R.; Rearden, B.T. Use of sensitivity and uncertainty analysis to select benchmark experiments for the validation of computer codes and data. Nucl. Sci. Eng. 2003, 145, 196–212. [Google Scholar]
  28. Rearden, B.T.; Anderson, W.J.; Harms, G.A. Use of sensitivity and uncertainty analysis in the design of reactor physics and criticality benchmark experiments for advanced nuclear fuel. Nucl. Sci. Eng. 2005, 151, 133–158. [Google Scholar]
  29. Williams, M.L.; Llas, G.; Marshall, W.J.; Rearden, B.T. Applications of nuclear data covariances to criticality safety and spent fuel characterization. Nucl. Data Sheets 2014, 118, 341–345. [Google Scholar] [CrossRef]
  30. Kiedrowski, B.C.; Brown, F.B.; Conlin, J.L.; Favorite, J.A.; Kahler, A.C.; Kersting, A.R.; Parsons, K.; Walker, J.L. Whisper: Sensitivity/uncertainty-based computational methods and software for determining baseline upper subcritical limits. Nuc. Sci. Eng. 2015, 181, 17–47. [Google Scholar] [CrossRef]
  31. Zwermann, W.; Gallner, L.; Klein, M.; Pasichnyk, I.; Pautz, A.; Velkov, K. Status of XSUSA for sampling based nuclear data uncertainty and sensitivity analysis. In Proceedings of the WONDER-2012—3rd International Workshop on Nuclear Data Evaluation for Reactor Applications, Aix-en-Provence, France, 25–28 September 2012.
  32. Zwermann, W.; Aures, A.; Gallner, L.; Hannstein, V.; Krzykacz-hausmann, B.; Velkov, K.; Martinez, J.S. Nuclear data uncertainty and sensitivity analysis with XSUSA for fuel assembly depletion calculations. Nucl. Eng. Technol. 2014, 46, 343–352. [Google Scholar] [CrossRef]
  33. Williams, M.L.; Ilas, G.; Jessee, M.A.; Rearden, B.T.; Wiarda, D.; Zwermann, W.; Gallner, L.; Klein, M.; Krzykacz-Hausmann, B.; Pautz, A. A statistical sampling method for uncertainty analysis with SCALE and XSUSA. Nucl. Technol. 2012, 183, 515–526. [Google Scholar] [CrossRef]
  34. Buss, O.; Hoefer, A.; Neuber, J.C. NUDUNA—Nuclear Data Uncertainty Analysis. In Proceedings of the International Conference on Nuclear Criticality (ICNC 2011), Edinburgh, UK, 19–22 September 2011.
  35. Fiorito, L. Nuclear Data Uncertainty Propagation and Uncertainty Quantification in Nuclear Codes. Ph.D. Thesis, Universite Libre de Bruxelles, Bruxelles, Belgium, 3 October 2016. [Google Scholar]
  36. Rochman, D.; Zwermann, W.; van der Marck, S.C.; Koning, A.J.; Sjöstrand, H.; Helgesson, P.; Krzykacz-Hausmann, B. Efficient use of Monte Carlo: Uncertainty propagation. Nucl. Sci. Eng. 2014, 177, 337–349. [Google Scholar] [CrossRef]
  37. Bostelmann, F.; Zwermann, W.; Krzykacz-Hausmann, B.; Gallner, L.; Aures, A.; Velkov, K. Sampling-based Nuclear Data Uncertainty Analysis in Criticality and Depletion Calculations. In Proceedings of the ANS MC2015, Nashville, TN, USA, 19–23 April 2015.
  38. Rochman, D.; Vasiliev, A.; Ferroukhi, H.; Zhu, T.; van der Marck, S.C.; Koning, A.J. Nuclear data uncertainty for criticality-safety: Monte Carlo vs. linear perturbation. Ann. Nucl. Energy 2016, 92, 150–160. [Google Scholar] [CrossRef]
  39. Wieselquist, W.; Zhu, T.; Vasiliev, A.; Ferroukhi, H. PSI methodologies for ND uncertainty propagation with CASMO-5M and MCNPX: Results for OECD/NEA UAM Benchmark Phase I. Sci. Technol. Nucl. Install 2013, 2013. [Google Scholar] [CrossRef]
  40. Zhu, T.; Vasiliev, A.; Ferroukhi, H.; Pautz, A. NUSS: A tool for propagating multigroup nuclear data covariances in pointwise ACE-formatted nuclear data using stochastic sampling method. Ann. Nucl. Energy 2015, 75, 713–722. [Google Scholar] [CrossRef]
  41. Leray, O.; Grimm, P.; Hursin, M.; Ferroukhi, H.; Pautz, A. Uncertainty Quantification of Spent Fuel Nuclide Compositions due to Cross-Sections, Decay Constants and Fission Yields. In Proceedings of the PHYSOR2014: International Conference on Physics of Reactors, Kyoto, Japan, 28 September–3 October 2014.
  42. Leray, O.; Rochman, D.; Grimm, P.; Ferroukhi, H.; Vasiliev, A.; Hursin, M.; Perret, G.; Pautz, A. Nuclear data uncertainty propagation on spent fuel nuclide compositions. Ann. Nucl. Energy 2016, 94, 603–611. [Google Scholar] [CrossRef]
  43. Dokhane, A.; Grandi, G.; Leray, O.; Ferroukhi, H.; Pautz, A. Validation of SIMULATE-3K against SPERT-III RIA Experiments with Quantification of Nuclear Data Uncertainties. In Proceedings of the PHYSOR 2016: Unifying Theory and Experiments in the 21st Century, Sun Valley, ID, USA, 1–5 May 2016.
  44. Garcıa-Herranz, N.; Cabellos, O.; Sanz, J.; Juan, J.; Kuijper, J.C. Propagation of statistical and nuclear data uncertainties in Monte Carlo burn-up calculations. Ann. Nucl. Energy 2008, 35, 714–730. [Google Scholar] [CrossRef] [Green Version]
  45. Cacuci, D.G.; Ionescu-Bujor, M. A comparative review of sensitivity and uncertainty analysis of large-scale systems—II: Statistical methods. Nucl. Sci. Eng. 2004, 147, 204–217. [Google Scholar] [CrossRef]
  46. Tarantola, S.; Gatelli, D.; Mara, T.A. Random balance designs for the estimation of first order global sensitivity indices. Reliab. Eng. Syst. Saf. 2006, 91, 717–727. [Google Scholar] [CrossRef]
  47. Zhu, T. Sampling-Based Nuclear Data Uncertainty Quantification for Continuous Energy Monte Carlo Codes. Ph.D. Thesis, École Polytechnique Fédérale de Lausanne, Lausanne, Switzerland, 2015. [Google Scholar]
  48. Zhu, T.; Vasiliev, A.; Ferroukhi, H.; Rochman, D.; Pautz, A. Testing the sampling-based NUSS-RF tool for the nuclear data-related global sensitivity analysis with Monte Carlo neutronics calculations. Nucl. Sci. Eng. 2016, 184, 69–83. [Google Scholar] [CrossRef]
  49. Zhu, T.; Vasiliev, A.; Ferroukhi, H.; Pautz, A.; Tarantola, S. NUSS-RF: Stochastic sampling-based tool for nuclear data sensitivity and uncertainty quantification. J. Nucl. Sci. Technol. 2015, 52, 1000–1007. [Google Scholar] [CrossRef]
  50. Alhassan, E.; Sjöstrand, H.; Helgesson, P.; Österlund, M.; Pomp, S.; Koning, A.J.; Rochman, D. Selecting benchmarks for reactor simulations: An application to a lead fast reactor. Ann. Nucl. Energy 2016, 96, 158–169. [Google Scholar] [CrossRef]
  51. Buss, O.; Hoefer, A.; Neuber, J.C.; Schmid, M. Hierarchical Monte-Carlo approach to bias estimation for criticality safety calculations-042. In Proceedings of the PHYSOR 2010: Advances in Reactor physics to Power the Nuclear Renaissance, Pittsburgh, PA, USA, 9–14 May 2010.
  52. Hoefer, A.; Buss, O.; Hennebach, M.; Schmid, M.; Porsch, D. MOCABA: A general Monte Carlo–Bayes procedure for improved predictions of integral functions of nuclear data. Ann. Nucl. Energy 2015, 77, 514–521. [Google Scholar] [CrossRef]
  53. Rochman, D.; Leray, O.; Vasiliev, A.; Ferroukhi, H.; Koning, A.J.; Fleming, M.; Sublet, J.C. A Bayesian Monte Carlo method for fission yield covariance information. Ann. Nucl. Energy 2016, 95, 125–134. [Google Scholar] [CrossRef]
  54. Vasiliev, A.; Rochman, D.; Zhu, T.; Pecchia, M.; Ferroukhi, H.; Pautz, A. Towards application of neutron cross-section uncertainty propagation capability in the criticality safety methodology. In Proceedings of the International Conference Nuclear Criticality Safety (ICNC 2015), Charlotte, NC, USA, 13–17 September 2015.
  55. Herrero, J.J.; Pecchia, M.; Ferroukhi, H.; Canepa, S.; Vasiliev, A.; Caruso, S. Computational scheme for burnup credit applied to long term waste disposal. In Proceedings of the International Conference Nuclear Criticality Safety (ICNC 2015), Charlotte, NC, USA, 13–17 September 2015.
  56. Chadwick, M.B. ENDF/B-VII.1 nuclear data for science and technology: Cross sections, covariances, fission product yields and decay data. Nucl. Data Sheets 2011, 112, 2887–2996. [Google Scholar] [CrossRef]
  57. National Nuclear Data Center. Covariances in the ENDF/B-VII.1 Evaluated Nuclear Data Library. Available online: http://www.nndc.bnl.gov/endf/b7.1/covariances.html (accessed on 3 November 2016).
  58. Rochman, D.; Koning, A.; van der Marck, S.; Hogenbirk, A.; Sciolla, C. Nuclear data uncertainty propagation: Perturbation vs. Monte Carlo. Ann. Nucl. Energy 2011, 38, 942–952. [Google Scholar] [CrossRef]
  59. Rearden, B.T. Criticality safety enhancements for scale 6.2 and beyond. In Proceedings of the International Conference Nuclear Criticality Safety (ICNC 2015), Charlotte, NC, USA, 13–17 September 2015.
  60. Gerard, R.; Zaritsky, S.M. Why Do We Need Dosimetry? In Reactor Dosimetry: Radiation Metrology and Assessment; ASTM STP 1398; Williams, J.G., Ed.; American Society for Testing and Materials: West Conshohocken, PA, USA, 2001. [Google Scholar]
  61. Holzgrewe, F.; Hegedues, F.; Paratte, J.M. Calculation and benchmarking of an azimuthal pressure vessel neutron fluence distribution using the BOXER code and scraping experiments. Nucl. Technol. 1995, 109, 383–397. [Google Scholar]
  62. Vasiliev, A.; Wieselquist, W.; Ferroukhi, H.; Canepa, S.; Heldt, J.; Ledergerber, G. Validation studies of computational scheme for high-fidelity fluence estimations of the Swiss BWRs. Prog. Nucl. Sci. Technnol. 2014, 4, 99–103. [Google Scholar] [CrossRef]
  63. Ferroukhi, H.; Hollard, J.-M.; Zimmermann, M.A.; Chawla, R. Estimation of the fast neutron fluence at control rod tips using a 3-D diffusion/2-D transport calculation scheme. Ann. Nucl. Energy 2009, 36, 286–291. [Google Scholar] [CrossRef]
  64. Vasiliev, A.; Ferroukhi, H.; Zhu, T.; Pautz, A. Nuclear data library effects on fast to thermal flux shapes around PWR control rod tips. Nucl. Data Sheets 2014, 118, 575–578. [Google Scholar] [CrossRef]
  65. Vasiliev, A.; Ferroukhi, H.; Pecchia, M.; Pautz, A. Localized neutron flux assessment and verification studies using MCNPX PWR full core model. Ann. Nucl. Energy 2016, 92, 317–332. [Google Scholar] [CrossRef]
  66. Ferroukhi, H.; Vasiliev, A.; Dufresne, A.; Chawla, R. Towards a reference numerical scheme using MCNPX for PWR control rod tip fluence estimations. In Proceedings of the PHYSOR 2012: Conference on Advances in Reactor Physics—Linking Research, Industry, and Education, Knoxville, TN, USA, 15–20 April 2012.
  67. Vasiliev, A.; Ferroukhi, H.; Zimmermann, M.A.; Chawla, R. Development of a CASMO-4/SIMULATE-3/MCNPX calculation scheme for PWR fast neutron fluence analysis and validation against RPV scraping test data. Ann. Nucl. Energy 2007, 34, 615–627. [Google Scholar] [CrossRef]
  68. Dupré, A.; Vasiliev, A.; Ferroukhi, H.; Pautz, A. Towards modeling and validation enhancements of the PSI MCNPX fast neutron fluence computational scheme based on recent PWR experimental data. Ann. Nucl. Energy 2015, 85, 820–829. [Google Scholar] [CrossRef]
  69. Ferroukhi, H.; Hofer, K.; Hollard, J.-M.; Vasiliev, A.; Zimmermann, M.A. Core modelling and analysis of the Swiss nuclear power plants for qualified R and D applications. In Proceedings of the PHYSOR’08: International Conference on the Physics of Reactors ‘Nuclear Power: A Sustainable Resource’, Interlaken, Switzerland, 14–19 September 2008.
  70. Wieselquist, W.; Ferroukhi, H.; Bernatowicz, K. A Trend analysis methodology for enhanced validation of 3-D LWR core simulations. In Proceedings of the International Conference on Mathematics and Computational Methods Applied to Nuclear Science and Engineering (M&C2011), Rio de Janeiro, Brazil, 8–12 May 2011.
  71. Wiarda, D.; Williams, M.; Marshall, B.J.; Dunn, M.; Rearden, B. SCALE 6.2 Cross-Section Covariance Libraries. In Proceedings of the 8th Meeting of Expert Group UACSA/WPNCS, Paris, France, 15–16 September 2014.
  72. Harding, B.; Tremblay, C.; Cousineau, D. Standard errors: A review and evaluation of standard error estimators using Monte Carlo simulations. Quant. Methods Psychol. 2014, 10, 107–123. [Google Scholar] [CrossRef]
  73. Savelli, R.; Vasiliev, A.; Ferroukhi, H.; Pautz, A. Extention of PSI FNF modeling methodology validation using BWR dosimetry data. In Proceedings of the American Nuclear Society 2016 Student Conference, Madison, WI, USA, 31 March–3 April 2016.
  74. Zhu, T.; Rochman, D.; Vasiliev, A.; Ferroukhi, H.; Wieselquist, W.; Pautz, A. Comparison of two approaches for nuclear data uncertainty propagation in MCNPX for selected fast spectrum critical benchmarks. Nucl. Data Sheets 2014, 118, 388–391. [Google Scholar] [CrossRef]
  75. Bostelmann, F.; Weiß, F.-P.; Aures, A.; Velkov, K.; Zwermann, W.; Rearden, B.T.; Jessee, M.A.; Williams, M.L.; Wiarda, D.; Wieselquist, W.A. Uncertainty and sensitivity analysis in criticality calculations with perturbation theory and sampling. In Proceedings of the ANS MC2015—Joint International Conference on Mathematics and Computation (M&C), Supercomputing in Nuclear Applications (SNA) and the Monte Carlo (MC) Method, Nashville, TN, USA, 19–23 April 2015.
  76. Kallner, A. Laboratory Statistics, Handbook of Formulas and Terms; Elsevier Inc.: Amsterdam, The Netherlands, 2014. [Google Scholar]
  77. Pecchia, M.; Vasiliev, A.; Ferroukhi, H.; Pautz, A. Updated validation of the PSI criticality safety evaluation Methodology using MCNPX2.7 and ENDF/B-VII.1. In Proceedings of the PHYSOR 2014: The Role of Reactor Physics toward a Sustainable Future, Kyoto, Japan, 28 September–3 October 2014.
  78. Nuclear Energy Agency (NEA). WPNCS Expert Group on Uncertainty Analysis for Criticality Safety Assessment (UACSA). Available online: https://www.oecd-nea.org/science/wpncs/UACSA/ (accessed on 3 November 2016).
  79. Stuke, M. Integral Experiment Covariance Data. GRS’s Approach. In Proceedings of the 10th Meeting of Expert Group UACSA/WPNCS, Paris, France, 7 July 2016.
  80. Peters, E.; Sommer, F.; Stuke, M. Sensitivities and correlations of critical experiments due to uncertainties of system parameters and nuclear data. In Proceedings of the International Conference on Nuclear Criticality Safety, ICNC 2015, Charlotte, NC, USA, 13–17 September 2015.
  81. Vasiliev, A.; Rochman, D.; Pecchia, M.; Ferroukhi, H. Few observations in relation to Phase-IV benchmark systems’ correlations. In Proceedings of the 10th Meeting of Expert Group UACSA/WPNCS, Paris, France, 7 July 2016.
  82. Can, U. Statistics for Dummies; John Wiley & Sons: Hoboken, NJ, USA, 2016. [Google Scholar]
  83. Guide for Validation of Nuclear Criticality Safety Calculational Methodology; NUREG/CR-6698; U.S. Nuclear Regulatory Commission: Washington, DC, USA, 2001.
  84. Ivanova, T.T.; Nikolaev, M.N.; Raskach, K.F.; Rozhikhin, E.V.; Tsiboulia, A.M. Influence of the correlations of experimental uncertainties on criticality prediction. Nucl. Sci. Eng. 2003, 145, 97–104. [Google Scholar] [CrossRef]
  85. Pecchia, M.; Vasiliev, A.; Leray, O.; Ferroukhi, H.; Pautz, A. Advanced calculation methodology for manufacturing and technological parameters’ uncertainties propagation at arbitrary level of lattice elements grouping. J. Nucl. Sci. Technol. 2015, 52, 1084–1092. [Google Scholar] [CrossRef]
Figure 1. MCNP(X) schematic models of: (a) pressurized water reactor (PWR); and (b) boiling water reactor (BWR).
Energies 09 01039 g001
Figure 2. Matrix of Pearson correlation coefficients obtained for criticality validation benchmarks with 300 randomly sampled libraries.
Energies 09 01039 g002
Figure 3. Pearson coefficient behavior vs. sample size for the selected couple of model calculations.
Energies 09 01039 g003
Figure 4. Upper triangular matrix of Pearson correlation coefficients obtained with 300 randomly sampled ND libraries.
Energies 09 01039 g004
Table 1. Fast neutron flux (E > 1 MeV) calculation uncertainties (one relative (rel.) sample standard deviation (STD)) (%). CR: control rods; and NUSS: Nuclear data Uncertainty Stochastic Sampling.
ModelPWR-CRsPWR-CRkPWR-GPPWR-STBWR-DPWR-CRs-tPWR-CRk-t
NUSS Rel. STD4.05.17.610.514.51.01.8
MC Rel. STD0.50.60.40.20.61.11.2

