
A Hybrid Method for Generation of Typical Meteorological Years for Different Climates of China


Abstract
:1. Introduction
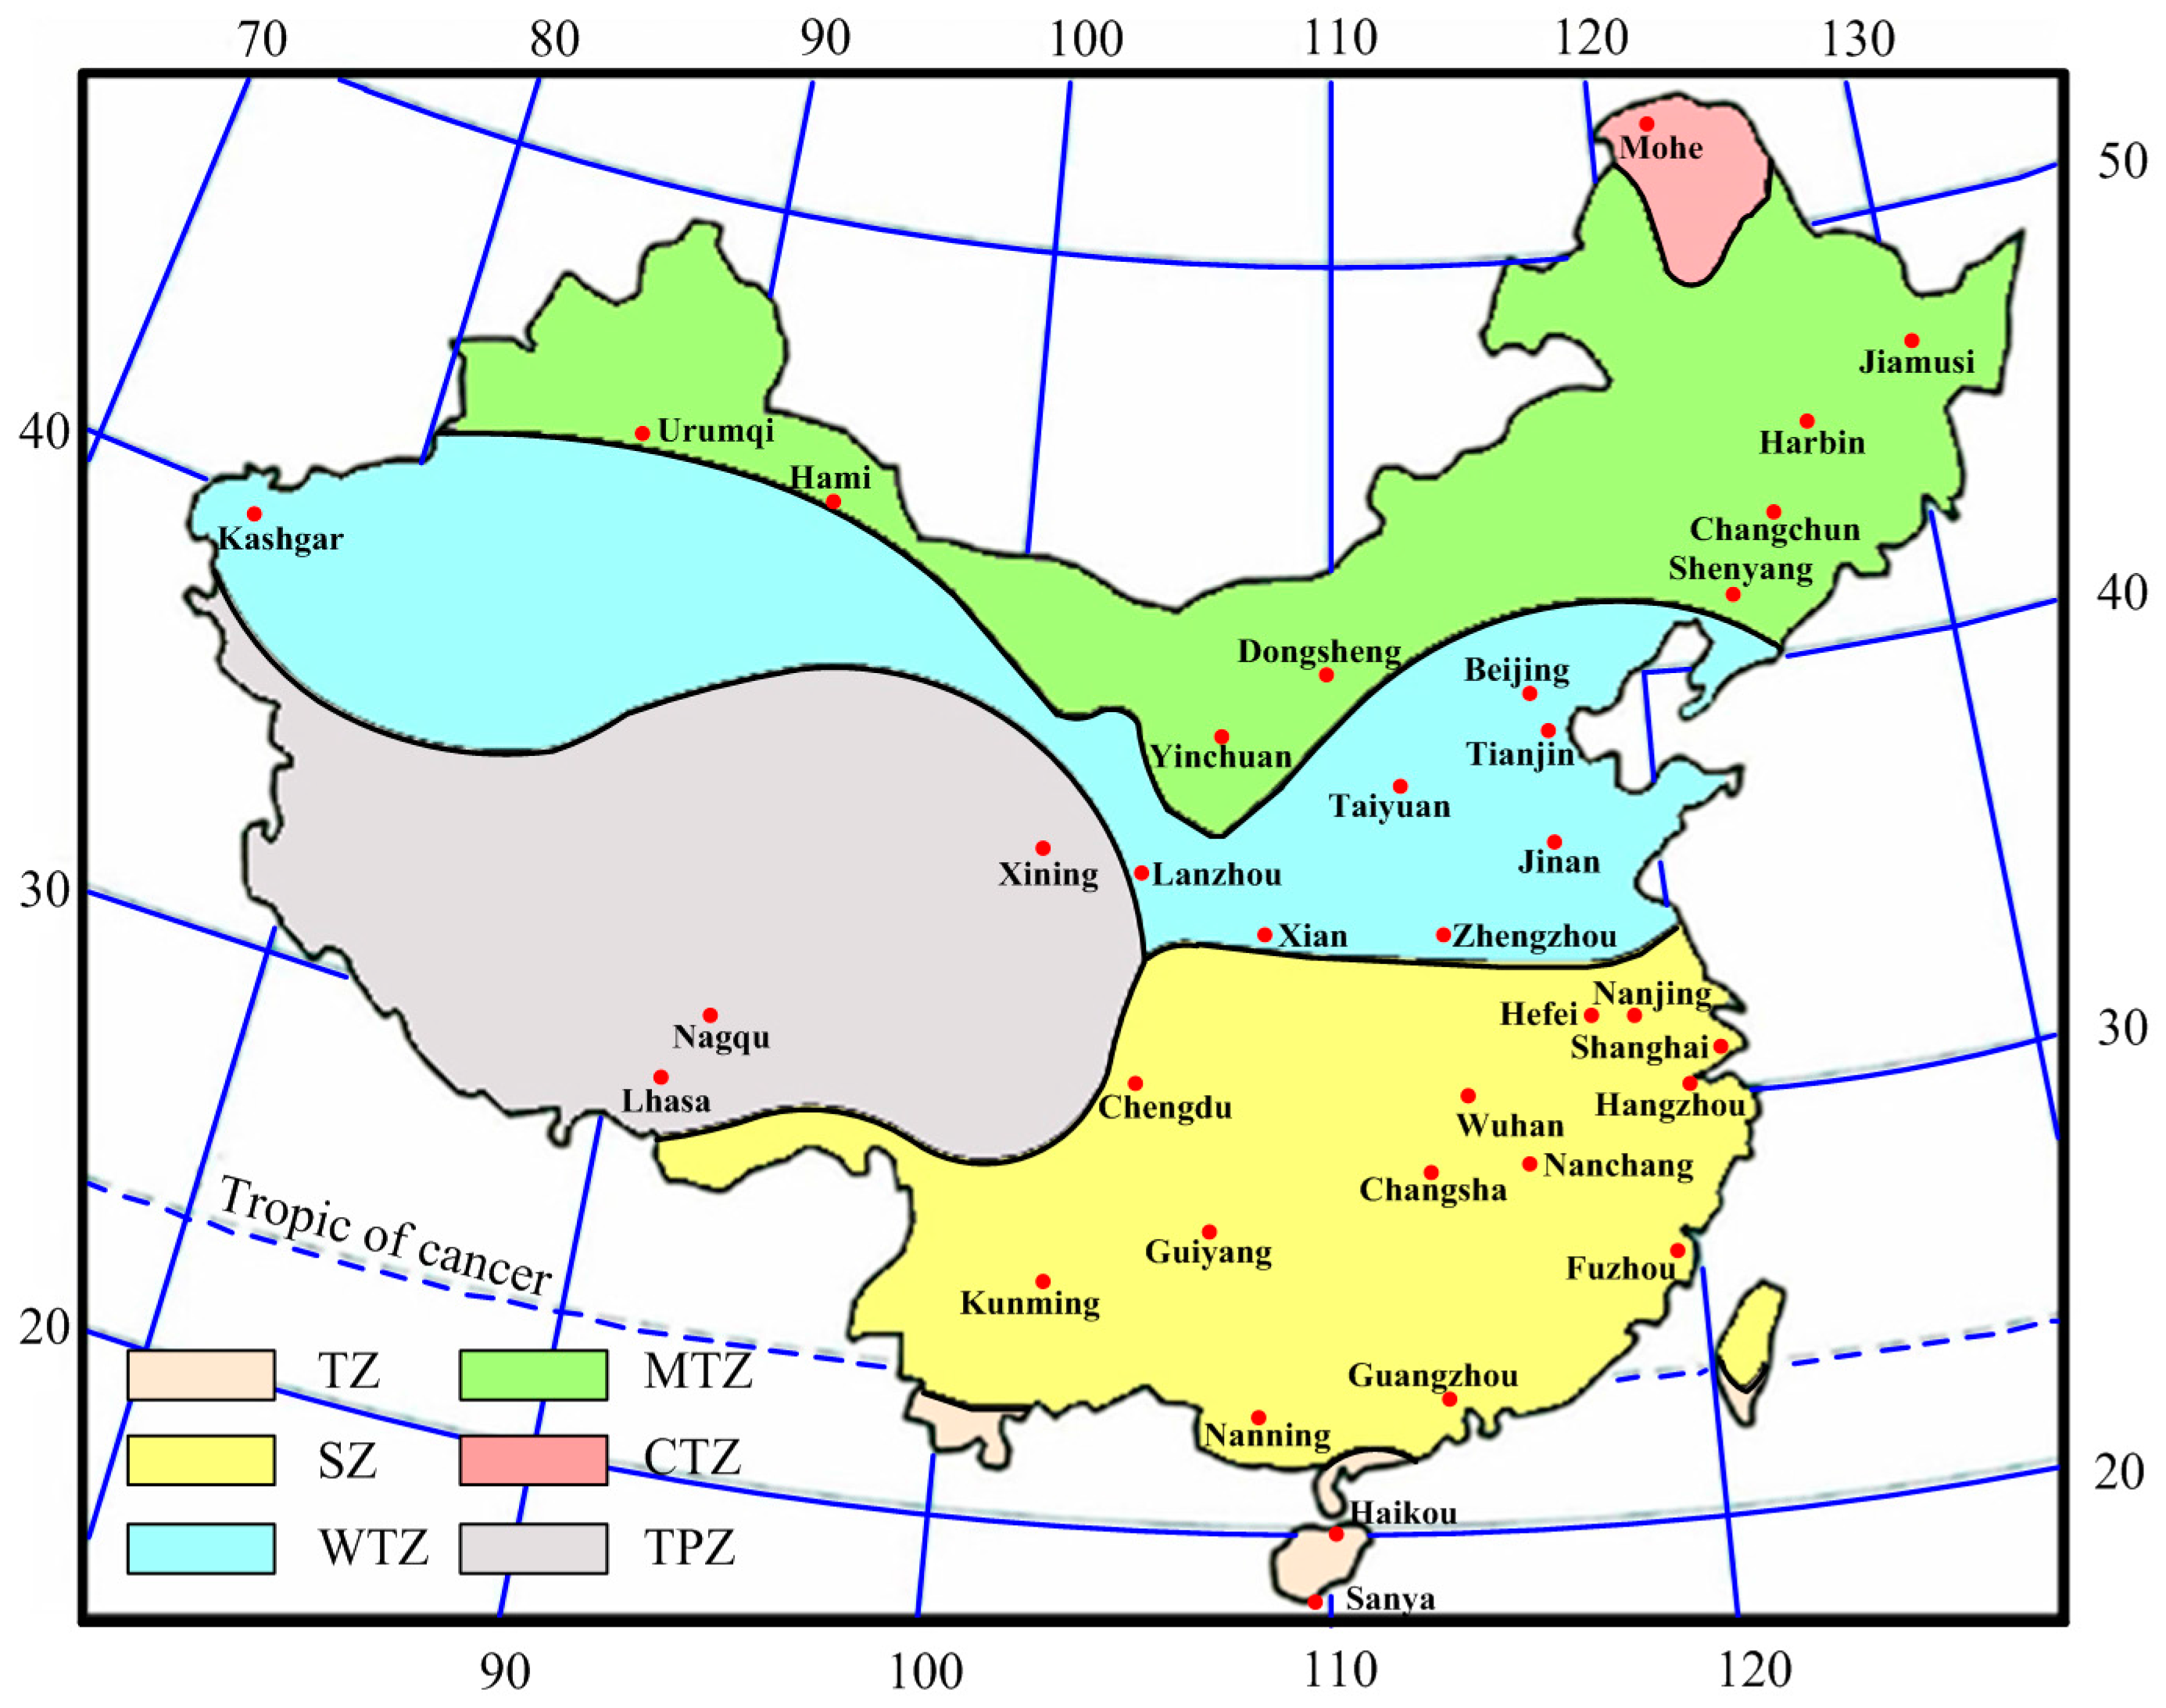
2. Climatic Zones and Data Collection
3. Description of Methodologies for TMY Generation
3.1. The Danish Method
3.2. The Festa-Ratto Method
3.3. The Modified Typical Meteorological Year (TMY) Method
3.4. TMY Selection Procedure
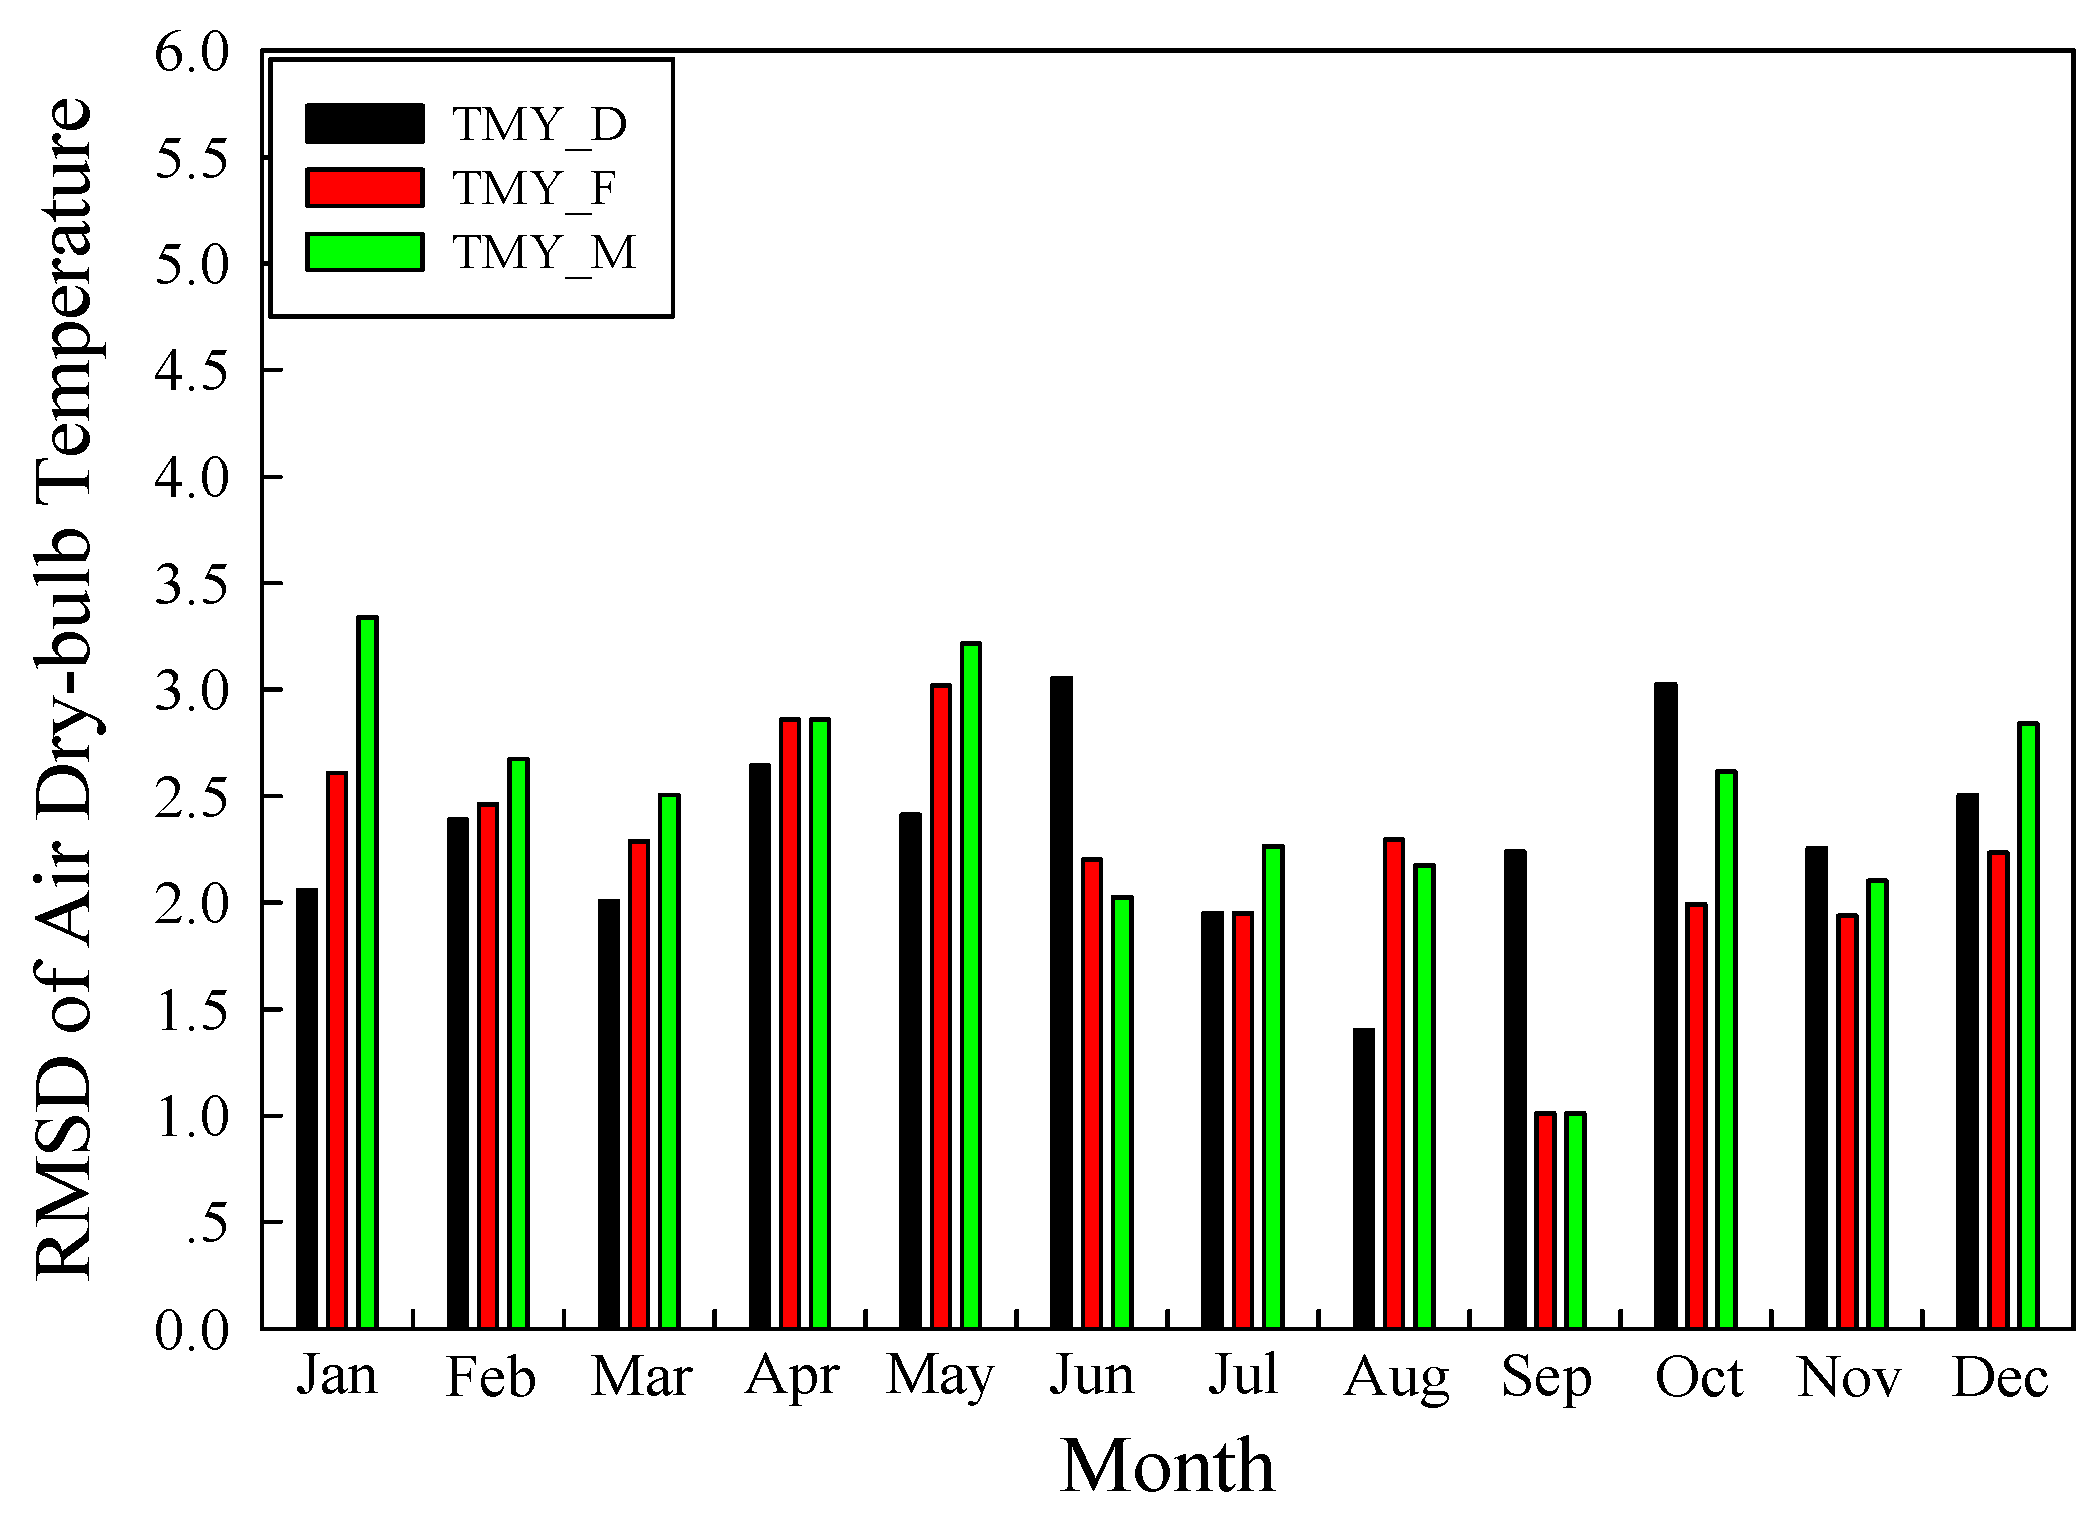
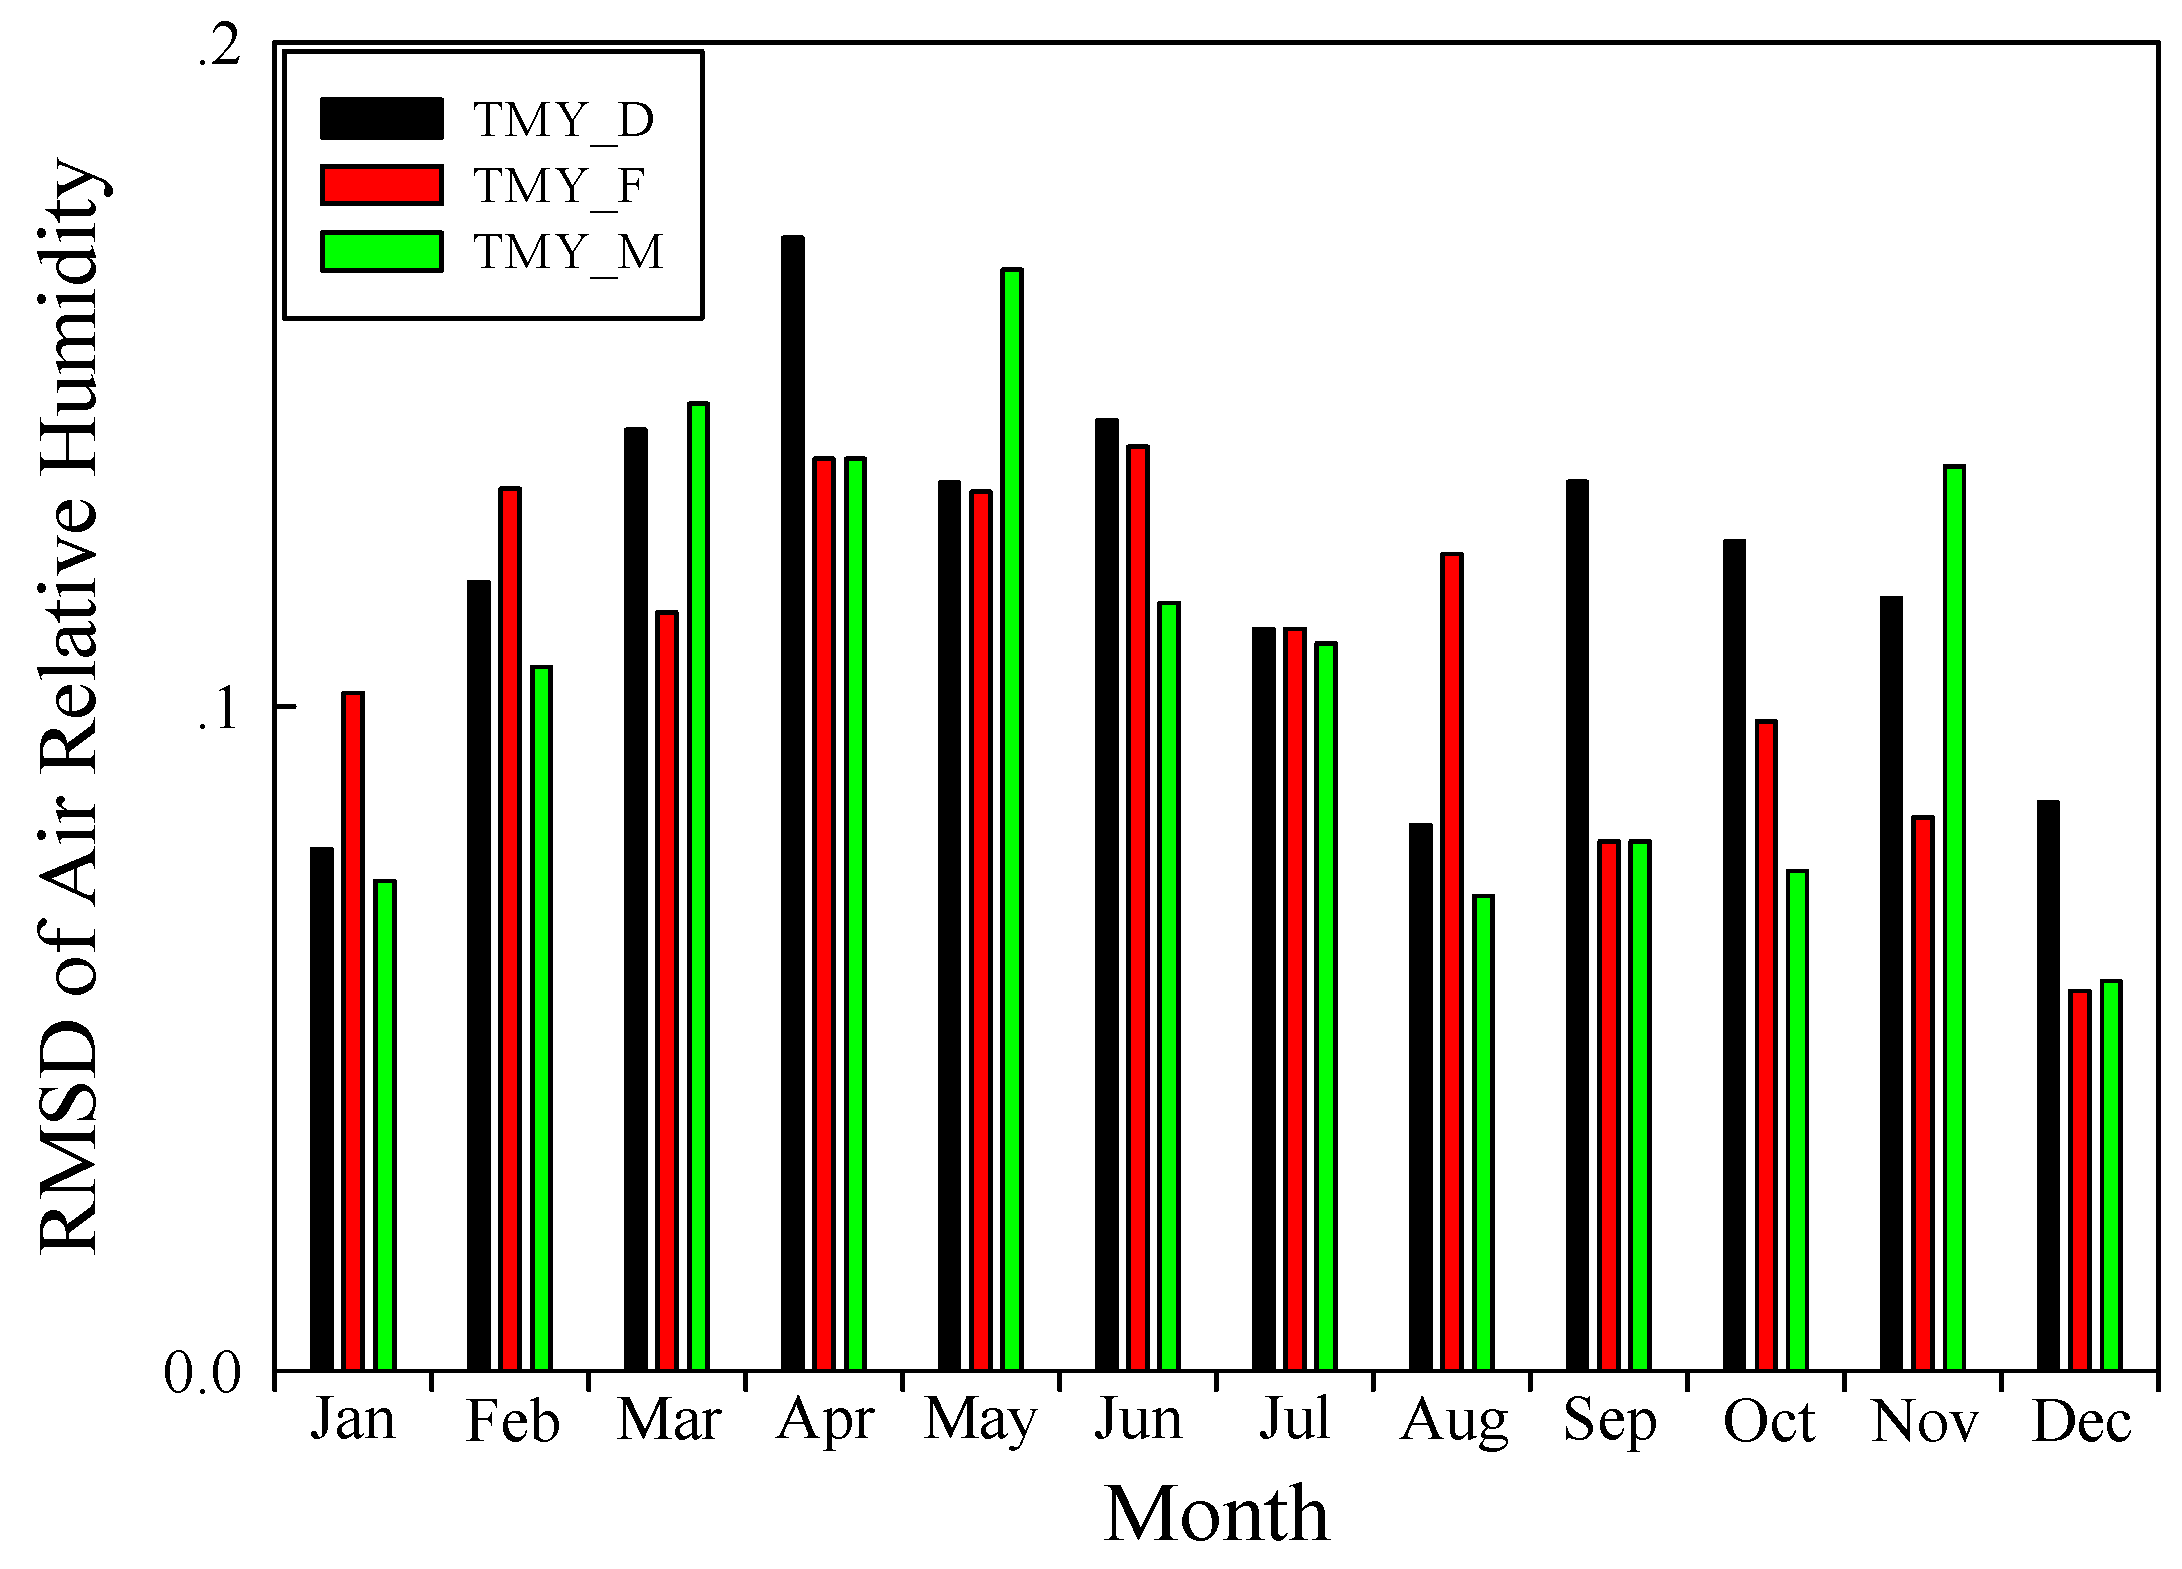
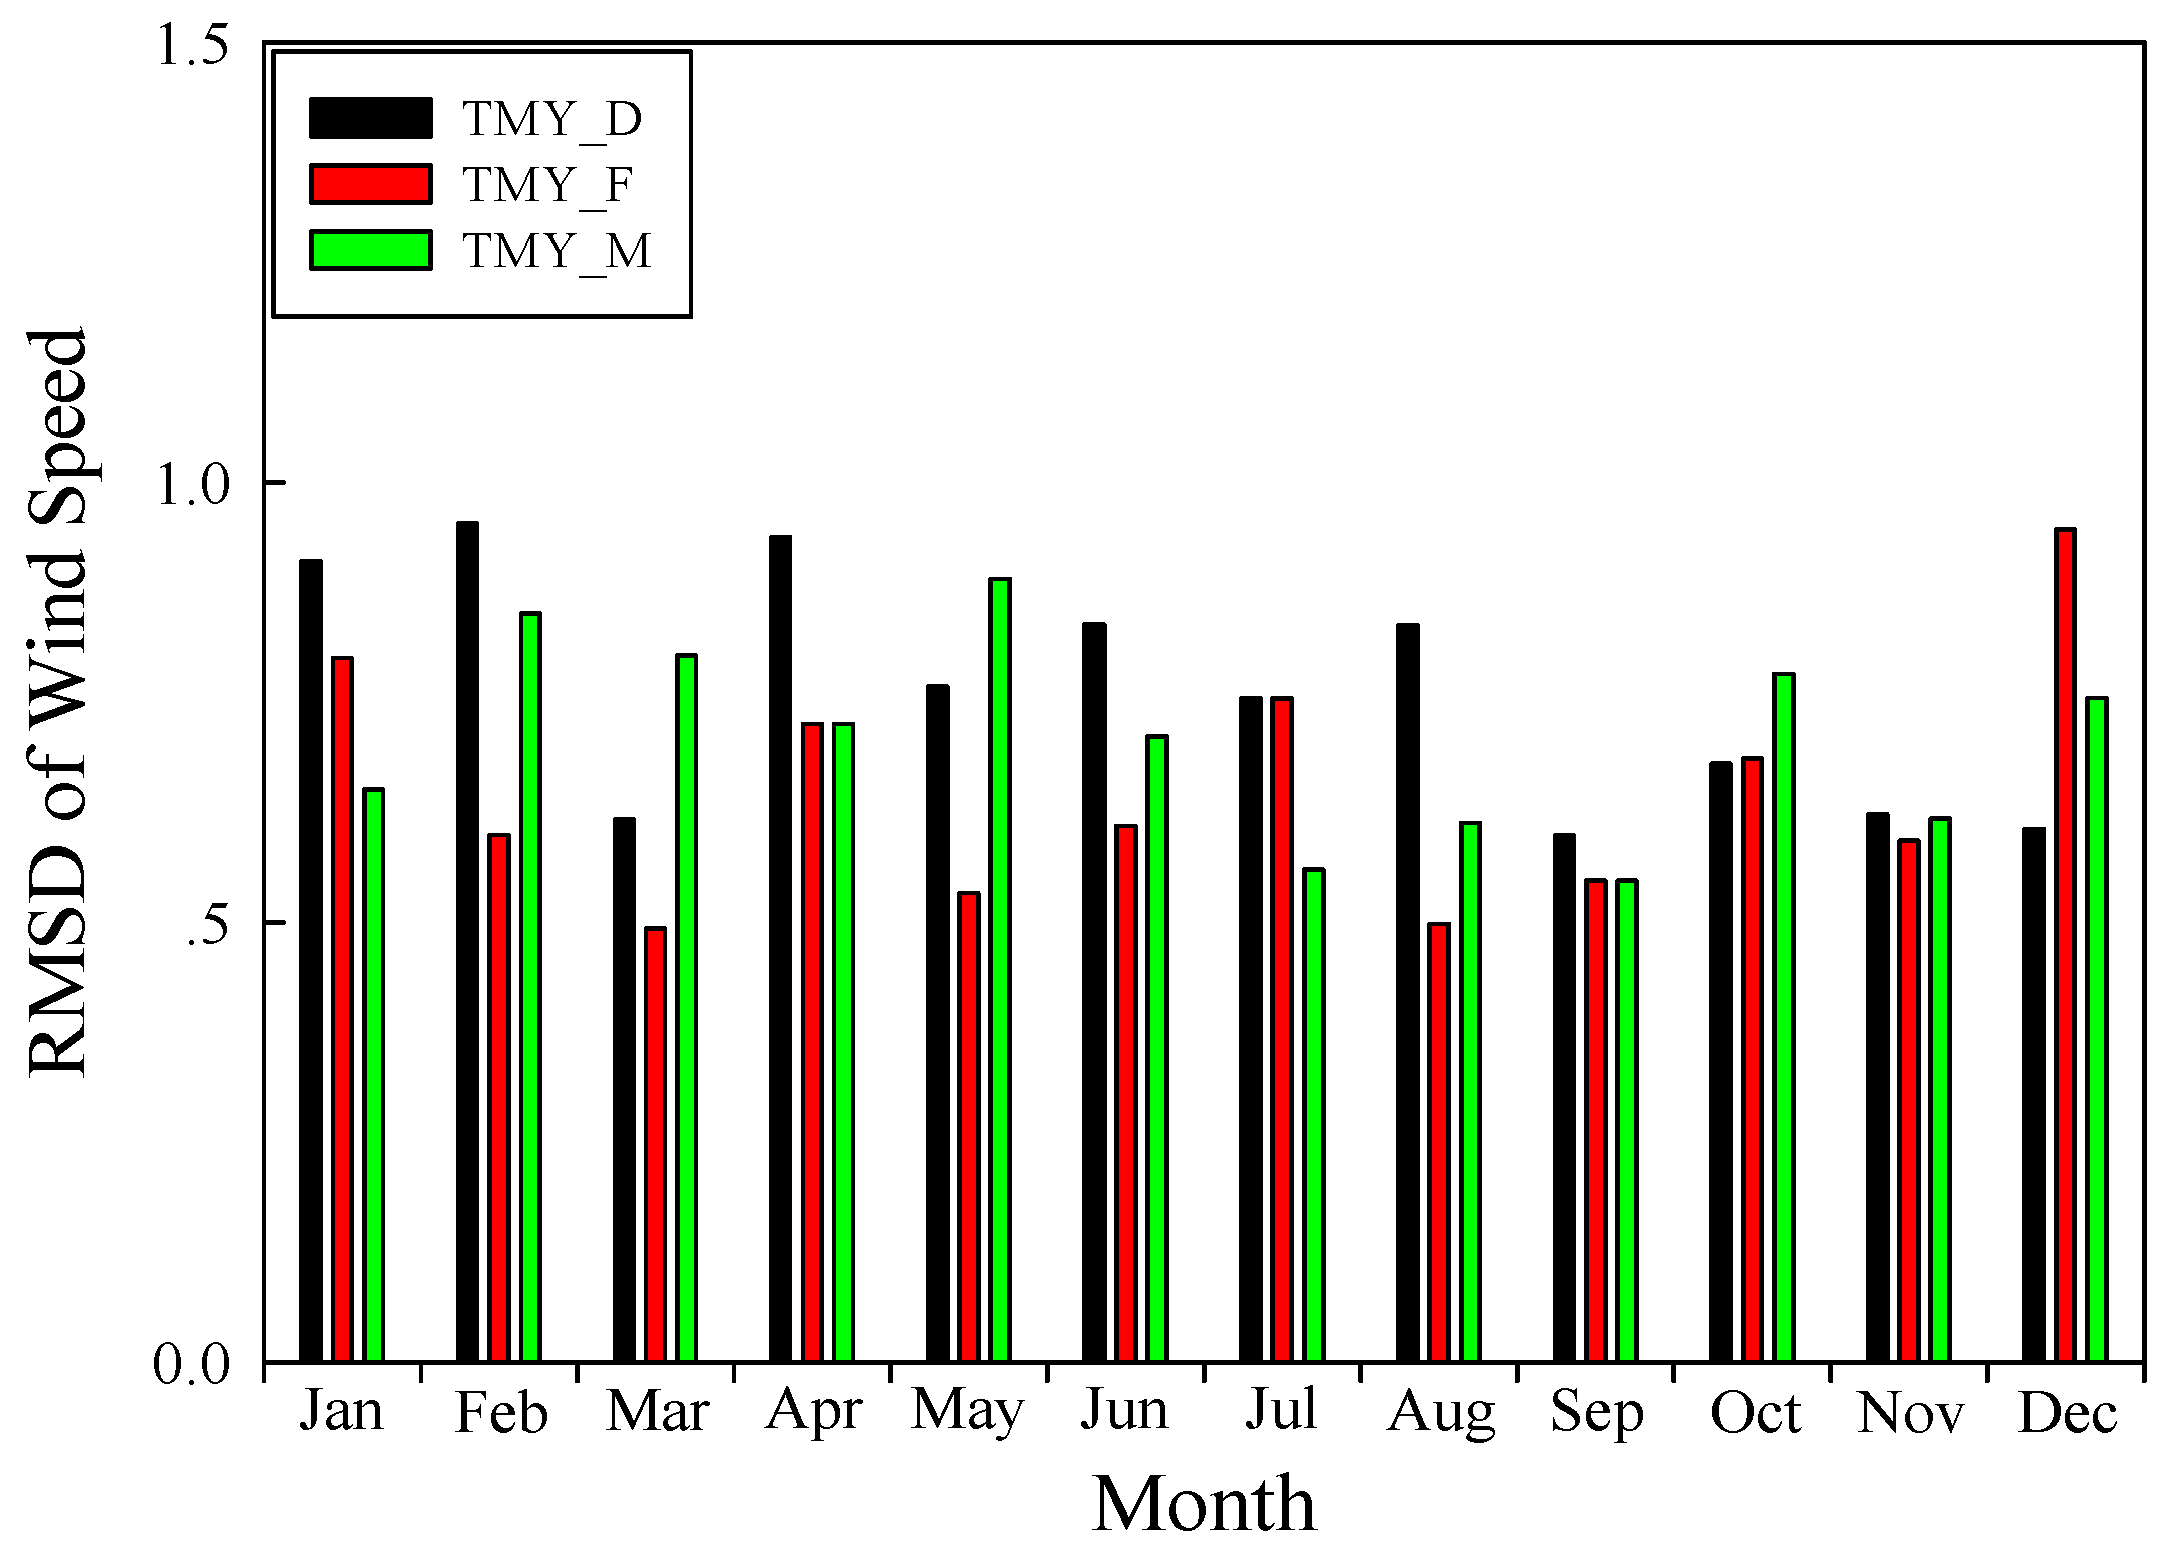
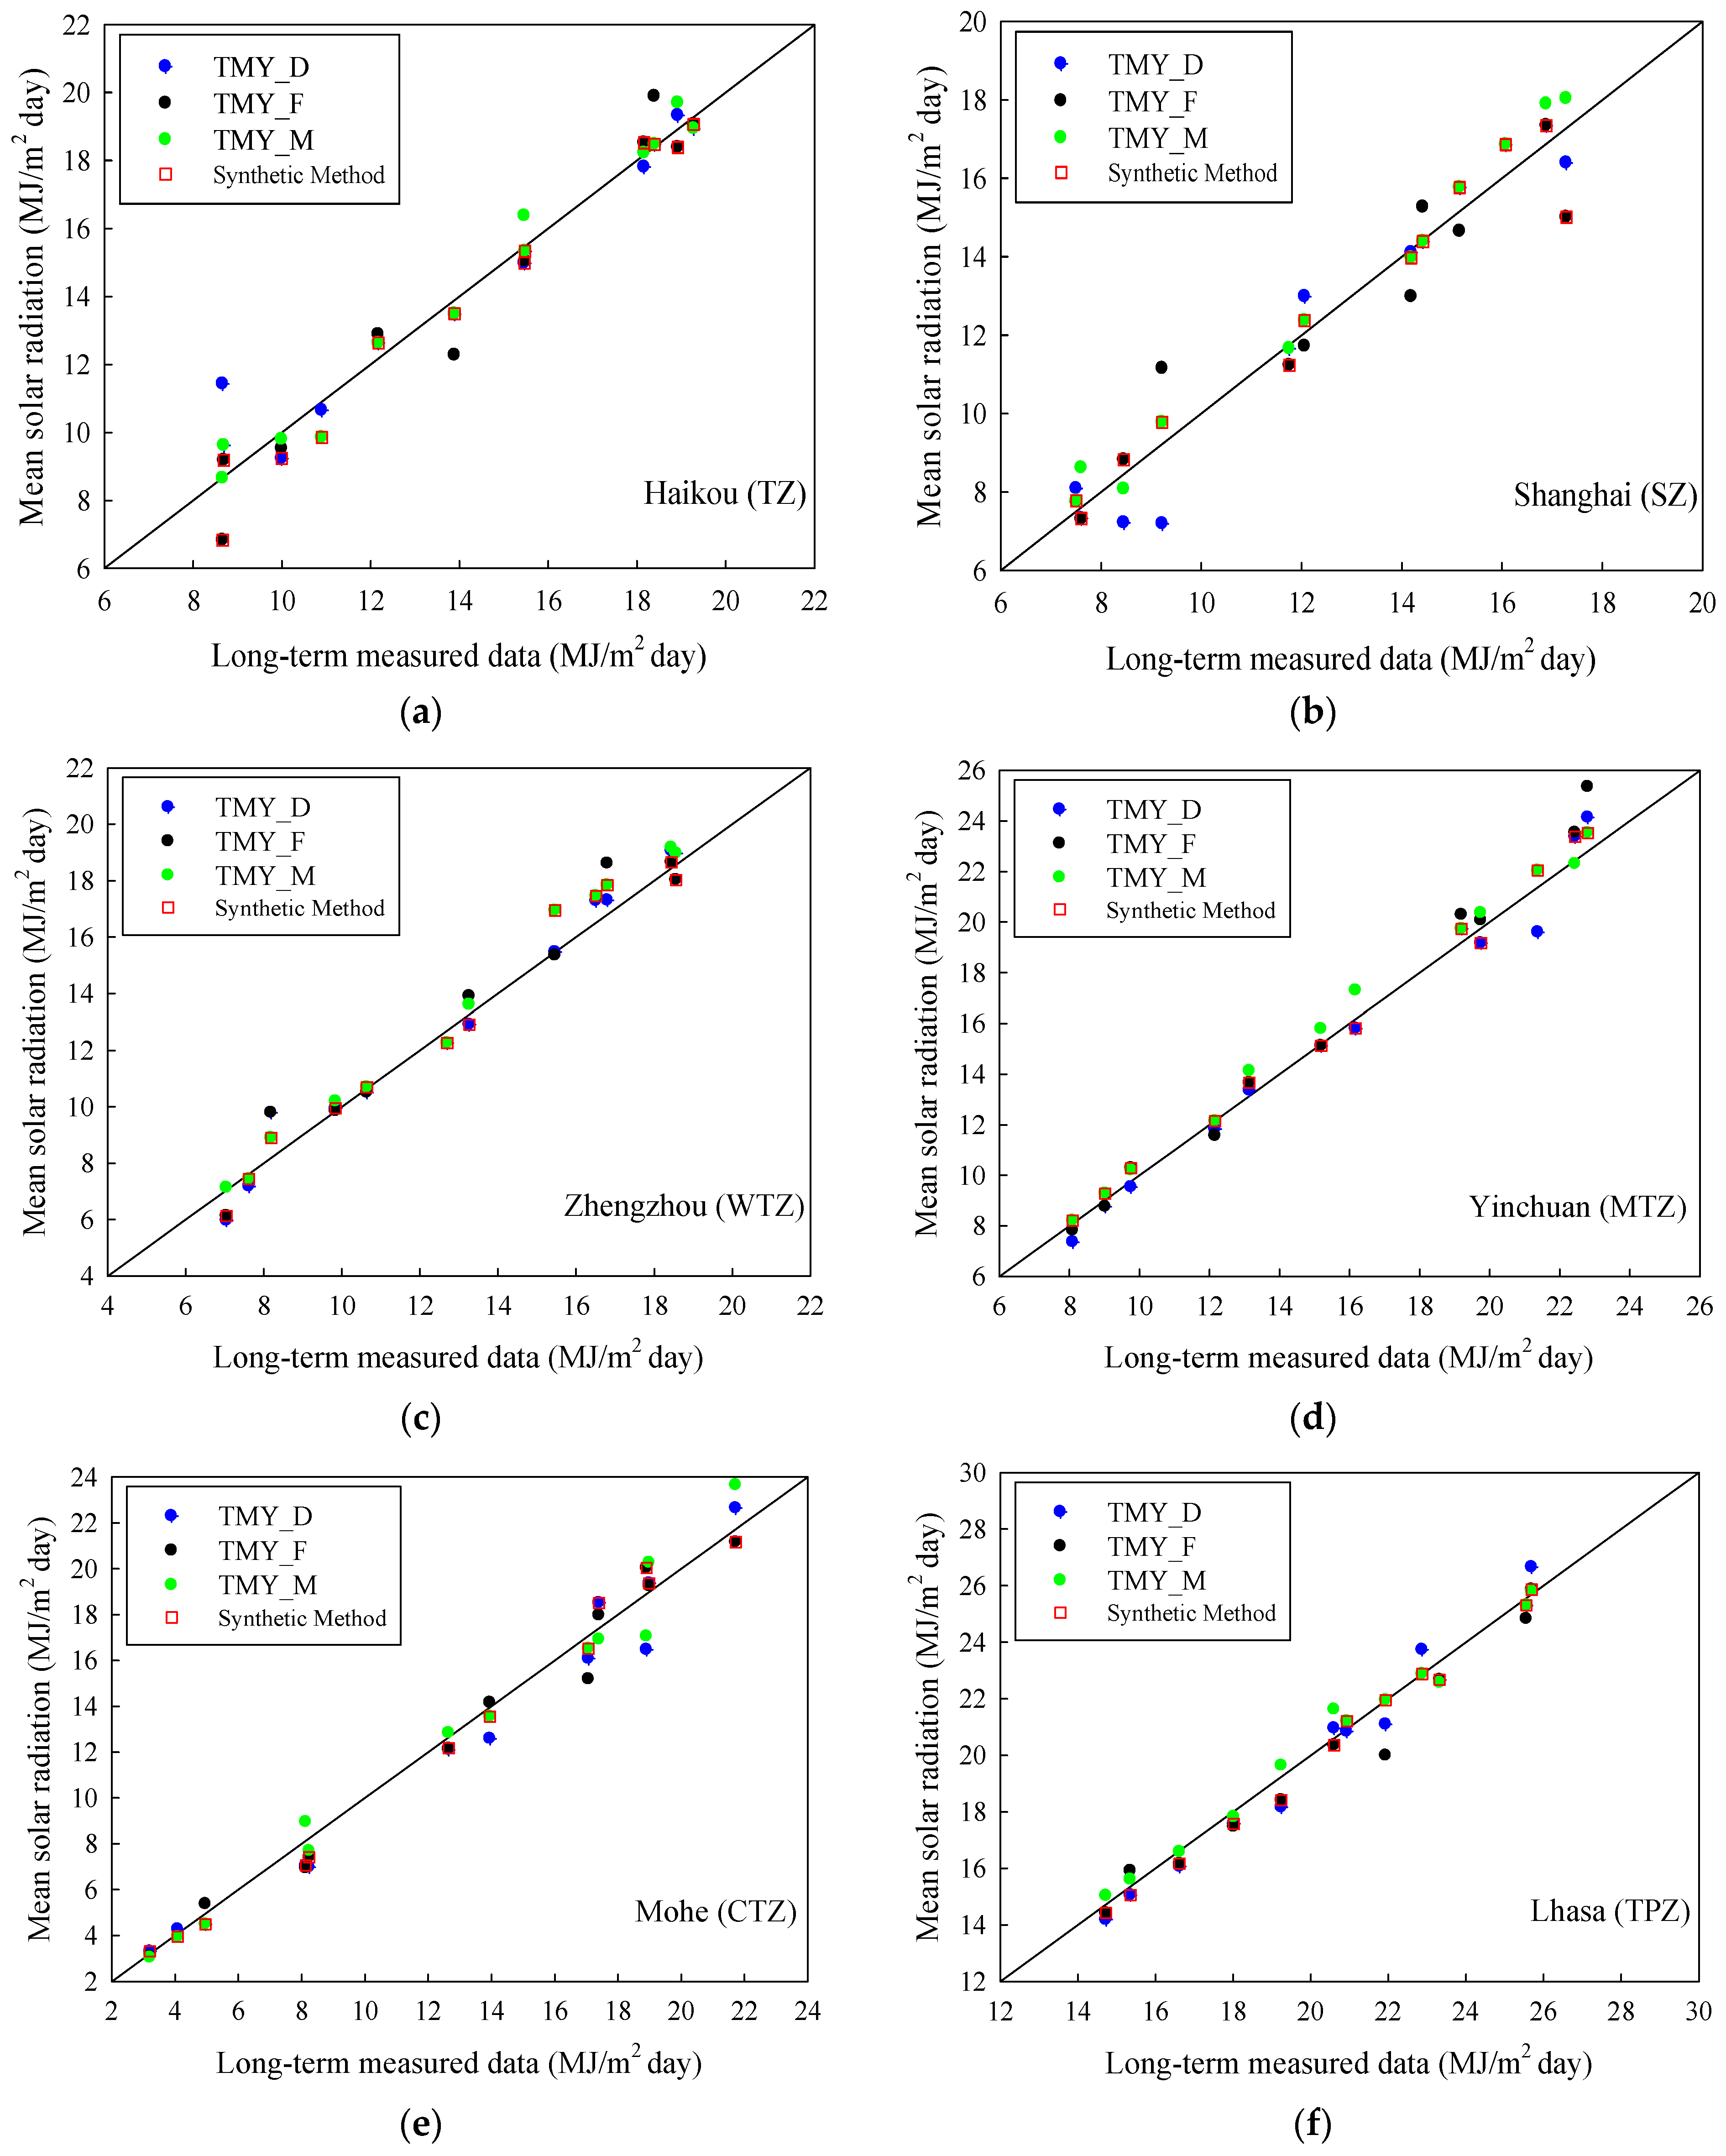
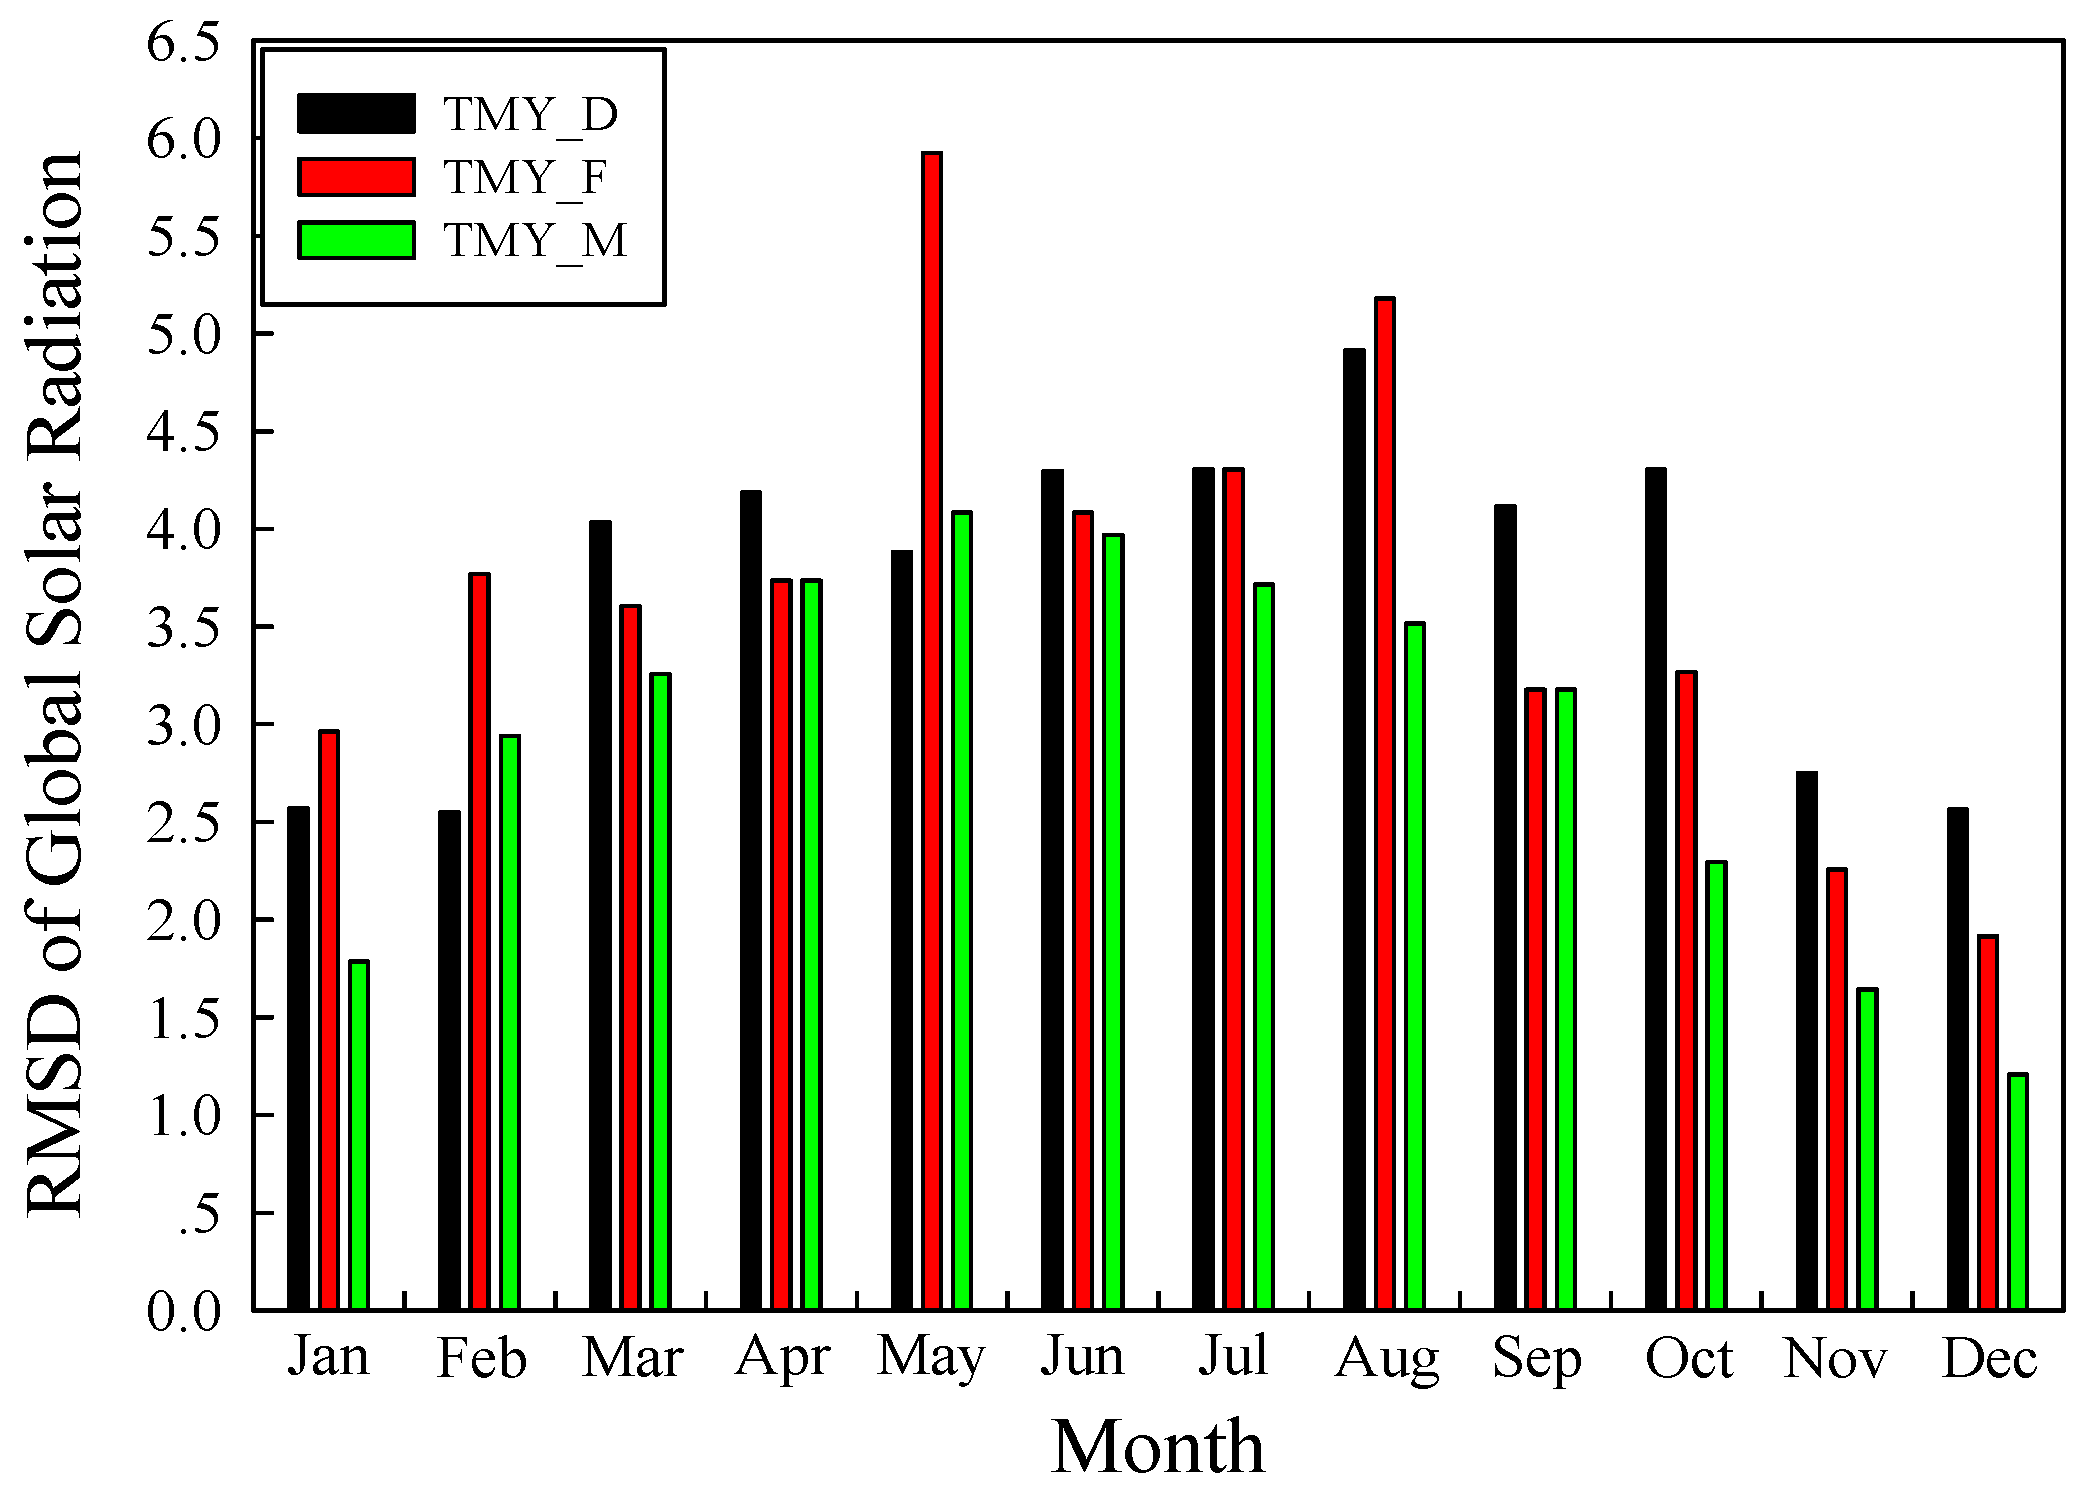
4. Performance Comparison
5. Conclusions
Acknowledgments
Author Contributions
Conflicts of Interest
Appendix A

| Climates | Station | Month | |||||||||||
|---|---|---|---|---|---|---|---|---|---|---|---|---|---|
| Jan. | Feb. | Mar. | Apr. | May | Jun. | Jul. | Aug. | Sep. | Oct. | Nov. | Dec. | ||
| TZ | Haikou | 9.177 | 9.231 | 12.628 | 15.330 | 18.470 | 18.386 | 19.059 | 18.518 | 14.981 | 13.484 | 9.852 | 6.826 |
| TZ | Sanya | 14.055 | 15.278 | 16.459 | 21.555 | 20.720 | 18.314 | 17.675 | 19.706 | 18.060 | 14.590 | 14.721 | 12.576 |
| SZ | Changsha | 4.139 | 5.724 | 7.265 | 10.369 | 11.314 | 14.570 | 18.974 | 19.259 | 12.416 | 9.254 | 8.574 | 5.993 |
| SZ | Chengdu | 5.146 | 4.491 | 8.851 | 11.301 | 12.995 | 12.602 | 12.495 | 13.814 | 7.931 | 5.589 | 5.369 | 3.435 |
| SZ | Fuzhou | 7.466 | 9.497 | 9.504 | 12.403 | 14.187 | 16.131 | 18.320 | 18.166 | 12.802 | 13.044 | 9.449 | 7.504 |
| SZ | Guangzhou | 9.995 | 10.471 | 8.118 | 9.360 | 10.872 | 14.429 | 15.315 | 15.015 | 15.371 | 13.545 | 11.965 | 10.598 |
| SZ | Guiyang | 5.208 | 5.983 | 8.138 | 13.836 | 11.995 | 12.296 | 14.874 | 16.986 | 14.133 | 10.050 | 6.989 | 6.917 |
| SZ | Hangzhou | 9.608 | 8.566 | 11.257 | 13.431 | 15.240 | 14.203 | 18.066 | 14.778 | 12.344 | 9.885 | 8.348 | 7.843 |
| SZ | Hefei | 8.120 | 8.464 | 12.997 | 17.106 | 17.435 | 16.782 | 17.734 | 16.202 | 12.148 | 10.404 | 9.107 | 6.954 |
| SZ | Kunming | 15.034 | 18.440 | 18.423 | 20.271 | 19.387 | 14.843 | 16.457 | 13.782 | 14.314 | 12.719 | 14.342 | 12.086 |
| SZ | Nanchang | 5.765 | 8.584 | 9.360 | 12.010 | 15.703 | 14.821 | 20.261 | 16.786 | 15.273 | 12.404 | 9.694 | 7.960 |
| SZ | Nanjing | 8.368 | 9.531 | 12.477 | 16.325 | 17.168 | 14.333 | 19.253 | 16.040 | 12.273 | 12.104 | 6.453 | 7.811 |
| SZ | Nanning | 8.246 | 7.898 | 7.656 | 12.272 | 14.841 | 15.148 | 17.001 | 17.474 | 16.166 | 14.993 | 11.274 | 8.674 |
| SZ | Shanghai | 7.321 | 9.778 | 12.373 | 15.763 | 17.342 | 13.972 | 15.006 | 16.856 | 14.387 | 11.231 | 8.821 | 7.773 |
| SZ | Wuhan | 5.922 | 8.048 | 12.245 | 14.108 | 14.604 | 14.251 | 17.768 | 15.667 | 14.179 | 10.413 | 7.578 | 7.176 |
| WTZ | Beijing | 8.536 | 10.489 | 14.559 | 18.707 | 21.316 | 17.732 | 17.279 | 17.128 | 14.939 | 11.255 | 8.643 | 6.707 |
| WTZ | Jinan | 8.208 | 10.385 | 14.578 | 18.077 | 18.943 | 18.317 | 16.494 | 15.346 | 14.300 | 11.401 | 8.797 | 6.783 |
| WTZ | Kashgar | 7.329 | 10.388 | 12.489 | 18.224 | 23.711 | 26.325 | 24.731 | 21.653 | 15.905 | 13.923 | 8.155 | 6.098 |
| WTZ | Lanzhou | 7.921 | 10.664 | 14.536 | 17.873 | 19.168 | 19.910 | 20.832 | 18.297 | 15.987 | 10.614 | 8.160 | 7.023 |
| WTZ | Taiyuan | 7.358 | 11.339 | 13.841 | 18.930 | 20.140 | 18.322 | 19.063 | 16.732 | 14.539 | 11.709 | 8.813 | 6.090 |
| WTZ | Tianjin | 7.451 | 10.103 | 14.896 | 17.916 | 18.830 | 16.502 | 17.447 | 17.625 | 13.020 | 11.334 | 8.104 | 6.406 |
| WTZ | Xian | 7.727 | 8.117 | 13.105 | 15.641 | 18.433 | 17.651 | 17.908 | 18.632 | 12.142 | 6.944 | 7.149 | 5.087 |
| WTZ | Zhengzhou | 7.436 | 9.947 | 12.907 | 17.456 | 18.023 | 18.648 | 17.835 | 16.941 | 12.256 | 10.692 | 8.897 | 6.129 |
| MTZ | Changchun | 6.817 | 10.962 | 14.136 | 17.933 | 21.114 | 20.140 | 19.448 | 14.707 | 15.687 | 11.256 | 7.667 | 5.784 |
| MTZ | Dongsheng | 9.657 | 11.450 | 16.749 | 19.914 | 24.373 | 23.592 | 22.361 | 20.068 | 15.216 | 13.717 | 10.045 | 8.349 |
| MTZ | Hami | 7.738 | 11.036 | 16.181 | 22.887 | 25.072 | 26.175 | 24.427 | 21.980 | 17.514 | 12.980 | 7.664 | 6.700 |
| MTZ | Harbin | 5.589 | 9.381 | 13.535 | 16.980 | 19.872 | 21.614 | 17.579 | 15.910 | 14.545 | 9.690 | 6.717 | 4.651 |
| MTZ | Jiamusi | 5.465 | 9.658 | 12.025 | 16.210 | 18.045 | 20.722 | 18.044 | 17.465 | 13.473 | 9.458 | 5.958 | 4.711 |
| MTZ | Shenyang | 6.982 | 9.788 | 14.603 | 16.557 | 20.265 | 20.131 | 17.108 | 17.280 | 15.450 | 11.165 | 6.243 | 6.307 |
| MTZ | Urumqi | 5.909 | 7.156 | 13.301 | 18.448 | 22.087 | 23.989 | 23.226 | 20.243 | 17.687 | 11.529 | 5.974 | 3.926 |
| MTZ | Yinchuan | 9.285 | 12.145 | 15.802 | 19.165 | 23.365 | 23.526 | 22.035 | 19.730 | 15.120 | 13.658 | 10.284 | 8.207 |
| CTZ | Mohe | 3.941 | 7.055 | 13.544 | 16.511 | 20.027 | 21.158 | 19.364 | 18.506 | 12.161 | 7.410 | 4.492 | 3.307 |
| TPZ | Lhasa | 15.057 | 17.569 | 20.352 | 22.874 | 25.299 | 25.862 | 22.668 | 21.951 | 21.205 | 18.407 | 16.164 | 14.415 |
| TPZ | Nagqu | 14.408 | 14.884 | 19.939 | 22.281 | 21.559 | 24.003 | 21.835 | 21.291 | 18.503 | 18.451 | 17.801 | 14.235 |
| TPZ | Xining | 10.700 | 12.703 | 16.434 | 20.058 | 20.161 | 21.389 | 20.452 | 20.352 | 16.429 | 13.258 | 10.886 | 8.845 |
| Climates | Station | Month | |||||||||||
|---|---|---|---|---|---|---|---|---|---|---|---|---|---|
| Jan. | Feb. | Mar. | Apr. | May | Jun. | Jul. | Aug. | Sep. | Oct. | Nov. | Dec. | ||
| TZ | Haikou | 2.1742 | 1.7857 | 1.8129 | 2.2500 | 1.8065 | 2.0100 | 1.8000 | 1.7194 | 1.5367 | 2.2161 | 2.3200 | 3.1839 |
| TZ | Sanya | 1.7387 | 1.8786 | 1.4032 | 1.4633 | 1.7839 | 1.8767 | 1.5097 | 1.2323 | 1.7767 | 2.0677 | 1.9233 | 1.8032 |
| SZ | Changsha | 2.1065 | 2.1179 | 2.4903 | 1.8500 | 1.8839 | 1.9400 | 2.2677 | 2.6258 | 2.0733 | 2.0774 | 2.1733 | 2.0097 |
| SZ | Chengdu | 0.8871 | 1.0643 | 1.3742 | 1.9067 | 1.7774 | 1.8667 | 1.3161 | 1.1871 | 1.5833 | 0.9032 | 1.0133 | 0.8774 |
| SZ | Fuzhou | 2.2968 | 1.9607 | 2.3871 | 2.2700 | 2.5677 | 2.9467 | 2.9484 | 2.5710 | 2.7867 | 2.6548 | 2.5067 | 2.4032 |
| SZ | Guangzhou | 1.5935 | 1.4250 | 1.8935 | 1.7500 | 1.5258 | 1.8833 | 1.5774 | 1.3742 | 1.2733 | 1.6484 | 1.6067 | 1.5903 |
| SZ | Guiyang | 2.6161 | 3.1107 | 2.6613 | 2.7433 | 2.6258 | 2.2467 | 2.4903 | 2.2000 | 2.3533 | 2.3871 | 2.3733 | 2.2161 |
| SZ | Hangzhou | 1.9194 | 2.0500 | 1.9968 | 2.2600 | 2.2484 | 1.9367 | 2.0065 | 2.0871 | 2.2433 | 1.5645 | 1.6733 | 1.7806 |
| SZ | Hefei | 2.8097 | 2.6750 | 3.0871 | 2.6433 | 2.4226 | 2.1233 | 2.7484 | 2.6161 | 2.3200 | 2.0984 | 2.4767 | 1.9323 |
| SZ | Kunming | 2.1194 | 2.9464 | 2.1258 | 2.4067 | 2.8000 | 1.8433 | 2.0258 | 2.1065 | 2.0467 | 2.1323 | 1.3700 | 1.3968 |
| SZ | Nanchang | 1.8194 | 2.2357 | 1.7839 | 1.6467 | 1.8226 | 1.6133 | 2.1032 | 1.7903 | 2.2433 | 1.6839 | 1.7500 | 1.7968 |
| SZ | Nanjing | 2.4161 | 1.9000 | 2.5387 | 2.2767 | 1.9581 | 2.0533 | 1.9387 | 2.2742 | 1.9167 | 1.8581 | 2.3733 | 2.0548 |
| SZ | Nanning | 1.5968 | 1.4214 | 1.4839 | 1.6733 | 1.3548 | 1.3967 | 1.7161 | 1.6516 | 1.4800 | 1.1355 | 1.3767 | 1.4645 |
| SZ | Shanghai | 2.5968 | 2.5286 | 2.9806 | 3.1467 | 3.2774 | 2.5467 | 2.9774 | 3.9871 | 2.7167 | 2.9097 | 2.3567 | 2.7355 |
| SZ | Wuhan | 1.3516 | 0.9536 | 1.2677 | 1.2900 | 1.3194 | 1.2933 | 1.1129 | 1.6258 | 1.4833 | 1.0548 | 0.8900 | 1.1871 |
| WTZ | Beijing | 2.4516 | 2.3357 | 2.8710 | 2.8500 | 2.9387 | 2.4033 | 2.0419 | 1.9387 | 1.7767 | 1.7516 | 2.1767 | 2.2968 |
| WTZ | Jinan | 3.0548 | 2.0821 | 3.2710 | 3.2000 | 2.7065 | 2.5433 | 2.0806 | 2.7774 | 2.5667 | 2.9710 | 2.8600 | 2.6710 |
| WTZ | Kashgar | 1.3645 | 1.4857 | 1.5452 | 1.9967 | 2.0581 | 2.5667 | 2.1516 | 2.1968 | 1.5667 | 1.3645 | 1.2833 | 1.1774 |
| WTZ | Lanzhou | 0.4323 | 0.5536 | 0.7839 | 1.0100 | 1.2065 | 1.3367 | 1.4516 | 0.8548 | 1.0900 | 0.4516 | 0.4967 | 0.2065 |
| WTZ | Taiyuan | 1.7323 | 2.1607 | 2.2194 | 2.0533 | 2.7419 | 2.0400 | 1.0161 | 1.2806 | 1.1667 | 1.4290 | 1.7967 | 1.6645 |
| WTZ | Tianjin | 2.3742 | 2.4500 | 2.9548 | 3.3067 | 2.4355 | 2.2933 | 2.1484 | 1.7613 | 1.8133 | 2.4387 | 2.3567 | 2.1903 |
| WTZ | Xian | 1.5226 | 0.9429 | 1.9903 | 1.9767 | 2.0677 | 1.0733 | 1.5484 | 1.9968 | 1.4967 | 0.7484 | 1.1533 | 1.2710 |
| WTZ | Zhengzhou | 2.1871 | 2.0786 | 2.0839 | 2.3433 | 2.4161 | 2.3567 | 2.0774 | 2.1387 | 1.7800 | 1.5871 | 1.8833 | 1.8774 |
| MTZ | Changchun | 2.8387 | 3.3500 | 3.9935 | 3.8067 | 3.5806 | 3.0867 | 2.7516 | 2.3387 | 2.5867 | 2.9645 | 3.4633 | 2.8710 |
| MTZ | Dongsheng | 2.3290 | 2.5143 | 2.7065 | 3.8667 | 3.5129 | 2.8767 | 2.5097 | 2.6677 | 2.3867 | 2.5194 | 2.8033 | 3.1355 |
| MTZ | Hami | 1.3871 | 1.3000 | 1.7387 | 1.3400 | 1.5871 | 1.2800 | 1.2516 | 1.2774 | 1.0367 | 1.0484 | 1.1833 | 1.2903 |
| MTZ | Harbin | 2.5194 | 2.1321 | 2.4645 | 2.9467 | 3.3677 | 3.1600 | 1.9097 | 1.8226 | 2.4533 | 2.1387 | 3.0100 | 2.5839 |
| MTZ | Jiamusi | 1.9323 | 2.5750 | 3.5903 | 3.1267 | 3.2903 | 2.3900 | 2.1194 | 2.7161 | 2.3133 | 2.8452 | 2.9833 | 2.8000 |
| MTZ | Shenyang | 2.0032 | 2.6143 | 2.8161 | 3.4500 | 2.7903 | 2.3867 | 2.3000 | 1.8032 | 2.2067 | 2.7226 | 2.4600 | 2.4484 |
| MTZ | Urumqi | 1.5355 | 1.6714 | 2.0839 | 2.9467 | 2.6290 | 2.4300 | 2.4968 | 2.4742 | 2.3433 | 2.1161 | 1.8033 | 1.6000 |
| MTZ | Yinchuan | 1.7935 | 2.1071 | 2.1484 | 3.4600 | 2.1968 | 2.8400 | 1.8548 | 1.7097 | 1.9967 | 1.4452 | 2.0300 | 2.0613 |
| CTZ | Mohe | 0.6161 | 0.6966 | 2.1129 | 2.5967 | 2.5806 | 2.0267 | 1.6194 | 1.7000 | 1.8933 | 2.2839 | 1.4733 | 1.1194 |
| TPZ | Lhasa | 2.1516 | 1.4821 | 1.8452 | 1.7967 | 2.1871 | 1.9800 | 1.7226 | 1.8484 | 1.5800 | 1.4032 | 1.0700 | 1.3452 |
| TPZ | Nagqu | 1.6258 | 2.3429 | 3.1226 | 3.0767 | 2.6194 | 2.2567 | 2.0613 | 1.9032 | 1.7100 | 2.2968 | 1.5333 | 2.1677 |
| TPZ | Xining | 0.8516 | 0.8857 | 1.0258 | 1.3833 | 1.1742 | 1.0767 | 0.8613 | 0.9290 | 0.7867 | 0.7839 | 0.6900 | 0.7484 |
| Month | Station | 90% Confidence Level | Forecasting Mean Results | Station | 90% Confidence Level | Forecasting Mean Results |
|---|---|---|---|---|---|---|
| Jan. | Haikou (TZ) | [5.28, 12.46] | 8.87 | Shanghai (SZ) | [4.47, 11.19] | 7.83 |
| Feb. | [6.92, 14.07] | 10.49 | [3.74, 10.50] | 7.12 | ||
| Mar. | [8.95, 15.71] | 12.33 | [8.78, 15.47] | 12.13 | ||
| Apr. | [12.66, 19.39] | 16.03 | [12.50, 19.32] | 15.91 | ||
| May | [16.88, 23.73] | 20.30 | [12.81, 19.49] | 16.15 | ||
| Jun. | [16.29, 23.28] | 19.79 | [9.71, 16.41] | 13.06 | ||
| Jul. | [16.29, 23.22] | 19.76 | [13.43, 20.65] | 17.04 | ||
| Aug. | [16.33, 23.05] | 19.69 | [12.83, 19.92] | 16.38 | ||
| Sep. | [15.42, 22.41] | 18.91 | [10.67, 17.32] | 13.99 | ||
| Oct. | [12.10, 18.94] | 15.52 | [9.10, 15.76] | 12.43 | ||
| Nov. | [9.42, 16.31] | 12.87 | [5.76, 12.52] | 9.14 | ||
| Dec. | [4.94, 11.97] | 8.45 | [4.56, 11.40] | 7.68 | ||
| Jan. | Zhengzhou (WTZ) | [3.75, 9.35] | 6.55 | Yinchuan (MTZ) | [6.58, 11.55] | 9.07 |
| Feb. | [5.85, 11.39] | 8.62 | [9.63, 14.61] | 12.12 | ||
| Mar. | [10.05, 15.54] | 12.80 | [14.07, 18.95] | 16.51 | ||
| Apr. | [13.51, 19.01] | 16.26 | [17.02, 21.88] | 19.45 | ||
| May | [15.05, 20.57] | 17.80 | [18.22, 23.13] | 20.67 | ||
| Jun. | [15.51, 21.07] | 18.29 | [18.30, 22.18] | 20.74 | ||
| Jul. | [14.90, 20.38] | 17.64 | [17.69, 22.58] | 20.14 | ||
| Aug. | [13.75, 19.40] | 16.57 | [16.55, 21.37] | 18.96 | ||
| Sep. | [10.69, 16.25] | 13.47 | [13.04, 17.88] | 15.46 | ||
| Oct. | [9.25, 14.74] | 11.99 | [10.92, 15.82] | 13.37 | ||
| Nov. | [5.96, 11.65] | 8.81 | [7.02, 12.09] | 9.56 | ||
| Dec. | [4.40, 9.99] | 7.19 | [6.29, 11.26] | 8.77 | ||
| Jan. | Lhasa (TPZ) | [12.99, 17.08] | 15.04 | |||
| Feb. | [15.93, 20.05] | 17.9 | ||||
| Mar. | [18.92, 23.03] | 20.98 | ||||
| Apr. | [20.16, 24.27] | 22.22 | ||||
| May | [22.62, 26.79] | 24.71 | ||||
| Jun. | [23.51, 27.67] | 25.59 | ||||
| Jul. | [21.71, 25.88] | 23.79 | ||||
| Aug. | [19.77, 23.91] | 21.84 | ||||
| Sep. | [18.59, 22.71] | 20.65 | ||||
| Oct. | [16.33, 20.46] | 18.39 | ||||
| Nov. | [13.92, 18.04] | 15.98 | ||||
| Dec. | [12.02, 16.19] | 14.11 |
References
- Zang, H.; Xu, Q.; Bian, H. Generation of typical solar radiation data for different climates of China. Energy 2012, 38, 236–248. [Google Scholar] [CrossRef]
- Li, H.; Cao, F.; Bu, X.; Zhao, L. Models for calculating daily global solar radiation from air temperature in humid regions—A case study. Environ. Prog. Sustain. Energy 2015, 34, 595–599. [Google Scholar] [CrossRef]
- Li, H.; Lo, K.; Wang, M.; Zhang, P.; Xue, L. Industrial Energy Consumption in Northeast China under the Revitalisation Strategy: A Decomposition and Policy Analysis. Energies 2016, 9, 549. [Google Scholar] [CrossRef]
- Noorollahi, E.; Fadai, D.; Akbarpour Shirazi, M.; Ghodsipour, S. Land Suitability Analysis for Solar Farms Exploitation Using GIS and Fuzzy Analytic Hierarchy Process (FAHP)—A Case Study of Iran. Energies 2016, 9, 643. [Google Scholar] [CrossRef]
- Corona, B.; Ruiz, D.; San Miguel, G. Life Cycle Assessment of a HYSOL Concentrated Solar Power Plant: Analyzing the Effect of Geographic Location. Energies 2016, 9, 413. [Google Scholar] [CrossRef] [Green Version]
- Grantham, A.; Gel, Y.R.; Boland, J. Nonparametric short-term probabilistic forecasting for solar radiation. Sol. Energy 2016, 133, 465–475. [Google Scholar] [CrossRef]
- Zang, H.; Xu, Q.; Du, P.; Ichiyanagi, K. A Modified Method to Generate Typical Meteorological Years from the Long-Term Weather Database. Int. J. Photoenergy 2012, 2012, 538279. [Google Scholar] [CrossRef]
- Muñoz, J.; Perpiñán, O. A simple model for the prediction of yearly energy yields for grid-connected PV systems starting from monthly meteorological data. Renew. Energy 2016, 97, 680–688. [Google Scholar] [CrossRef]
- Chicco, G.; Cocina, V.; Di Leo, P.; Spertino, F.; Massi Pavan, A. Error Assessment of Solar Irradiance Forecasts and AC Power from Energy Conversion Model in Grid-Connected Photovoltaic Systems. Energies 2016, 9, 8. [Google Scholar] [CrossRef] [Green Version]
- Zhou, J.; Wu, Y.Z.; Yan, G. Generation of typical solar radiation year for China. Renew. Energy 2006, 31, 1972–1985. [Google Scholar] [CrossRef]
- Yang, L.; Lam, J.C.; Liu, J.P. Analysis of typical meteorological years in different climates of China. Energy Convers. Manag. 2007, 48, 654–668. [Google Scholar] [CrossRef]
- Skeiker, K. Generation of a typical meteorological year for Damascus zone using the Filkenstein-Schafer statistical method. Energy Convers. Manag. 2004, 45, 99–112. [Google Scholar] [CrossRef]
- Kalogirou, S.A. Generation of typical meteorological year (TMY-2) for Nicosia, Cyprus. Renew. Energy 2003, 28, 2317–2334. [Google Scholar] [CrossRef]
- Bre, F.; Fachinotti, V.D. Generation of typical meteorological years for the Argentine Littoral Region. Energy Build. 2016, 129, 432–444. [Google Scholar] [CrossRef]
- Al-Azri, N.A. Development of a typical meteorological year based on dry bulb temperature and dew point for passive cooling applications. Energy Sustain. Dev. 2016, 33, 61–74. [Google Scholar] [CrossRef]
- Rosenfelder, M.; Koppe, C.; Pfafferott, J.; Matzarakis, A. Effects of ventilation behaviour on indoor heat load based on test reference years. Int. J. Biometeorol. 2016, 60, 277–287. [Google Scholar] [CrossRef] [PubMed]
- Handbook, A. Fundamentals Volume; American Society of Heating, Refrigerating, and Air-Conditioning Engineers, Inc.: Atlanta, GA, USA, 1989. [Google Scholar]
- Janjai, S.; Deeyai, P. Comparison of methods for generating typical meteorological year using meteorological data from a tropical environment. Appl. Energy 2009, 86, 528–537. [Google Scholar] [CrossRef]
- Skeiker, K. Comparison of methodologies for TMY generation using 10 years data for Damascus, Syria. Energy Convers. Manag. 2007, 48, 2090–2102. [Google Scholar] [CrossRef]
- Ohunakin, O.S.; Adaramola, M.S.; Oyewola, O.M.; Fagbenle, R.O. Generation of a typical meteorological year for north–east, Nigeria. Appl. Energy 2013, 112, 152–159. [Google Scholar] [CrossRef]
- Crow, L.W. Weather year for energy calculations. ASHRAE J. 1984, 26, 42–47. [Google Scholar]
- Lund, H. The Design Reference Year User's Manual; Thermal Insulation Laboratory, Technical University of Denmark: Lyngby, Denmark, 1995. [Google Scholar]
- Festa, R.; Ratto, C.F. Proposal of a numerical procedure to select Reference Years. Sol. Energy 1993, 50, 9–17. [Google Scholar] [CrossRef]
- De Miguel, A.; Bilbao, J. Test reference year generation from meteorological and simulated solar radiation data. Sol. Energy 2005, 78, 695–703. [Google Scholar] [CrossRef]
- Gazela, M.; Mathioulakis, E. A new method for typical weather data selection to evaluate long-term performance of solar energy systems. Sol. Energy 2001, 70, 339–348. [Google Scholar] [CrossRef]
- Pissimanis, D.; Karras, G.; Notaridou, V.; Gavra, K. The generation of a “typical meteorological year” for the city of Athens. Sol. Energy 1988, 40, 405–411. [Google Scholar] [CrossRef]
- Fernández, M.D.; López, J.C.; Baeza, E.; Céspedes, A.; Meca, D.E.; Bailey, B. Generation and evaluation of typical meteorological year datasets for greenhouse and external conditions on the Mediterranean coast. Int. J. Biometeorol. 2015, 59, 1067–1081. [Google Scholar] [CrossRef] [PubMed]
- Chan, A.L.S. Generation of typical meteorological years using genetic algorithm for different energy systems. Renew. Energy 2016, 90, 1–13. [Google Scholar] [CrossRef]
- Chan, A.L.S.; Chow, T.T.; Fong, S.K.F.; Lin, J.Z. Generation of a typical meteorological year for Hong Kong. Energy Convers. Manag. 2006, 47, 87–96. [Google Scholar] [CrossRef]
- Argiriou, A.; Lykoudis, S.; Kontoyiannidis, S.; Balaras, C.A.; Asimakopoulos, D.; Petrakis, M.; Kassomenos, P. Comparison of methodologies for tmy generation using 20 years data for Athens, Greece. Sol. Energy 1999, 66, 33–45. [Google Scholar] [CrossRef]
- Yang, L.; Wan, K.K.W.; Li, D.H.W.; Lam, J.C. A new method to develop typical weather years in different climates for building energy use studies. Energy 2011, 36, 6121–6129. [Google Scholar] [CrossRef]
- Zhang, Q. Development of the typical meteorological database for Chinese locations. Energy Build. 2006, 38, 1320–1326. [Google Scholar] [CrossRef]
- Chow, T.T.; Chan, A.L.S.; Fong, K.F.; Lin, Z. Some perceptions on typical weather year—From the observations of Hong Kong and Macau. Sol. Energy 2006, 80, 459–467. [Google Scholar] [CrossRef]
- Jiang, Y.N. Generation of typical meteorological year for different climates of China. Energy 2010, 35, 1946–1953. [Google Scholar] [CrossRef]
- Xu, Q.; Zang, H. Comments on “Generation of typical meteorological year for different climates of China” [Energy, 35 (2010) 1946–1953]. Energy 2011, 36, 6285–6288. [Google Scholar] [CrossRef]
- Qu, Z.; Zhou, G. Possible Impact of Climate Change on the Quality of Apples from the Major Producing Areas of China. Atmosphere 2016, 7, 113. [Google Scholar] [CrossRef]
- Zang, H.; Guo, M.; Wei, Z.; Sun, G. Determination of the Optimal Tilt Angle of Solar Collectors for Different Climates of China. Sustainability 2016, 8, 654. [Google Scholar] [CrossRef]
- Qing, W.; Chen, R.; Sun, W. Estimation of global radiation in China and comparison with satellite product. Environ. Earth Sci. 2013, 70, 1681–1687. [Google Scholar] [CrossRef]
- Lund, H.; Eidorff, S. Selection Methods for Production of Test Reference Years; Thermal Insulation Laboratory, Technical University of Denmark: Lyngby, Denmark, 1981. [Google Scholar]
- Finkelstein, J.M.; Schafer, R.E. Improved goodness-of-fit tests. Biometrika 1971, 58, 641–645. [Google Scholar] [CrossRef]
- Pusat, S.; Ekmekçi, İ.; Akkoyunlu, M.T. Generation of typical meteorological year for different climates of Turkey. Renew. Energy 2015, 75, 144–151. [Google Scholar] [CrossRef]
- Ohunakin, O.S.; Adaramola, M.S.; Oyewola, O.M.; Fagbenle, R.L.; Abam, F.I. A Typical Meteorological Year Generation Based on NASA Satellite Imagery (GEOS-I) for Sokoto, Nigeria. Int. J. Photoenergy 2014, 2014, 468562. [Google Scholar] [CrossRef]
- Kumar, S.; Hegde, R.M.; Trigoni, N. Gaussian Process Regression for Fingerprinting based Localization. Ad Hoc Netw. 2016, 51, 1–10. [Google Scholar] [CrossRef]
- Wang, Y.; Chaib-draa, B. An online Bayesian filtering framework for Gaussian process regression: Application to global surface temperature analysis. Expert Syst. Appl. 2017, 67, 285–295. [Google Scholar] [CrossRef]
- Filik, T. Improved Spatio-Temporal Linear Models for Very Short-Term Wind Speed Forecasting. Energies 2016, 9, 168. [Google Scholar] [CrossRef]
- Wan, C.; Xu, Z.; Pinson, P. Direct interval forecasting of wind power. IEEE Trans. Power Syst. 2013, 28, 4877–4878. [Google Scholar] [CrossRef]


| Number | Location | Latitude (N) | Longitude (E) | Elevation (m) | Climates | Period | Total Years |
|---|---|---|---|---|---|---|---|
| 1 | Haikou | 20°02′ | 110°21′ | 14 | TZ | 1994–2015 | 22 |
| 2 | Sanya | 18°14′ | 109°31′ | 6 | TZ | 1994–2015 | 22 |
| 3 | Changsha | 28°13′ | 112°55′ | 68 | SZ | 1994–2015 | 22 |
| 4 | Chengdu | 30°40′ | 104°01′ | 506 | SZ | 1994–2003 | 10 |
| 5 | Fuzhou | 26°05′ | 119°17′ | 84 | SZ | 1994–2015 | 22 |
| 6 | Guangzhou | 23°10′ | 113°20′ | 41 | SZ | 1994–2015 | 22 |
| 7 | Guiyang | 26°35′ | 106°44′ | 1224 | SZ | 1994–2013 | 20 |
| 8 | Hangzhou | 30°14′ | 120°10′ | 42 | SZ | 1994–2015 | 22 |
| 9 | Hefei | 31°52′ | 117°14′ | 28 | SZ | 1994–2015 | 22 |
| 10 | Kunming | 25°01′ | 102°41′ | 1892 | SZ | 1994–2015 | 22 |
| 11 | Nanchang | 28°36′ | 115°55′ | 47 | SZ | 1994–2015 | 22 |
| 12 | Nanjing | 32°00′ | 118°48′ | 7 | SZ | 1994–2015 | 22 |
| 13 | Nanning | 22°38′ | 108°13′ | 122 | SZ | 1994–2015 | 22 |
| 14 | Shanghai | 31°24′ | 121°29′ | 6 | SZ | 1994–2015 | 22 |
| 15 | Wuhan | 30°37′ | 114°08′ | 23 | SZ | 1994–2015 | 22 |
| 16 | Beijing | 39°48′ | 116°28′ | 31 | WTZ | 1994–2015 | 22 |
| 17 | Jinan | 36°36′ | 117°03′ | 170 | WTZ | 1994–2015 | 22 |
| 18 | Kashgar | 39°28′ | 75°59′ | 1289 | WTZ | 1994–2015 | 22 |
| 19 | Lanzhou | 36°03′ | 103°53′ | 1517 | WTZ | 1994–2003 | 10 |
| 20 | Taiyuan | 37°47′ | 112°33′ | 778 | WTZ | 1994–2015 | 22 |
| 21 | Tianjin | 39°05′ | 117°04′ | 3 | WTZ | 1994–2015 | 22 |
| 22 | Xian | 34°18′ | 108°56′ | 398 | WTZ | 1994–2004 | 11 |
| 23 | Zhengzhou | 34°43′ | 113°39′ | 110 | WTZ | 1994–2015 | 22 |
| 24 | Changchun | 43°54′ | 125°13′ | 237 | MTZ | 1994–2015 | 22 |
| 25 | Dongsheng | 39°50′ | 109°59′ | 1460 | MTZ | 1994–2015 | 22 |
| 26 | Hami | 42°49′ | 93°31′ | 737 | MTZ | 1994–2015 | 22 |
| 27 | Harbin | 45°45′ | 126°46′ | 142 | MTZ | 1994–2015 | 22 |
| 28 | Jiamusi | 46°49′ | 130°17′ | 81 | MTZ | 1994–2015 | 22 |
| 29 | Shenyang | 41°44′ | 123°27′ | 45 | MTZ | 1994–2015 | 22 |
| 30 | Urumqi | 43°47′ | 87°39′ | 935 | MTZ | 1994–2015 | 22 |
| 31 | Yinchuan | 38°29′ | 106°13′ | 1111 | MTZ | 1994–2015 | 22 |
| 32 | Mohe | 53°28′ | 122°31′ | 433 | CTZ | 1997–2007 | 11 |
| 33 | Lhasa | 29°40′ | 91°08′ | 3649 | TPZ | 1994–2015 | 22 |
| 34 | Nagqu | 31°29′ | 92°04′ | 4507 | TPZ | 1994–2015 | 22 |
| 35 | Xining | 36°43′ | 101°45′ | 2295 | TPZ | 1994–2015 | 22 |
| Parameter Indices | Ref. [12,26] | [17,33] | [41] | [13] | [34] | Present Article |
|---|---|---|---|---|---|---|
| Max Dry-Bulb Temperature | 1/24 | 5/100 | 1/20 | 1/32 | 1/20 | 1/24 |
| Min Dry-Bulb Temperature | 1/24 | 5/100 | 1/20 | 1/32 | 1/20 | 1/24 |
| Mean Dry-Bulb Temperature | 2/24 | 30/100 | 2/20 | 2/32 | 3/20 | 3/24 |
| Range Dry-Bulb Temperature | – | – | – | 1/32 | – | – |
| Max Relative Humidity | 1/24 | 2.5/100 | 1/20 | 1/32 | – | – |
| Min Relative Humidity | 1/24 | 2.5/100 | 1/20 | 1/32 | 1/20 | 1/24 |
| Mean Relative Humidity | 2/24 | 5/100 | 2/20 | 2/32 | 2/20 | 2/24 |
| Range Relative Humidity | – | – | – | 1/32 | – | – |
| Max Wind Speed | 2/24 | 5/100 | 1/20 | 1/32 | 1/20 | 2/24 |
| Min Wind Speed | – | – | – | 1/32 | – | – |
| Mean Wind Speed | 2/24 | 5/100 | 1/20 | 2/32 | 1/20 | 2/24 |
| Range Wind Speed | – | – | – | 1/32 | – | – |
| Mean Wind direction | – | – | – | 1/32 | – | – |
| Global Solar Radiation | 12/24 | 40/100 | 5/20 | 8/32 | 5/20 | 12/24 |
| Direct Solar Radiation | – | – | 5/20 | 8/32 | 5/20 | – |
| Station | Method | Month | |||||||||||
|---|---|---|---|---|---|---|---|---|---|---|---|---|---|
| Jan. | Feb. | Mar. | Apr. | May | Jun. | Jul. | Aug. | Sep. | Oct. | Nov. | Dec. | ||
| Haikou (TZ) | TMY_D | 1994 | 2006 | 1997 | 1998 | 2004 | 2010 | 1998 | 2003 | 2001 | 1999 | 2003 | 2009 |
| TMY_F | 1996 | 1998 | 1999 | 1999 | 1994 | 2003 | 2000 | 1999 | 2000 | 2000 | 1996 | 2015 | |
| TMY_M | 1994 | 1994 | 2001 | 1998 | 2004 | 2000 | 1998 | 1996 | 2000 | 1996 | 1996 | 1998 | |
| Shanghai (SZ) | TMY_D | 1994 | 2003 | 2000 | 2000 | 2004 | 1995 | 1996 | 2005 | 2013 | 1997 | 1996 | 2009 |
| TMY_F | 1996 | 1997 | 2012 | 1997 | 2004 | 2007 | 2010 | 2005 | 1994 | 2013 | 2014 | 2006 | |
| TMY_M | 2010 | 2011 | 1995 | 2000 | 2000 | 2003 | 2012 | 2005 | 2013 | 1997 | 1999 | 2011 | |
| Zhengzhou (WTZ) | TMY_D | 1998 | 1997 | 2015 | 2009 | 2015 | 2013 | 2002 | 2012 | 2000 | 2011 | 1999 | 1997 |
| TMY_F | 1997 | 1994 | 1995 | 2007 | 2010 | 2001 | 1999 | 2009 | 2000 | 2011 | 1999 | 2006 | |
| TMY_M | 1997 | 1998 | 2013 | 2007 | 2015 | 1998 | 2009 | 2002 | 2000 | 2008 | 1998 | 1998 | |
| Yinchuan (MTZ) | TMY_D | 2010 | 2013 | 2012 | 2003 | 2008 | 2002 | 2015 | 2008 | 2000 | 2013 | 2005 | 2004 |
| TMY_F | 2010 | 2006 | 2005 | 2012 | 1999 | 1995 | 2007 | 2000 | 2000 | 2010 | 1999 | 2006 | |
| TMY_M | 2007 | 2003 | 2005 | 2007 | 2012 | 2003 | 2007 | 2008 | 1999 | 2003 | 2007 | 2003 | |
| Mohe (CTZ) | TMY_D | 2000 | 2004 | 2004 | 2001 | 2003 | 2005 | 2002 | 2007 | 1998 | 2000 | 2005 | 2001 |
| TMY_F | 2003 | 2007 | 2000 | 1998 | 2005 | 2002 | 2007 | 1999 | 2003 | 2003 | 1999 | 2002 | |
| TMY_M | 2003 | 2000 | 2006 | 2003 | 2004 | 1999 | 2006 | 2006 | 2007 | 2005 | 2005 | 2004 | |
| Lhasa (TPZ) | TMY_D | 1998 | 2010 | 2005 | 2005 | 2010 | 1997 | 1999 | 2001 | 2006 | 1999 | 1998 | 2003 |
| TMY_F | 1994 | 2007 | 2008 | 2008 | 2011 | 2006 | 1999 | 2010 | 2001 | 2010 | 1999 | 2000 | |
| TMY_M | 2001 | 1999 | 2009 | 2008 | 1994 | 1994 | 2014 | 2014 | 2001 | 2000 | 2012 | 2001 | |
| Month | Method | TMY_D | TMY_F | TMY_M |
|---|---|---|---|---|
| Jan. | Year | 1998 | 1994 | 2001 |
| ERMSD | 0.286 | 0.313 | 0.293 | |
| Feb. | Year | 2010 | 2007 | 1999 |
| ERMSD | 0.330 | 0.331 | 0.350 | |
| Mar. | Year | 2005 | 2008 | 2009 |
| ERMSD | 0.328 | 0.297 | 0.380 | |
| Apr. | Year | 2005 | 2008 | 2008 |
| ERMSD | 0.410 | 0.360 | 0.390 | |
| May | Year | 2010 | 2011 | 1994 |
| ERMSD | 0.351 | 0.394 | 0.453 | |
| Jun. | Year | 1997 | 2006 | 1994 |
| ERMSD | 0.397 | 0.334 | 0.350 | |
| Jul. | Year | 1999 | 1999 | 2014 |
| ERMSD | 0.327 | 0.322 | 0.329 | |
| Aug. | Year | 2001 | 2010 | 2014 |
| ERMSD | 0.310 | 0.340 | 0.297 | |
| Sep. | Year | 2006 | 2001 | 2001 |
| ERMSD | 0.331 | 0.219 | 0.247 | |
| Oct. | Year | 1999 | 2010 | 2000 |
| ERMSD | 0.366 | 0.283 | 0.299 | |
| Nov. | Year | 1998 | 1999 | 2012 |
| ERMSD | 0.291 | 0.239 | 0.293 | |
| Dec. | Year | 2003 | 2000 | 2001 |
| ERMSD | 0.273 | 0.253 | 0.259 |
| Climates | Station | Month | |||||||||||
|---|---|---|---|---|---|---|---|---|---|---|---|---|---|
| Jan. | Feb. | Mar. | Apr. | May | Jun. | Jul. | Aug. | Sep. | Oct. | Nov. | Dec. | ||
| TZ | Haikou | 1996 | 2006 | 1997 | 1998 | 2004 | 2003 | 2000 | 1999 | 2001 | 1996 | 1996 | 2015 |
| TZ | Sanya | 2002 | 2002 | 2002 | 2002 | 1996 | 2003 | 2004 | 1994 | 2000 | 1999 | 2003 | 2004 |
| SZ | Changsha | 2004 | 1997 | 2015 | 2014 | 2012 | 2003 | 2008 | 1995 | 2004 | 2012 | 1999 | 2006 |
| SZ | Chengdu | 1994 | 1998 | 1995 | 2003 | 2002 | 1998 | 2000 | 1995 | 2003 | 1999 | 2001 | 1994 |
| SZ | Fuzhou | 2007 | 2015 | 1995 | 2008 | 2002 | 1994 | 1998 | 2008 | 2007 | 2001 | 2004 | 2006 |
| SZ | Guangzhou | 2007 | 2002 | 2003 | 1997 | 2010 | 2002 | 2008 | 2001 | 2004 | 1999 | 1999 | 1996 |
| SZ | Guiyang | 2006 | 2002 | 2005 | 2005 | 2012 | 2007 | 2009 | 2007 | 2006 | 2010 | 2004 | 2010 |
| SZ | Hangzhou | 1995 | 2003 | 2015 | 1997 | 2015 | 2014 | 2011 | 2011 | 2008 | 2008 | 2010 | 2006 |
| SZ | Hefei | 1995 | 2003 | 2015 | 1997 | 2015 | 2014 | 2011 | 2011 | 2008 | 2008 | 2010 | 2006 |
| SZ | Kunming | 1998 | 2015 | 2001 | 2002 | 2013 | 2004 | 2014 | 2008 | 2008 | 2006 | 2000 | 2000 |
| SZ | Nanchang | 2004 | 1995 | 2014 | 2014 | 1998 | 2007 | 2008 | 2008 | 2009 | 2015 | 1999 | 2006 |
| SZ | Nanjing | 2013 | 1997 | 1994 | 2000 | 2000 | 2007 | 2002 | 1996 | 2007 | 2005 | 1996 | 2013 |
| SZ | Nanning | 2007 | 2011 | 2005 | 2008 | 2002 | 2014 | 2008 | 2012 | 2012 | 2014 | 2013 | 2010 |
| SZ | Shanghai | 1994 | 2011 | 1995 | 2000 | 2004 | 2003 | 2010 | 2005 | 2013 | 2013 | 2014 | 2011 |
| SZ | Wuhan | 2006 | 1997 | 2006 | 2001 | 2005 | 2014 | 2004 | 1995 | 2007 | 2008 | 1997 | 2006 |
| WTZ | Beijing | 2005 | 2015 | 2004 | 1997 | 2000 | 2006 | 2008 | 2011 | 2000 | 2013 | 2004 | 2000 |
| WTZ | Jinan | 2005 | 2015 | 2008 | 2009 | 2015 | 2010 | 2010 | 2001 | 1996 | 2005 | 2007 | 2006 |
| WTZ | Kashgar | 2005 | 2013 | 2005 | 2010 | 2011 | 2006 | 2008 | 2003 | 2006 | 2008 | 1999 | 2006 |
| WTZ | Lanzhou | 2000 | 1994 | 2000 | 2000 | 1999 | 2001 | 2002 | 2000 | 1996 | 1998 | 1997 | 2003 |
| WTZ | Taiyuan | 2007 | 1995 | 2008 | 2009 | 2005 | 2006 | 2002 | 2011 | 2000 | 2008 | 2001 | 2006 |
| WTZ | Tianjin | 2005 | 2011 | 2009 | 2004 | 2003 | 2007 | 2005 | 2002 | 2005 | 2012 | 2004 | 1996 |
| WTZ | Xian | 1995 | 2001 | 1995 | 1995 | 1997 | 2002 | 2000 | 1999 | 1999 | 2001 | 2004 | 1997 |
| WTZ | Zhengzhou | 1997 | 1997 | 2015 | 2007 | 2010 | 2001 | 2009 | 2002 | 2000 | 2008 | 1998 | 2006 |
| MTZ | Changchun | 2004 | 1997 | 2006 | 2011 | 2013 | 2011 | 2002 | 2005 | 2006 | 2006 | 2006 | 1995 |
| MTZ | Dongsheng | 1997 | 2011 | 2000 | 2000 | 1996 | 2006 | 2004 | 2013 | 2011 | 2008 | 2002 | 1999 |
| MTZ | Hami | 2008 | 2015 | 2009 | 1997 | 2009 | 2006 | 2014 | 2006 | 2008 | 2006 | 2011 | 2006 |
| MTZ | Harbin | 2003 | 1994 | 2009 | 2004 | 2001 | 1995 | 2008 | 2005 | 2004 | 2008 | 2001 | 1996 |
| MTZ | Jiamusi | 2005 | 2013 | 2000 | 2001 | 2003 | 2015 | 2010 | 1995 | 2002 | 2008 | 2008 | 1994 |
| MTZ | Shenyang | 2009 | 2003 | 2009 | 2000 | 2007 | 2013 | 2005 | 2008 | 2006 | 2006 | 2004 | 2003 |
| MTZ | Urumqi | 2012 | 2009 | 2006 | 2009 | 2005 | 2014 | 1994 | 2004 | 2013 | 2008 | 2005 | 2011 |
| MTZ | Yinchuan | 2007 | 2003 | 2012 | 2003 | 2008 | 2003 | 2007 | 2008 | 2000 | 2010 | 1999 | 2003 |
| CTZ | Mohe | 2003 | 2004 | 2006 | 2003 | 2005 | 2002 | 2002 | 2007 | 2003 | 2003 | 2005 | 2001 |
| TPZ | Lhasa | 1998 | 2010 | 2008 | 2008 | 2010 | 2006 | 1999 | 2014 | 2001 | 2010 | 1999 | 2000 |
| TPZ | Nagqu | 2010 | 2007 | 2003 | 2003 | 2015 | 2009 | 1998 | 2009 | 2008 | 2000 | 2001 | 2013 |
| TPZ | Xining | 2013 | 2001 | 2000 | 2000 | 2013 | 2010 | 2007 | 2008 | 2003 | 2008 | 1995 | 2006 |
| Year | Jan. | Feb. | Mar. | Apr. | May | Jun. | Jul. | Aug. | Sep. | Oct. | Nov. | Dec. | Total Times |
|---|---|---|---|---|---|---|---|---|---|---|---|---|---|
| 1994 | 2 | 2 | 1 | 0 | 0 | 1 | 1 | 1 | 0 | 0 | 0 | 2 | 10 |
| 1995 | 3 | 2 | 4 | 1 | 0 | 1 | 0 | 4 | 0 | 0 | 1 | 1 | 17 |
| 1996 | 1 | 0 | 0 | 0 | 2 | 0 | 0 | 1 | 2 | 1 | 2 | 3 | 12 |
| 1997 | 2 | 5 | 1 | 5 | 1 | 0 | 0 | 0 | 0 | 0 | 2 | 1 | 17 |
| 1998 | 2 | 1 | 0 | 1 | 1 | 1 | 2 | 0 | 0 | 1 | 1 | 0 | 10 |
| 1999 | 0 | 0 | 0 | 0 | 1 | 0 | 1 | 2 | 1 | 3 | 6 | 1 | 15 |
| 2000 | 1 | 0 | 4 | 6 | 2 | 0 | 3 | 1 | 5 | 1 | 1 | 3 | 27 |
| 2001 | 0 | 2 | 1 | 2 | 1 | 2 | 0 | 2 | 2 | 2 | 4 | 1 | 19 |
| 2002 | 1 | 3 | 1 | 2 | 3 | 3 | 5 | 2 | 1 | 0 | 1 | 0 | 22 |
| 2003 | 2 | 4 | 2 | 4 | 2 | 5 | 0 | 1 | 3 | 1 | 1 | 3 | 28 |
| 2004 | 3 | 1 | 1 | 2 | 2 | 1 | 3 | 1 | 3 | 0 | 6 | 1 | 24 |
| 2005 | 5 | 0 | 3 | 1 | 4 | 0 | 2 | 3 | 1 | 2 | 2 | 0 | 23 |
| 2006 | 2 | 1 | 4 | 0 | 0 | 6 | 0 | 1 | 4 | 4 | 1 | 12 | 35 |
| 2007 | 5 | 1 | 0 | 1 | 1 | 4 | 2 | 2 | 3 | 0 | 1 | 0 | 20 |
| 2008 | 1 | 0 | 3 | 3 | 1 | 0 | 7 | 6 | 5 | 11 | 1 | 0 | 38 |
| 2009 | 1 | 1 | 4 | 3 | 1 | 1 | 2 | 1 | 1 | 0 | 0 | 0 | 15 |
| 2010 | 1 | 1 | 0 | 1 | 3 | 2 | 3 | 0 | 0 | 3 | 2 | 2 | 18 |
| 2011 | 0 | 4 | 0 | 1 | 1 | 1 | 2 | 4 | 1 | 0 | 1 | 2 | 17 |
| 2012 | 1 | 0 | 1 | 0 | 2 | 0 | 0 | 1 | 1 | 2 | 0 | 0 | 8 |
| 2013 | 2 | 2 | 0 | 0 | 3 | 1 | 0 | 1 | 2 | 2 | 1 | 2 | 16 |
| 2014 | 0 | 0 | 1 | 2 | 0 | 5 | 2 | 1 | 0 | 1 | 1 | 0 | 13 |
| 2015 | 0 | 5 | 4 | 0 | 4 | 1 | 0 | 0 | 0 | 1 | 0 | 1 | 16 |
| Stations | MAPE (%) [45] | RMSE (MJ/m2) [45] | FICP (%) [46] | FIAW [46] |
|---|---|---|---|---|
| Haikou (TZ) | 11.03 | 1.9919 | 91.67 | 0.5153 |
| Shanghai (SZ) | 10.75 | 1.3626 | 100 | 0.6256 |
| Zhengzhou (WTZ) | 13.47 | 1.6059 | 91.67 | 0.5199 |
| Yinchuan (MTZ) | 9.77 | 1.5892 | 91.67 | 0.3812 |
| Lhasa (TPZ) | 7.27 | 1.5325 | 83.33 | 0.2124 |
© 2016 by the authors; licensee MDPI, Basel, Switzerland. This article is an open access article distributed under the terms and conditions of the Creative Commons Attribution (CC-BY) license (http://creativecommons.org/licenses/by/4.0/).
Share and Cite
Zang, H.; Wang, M.; Huang, J.; Wei, Z.; Sun, G. A Hybrid Method for Generation of Typical Meteorological Years for Different Climates of China. Energies 2016, 9, 1094. https://doi.org/10.3390/en9121094
Zang H, Wang M, Huang J, Wei Z, Sun G. A Hybrid Method for Generation of Typical Meteorological Years for Different Climates of China. Energies. 2016; 9(12):1094. https://doi.org/10.3390/en9121094
Chicago/Turabian StyleZang, Haixiang, Miaomiao Wang, Jing Huang, Zhinong Wei, and Guoqiang Sun. 2016. "A Hybrid Method for Generation of Typical Meteorological Years for Different Climates of China" Energies 9, no. 12: 1094. https://doi.org/10.3390/en9121094