
Effects of Incorporating High-Volume Fly Ash into Tricalcium Silicate on the Degree of Silicate Polymerization and Aluminum Substitution for Silicon in Calcium Silicate Hydrate


Abstract
:1. Introduction
2. Experimental Procedure
2.1. Materials and Sample Preparation
2.2. Instrumental Methods
2.2.1. Monochromatic Synchrotron X-ray Diffraction (XRD)
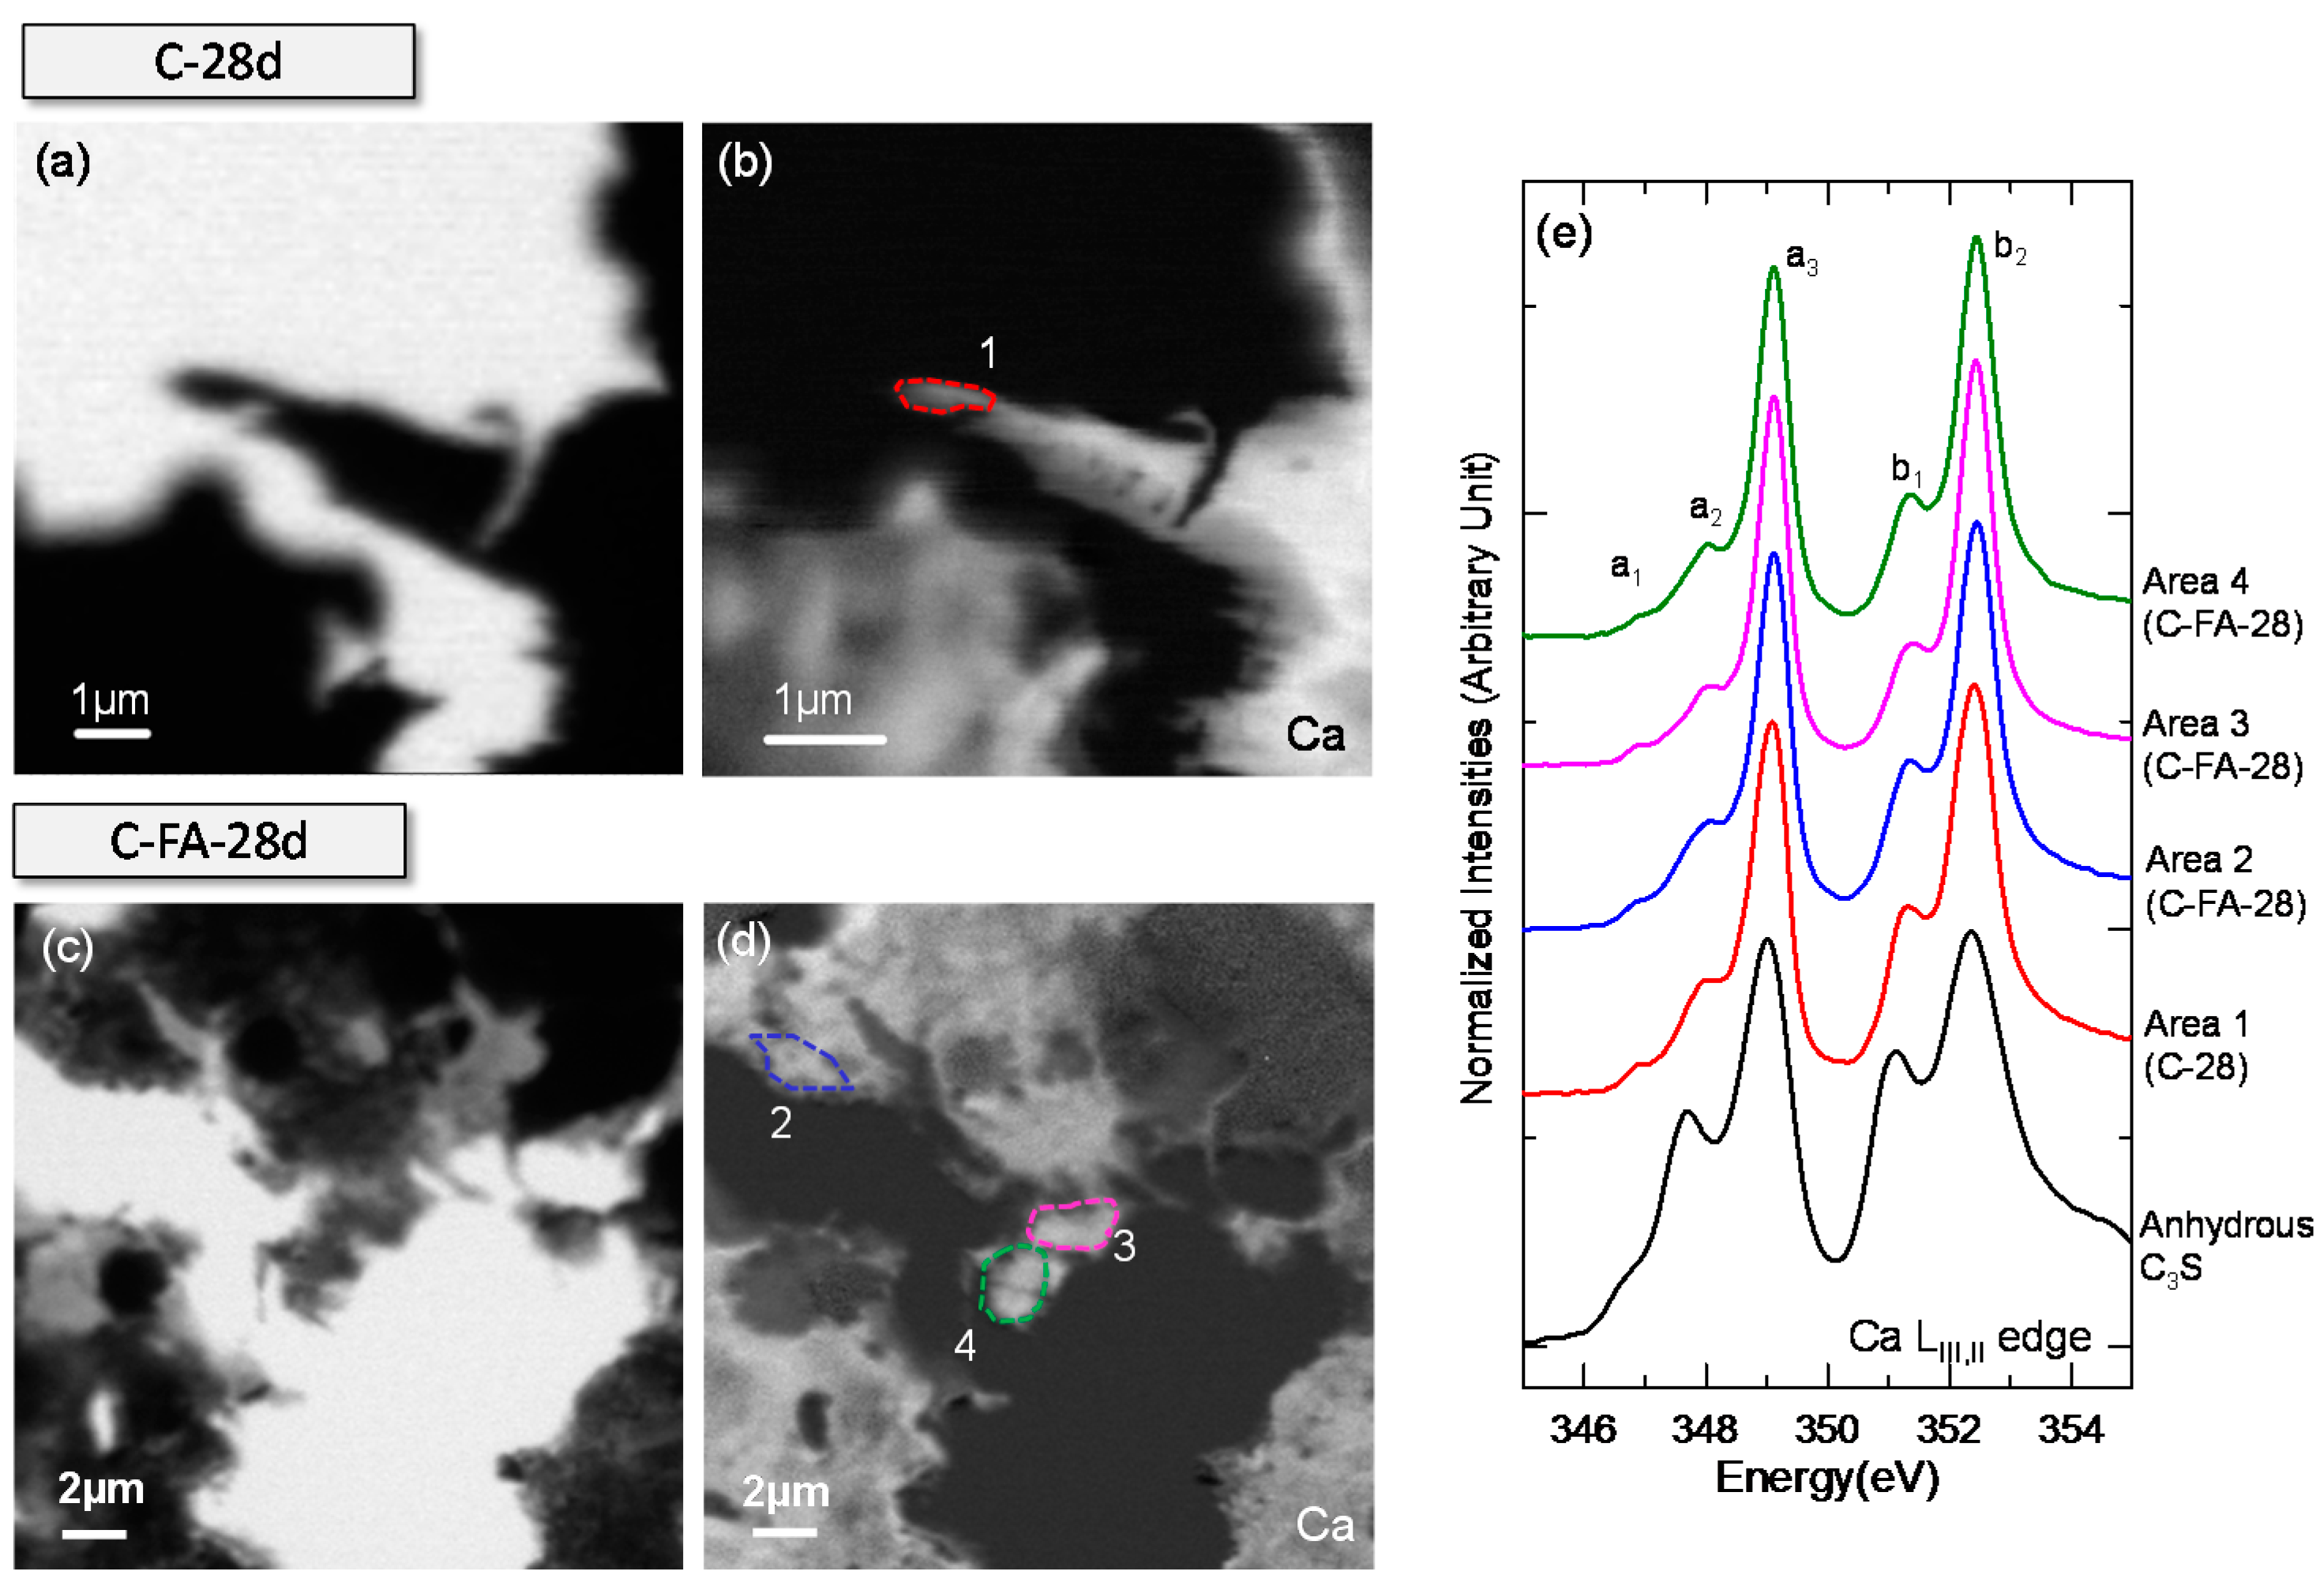
2.2.2. Scanning Transmission X-ray Microscopy (STXM)
2.2.3. 27Al and 29Si Magic-Angle Spinning Nuclear Magnetic Resonance (MAS NMR) Spectroscopy
2.2.4. Transmission Electron Microscopy (TEM) Imaging
2.2.5. Thermogravimetric Analysis (TG/DTG) and Isothermal Conduction Calorimetry
3. Results and Discussion
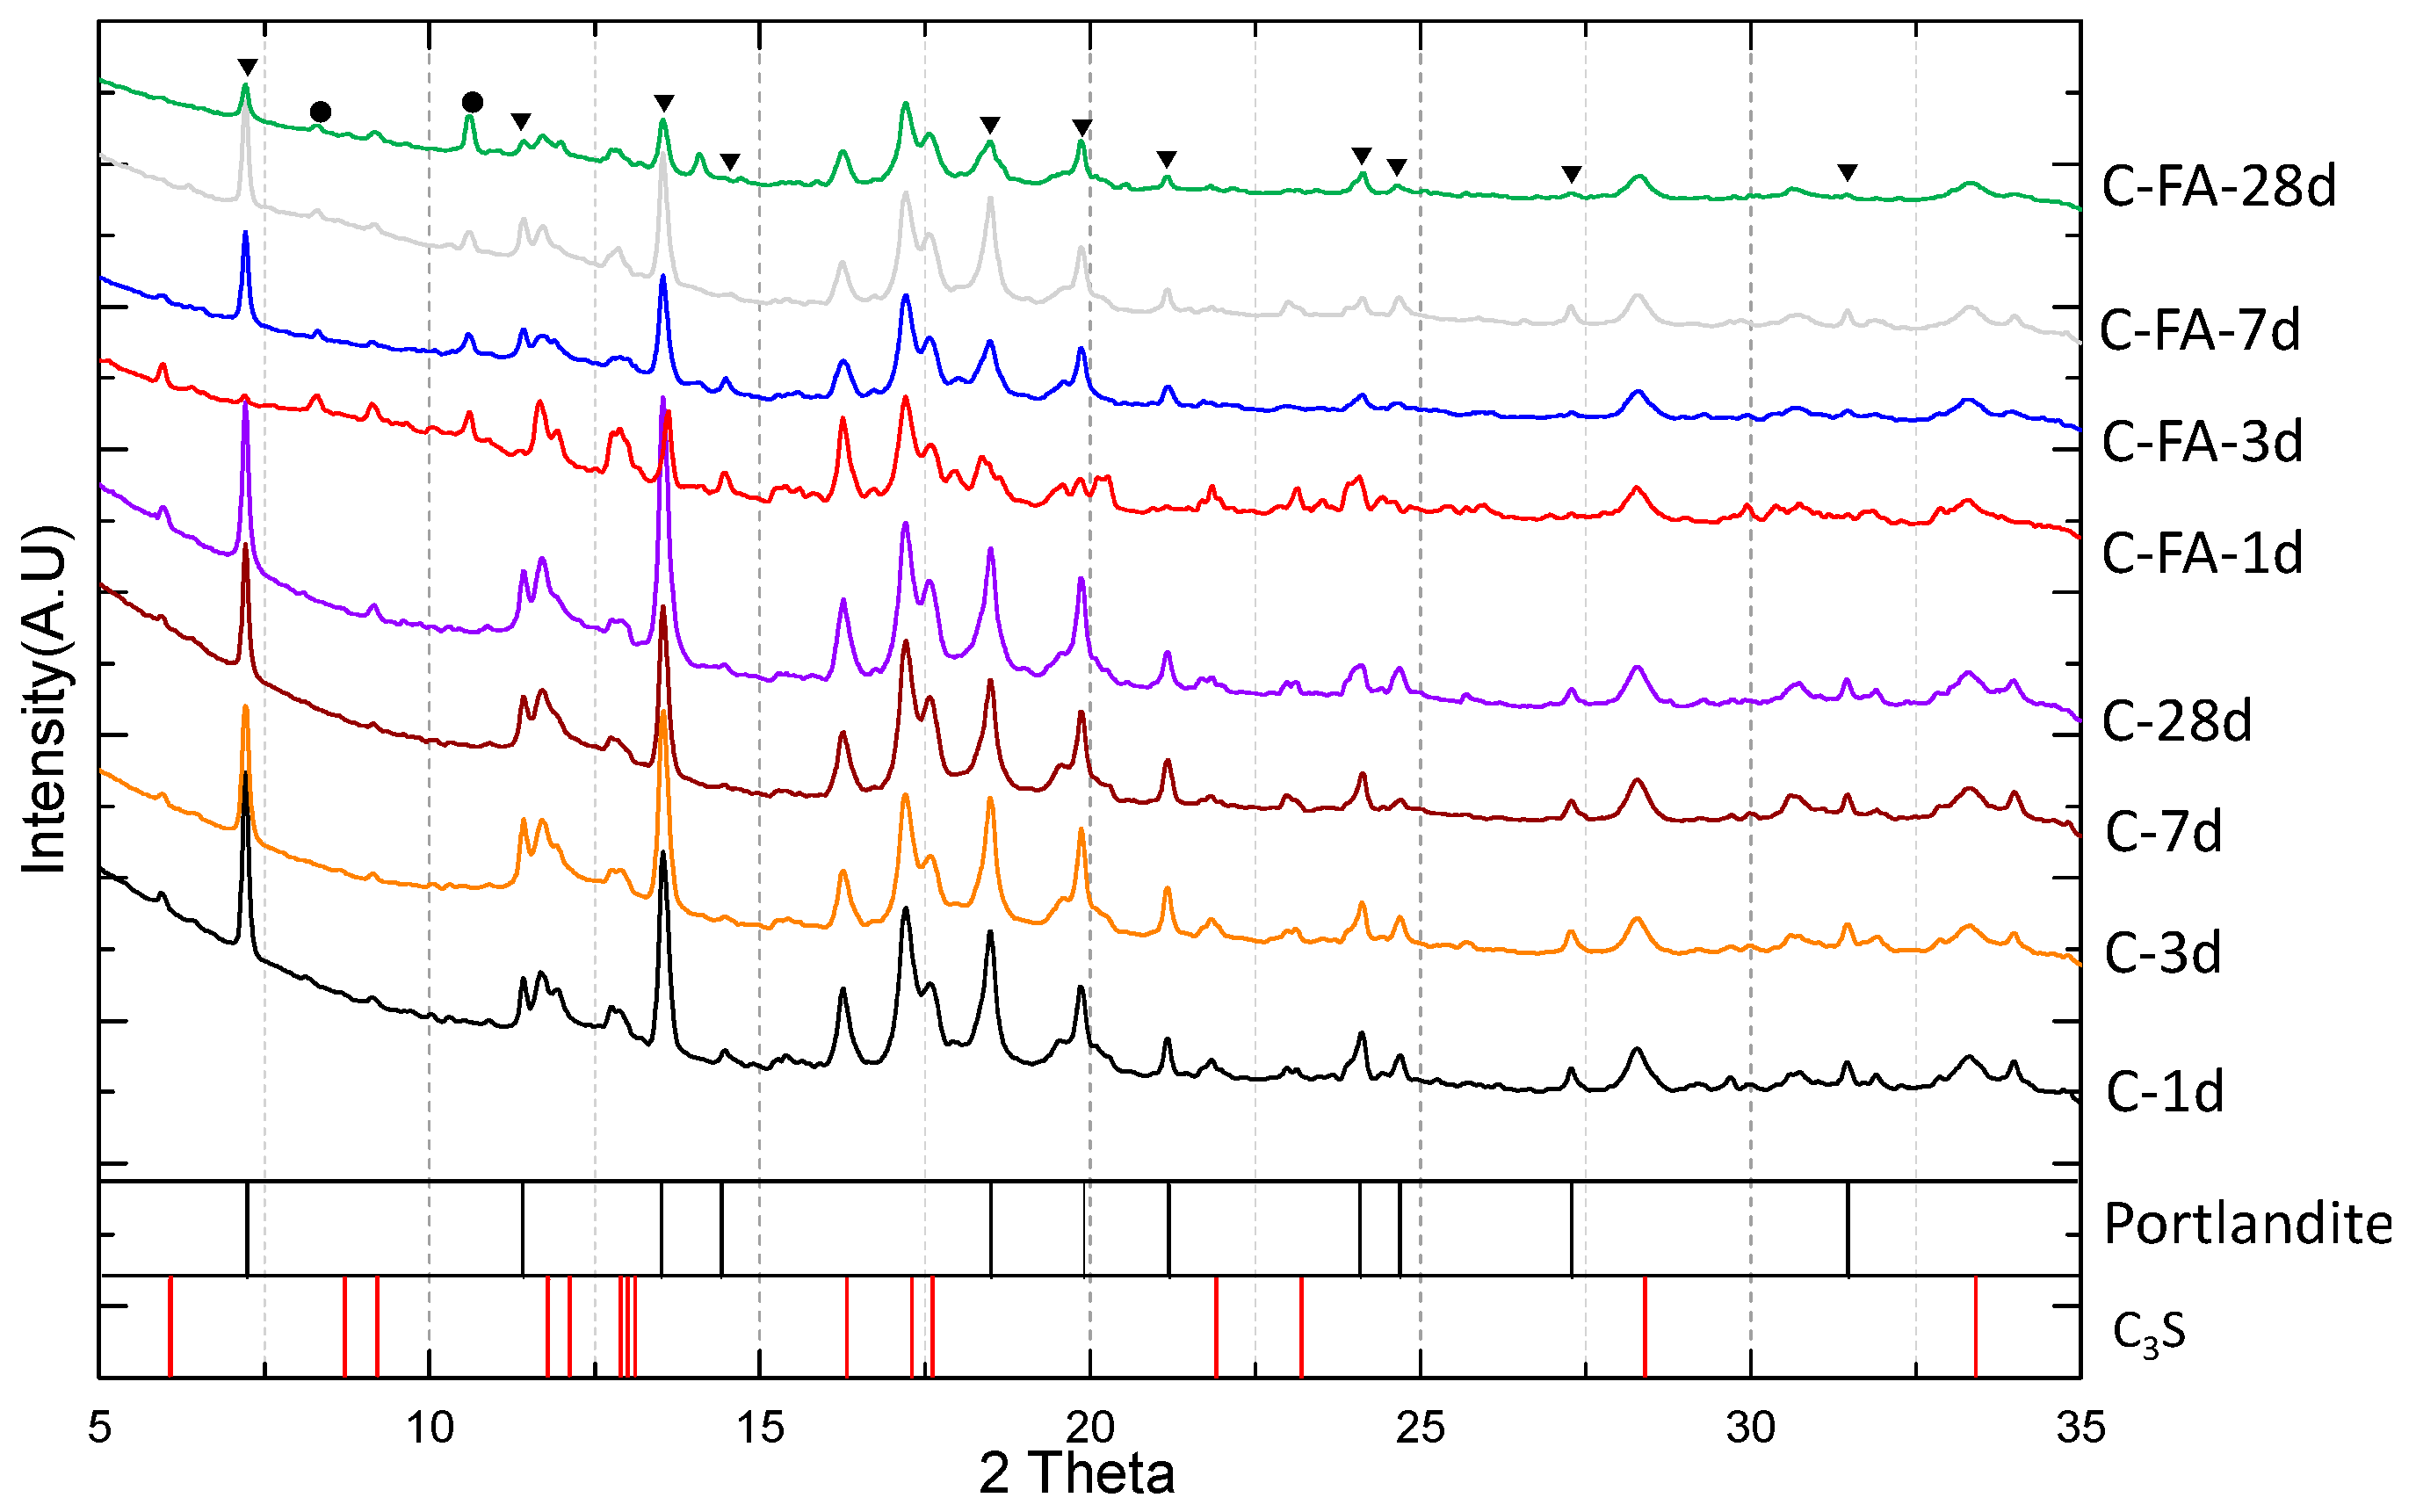
3.1. XRD Results
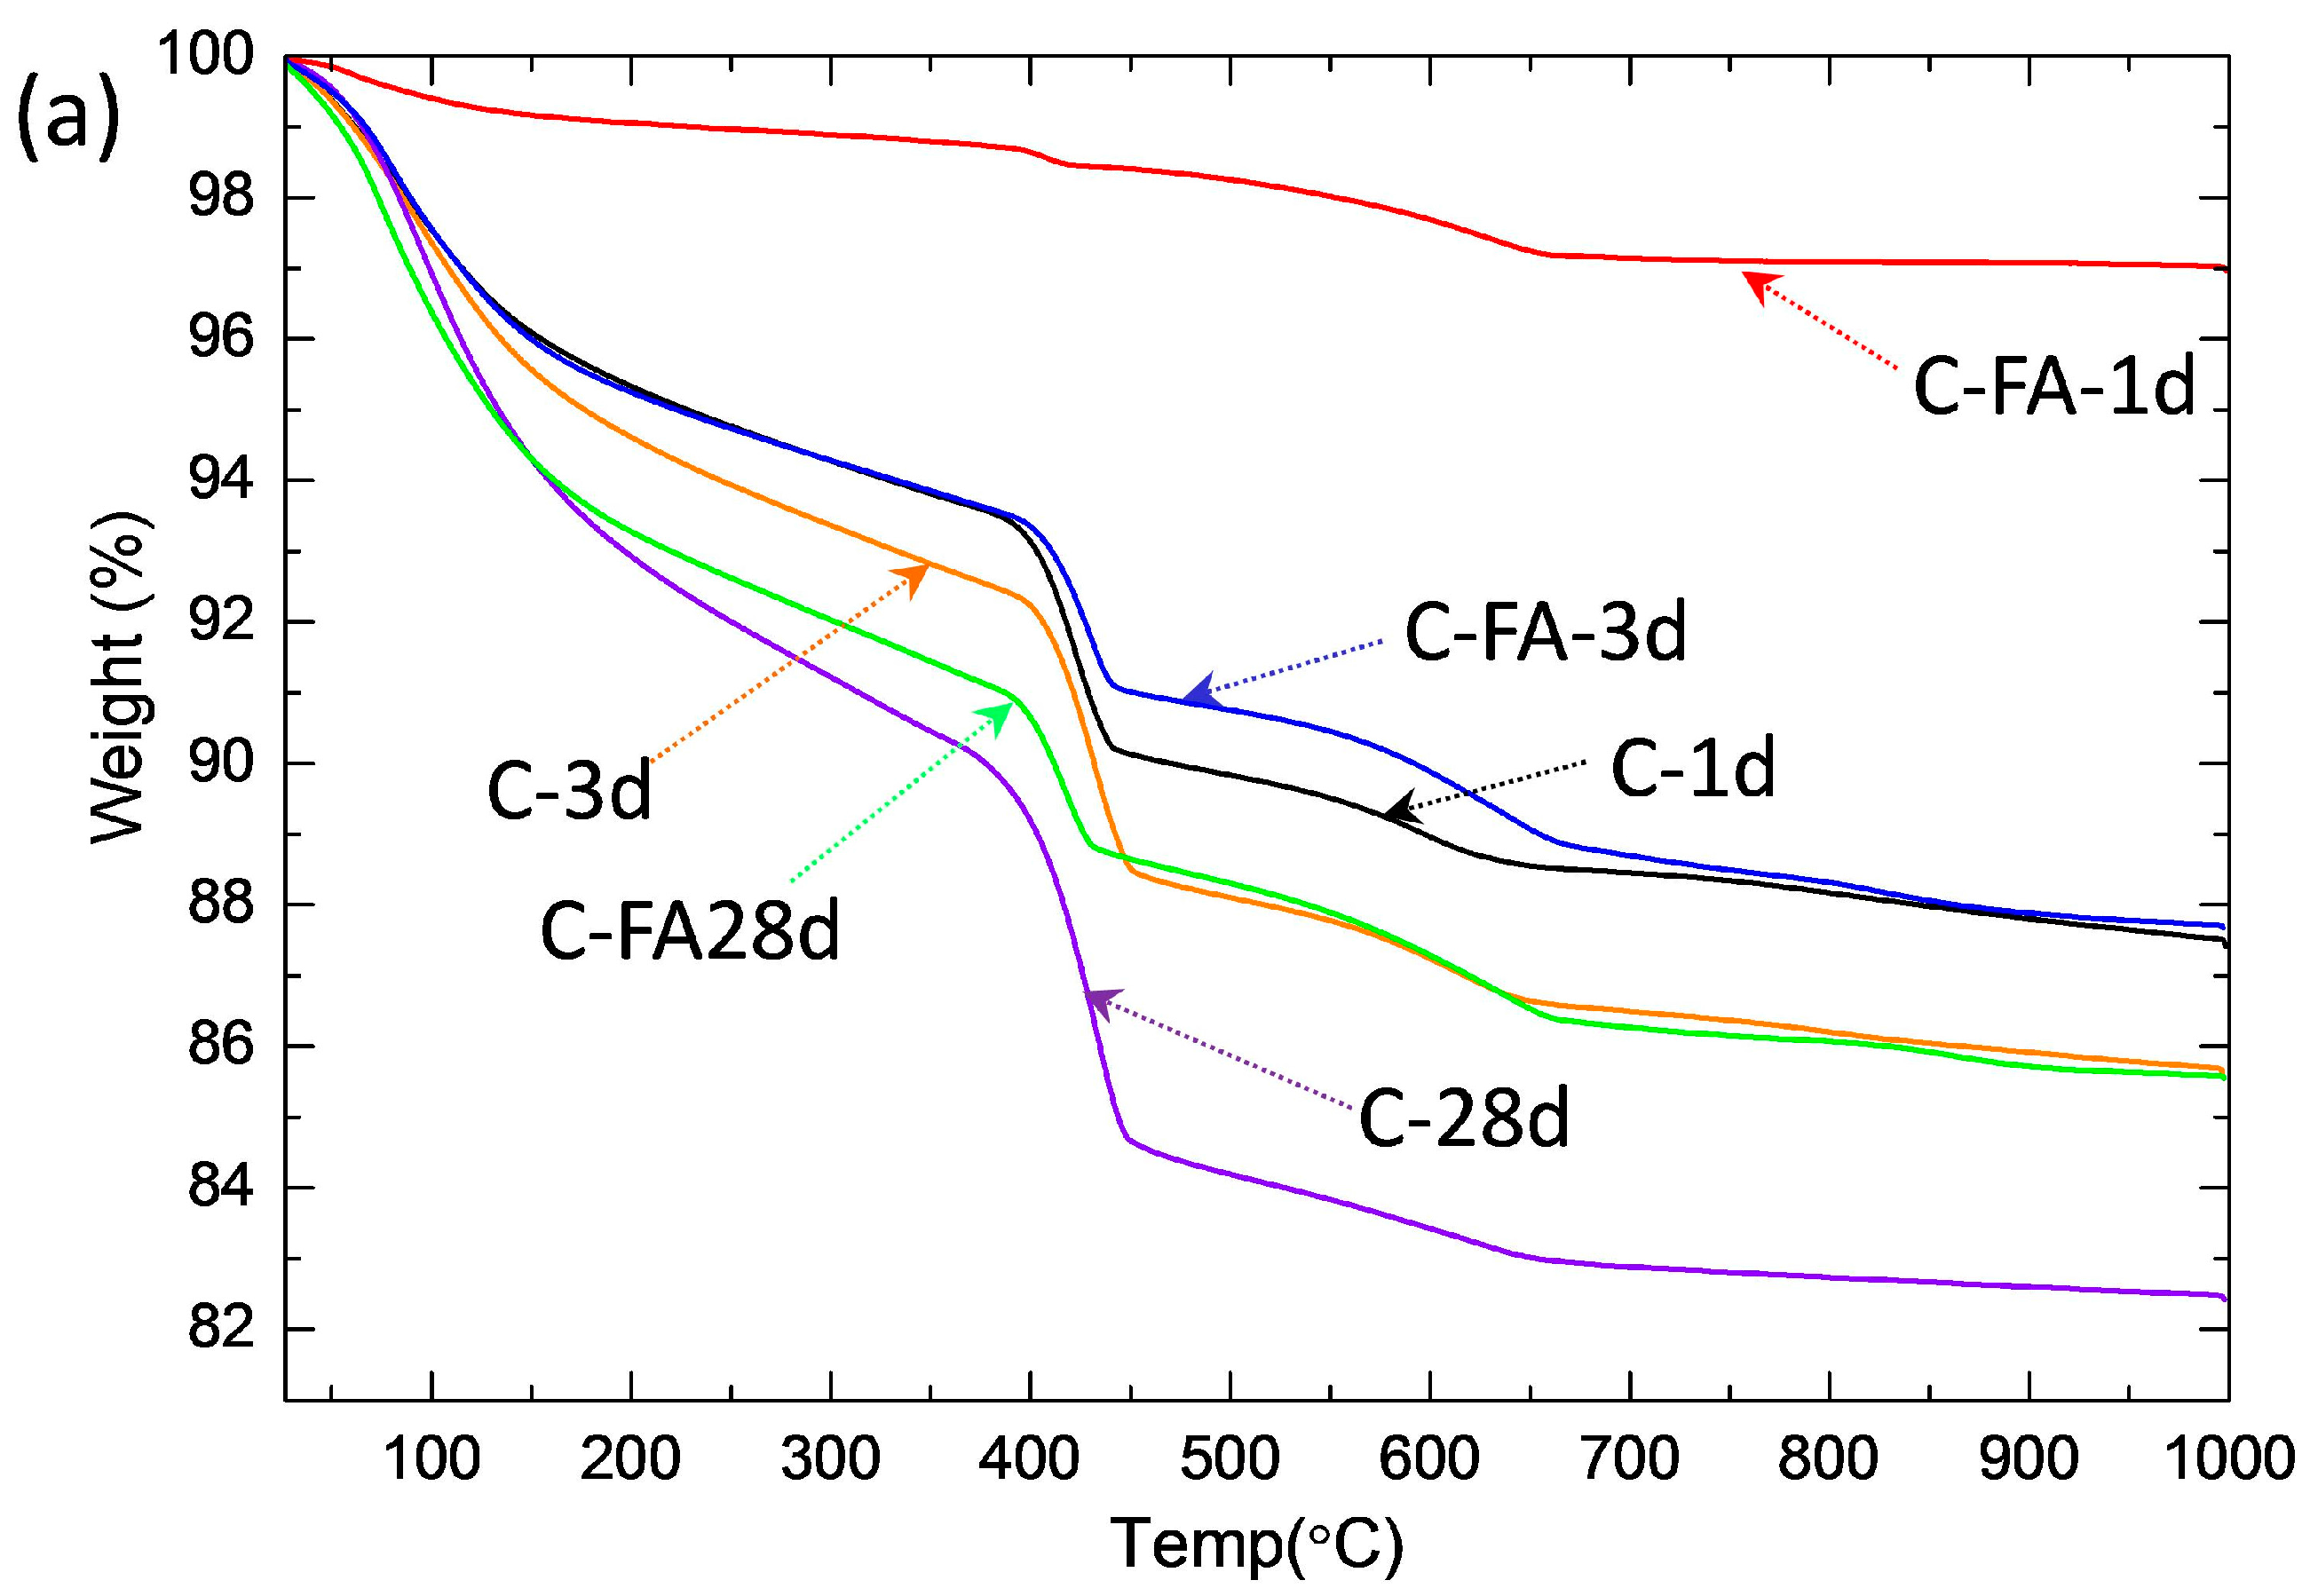
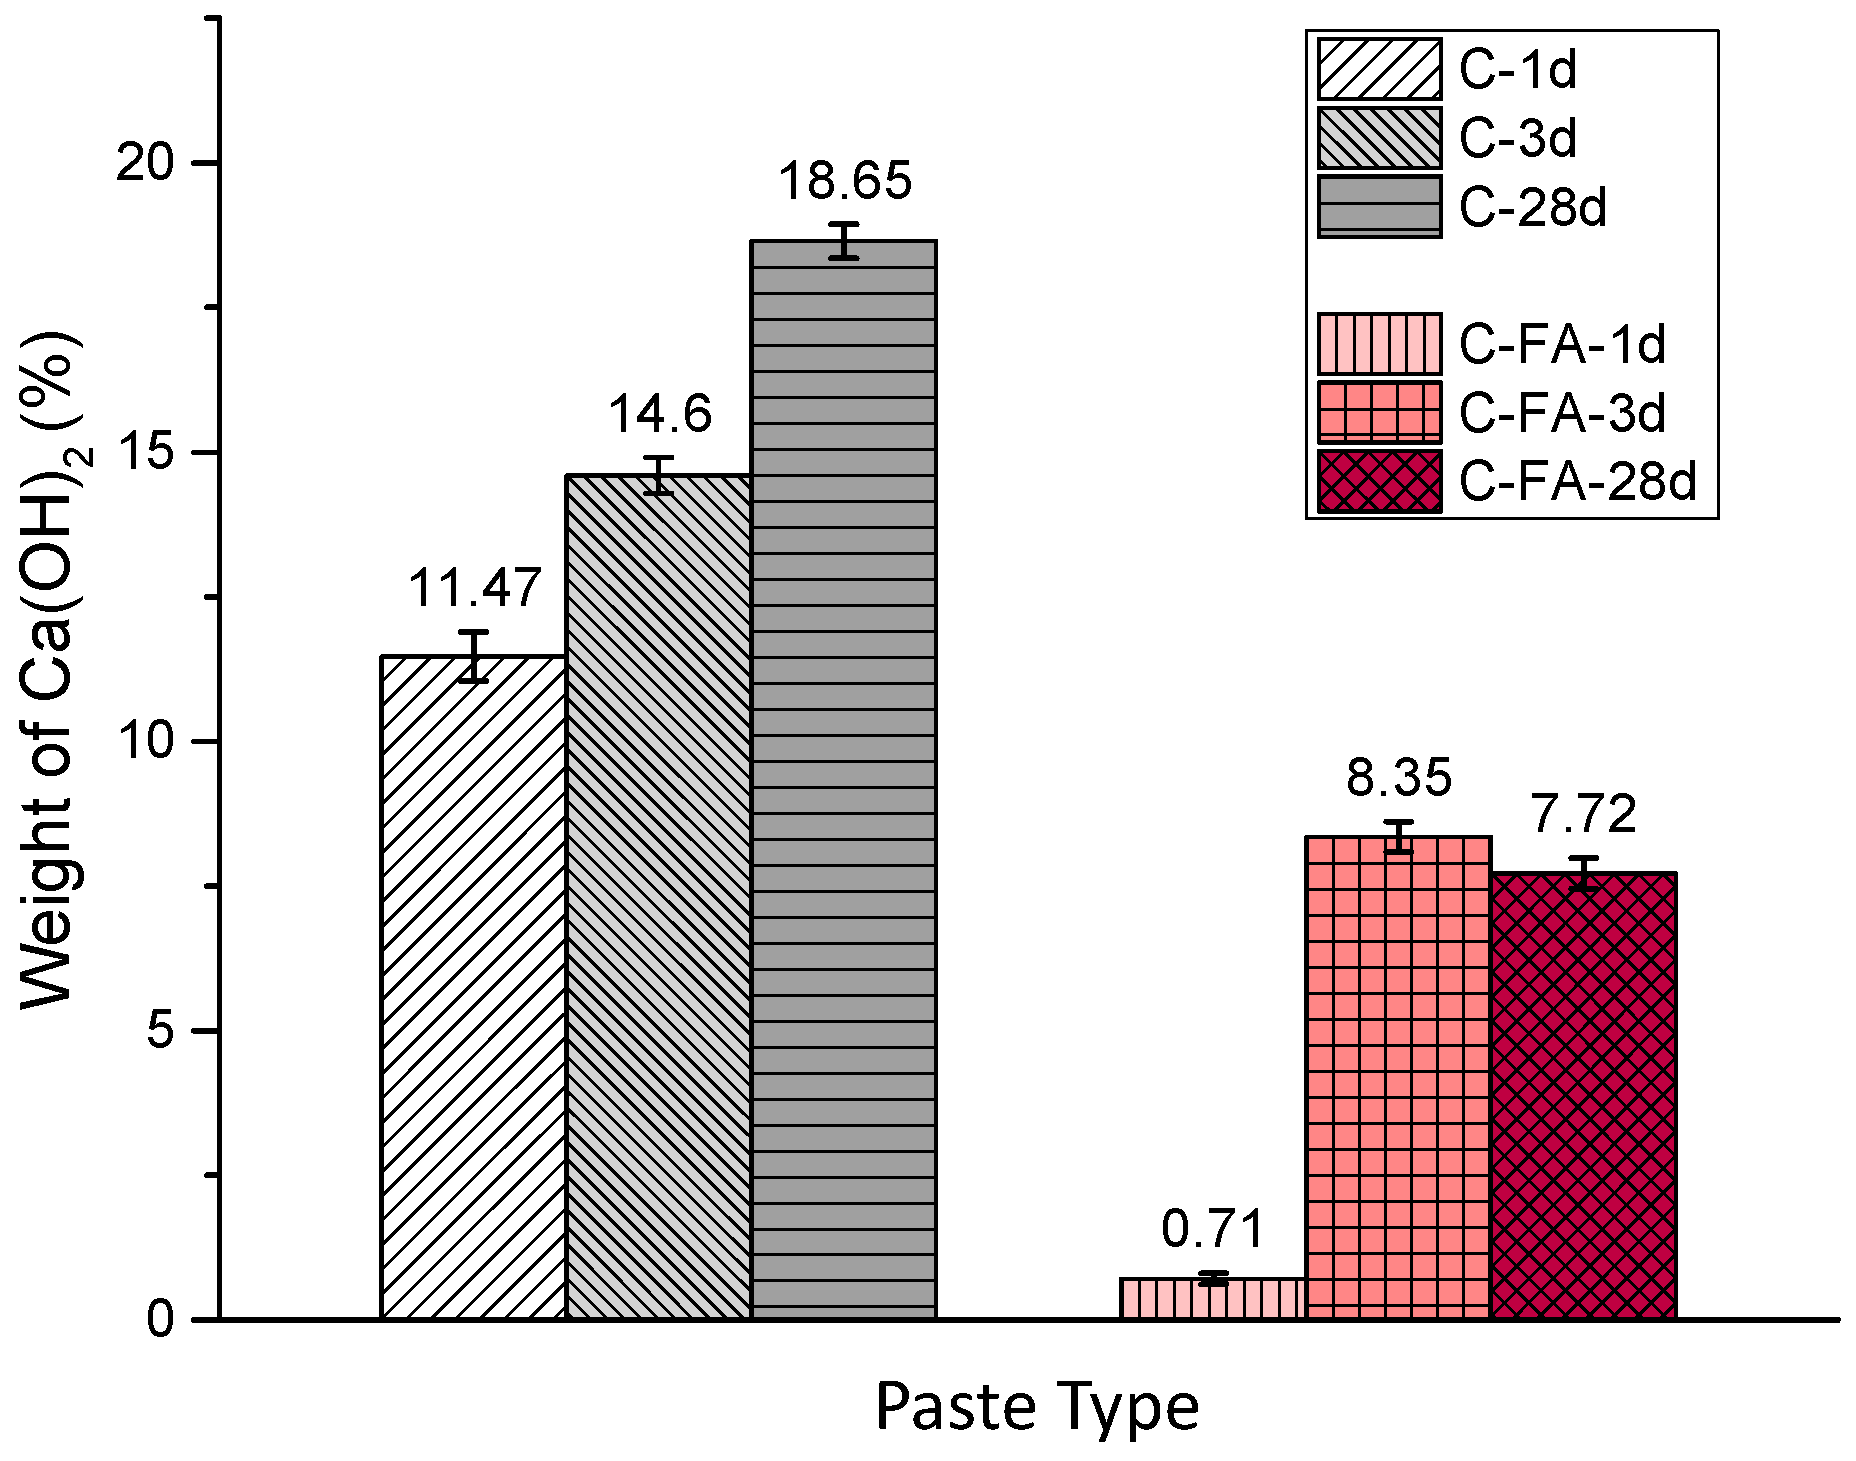
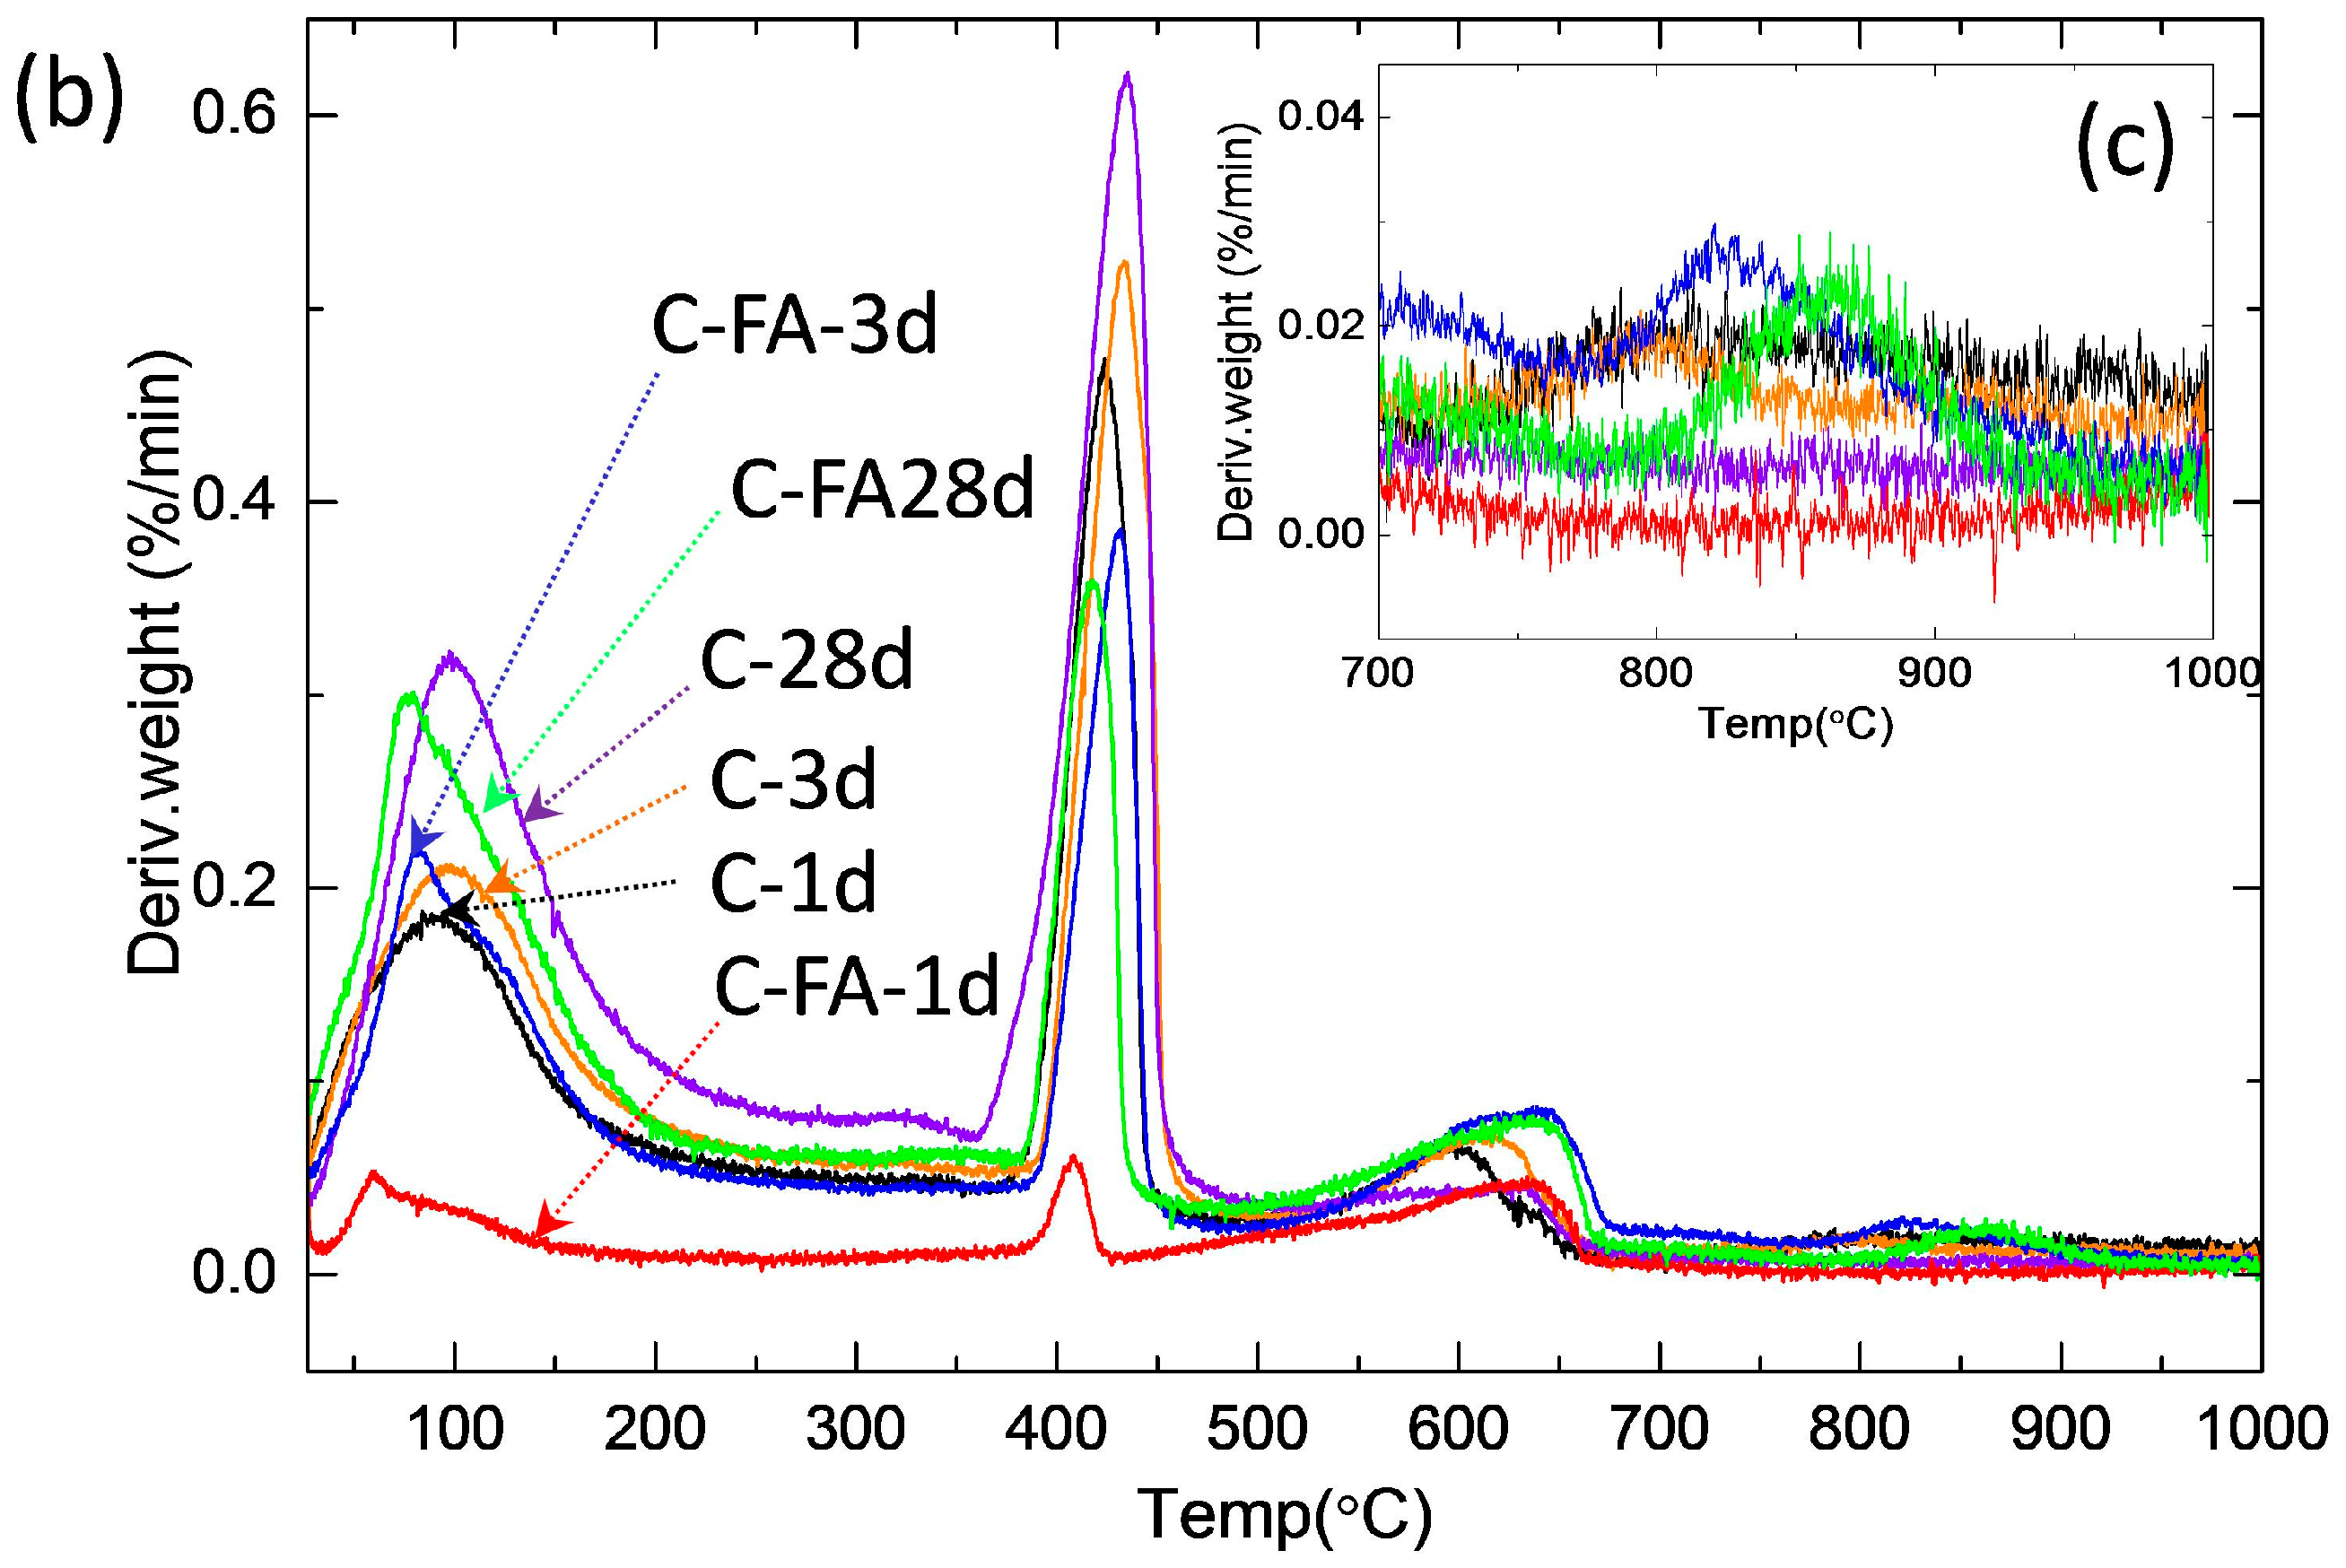
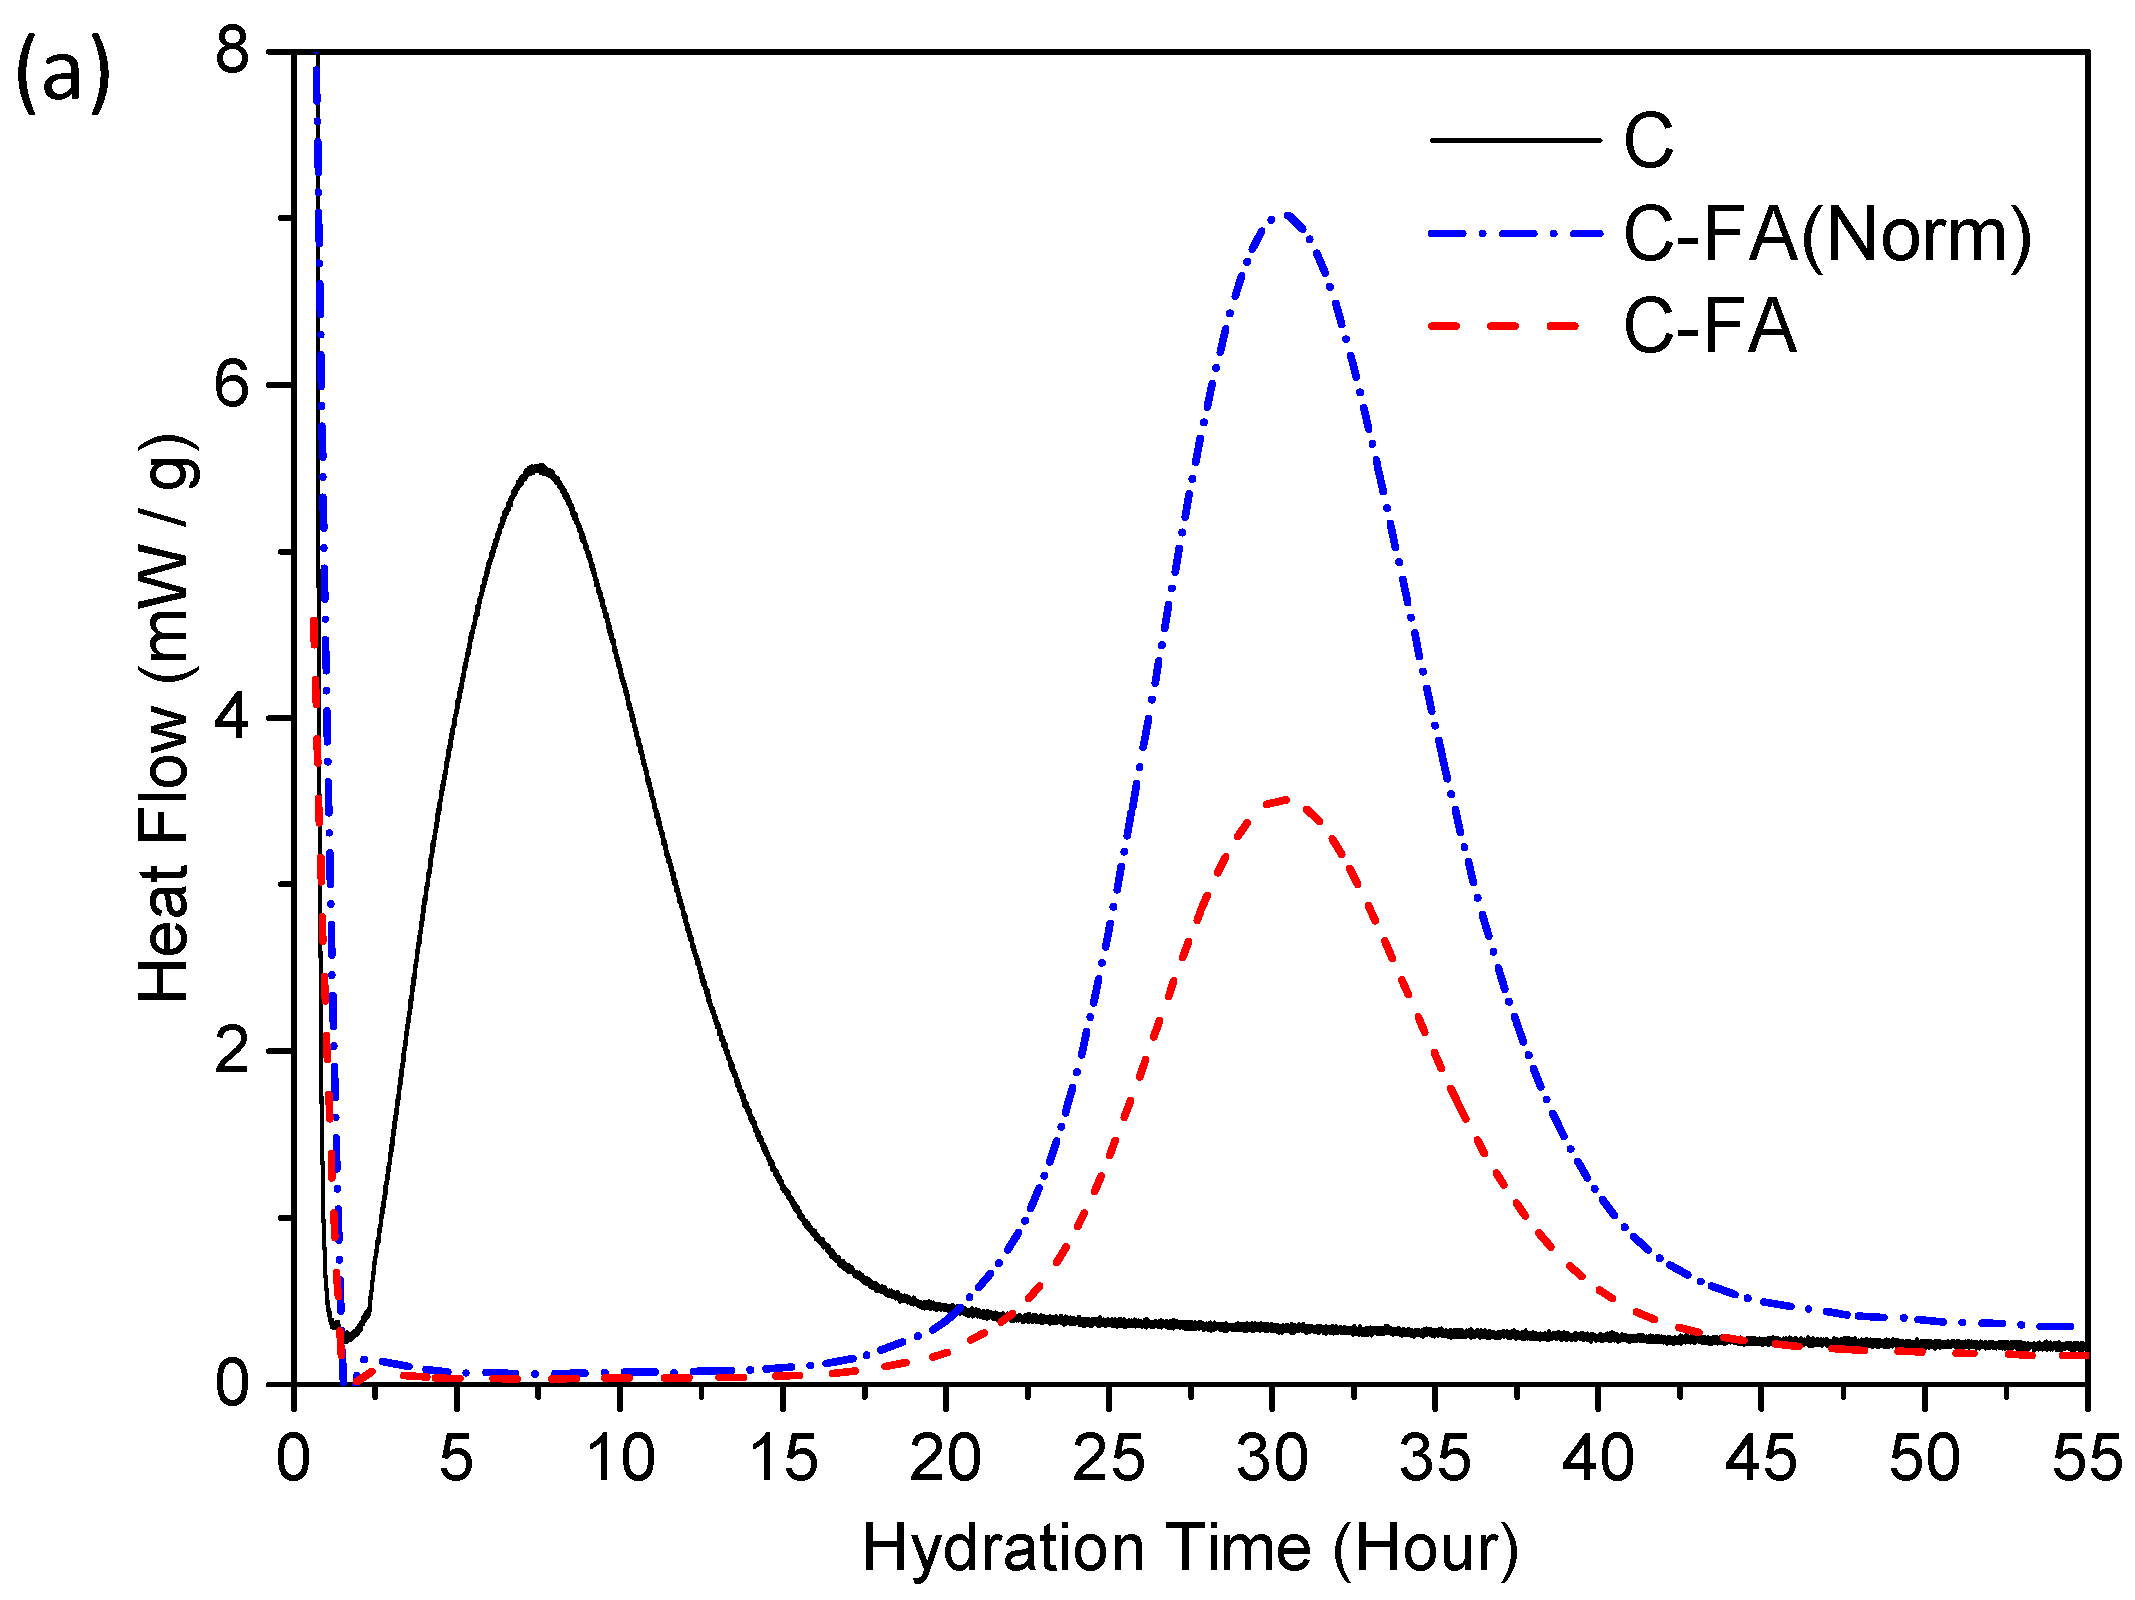
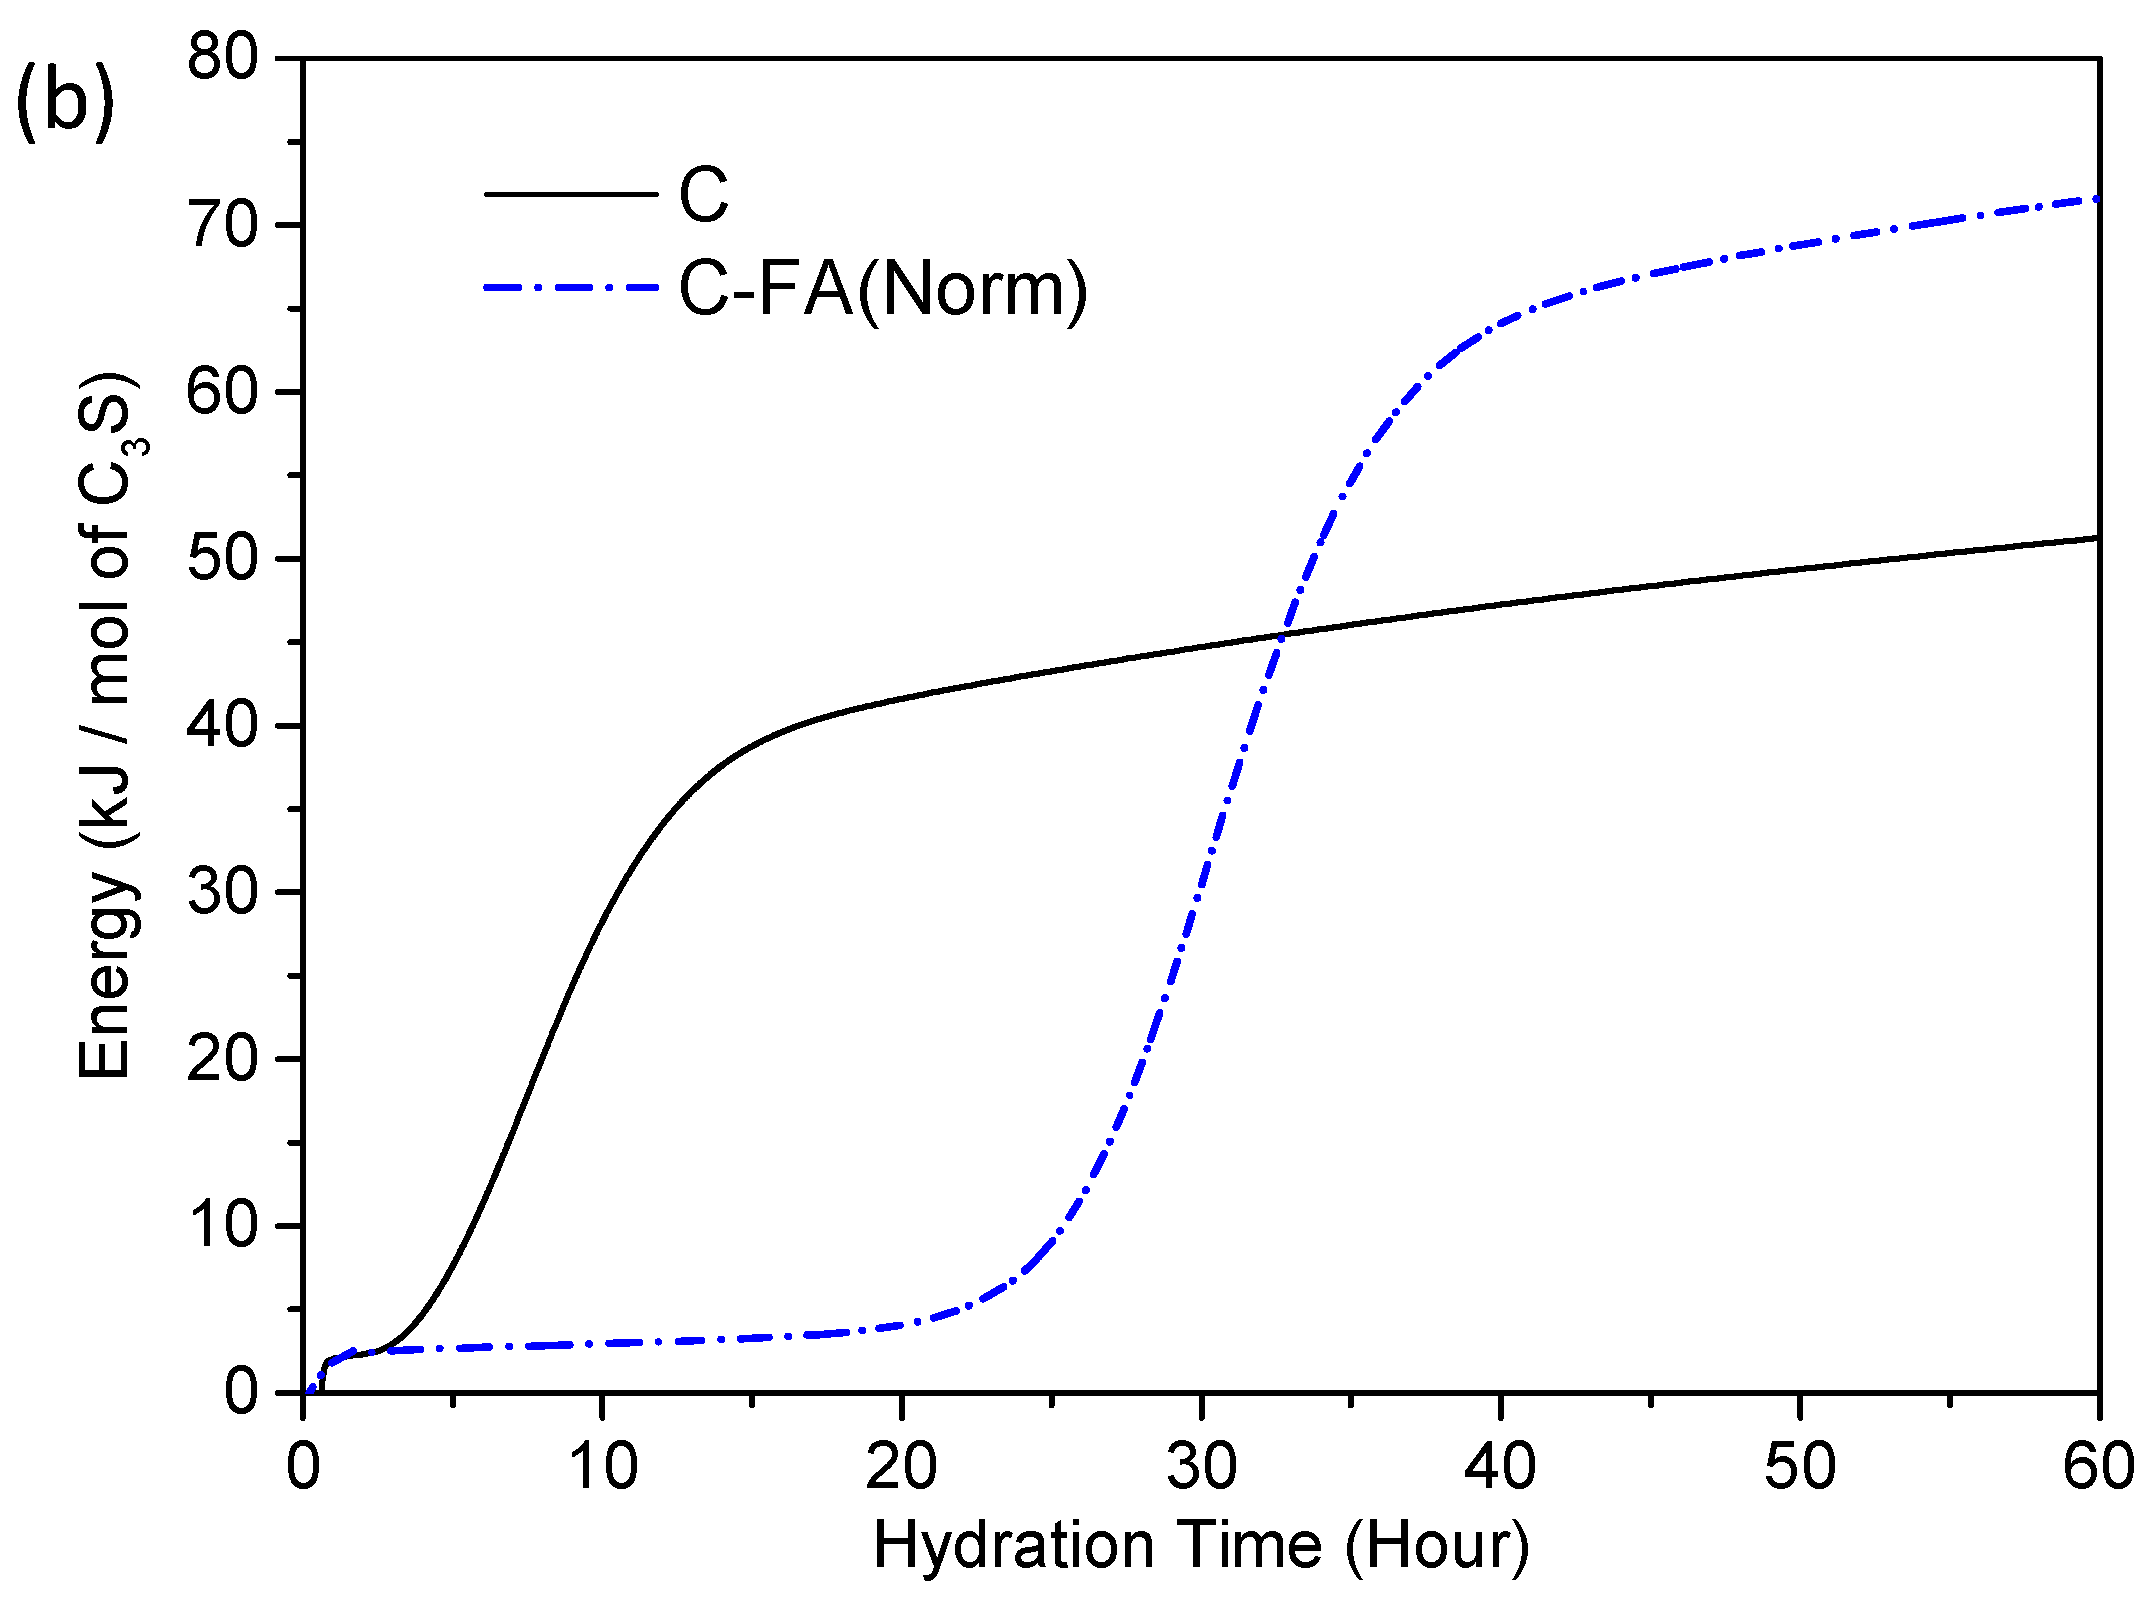
3.2. TG/DTG and Isothermal Conduction Calorimetry Results
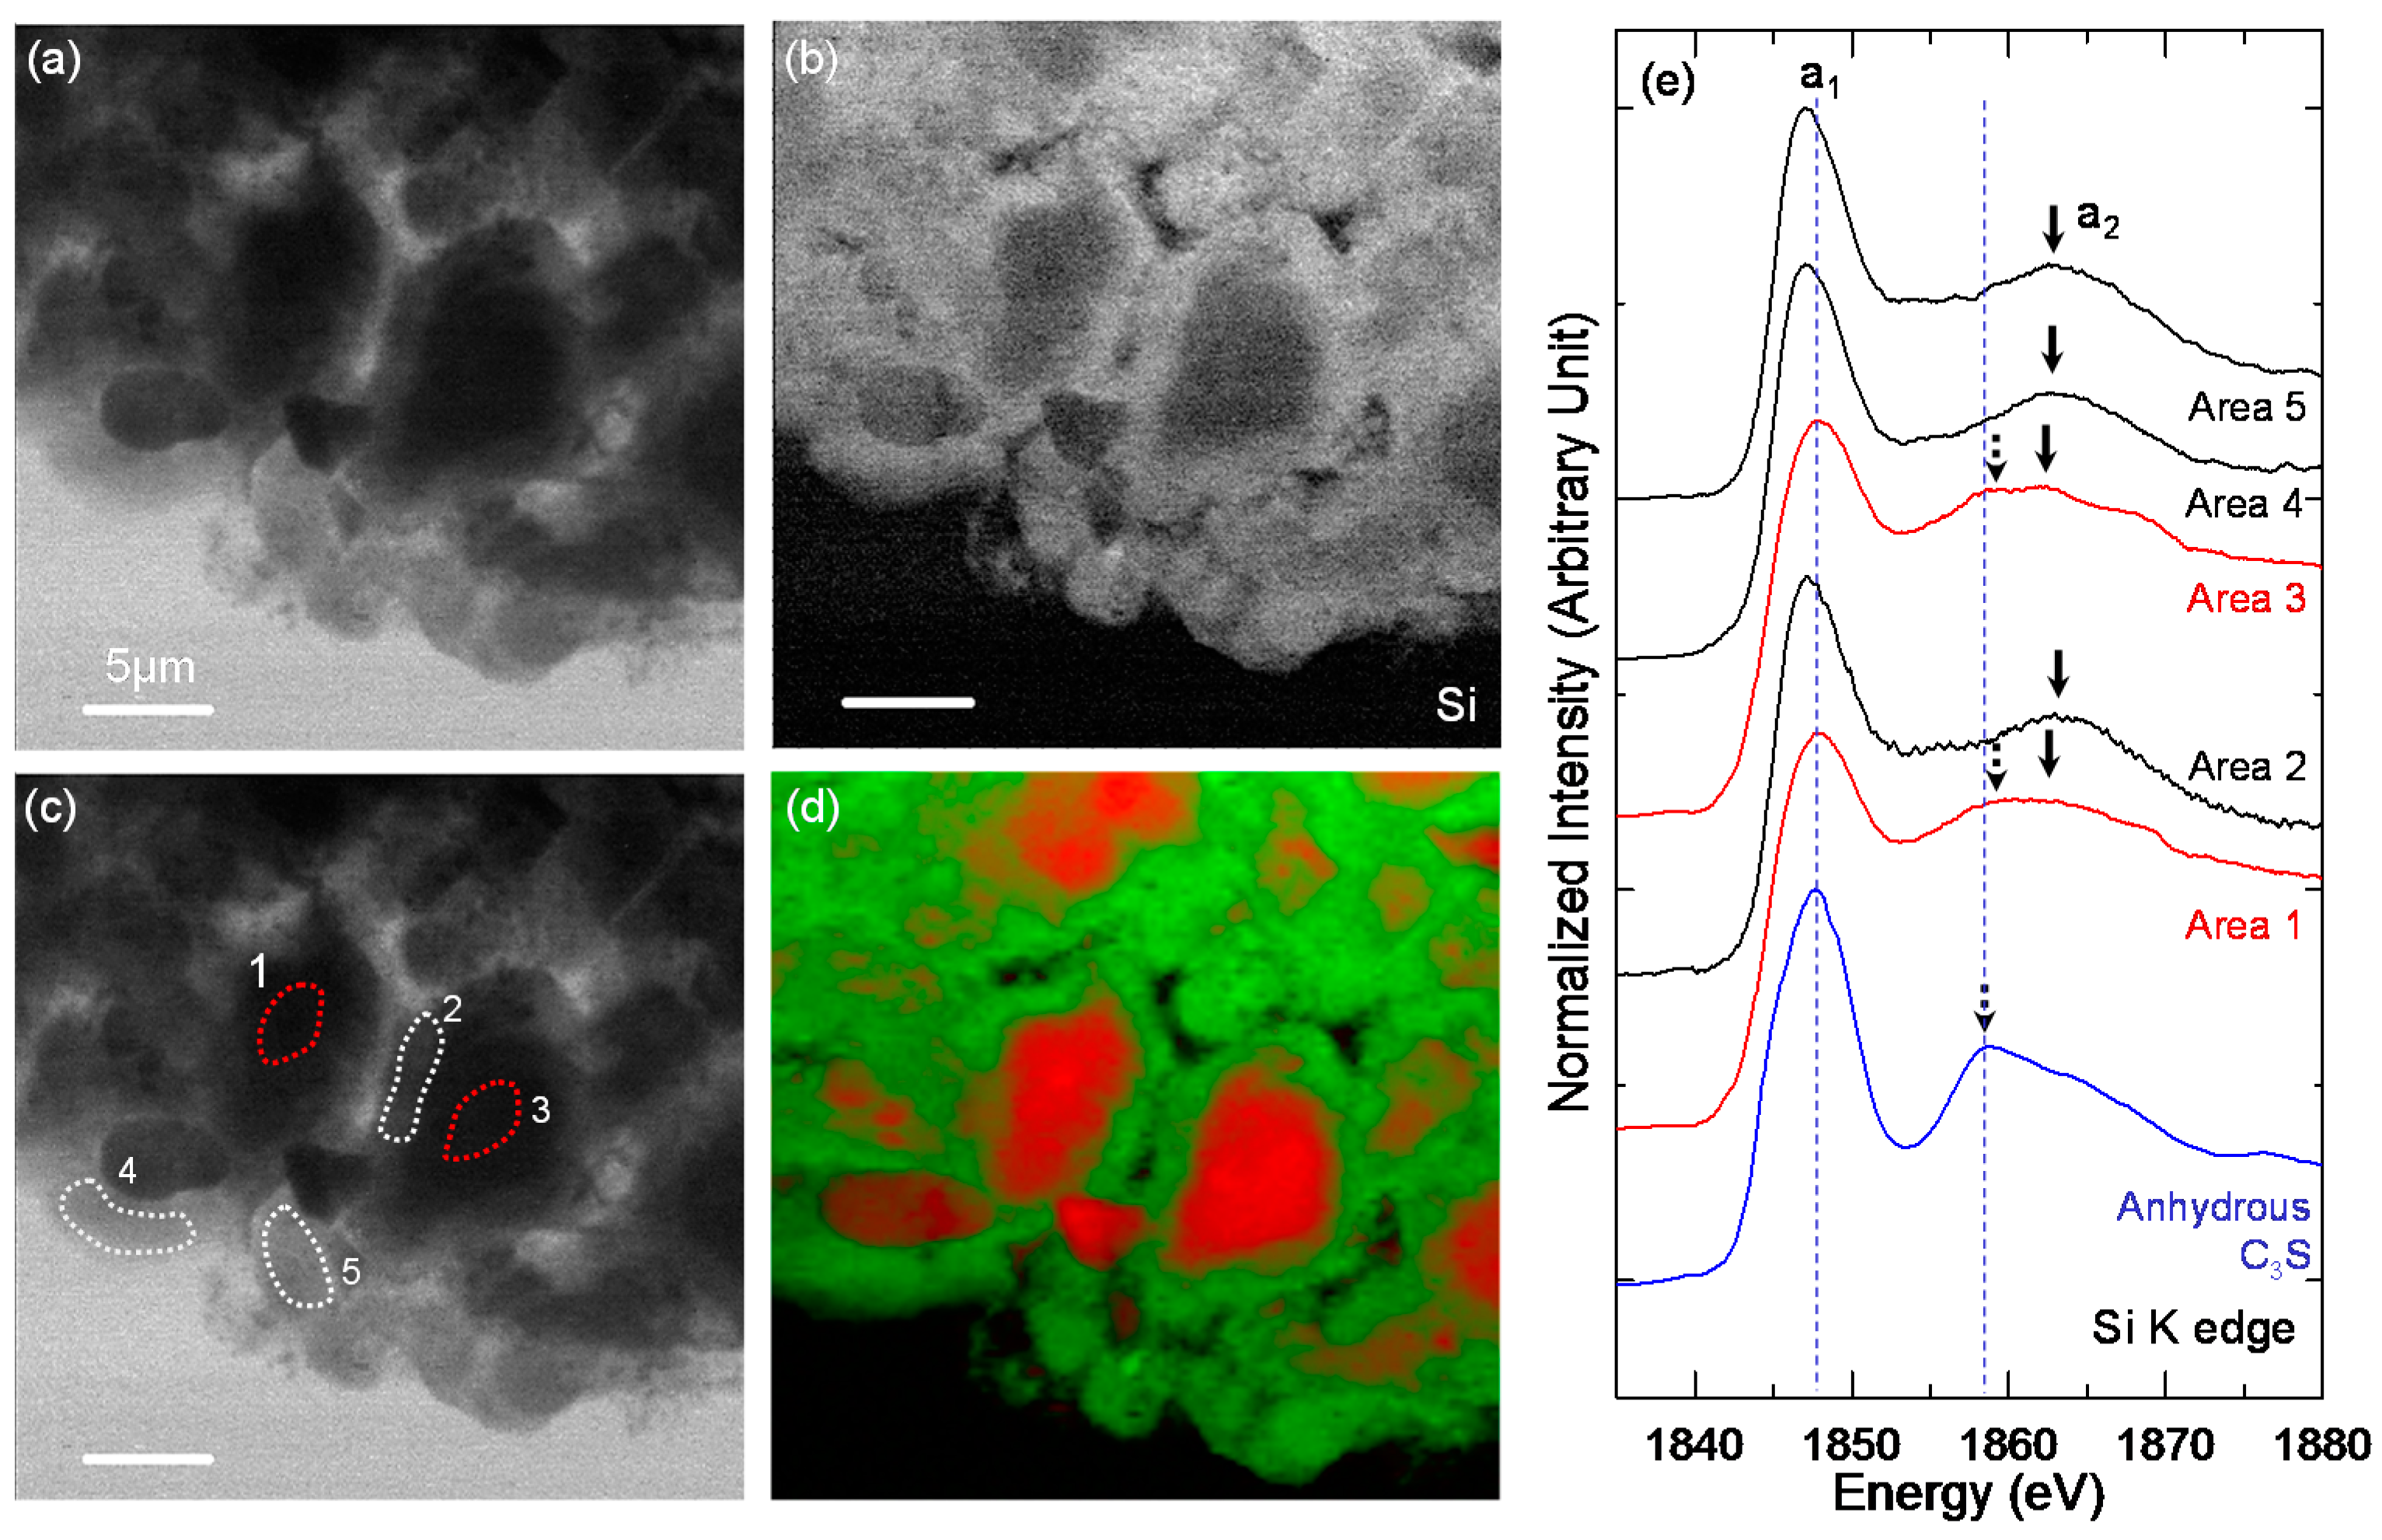
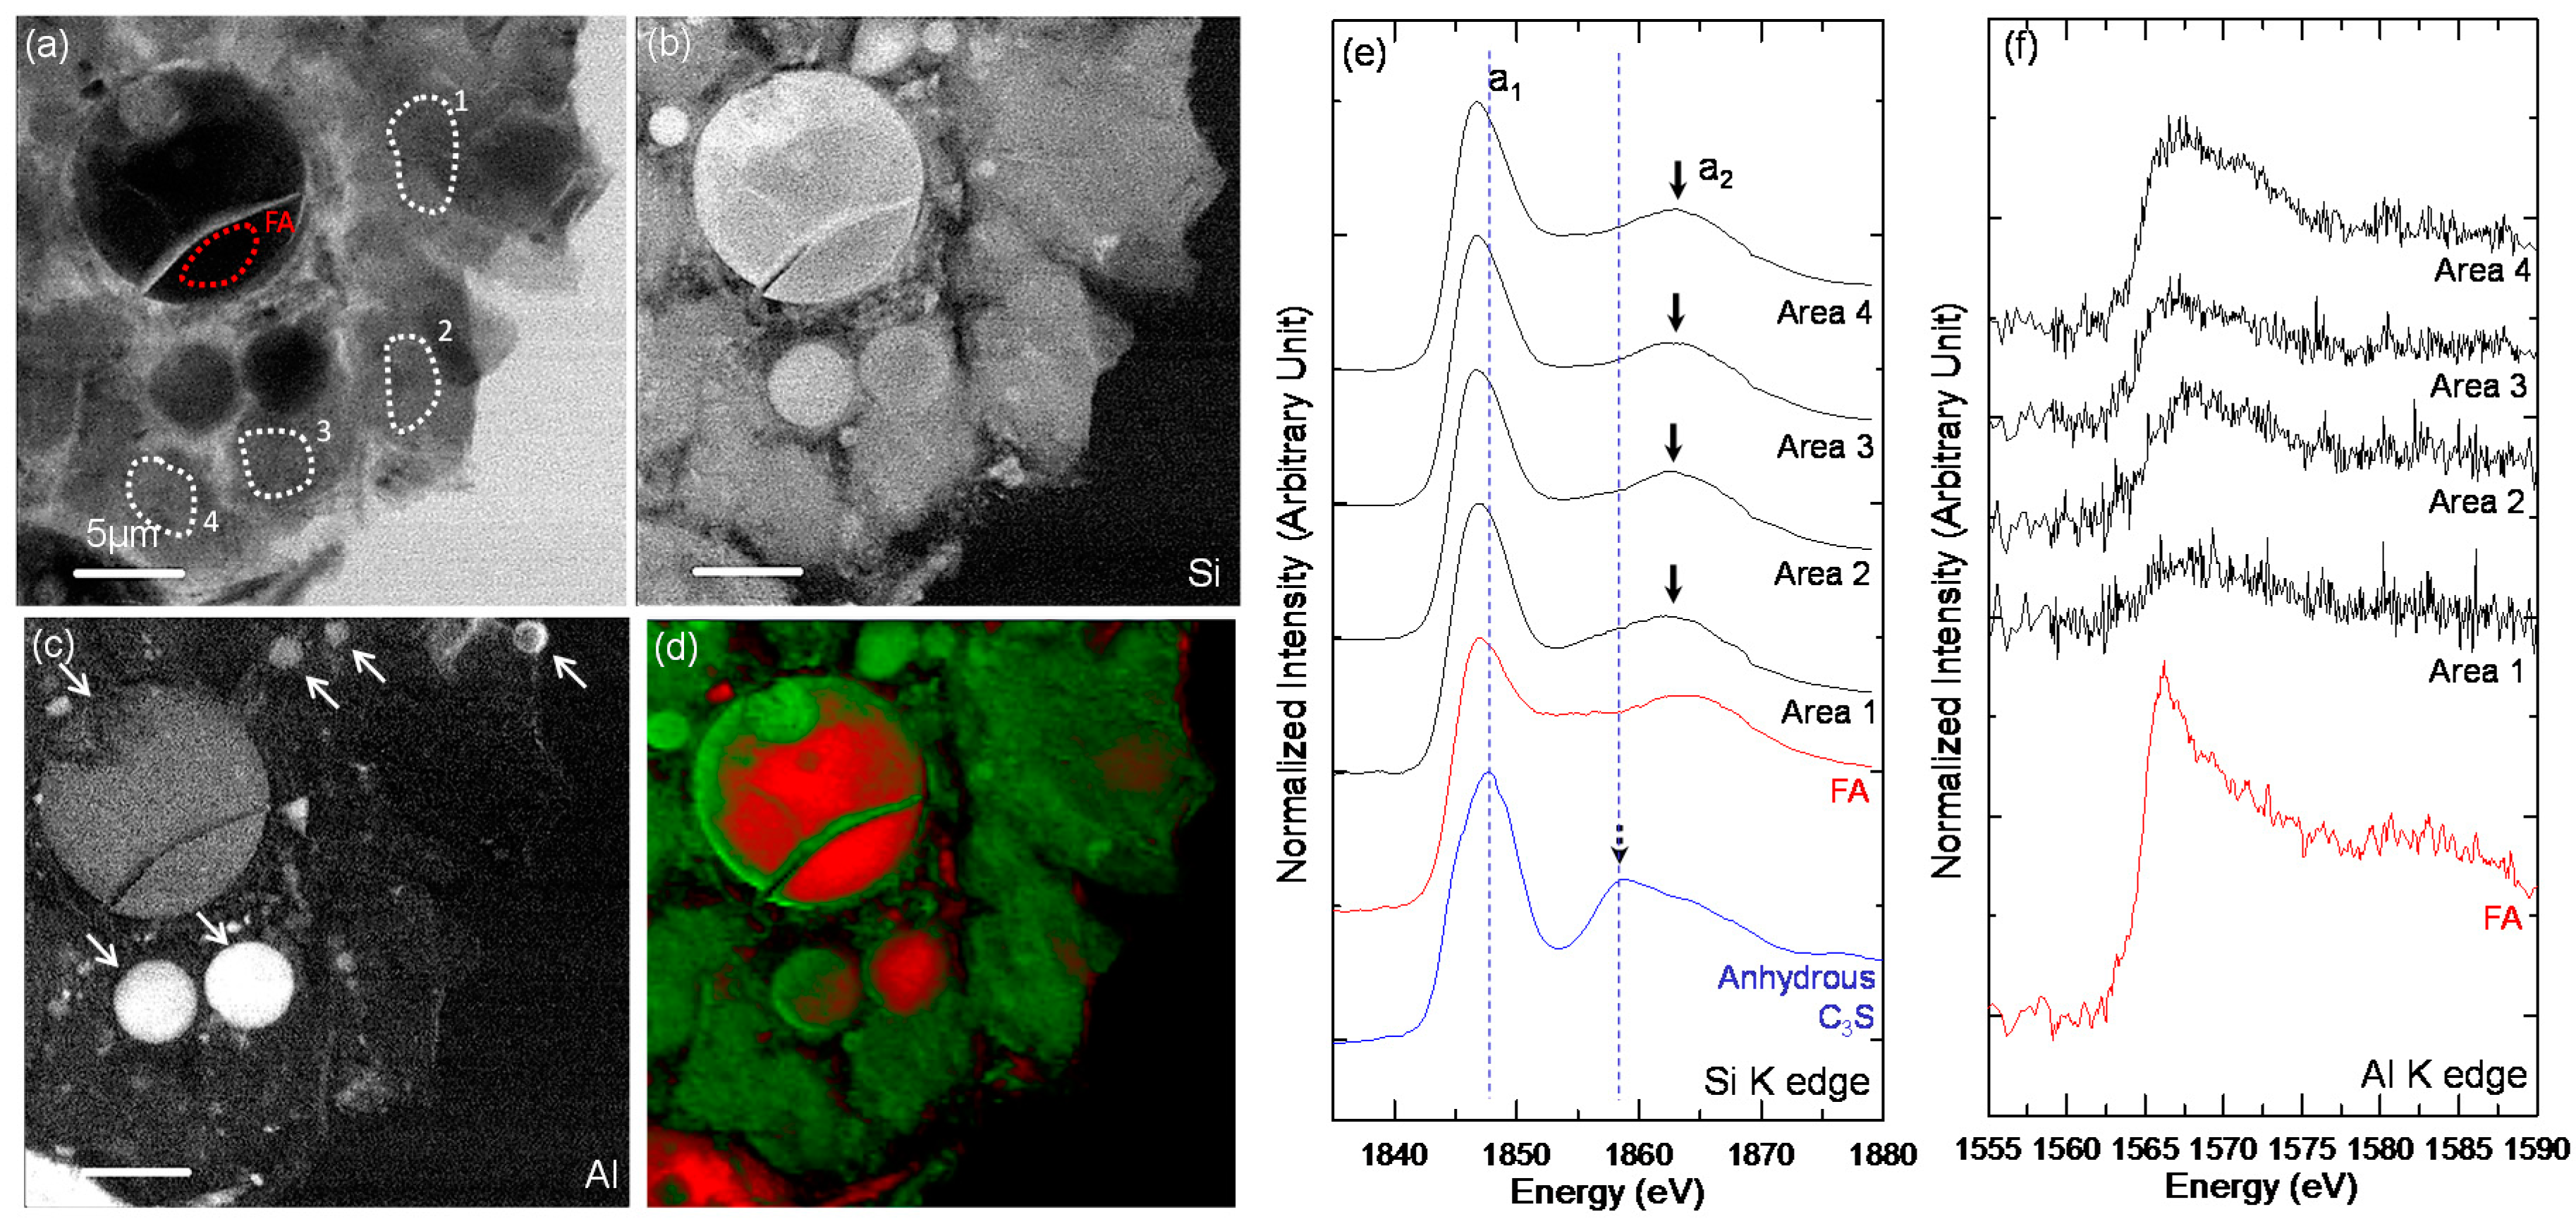
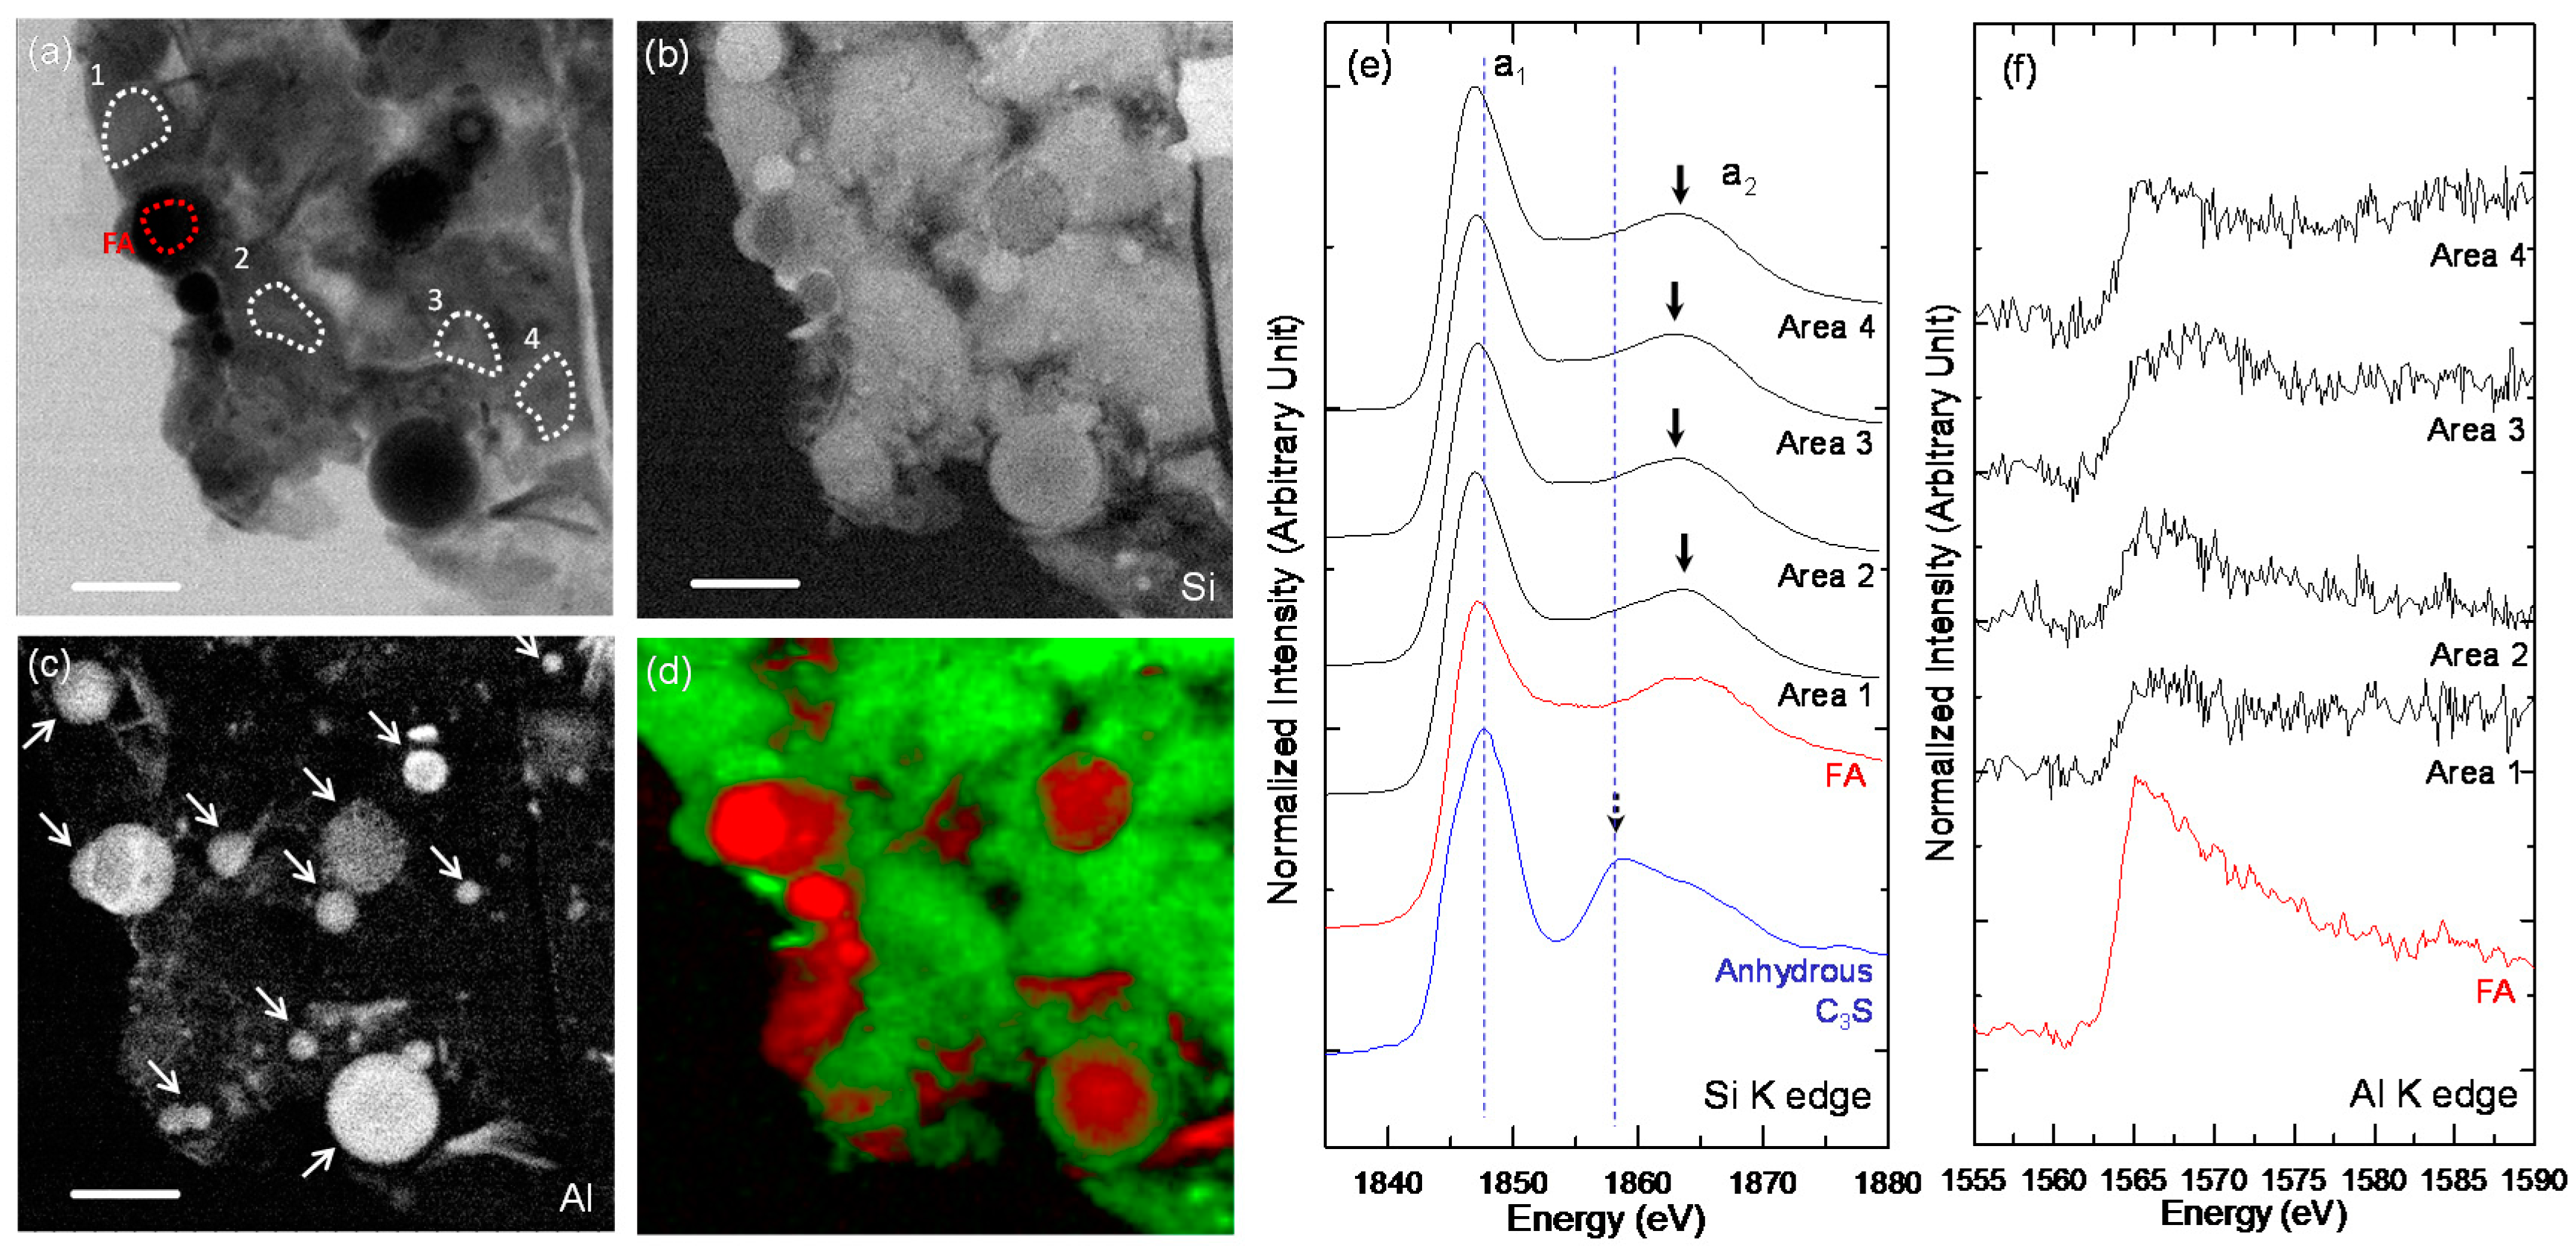
3.3. STXM Analysis
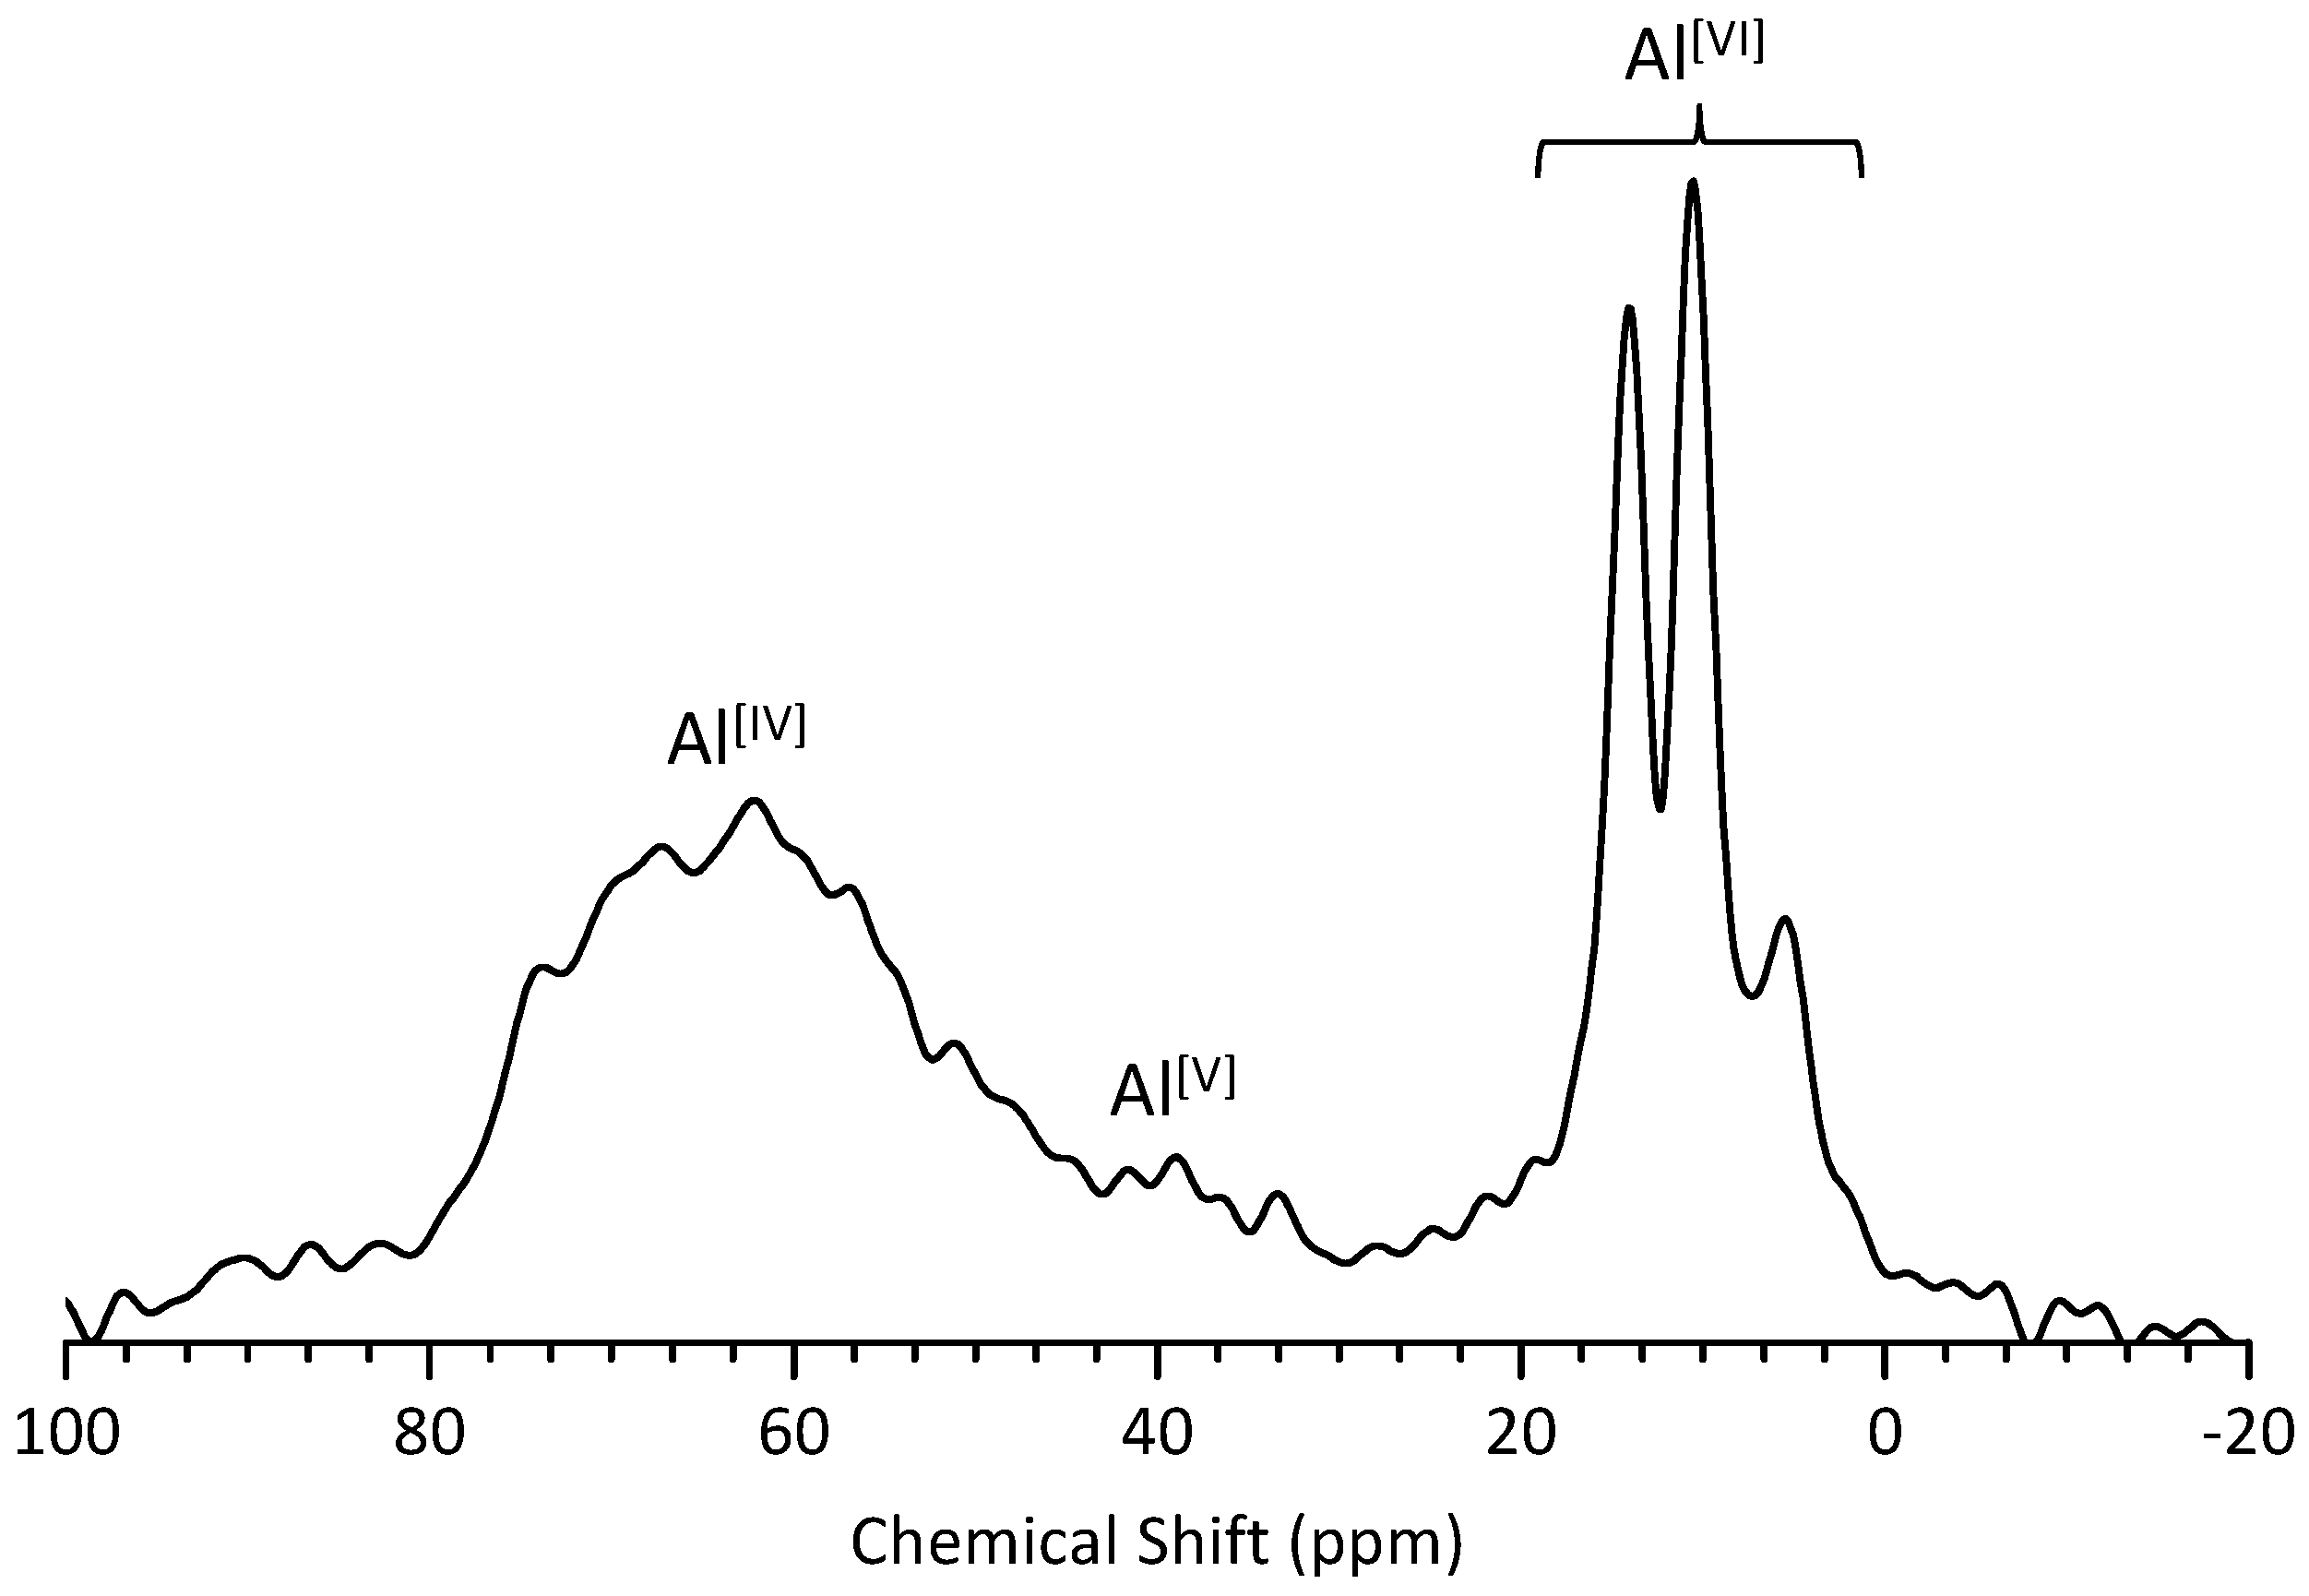
3.4. 27Al MAS NMR Analysis
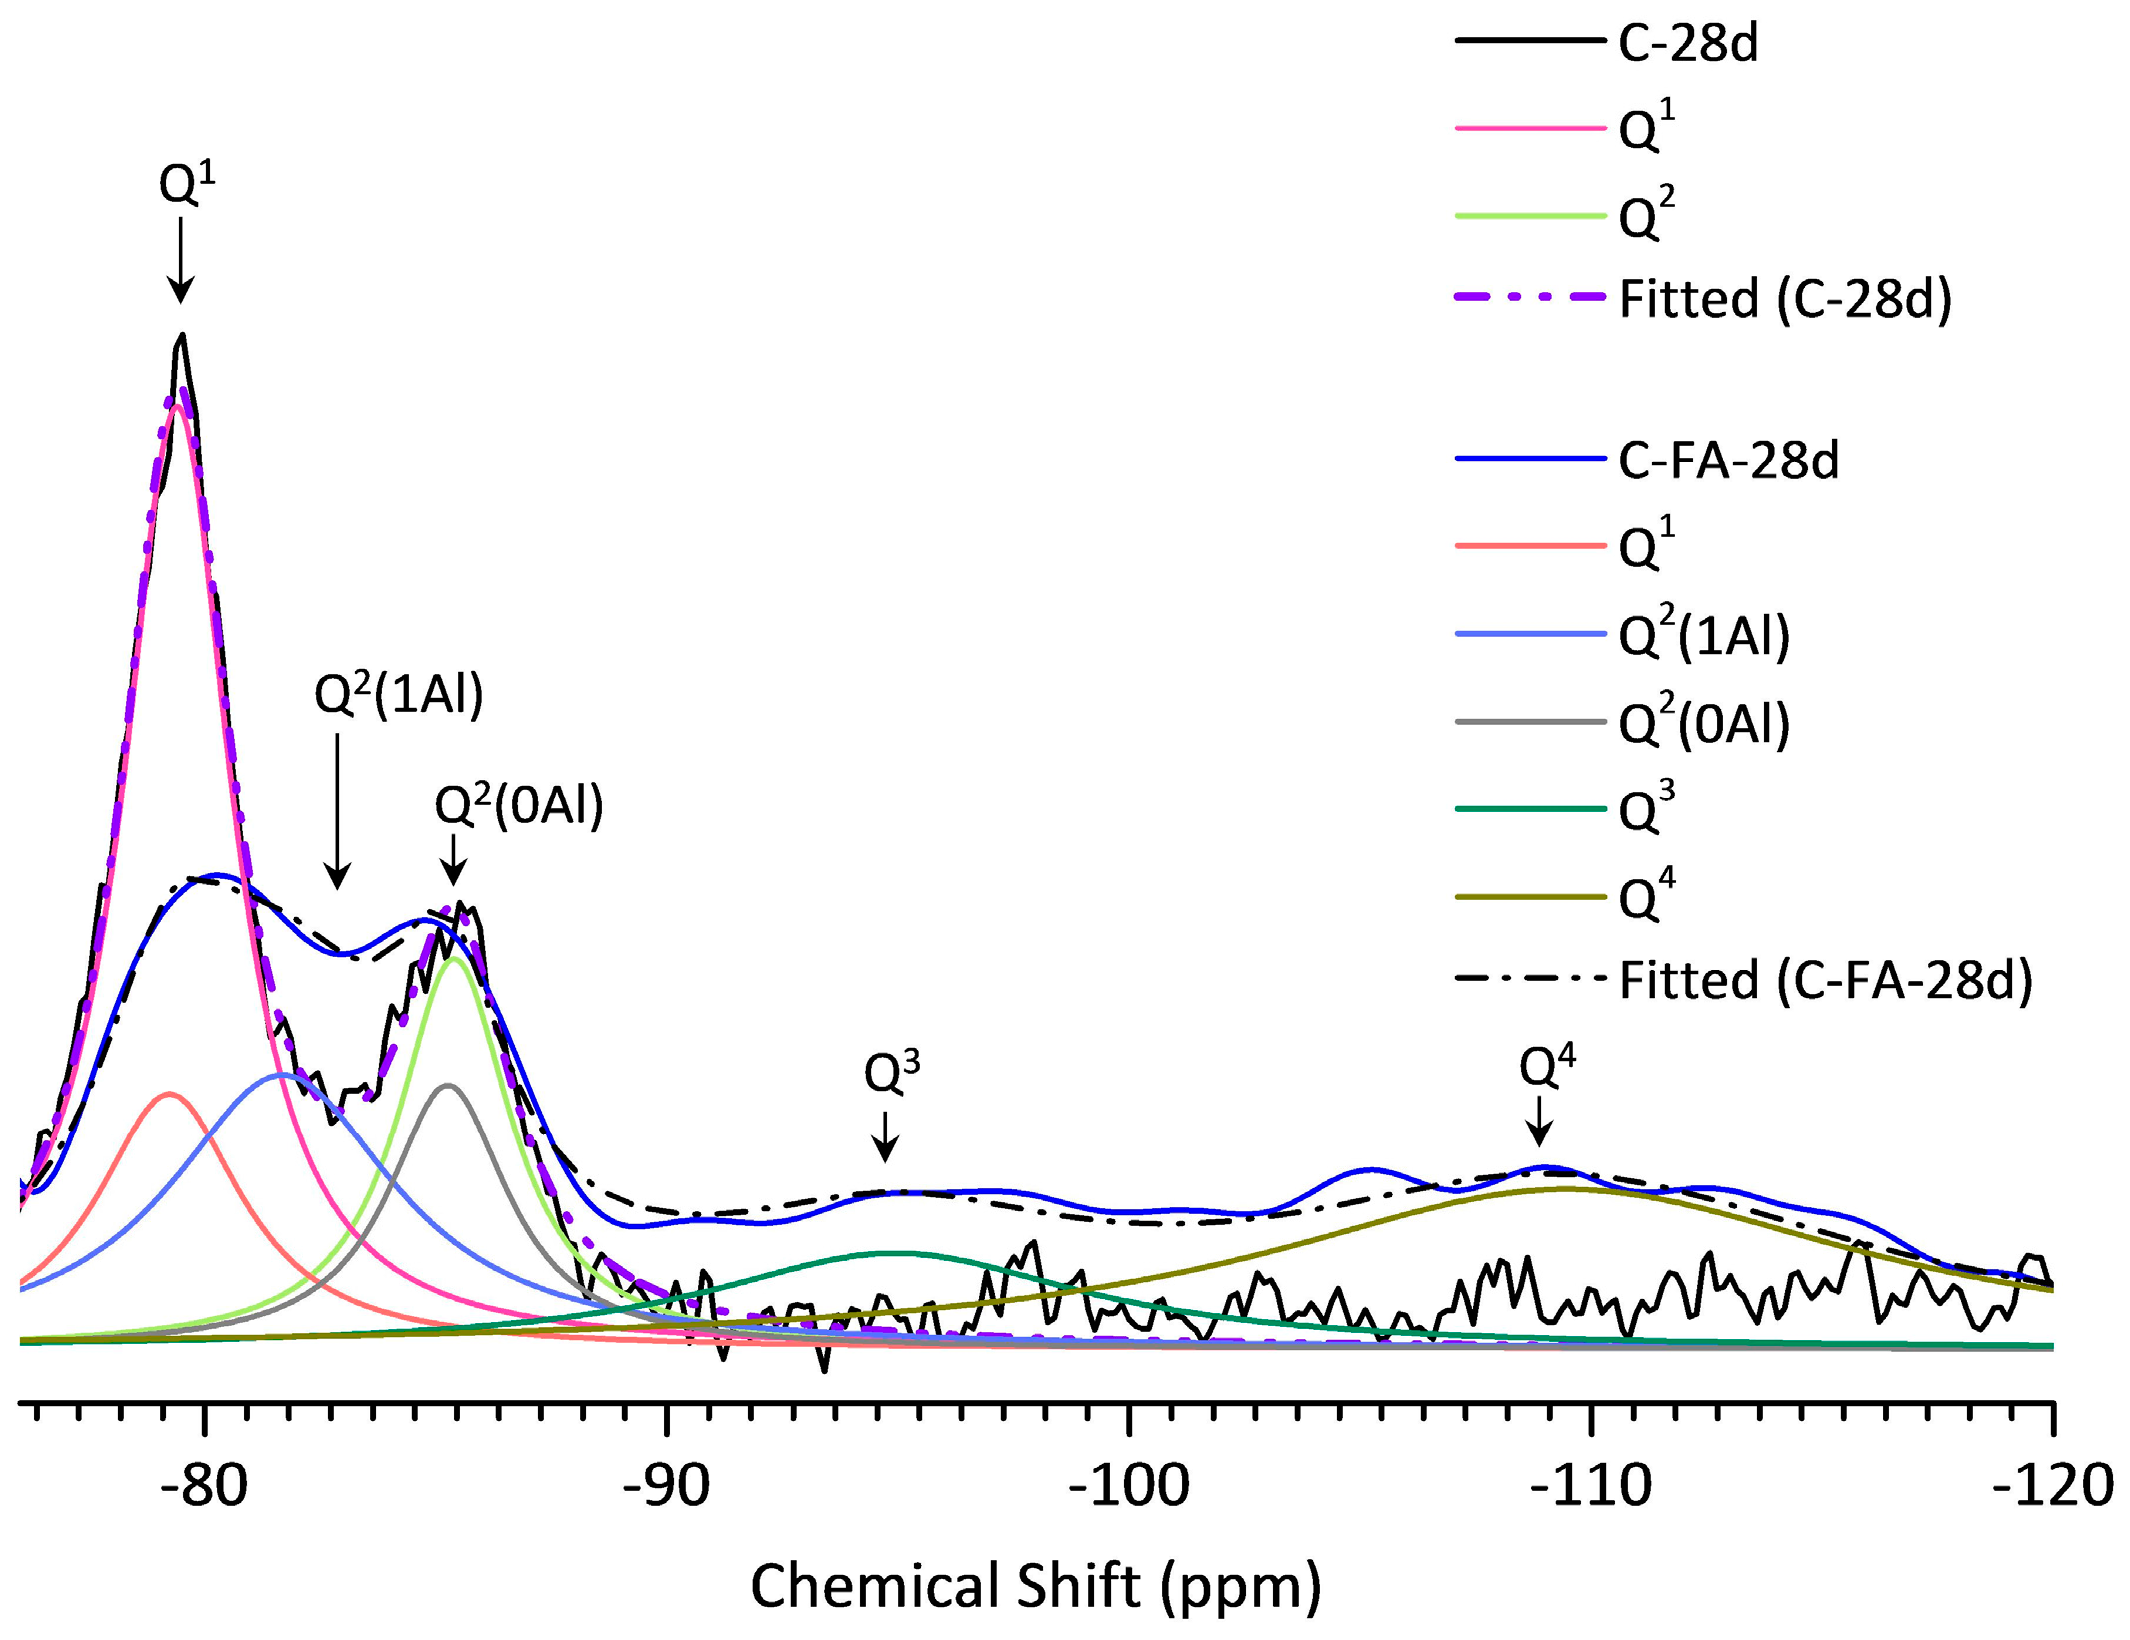
3.5. 29Si MAS NMR Analysis
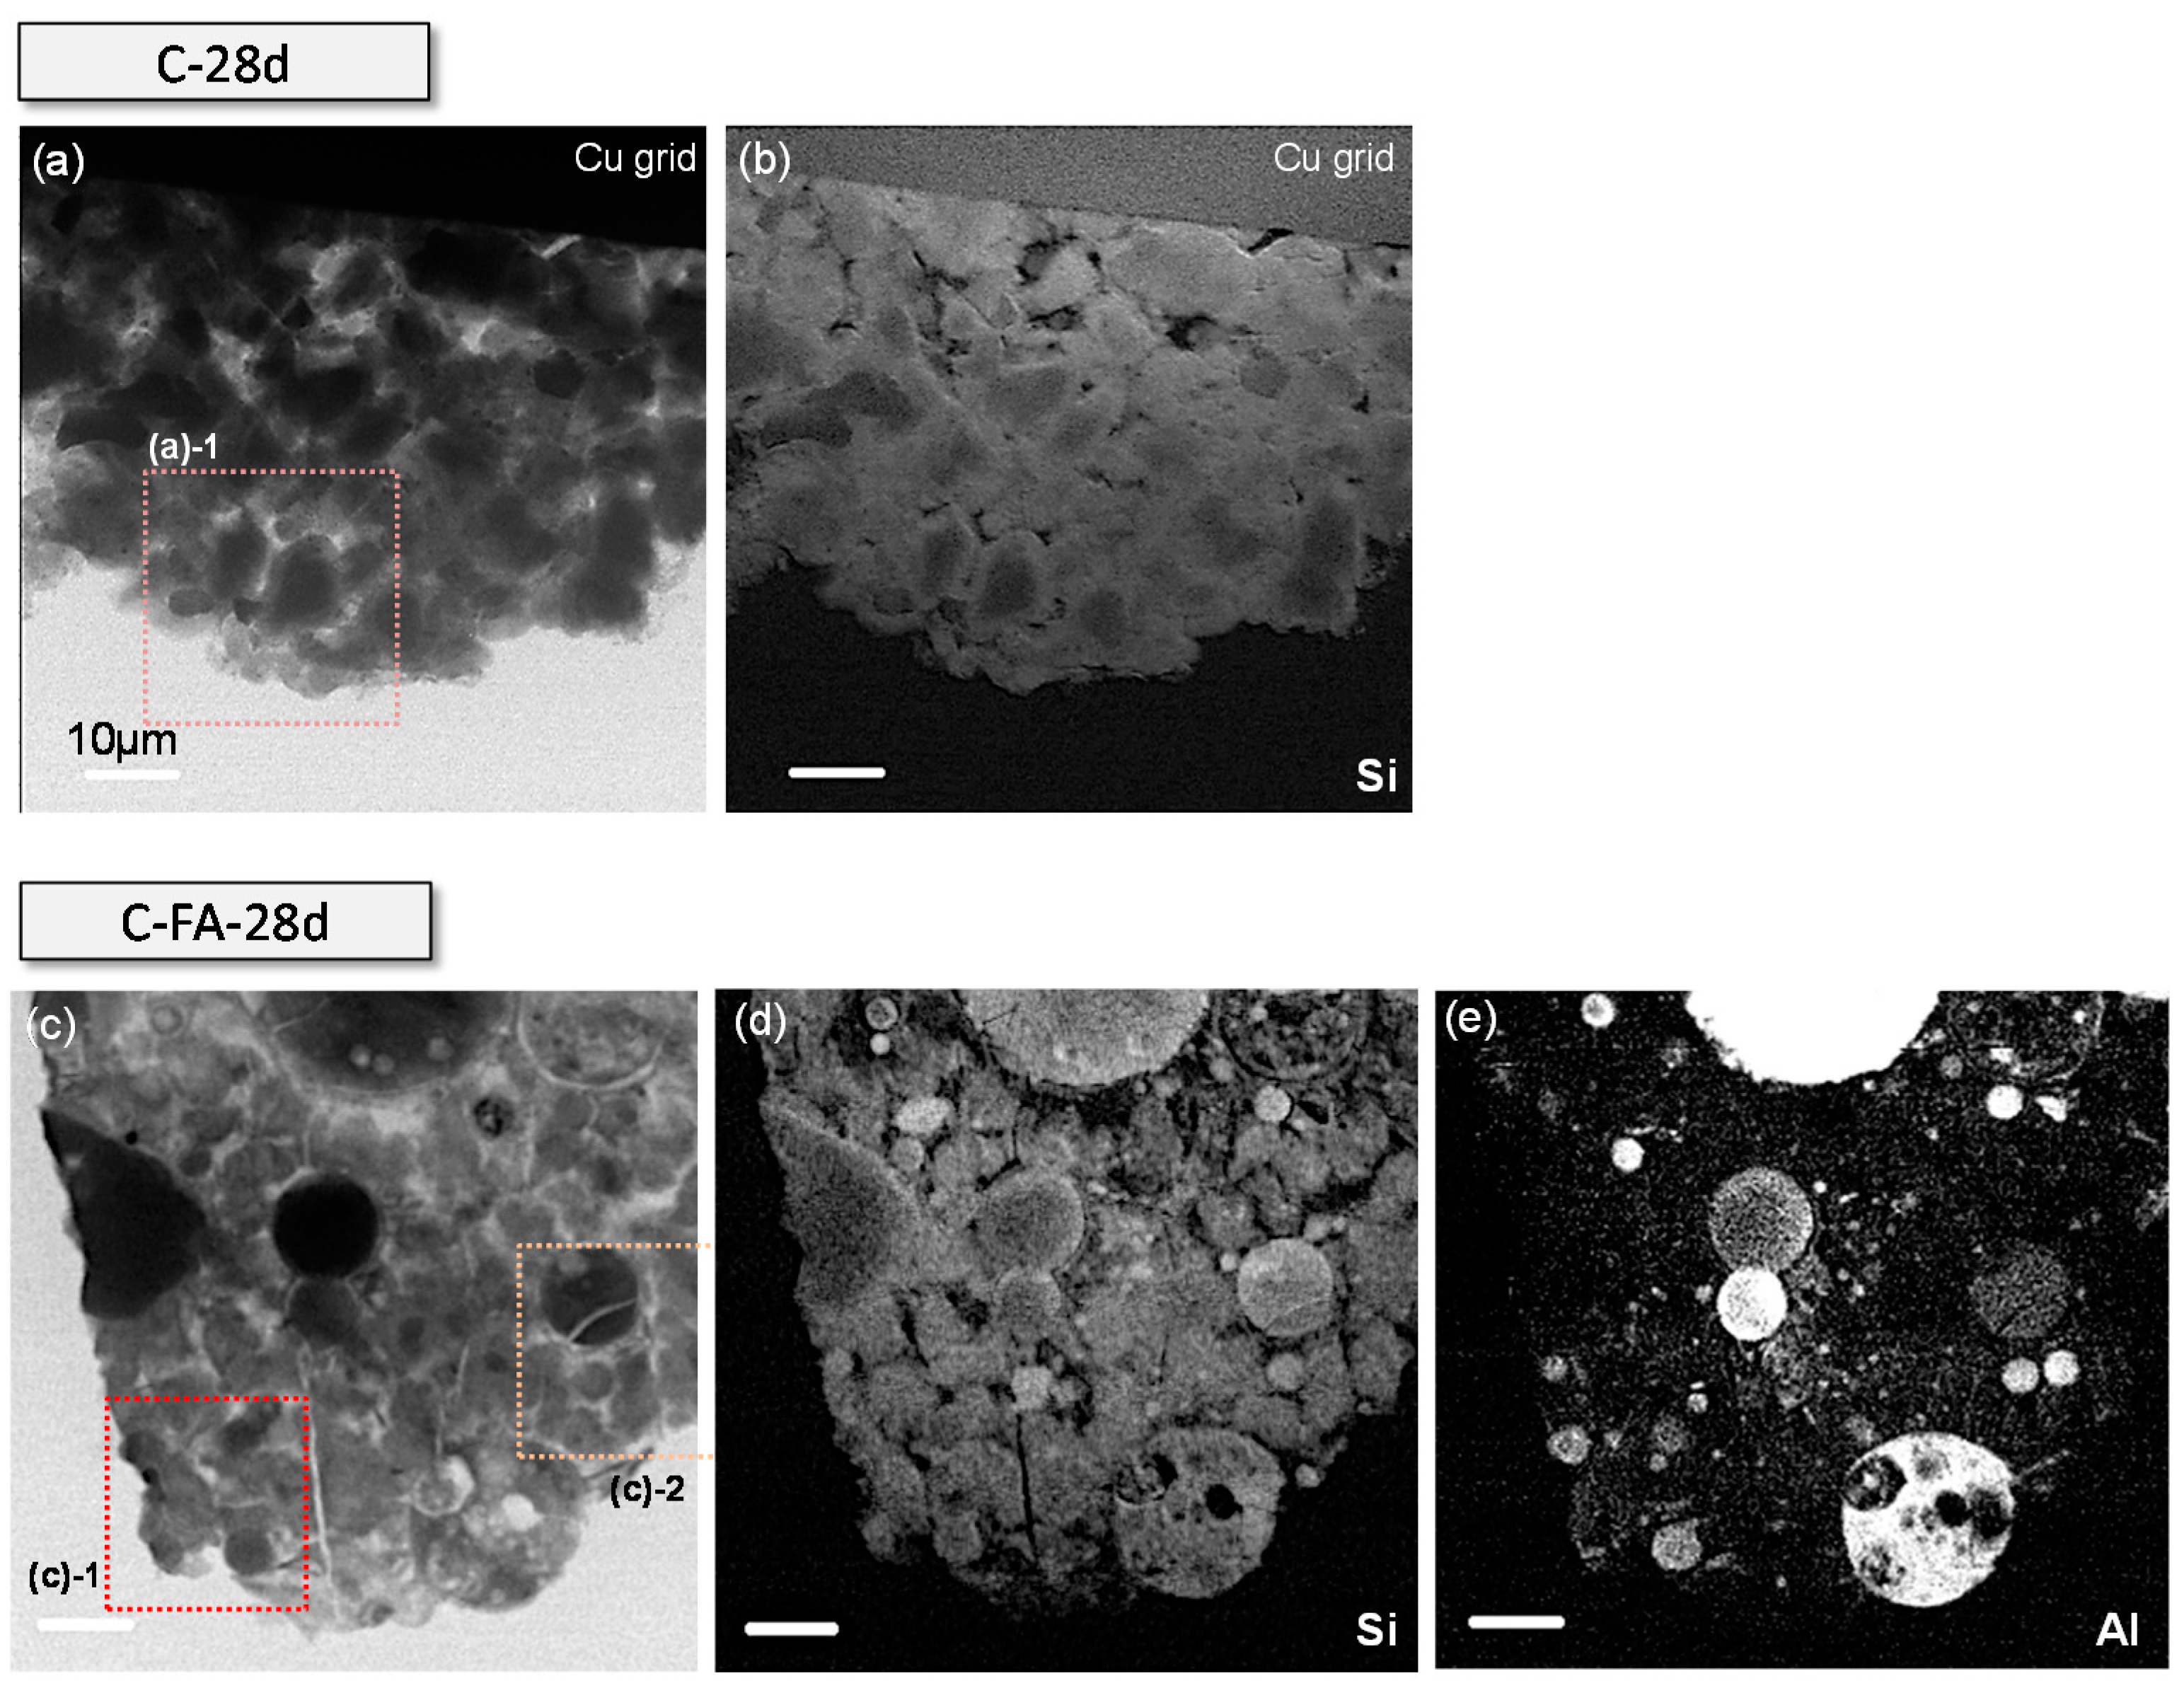
3.6. Morphological TEM Imaging of the C3S-HVFA Paste
4. Conclusions
Acknowledgments
Author Contributions
Conflicts of Interest
References
- Mehta, P.K. Sustainable cements and concrete for the climate change era—A review. In Proceedings of the Second International Conference on Sustainable Construction Materials and Technologies, Aneona, Italy, 28–30 June 2010; pp. 1–10.
- Malhotra, V.M.; Painter, K.E. Early-age strength properties, and freezing and thawing resistance of concrete incorporating high volumes of ASTM class F fly ash. Int. J. Cem. Compos. Lightweight Concr. 1989, 11, 37–46. [Google Scholar] [CrossRef]
- Bentz, D.P.; Hansen, A.S.; Guynn, J.M. Optimization of cement and fly ash particle sizes to produce sustainable concretes. Cem.Concr. Comp. 2011, 33, 824–831. [Google Scholar] [CrossRef]
- Lee, S.H.; Kim, H.J.; Sakai, E.; Daimon, M. Effect of particle size distribution of fly ash-cement system on the fluidity of cement pastes. Cem. Concr. Res. 2003, 33, 763–768. [Google Scholar] [CrossRef]
- Deschner, F.; Winnefeld, F.; Lothenbach, B.; Seufert, S.; Schwesig, P.; Dittrich, S.; Goetz-Neunhoeffer, F.; Neubauer, J. Hydration of portland cement with high replacement by siliceous fly ash. Cem. Concr. Res. 2012, 42, 1389–1400. [Google Scholar] [CrossRef]
- Lam, L.; Wong, Y.L.; Poon, C.S. Degree of hydration and gel/space ratio of high-volume fly ash/cement systems. Cem. Concr. Res. 2000, 30, 747–756. [Google Scholar] [CrossRef]
- Malek, R.I.; Khahlil, Z.H.; Imbaby, S.S.; Roy, D.M. The contribution of class-F fly ash to the strength of cementitious mixtures. Cem. Concr. Res. 2005, 35, 1152–1154. [Google Scholar] [CrossRef]
- Girao, A.V.; Richardson, I.G.; Taylor, R.; Brydson, R.M.D. Composition, morphology and nanostructure of C–S–H in 70% white portland cement-30% fly ash blends hydrated at 55 °C. Cem. Concr. Res. 2010, 40, 1350–1359. [Google Scholar] [CrossRef]
- Richardson, I.G. The calcium silicate hydrates. Cem. Concr. Res. 2008, 38, 137–158. [Google Scholar] [CrossRef]
- Lothenbach, B.; Scrivener, K.; Hooton, R.D. Supplementary cementitious materials. Cem. Concr. Res. 2011, 41, 1244–1256. [Google Scholar] [CrossRef]
- Black, L.; Garbev, K.; Stemmermann, P.; Hallam, K.R.; Allen, G.C. Characterisation of crystalline C–S–H phases by X-ray photoelectron spectroscopy. Cem. Concr. Res. 2003, 33, 899–911. [Google Scholar] [CrossRef]
- Richardson, I.G. The nature of C–S–H in hardened cements. Cem. Concr. Res. 1999, 29, 1131–1147. [Google Scholar] [CrossRef]
- L’Hôpital, E.; Lothenbach, B.; Kulik, D.A.; Scrivener, K. Influence of calcium to silica ratio on aluminium uptake in calcium silicate hydrate. Cem. Concr. Res. 2016, 85, 111–121. [Google Scholar] [CrossRef]
- Bae, S.; Meral, C.; Oh, J.; Moon, J.; Kunz, M.; Monteiro, P.J.M. Characterization of morphology and hydration products of high-volume fly ash paste by monochromatic scanning X-ray micro-diffraction (μ-SXRD). Cem. Concr. Res. 2014, 59, 155–164. [Google Scholar] [CrossRef]
- Rodríguez, E.; Bernal, S.; Provis, J.; Payá, J.; Monzó, J.; Borrachero, M. Structure of portland cement pastes blended with sonicated silica fume. J. Mater. Civ. Eng. 2012, 24, 1295–1304. [Google Scholar] [CrossRef]
- Richardson, I.G.; Groves, G.W. The incorporation of minor and trace-elements into calcium silicate hydrate (C–S–H) gel in hardened cement pastes. Cem. Concr. Res. 1993, 23, 131–138. [Google Scholar] [CrossRef]
- Pardal, X.; Pochard, I.; Nonat, A. Experimental study of Si–Al substitution in calcium-silicate-hydrate (C–S–H) prepared under equilibrium conditions. Cem. Concr. Res. 2009, 39, 637–643. [Google Scholar] [CrossRef]
- L’Hopital, E.; Lothenbach, B.; Le Saout, G.; Kulik, D.; Scrivener, K. Incorporation of aluminium in calcium-silicate-hydrates. Cem. Concr. Res. 2015, 75, 91–103. [Google Scholar] [CrossRef]
- Rheinheimer, V.; Casanova, I. Hydration of C3S thin films. Cem. Concr. Res. 2012, 42, 593–597. [Google Scholar] [CrossRef]
- Okada, K.; Kameshima, Y.; Yasumori, A. Chemical shifts of silicon X-ray photoelectron spectra by polymerization structures of silicates. J. Am. Ceram. Soc. 1998, 81, 1970–1972. [Google Scholar] [CrossRef]
- Li, D.; Bancroft, G.M.; Fleet, M.E.; Feng, X.H. Silicon K-edge XANES spectra of silicate minerals. Phys. Chem. Miner. 1995, 22, 115–122. [Google Scholar] [CrossRef]
- Richardson, I.G.; Brough, A.R.; Brydson, R.; Groves, G.W.; Dobson, C.M. Location of aluminum in substituted calcium silicate hydrate (C–S–H) gels as determined by 29Si and 27Al NMR and EELS. J. Am. Ceram. Soc. 1993, 76, 2285–2288. [Google Scholar] [CrossRef]
- Andersen, M.D.; Jakobsen, H.J.; Skibsted, J. Incorporation of aluminum in the calcium silicate hydrate (C–S–H) of hydrated portland cements: A high-field 27Al and 29Si MAS NMR investigation. Inorg. Chem. 2003, 42, 2280–2287. [Google Scholar] [CrossRef] [PubMed]
- Andersen, M.D.; Jakobsen, H.J.; Skibsted, J. A new aluminium-hydrate species in hydrated portland cements characterized by 27Al and 29Si MAS NMR spectroscopy. Cem. Concr. Res. 2006, 36, 3–17. [Google Scholar] [CrossRef]
- Sun, G.K.; Young, J.F.; Kirkpatrick, R.J. The role of al in C–S–H: NMR, XRD, and compositional results for precipitated samples. Cem. Concr. Res. 2006, 36, 18–29. [Google Scholar] [CrossRef]
- Richardson, I. Model structures for C–(A)–S–H(I). Acta Crystallogr. Sect. B 2014, 70, 903–923. [Google Scholar] [CrossRef] [PubMed]
- Manzano, H.; Dolado, J.S.; Ayuela, A. Aluminum incorporation to dreierketten silicate chains. J. Phys. Chem B 2009, 113, 2832–2839. [Google Scholar] [CrossRef] [PubMed]
- Pardal, X.; Brunet, F.; Charpentier, T.; Pochard, I.; Nonat, A. Al-27 and si-29 solid-state nmr characterization of calcium-aluminosilicate-hydrate. Inorg. Chem. 2012, 51, 1827–1836. [Google Scholar] [CrossRef] [PubMed]
- Bae, S.; Taylor, R.; Hernández-Cruz, D.; Yoon, S.; Kilcoyne, D.; Monteiro, P.J.M. Soft X-ray spectromicroscopic investigation of synthetic C–S–H and C3S hydration products. J. Am. Ceram. Soc. 2015, 98, 2914–2920. [Google Scholar] [CrossRef]
- Bae, S.; Taylor, R.; Shapiro, D.; Denes, P.; Joseph, J.; Celestre, R.; Marchesini, S.; Padmore, H.; Tyliszczak, T.; Warwick, T.; et al. Soft X-ray ptychographic imaging and morphological quantification of calcium silicate hydrates (C–S–H). J. Am. Ceram. Soc. 2015, 98, 4090–4095. [Google Scholar] [CrossRef]
- Bae, S.; Kanematsu, M.; Hernández-Cruz, D.; Moon, J.; Kilcoyne, D.; Monteiro, P. In situ soft X-ray spectromicroscopy of early tricalcium silicate hydration. Materials 2016, 9, 976. [Google Scholar] [CrossRef]
- Kunz, M.; MacDowell, A.A.; Caldwell, W.A.; Cambie, D.; Celestre, R.S.; Domning, E.E.; Duarte, R.M.; Gleason, A.E.; Glossinger, J.M.; Kelez, N.; et al. A beamline for high-pressure studies at the advanced light source with a superconducting bending magnet as the source. J. Synchrotron Radiat. 2005, 12, 650–658. [Google Scholar] [CrossRef] [PubMed]
- Hitchcock, A.P. aXis 2000—Analysis of X-ray Images and Spectra. Available online: http://unicorn.mcmaster.ca/aXis2000.html (accessed on 26 December 2016).
- Ha, J.; Chae, S.; Chou, K.; Tyliszczak, T.; Monteiro, P. Effect of polymers on the nanostructure and on the carbonation of calcium silicate hydrates: A scanning transmission X-ray microscopy study. J. Mater. Sci. 2012, 47, 976–989. [Google Scholar] [CrossRef]
- Mottana, A.; Robert, J.L.; Marcelli, A.; Giuli, G.; Della Ventura, G.; Paris, E.; Wu, Z.Y. Octahedral versus tetrahedral coordination of Al in synthetic micas determined by XANES. Am. Mineral. 1997, 82, 497–502. [Google Scholar] [CrossRef]
- Chudek, J.; Hunter, G.; Jones, M.; Scrimgeour, S.; Hewlett, P.; Kudryavtsev, A. Aluminium-27 solid state NMR spectroscopic studies of chloride binding in Portland cement and blends. J. Mater. Sci. 2000, 35, 4275–4288. [Google Scholar] [CrossRef]
- Mackenzie, K.J.D.; Smith, M.E. Multinuclear Solid-State NMR of Inorganic Materials; Pergamon: Amsterdam, The Netherlands, 2002; Volume 6. [Google Scholar]
- Love, C.A. Microstructure and Silicate Anion Structure of Hardened Blended Cement Pastes; University of Leeds: Leeds, UK, 2002. [Google Scholar]
- Ogawa, K.; Uchikawa, H.; Takemoto, K.; Yasui, I. The mechanism of the hydration in the system C3S-pozzolana. Cement Concr. Res. 1980, 10, 683–696. [Google Scholar] [CrossRef]
- Thomas, J.J.; Jennings, H.M.; Chen, J.J. Influence of nucleation seeding on the hydration mechanisms of tricalcium silicate and cement. J. Phys. Chem. C 2009, 113, 4327–4334. [Google Scholar] [CrossRef]
- De Groot, F.M.F.; Fuggle, J.C.; Thole, B.T.; Sawatzky, G.A. 2p X-ray absorption of 3d transition-metal compounds: An atomic multiplet description including the crystal field. Phys. Rev. B 1990, 42, 5459–5468. [Google Scholar] [CrossRef]
- Naftel, S.J.; Sham, T.K.; Yiu, Y.M.; Yates, B.W. Calcium L-edge XANES study of some calcium compounds. J. Synchrotron Radiat. 2001, 8, 255–257. [Google Scholar] [CrossRef] [PubMed]
- Ha, J.; Chae, S.; Chou, K.W.; Tyliszczak, T.; Monteiro, P.J.M. Scanning transmission X-ray microscopic study of carbonated calcium silicate hydrate. Transp. Res. Rec. 2010, 2142, 83–88. [Google Scholar] [CrossRef]
- Richardson, I.G.; Brough, A.R.; Groves, G.W.; Dobson, C.M. The characterization of hardened alkali-activated blast-furnace slag pastes and the nature of the calcium silicate hydrate (C–S–H) phase. Cem. Concr. Res. 1994, 24, 813–829. [Google Scholar] [CrossRef]
- Skibsted, J.; Jakobsen, H.J.; Hall, C. Direct observation of aluminium guest ions in the silicate phases of cement minerals by 27Al MAS NMR spectroscopy. J. Chem. Soc. Faraday Trans. 1994, 90, 2095–2098. [Google Scholar] [CrossRef]
- Skibsted, J.; Henderson, E.; Jakobsen, H.J. Characterization of calcium aluminate phases in cements by aluminum-27MAS NMR spectroscopy. Inorg. Chem. 1993, 32, 1013–1027. [Google Scholar] [CrossRef]
- Skibsted, J. Hydration kinetics for the alite, belite and calcium aluminate phase in Portland cement from 27Al and 29Si MAS NMR spectroscopy. In Proceedings of the 10th International Congress on the Chemistry of Cement, Gothenburg, Sweden, 2–6 June 1997.
- Richardson, I.G.; Girão, A.V.; Taylor, R.; Jia, S. Hydration of water- and alkali-activated white Portland cement pastes and blends with low-calcium pulverized fuel ash. Cem. Conc. Res. 2016, 83, 1–18. [Google Scholar] [CrossRef]
- Barnes, J.; Clague, A.; Clayden, N.; Dobson, C.; Hayes, C.; Groves, G.; Rodger, S. Hydration of Portland cement followed by 29 Si solid-state NMR spectroscopy. J. Mater. Sci. Lett. 1985, 4, 1293–1295. [Google Scholar] [CrossRef]
- Clayden, N.J.; Dobson, C.M.; Hayes, C.J.; Rodger, S.A. Hydration of tricalcium silicate followed by solid-state 29Si NMR spectroscopy. J. Chem. Soc. Chem. Commun. 1984, 21, 1396–1397. [Google Scholar] [CrossRef]
- Cong, X.D.; Kirkpatrick, R.J. Si-29 MAS NMR study of the structure of calcium silicate hydrate. Adv. Cem Based Mater. 1996, 3, 144–156. [Google Scholar] [CrossRef]
- Girao, A.V.; Richardson, I.G.; Porteneuve, C.B.; Brydson, R.M.D. Composition, morphology and nanostructure of C–S–H in white port-land cement pastes hydrated at 55 °C. Cem. Concr. Res. 2007, 37, 1571–1582. [Google Scholar] [CrossRef]
- Alizadeh, R.; Raki, L.; Makar, J.M.; Beaudoin, J.J.; Moudrakovski, I. Hydration of tricalcium silicate in the presence of synthetic calcium-silicate-hydrate. J. Mater. Chem. 2009, 19, 7937–7946. [Google Scholar] [CrossRef]
- Brunet, F.; Charpentier, T.; Chao, C.N.; Peycelon, H.; Nonat, A. Characterization by solid-state NMR and selective dissolution techniques of anhydrous and hydrated CEM V cement pastes. Cem. Concr. Res. 2010, 40, 208–219. [Google Scholar] [CrossRef]
- Faucon, P.; Delagrave, A.; Petit, J.C.; Richet, C.; Marchand, J.M.; Zanni, H. Aluminum incorporation in calcium silicate hydrates (C–S–H) depending on their Ca/Si ratio. J. Phys. Chem. B 1999, 103, 7796–7802. [Google Scholar] [CrossRef]
- Brough, A.R.; Katz, A.; Sun, G.K.; Struble, L.J.; Kirkpatrick, R.J.; Young, J.F. Adiabatically cured, alkali-activated cement-based wasteforms containing high levels of fly ash—Formation of zeolites and al-substituted C–S–H. Cem. Concr. Res. 2001, 31, 1437–1447. [Google Scholar] [CrossRef]
- Brough, A.; Dobson, C.; Richardson, I.; Groves, G. In situ solid-state NMR studies of Ca3SiO5: Hydration at room temperature and at elevated temperatures using 29Si enrichment. J. Mater. Sci. 1994, 29, 3926–3940. [Google Scholar] [CrossRef]
- Mohan, K.; Taylor, H.F.W. A trimethylsilylation study of tricalcium silicate pastes. Cem. Concr. Res. 1982, 12, 25–31. [Google Scholar] [CrossRef]
- Groves, G.W.; Le Sueur, P.J.; Sinclair, W. Transmission electron microscopy and microanalytical studies of ion-beam-thinned sections of tricalcium silicate paste. J. Am. Ceram. Soc. 1986, 69, 353–356. [Google Scholar] [CrossRef]
- Card, J.A.; Mohan, K.; Taylor, H.F.W.; Cliff, G. Analytical electron microscopy of cement pastes: I, tricalcium silicate pastes. J. Am. Ceram. Soc. 1980, 63, 336–337. [Google Scholar] [CrossRef]


| Oxide Compositions (wt %) | SiO2 | Al2O3 | Fe2O3 | CaO | MgO | Na2O | K2O | P2O5 | TiO2 | MnO | Loss on Ignition |
|---|---|---|---|---|---|---|---|---|---|---|---|
| Class F Fly Ash | 62.00 | 18.90 | 4.90 | 5.98 | 1.99 | 2.41 | 1.14 | 0.26 | 1.09 | 0.04 | 1.30 |
| Sample | Area | Peak Positions (eV) | Splitting of LIII and LII (eV) | |||||
|---|---|---|---|---|---|---|---|---|
| a1 | a2 | a3 | b1 | b2 | ∆Ca-LIII (a3 − a2) | ∆Ca-LII (b2 − b1) | ||
| Anhydrous C3S | - | 346.7 | 347.7 | 349.0 | 351.1 | 352.3 | 1.3 | 1.2 |
| Ca(OH)2 | - | 346.6 | 347.6 | 349.1 | 351 | 352.4 | 1.5 | 1.4 |
| C-28d | Area 1 | 346.9 | 348.0 | 349.1 | 351.4 | 352.4 | 1.1 | 1 |
| C-FA-28d | Area 2 | 346.8 | 348.0 | 349.1 | 351.3 | 352.4 | 1.1 | 1.1 |
| Area 3 | 346.9 | 348.0 | 349.1 | 351.3 | 352.4 | 1.1 | 1.1 | |
| Area 4 | 346.8 | 348.0 | 349.1 | 351.3 | 352.4 | 1.1 | 1.1 | |
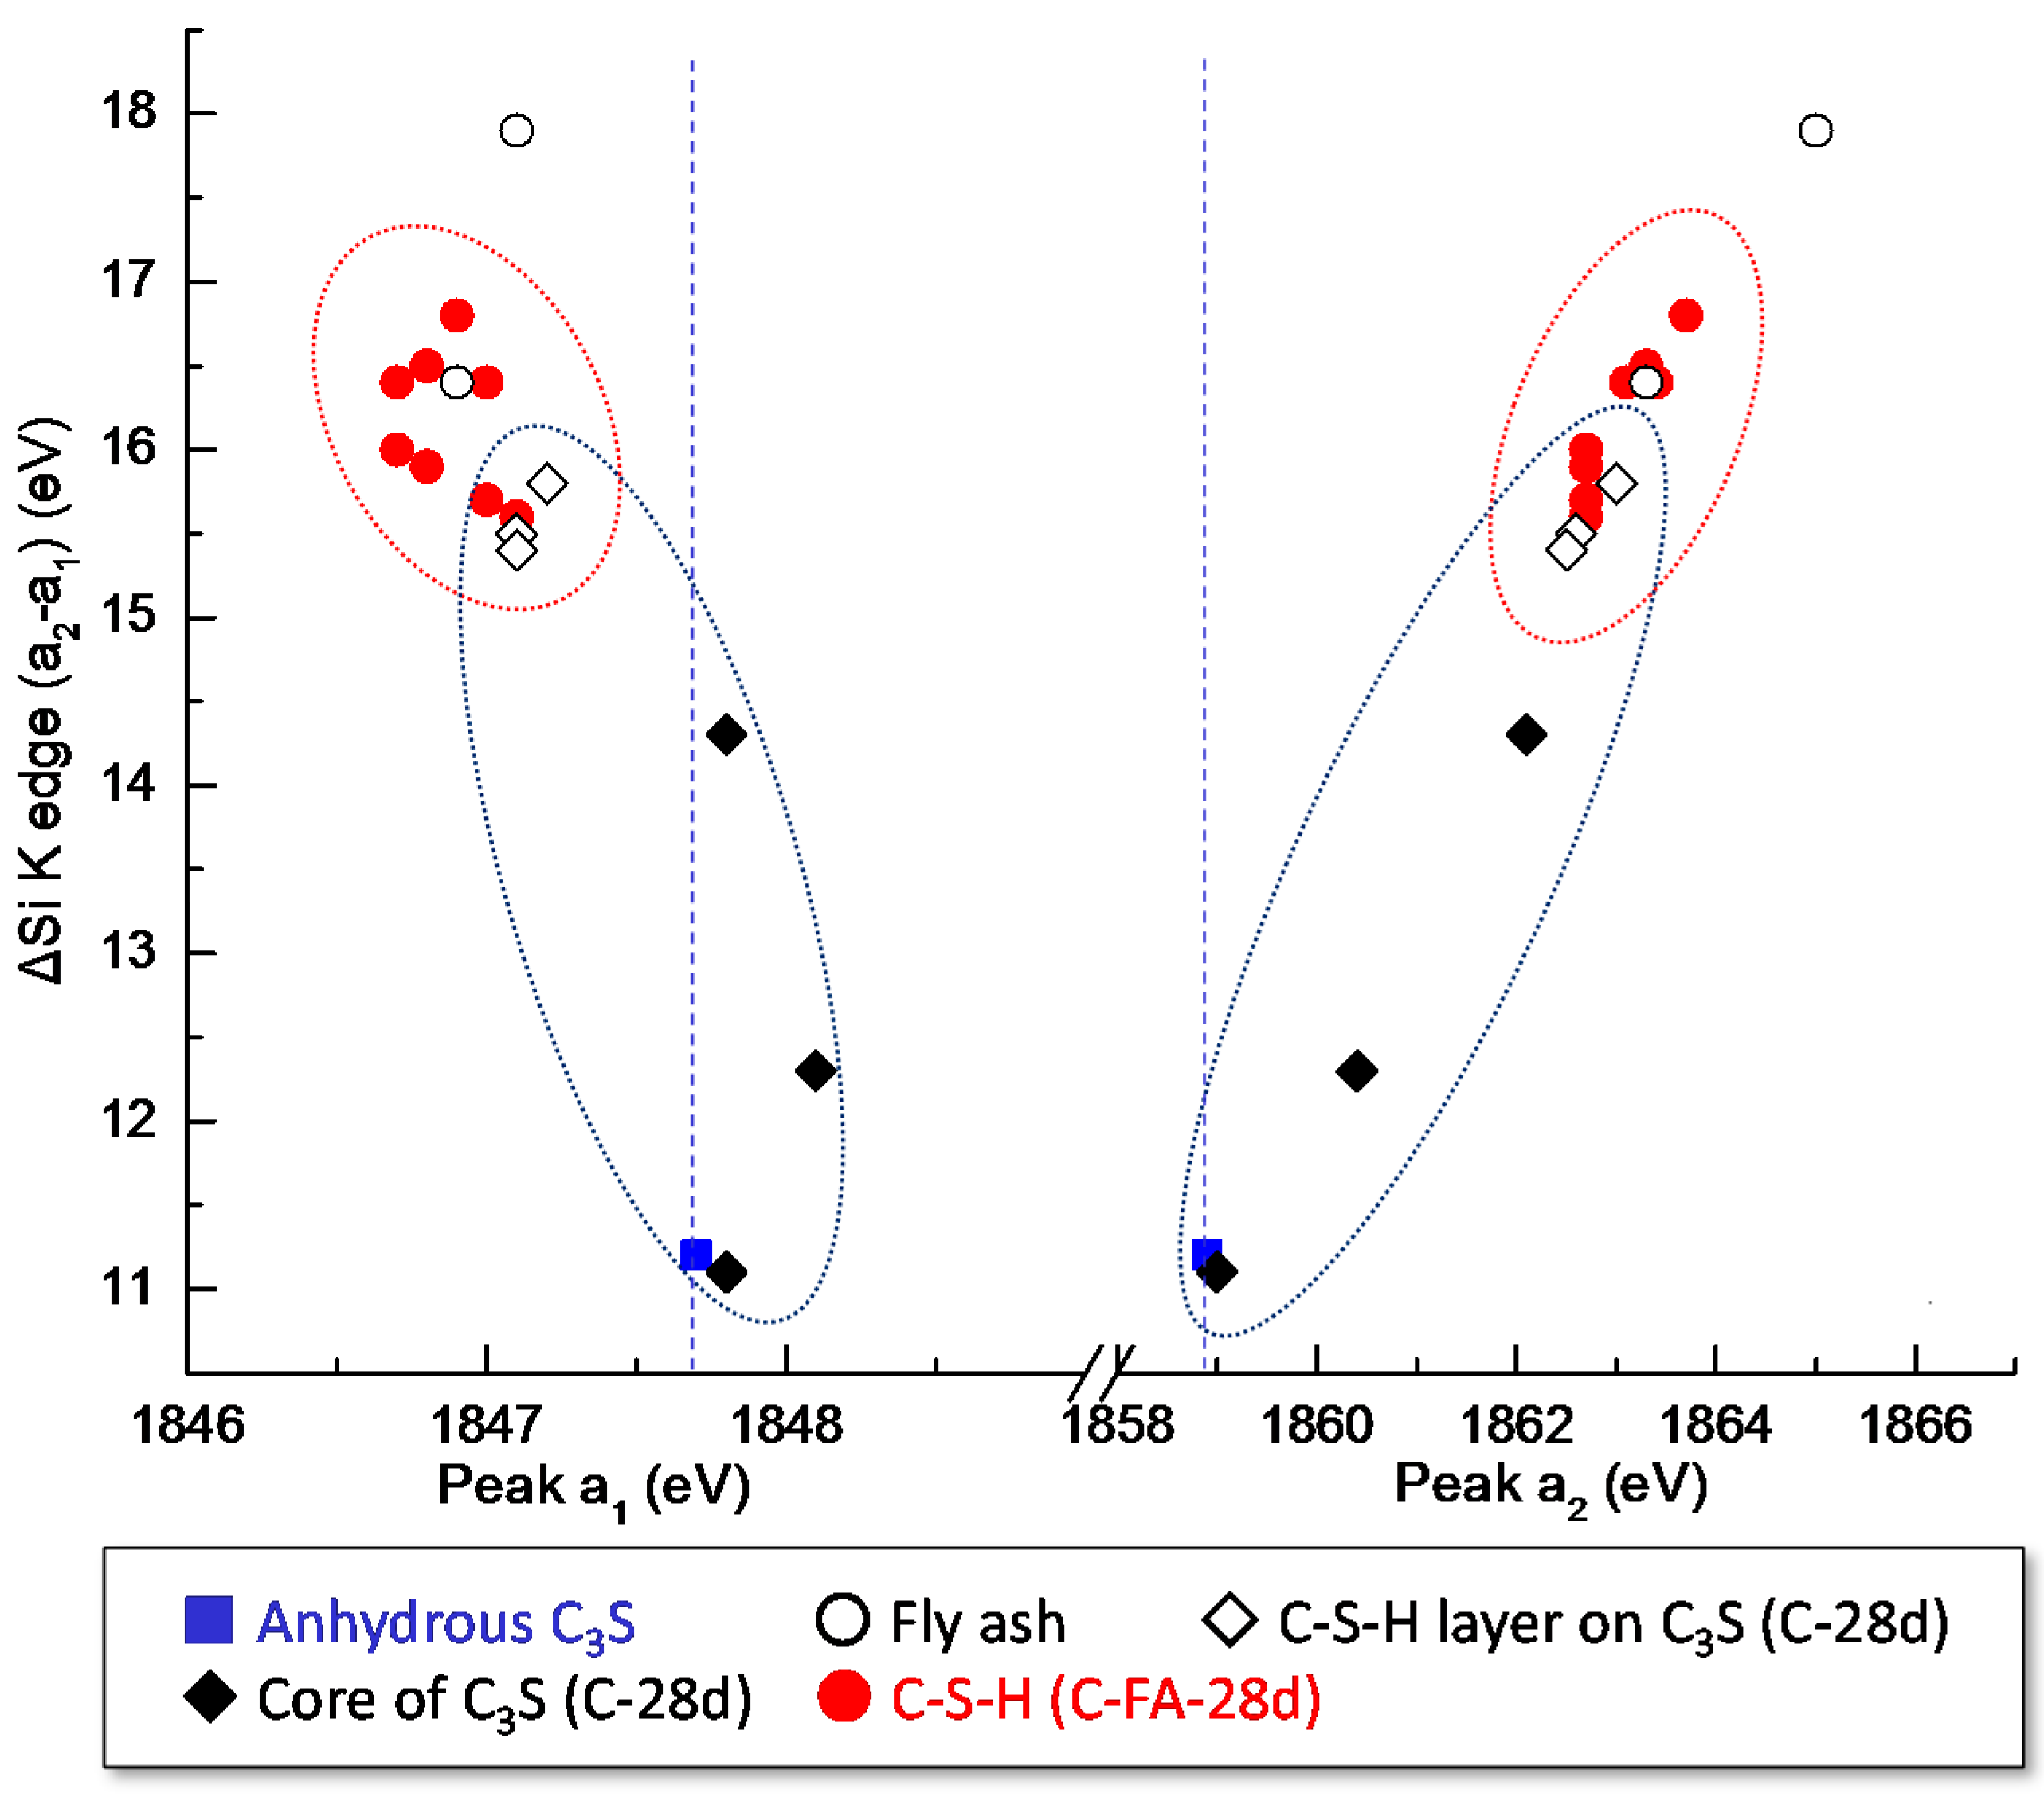
| Sample | Area | Peak a1 (eV) | Peak a2 (eV) | ΔSi-K (a2 − a1) (eV) |
|---|---|---|---|---|
| Anhydrous C3S | - | 1847.7 | 1858.9 | 11.2 |
| C-28d | Area 1 | 1848.1 | 1860.4 | 12.3 |
| Area 2 | 1847.2 | 1863.0 | 15.8 | |
| Area 3 | 1847.8 | 1859, 1862.1 | 11.1, 14.3 | |
| Area 4 | 1847.1 | 1862.6 | 15.5 | |
| Area 5 | 1847.1 | 1862.5 | 15.4 | |
| C-FA-28d-1 | FA | 1847.1 | 1865 | 17.9 |
| Area 1 | 1846.9 | 1863.7 | 16.8 | |
| Area 2 | 1847.1 | 1862.7 | 15.6 | |
| Area 3 | 1847 | 1862.7 | 15.7 | |
| Area 4 | 1846.8 | 1863.3 | 16.5 | |
| C-FA-28d-2 | FA | 1846.9 | 1863.3 | 16.4 |
| Area 1 | 1847.0 | 1863.4 | 16.4 | |
| Area 2 | 1846.8 | 1862.7 | 15.9 | |
| Area 3 | 1846.7 | 1862.7 | 16 | |
| Area 4 | 1846.7 | 1863.1 | 16.4 |
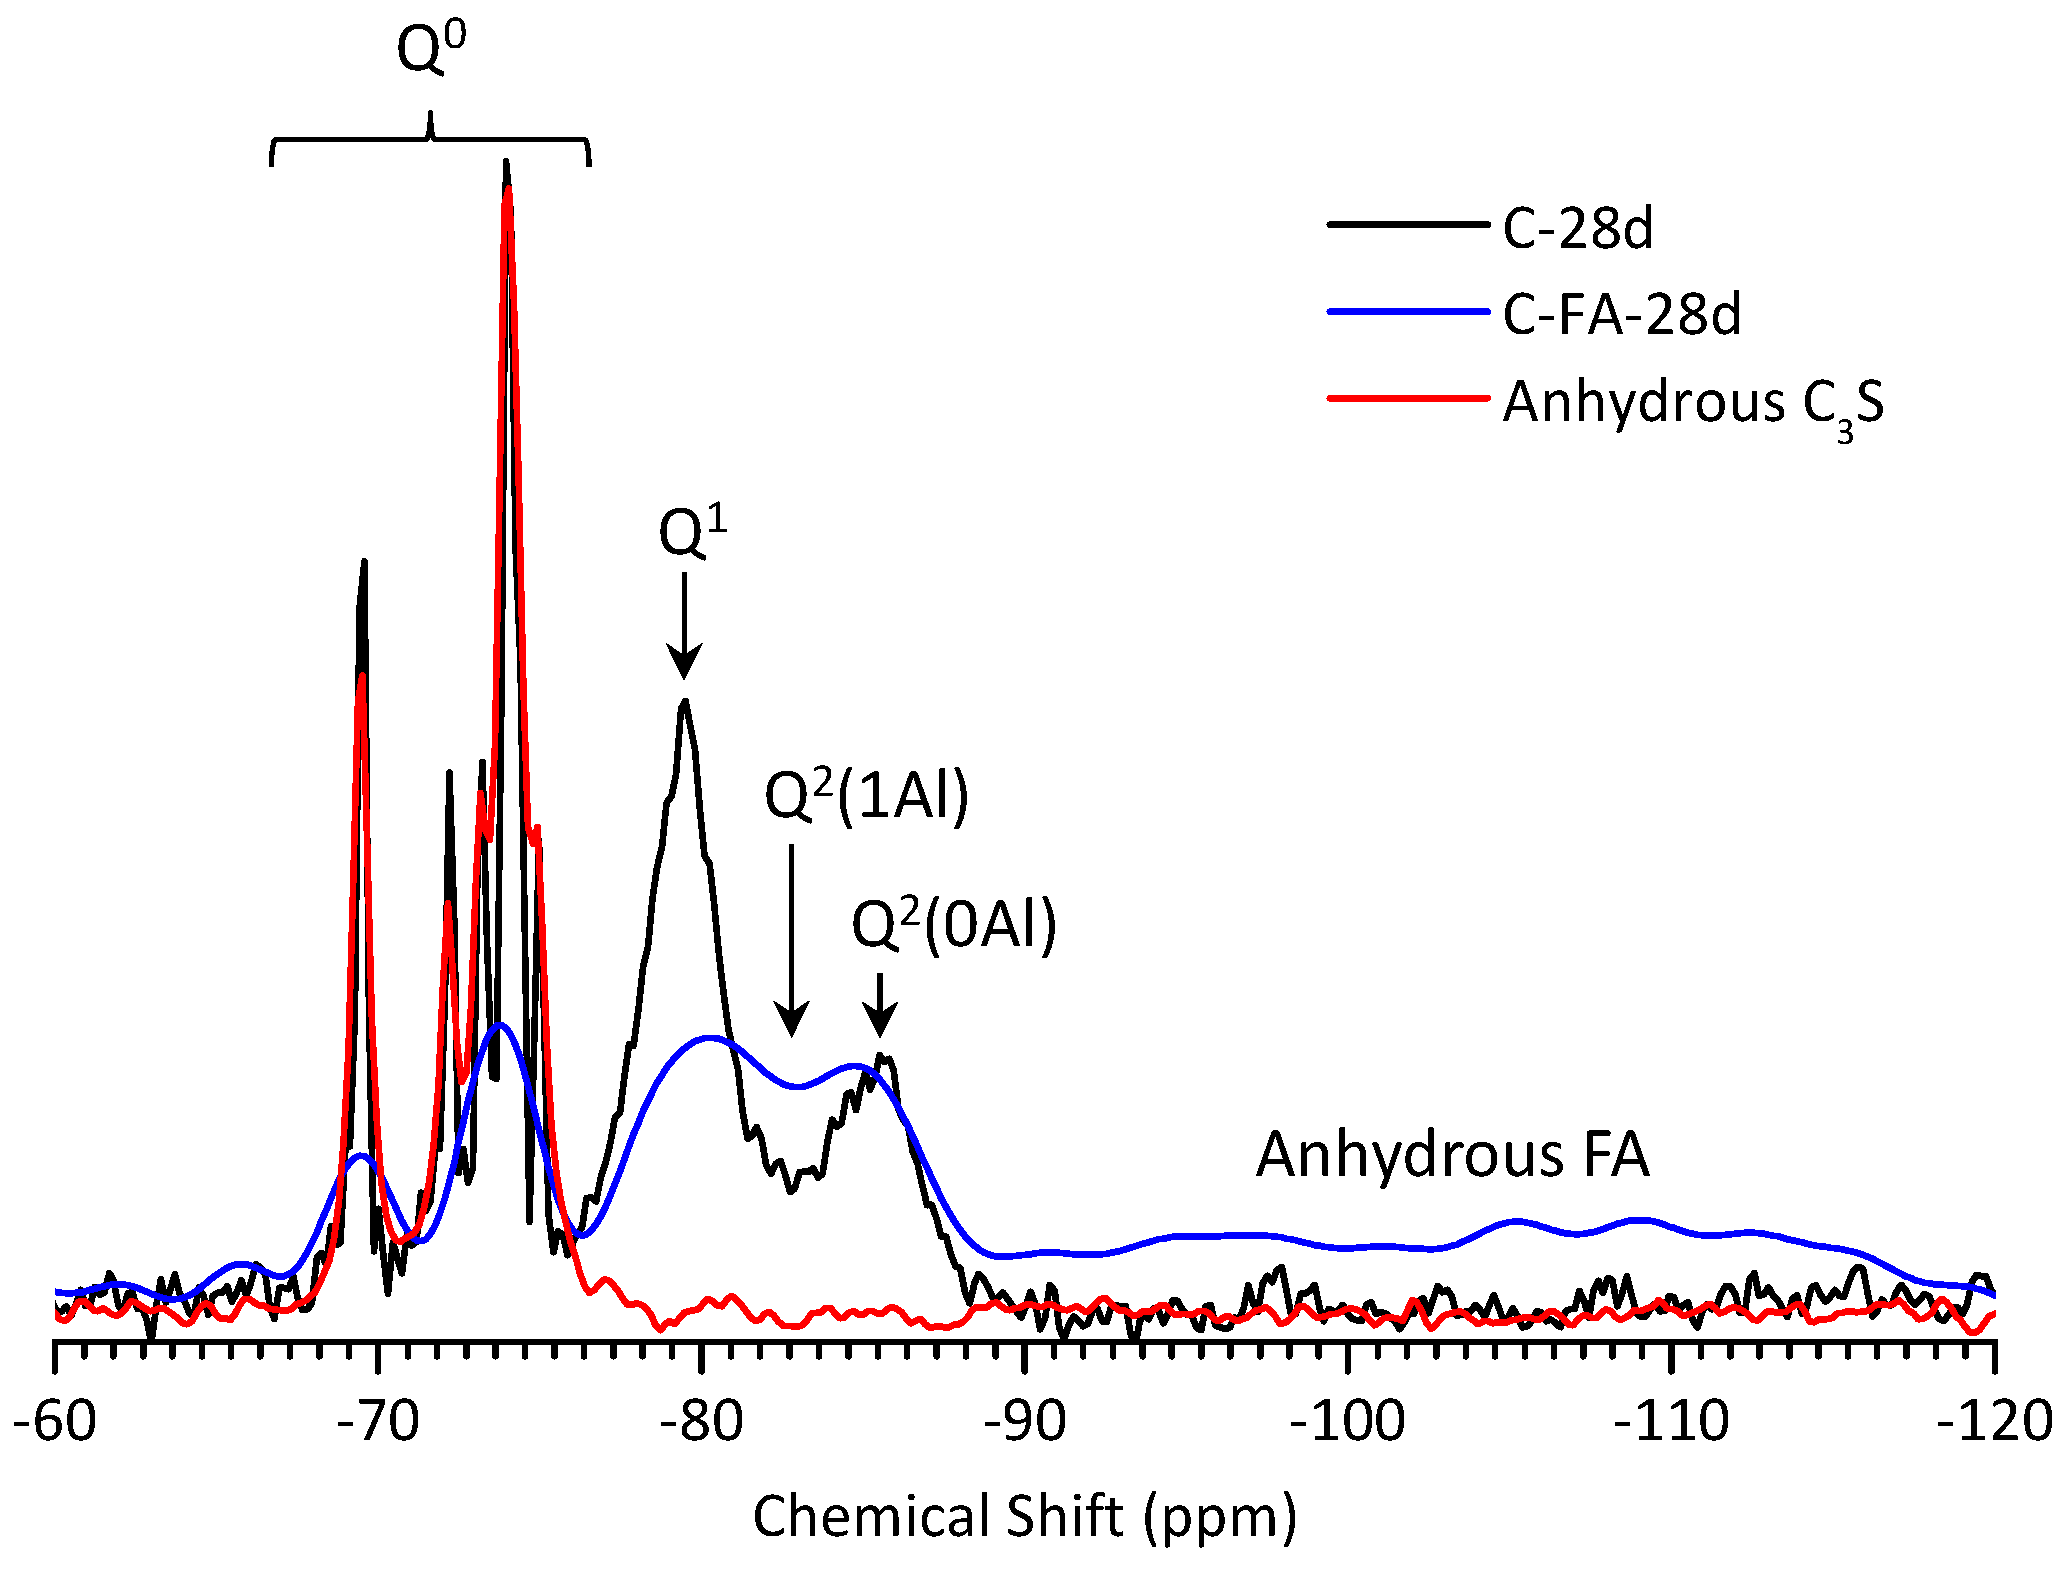
| Sample | Peak | Shift | Intensity (%) | MCL | %B | Al/Si |
|---|---|---|---|---|---|---|
| C-28d | Q1 | −79.51 | 78.9 | 2.53 | - | - |
| Q2(1Al) | - | - | ||||
| Q2 | −85.51 | 21.1 | ||||
| C-FA-28d | Q1 | −79.30 | 12.95 | 10.26 | 76.3 | 0.257 |
| Q2(1Al) | −81.77 | 27.20 | ||||
| Q2 | −85.35 | 12.69 | ||||
| Q3 | −94.93 | 15.88 | ||||
| Q4 | −109.45 | 31.29 |
© 2017 by the authors. Licensee MDPI, Basel, Switzerland. This article is an open access article distributed under the terms and conditions of the Creative Commons Attribution (CC BY) license ( http://creativecommons.org/licenses/by/4.0/).
Share and Cite
Bae, S.; Taylor, R.; Kilcoyne, D.; Moon, J.; Monteiro, P.J.M. Effects of Incorporating High-Volume Fly Ash into Tricalcium Silicate on the Degree of Silicate Polymerization and Aluminum Substitution for Silicon in Calcium Silicate Hydrate. Materials 2017, 10, 131. https://doi.org/10.3390/ma10020131
Bae S, Taylor R, Kilcoyne D, Moon J, Monteiro PJM. Effects of Incorporating High-Volume Fly Ash into Tricalcium Silicate on the Degree of Silicate Polymerization and Aluminum Substitution for Silicon in Calcium Silicate Hydrate. Materials. 2017; 10(2):131. https://doi.org/10.3390/ma10020131
Chicago/Turabian StyleBae, Sungchul, Rae Taylor, David Kilcoyne, Juhyuk Moon, and Paulo J. M. Monteiro. 2017. "Effects of Incorporating High-Volume Fly Ash into Tricalcium Silicate on the Degree of Silicate Polymerization and Aluminum Substitution for Silicon in Calcium Silicate Hydrate" Materials 10, no. 2: 131. https://doi.org/10.3390/ma10020131