
Surface Roughening Behavior of 6063 Aluminum Alloy during Bulging by Spun Tubes

Abstract
:
1. Introduction
2. Experimental Procedure
2.1. Materials
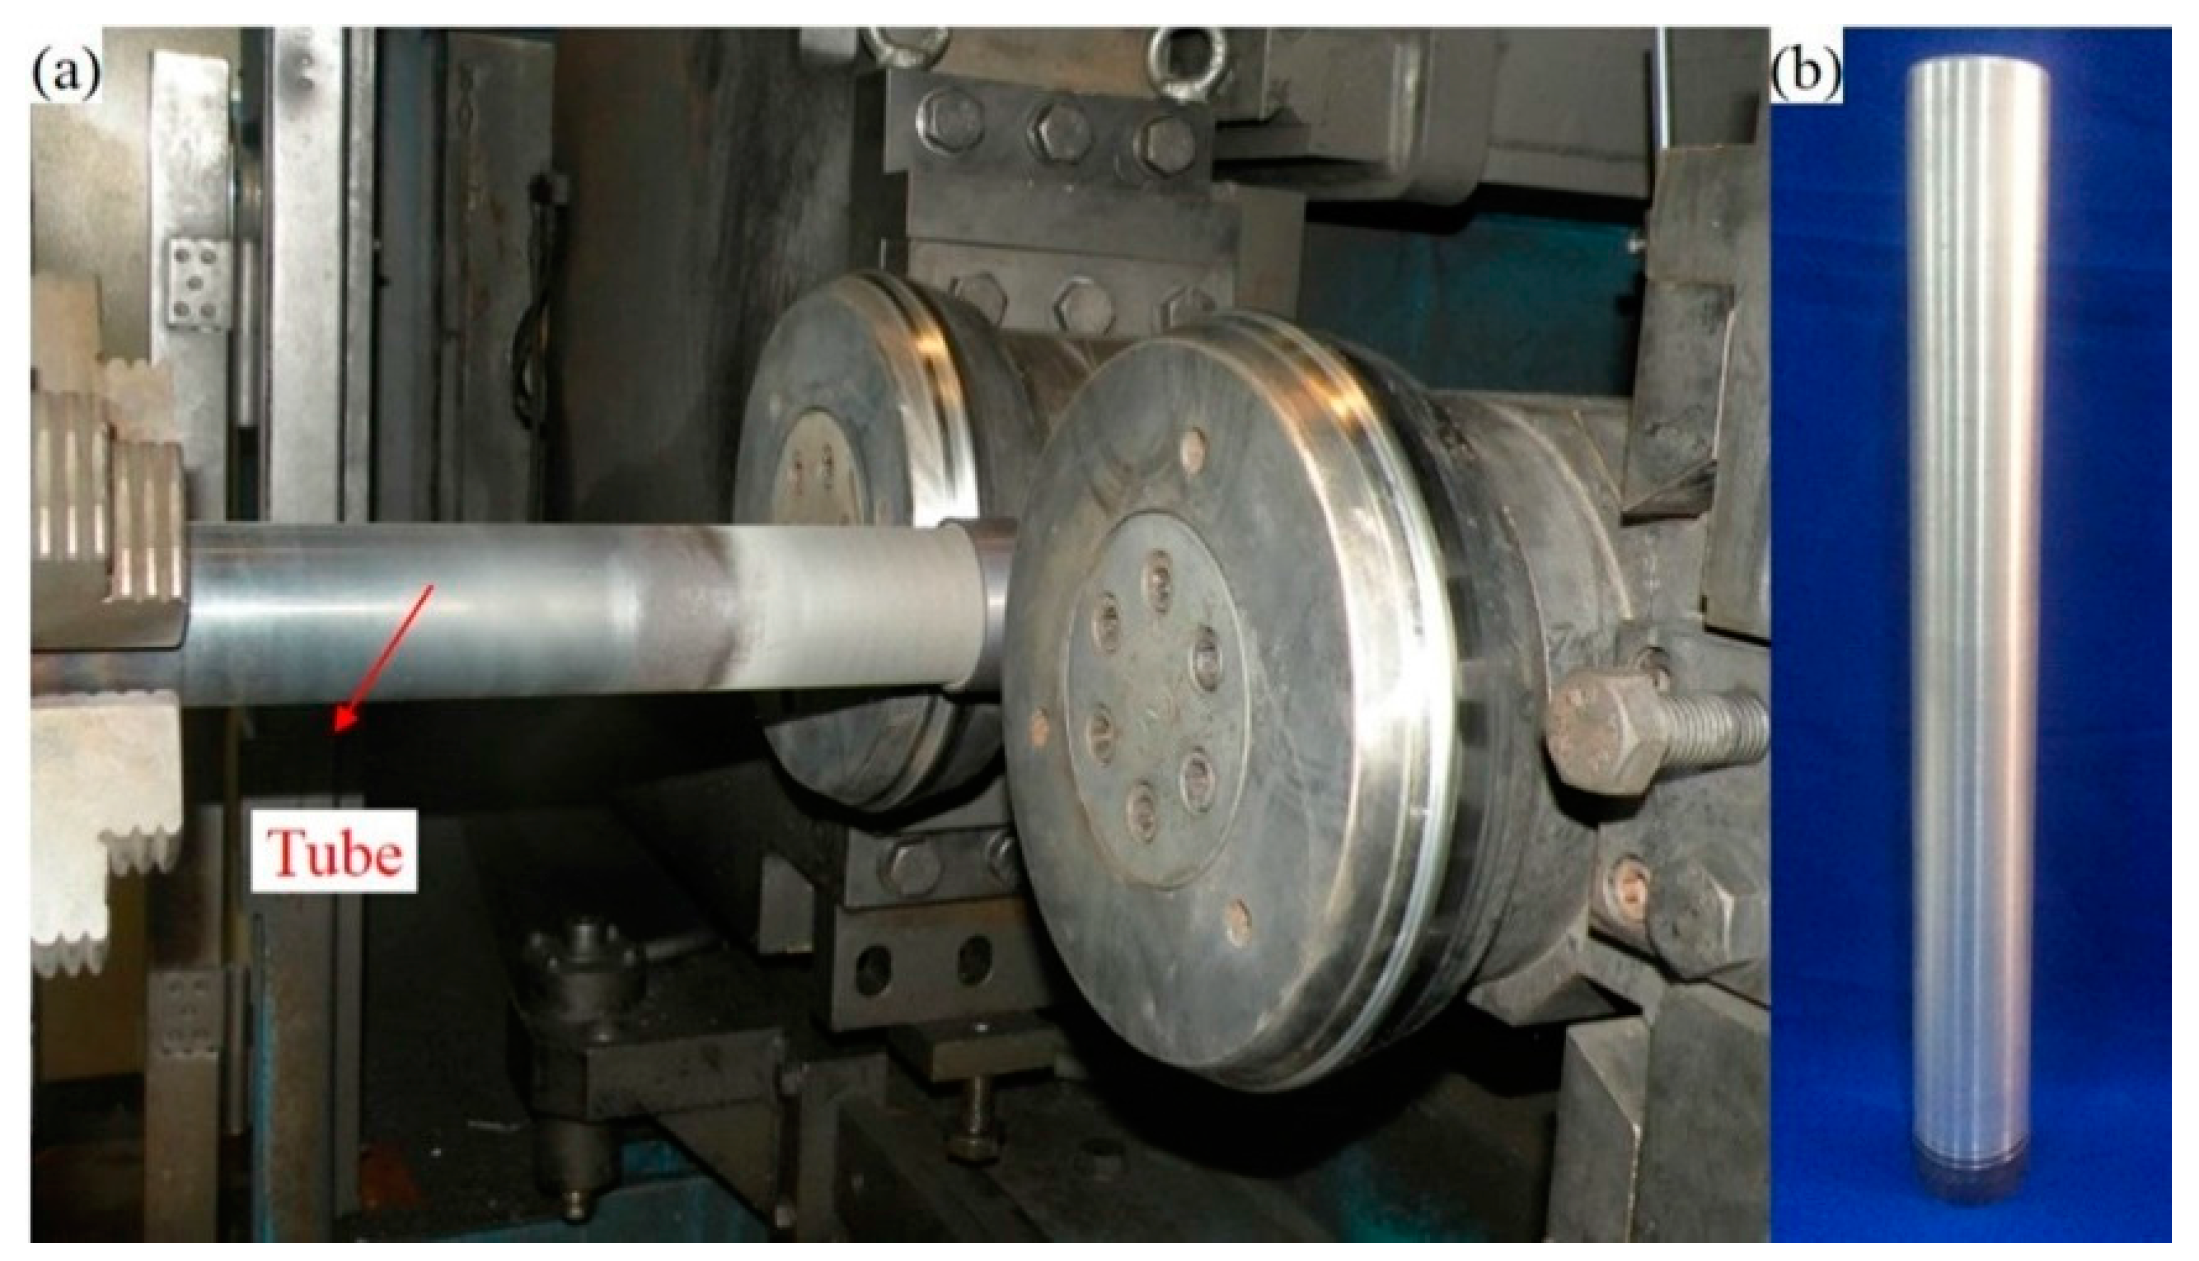
2.2. Bulging
2.3. Measurement Method
3. Results and Discussion
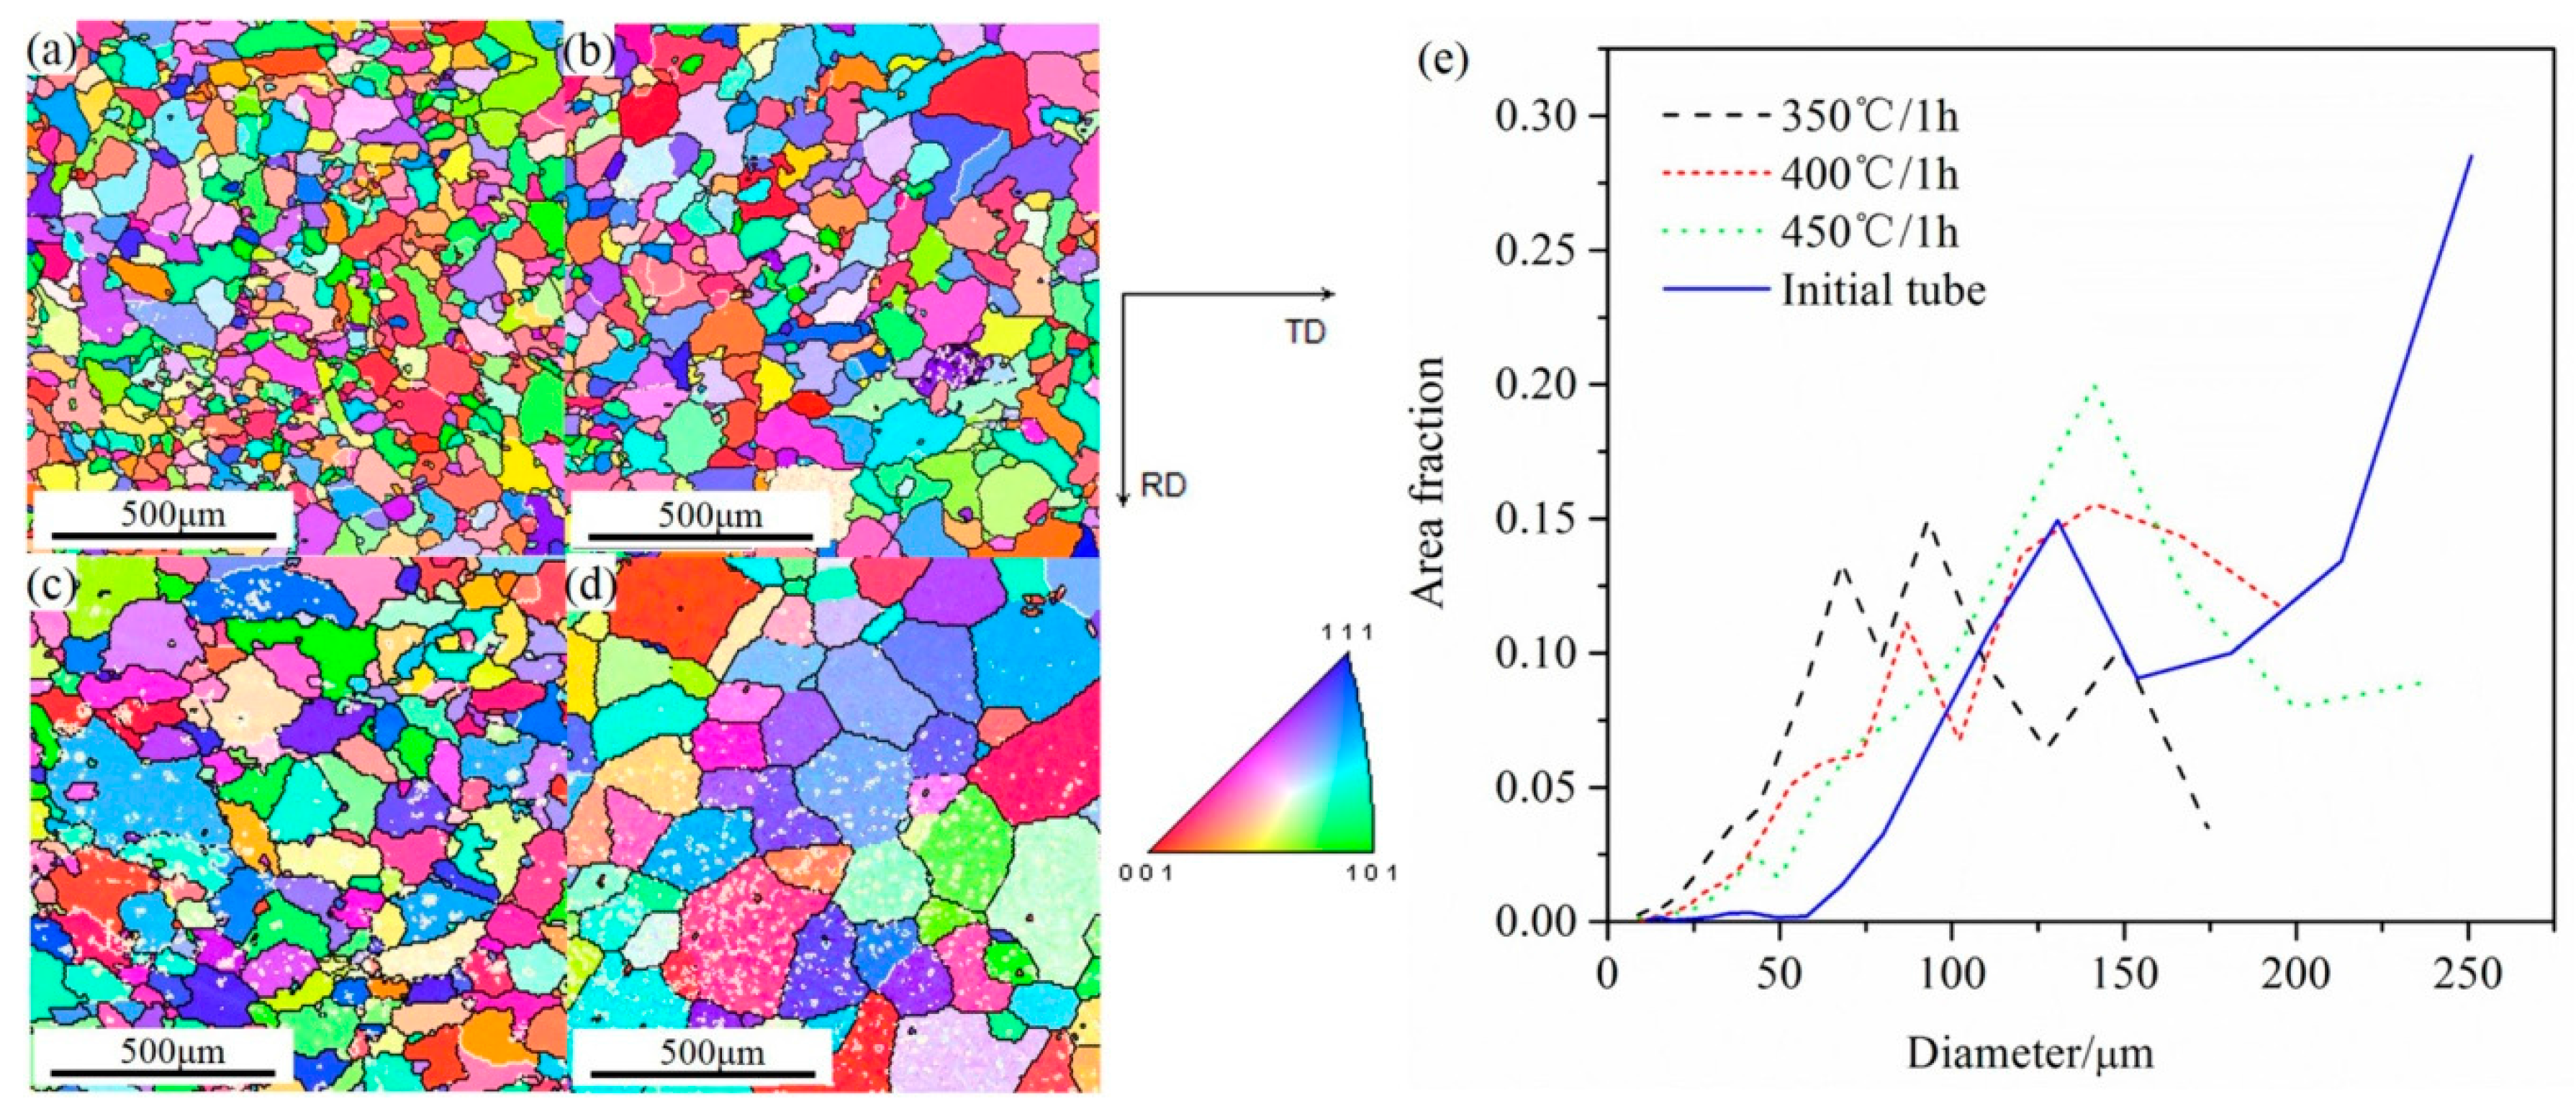
3.1. Tube Obtained by Spinning and Heat Treatment
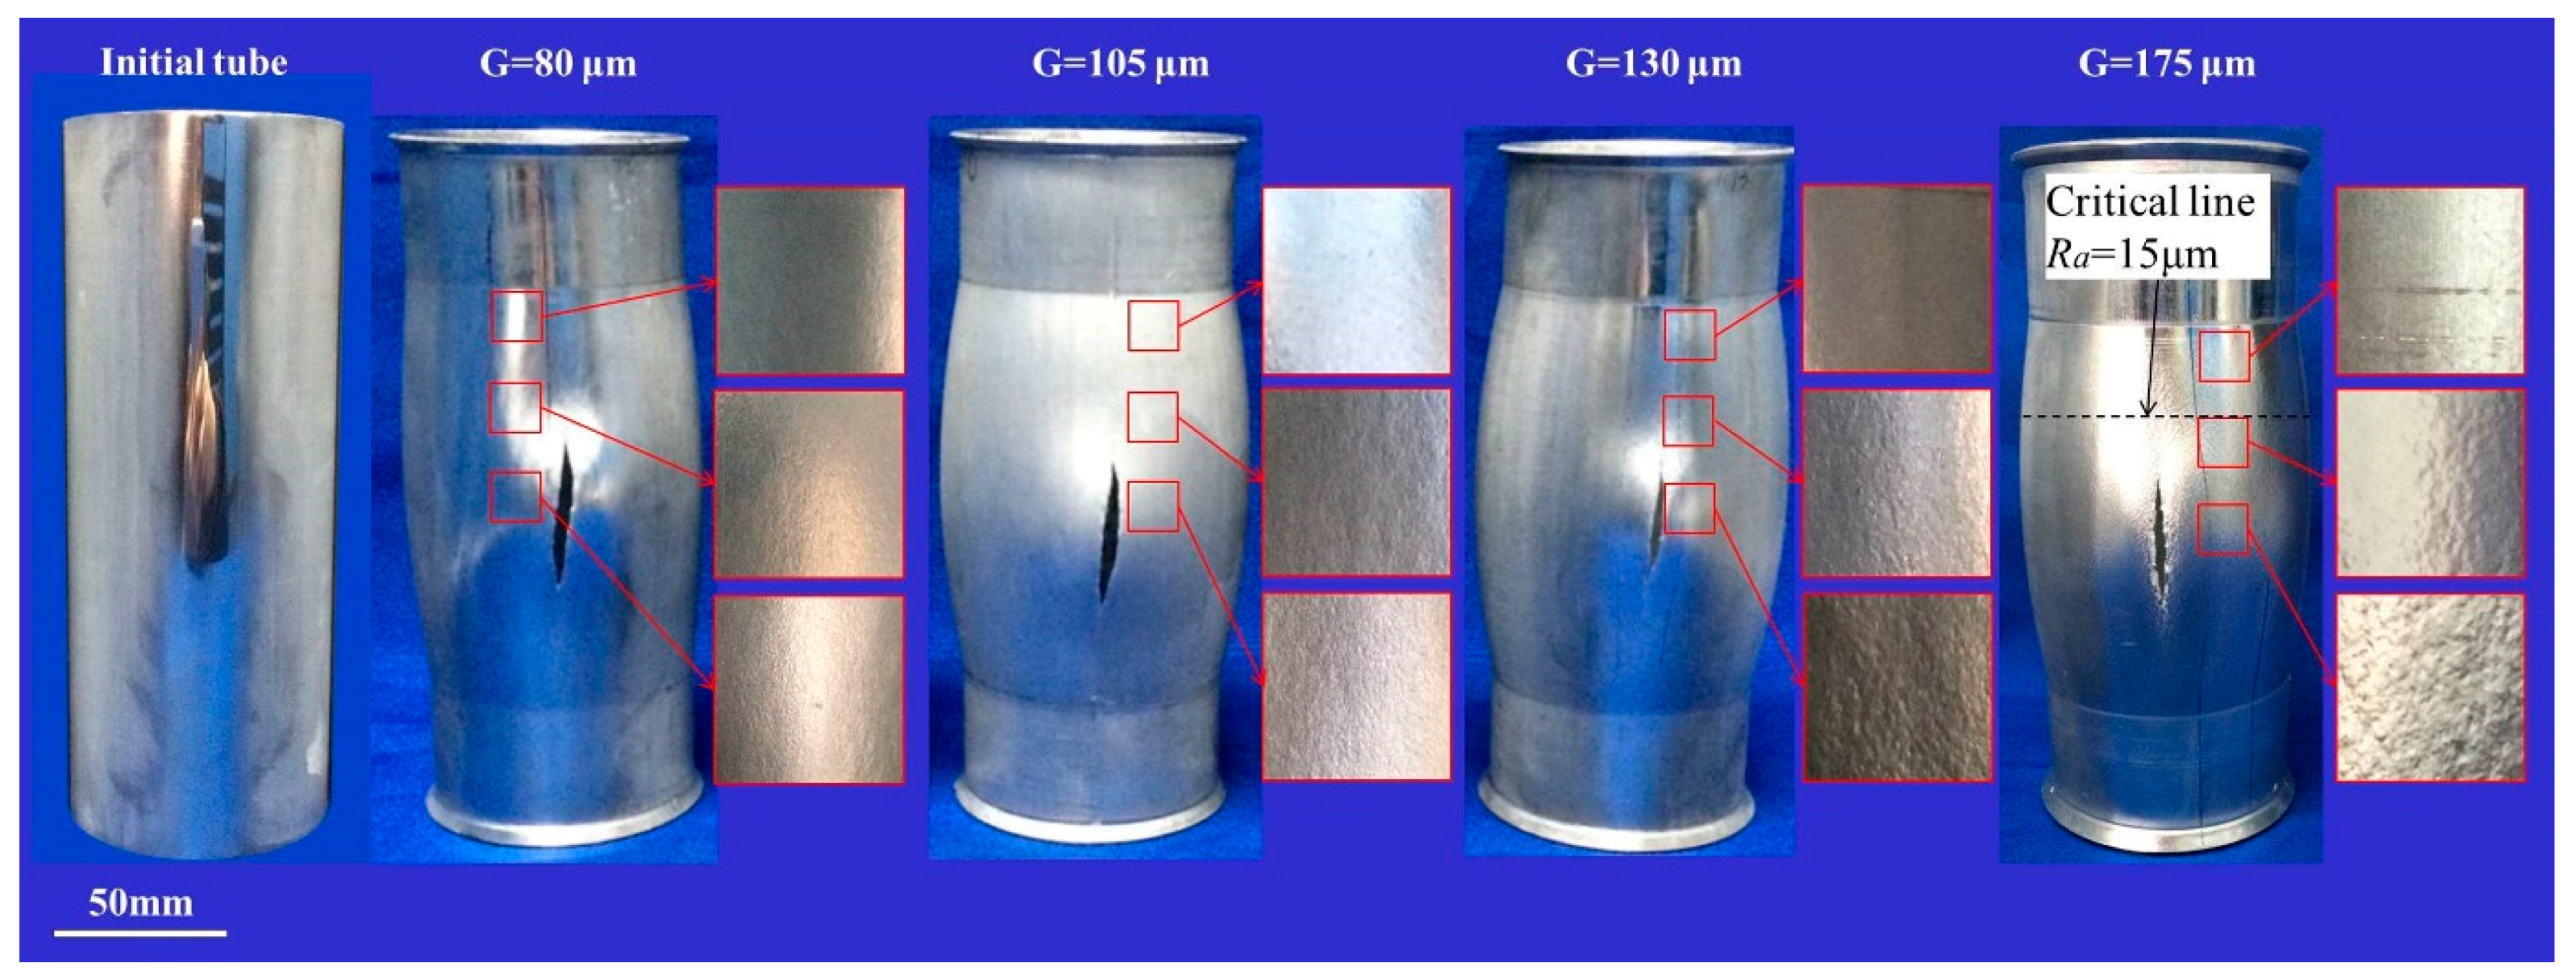
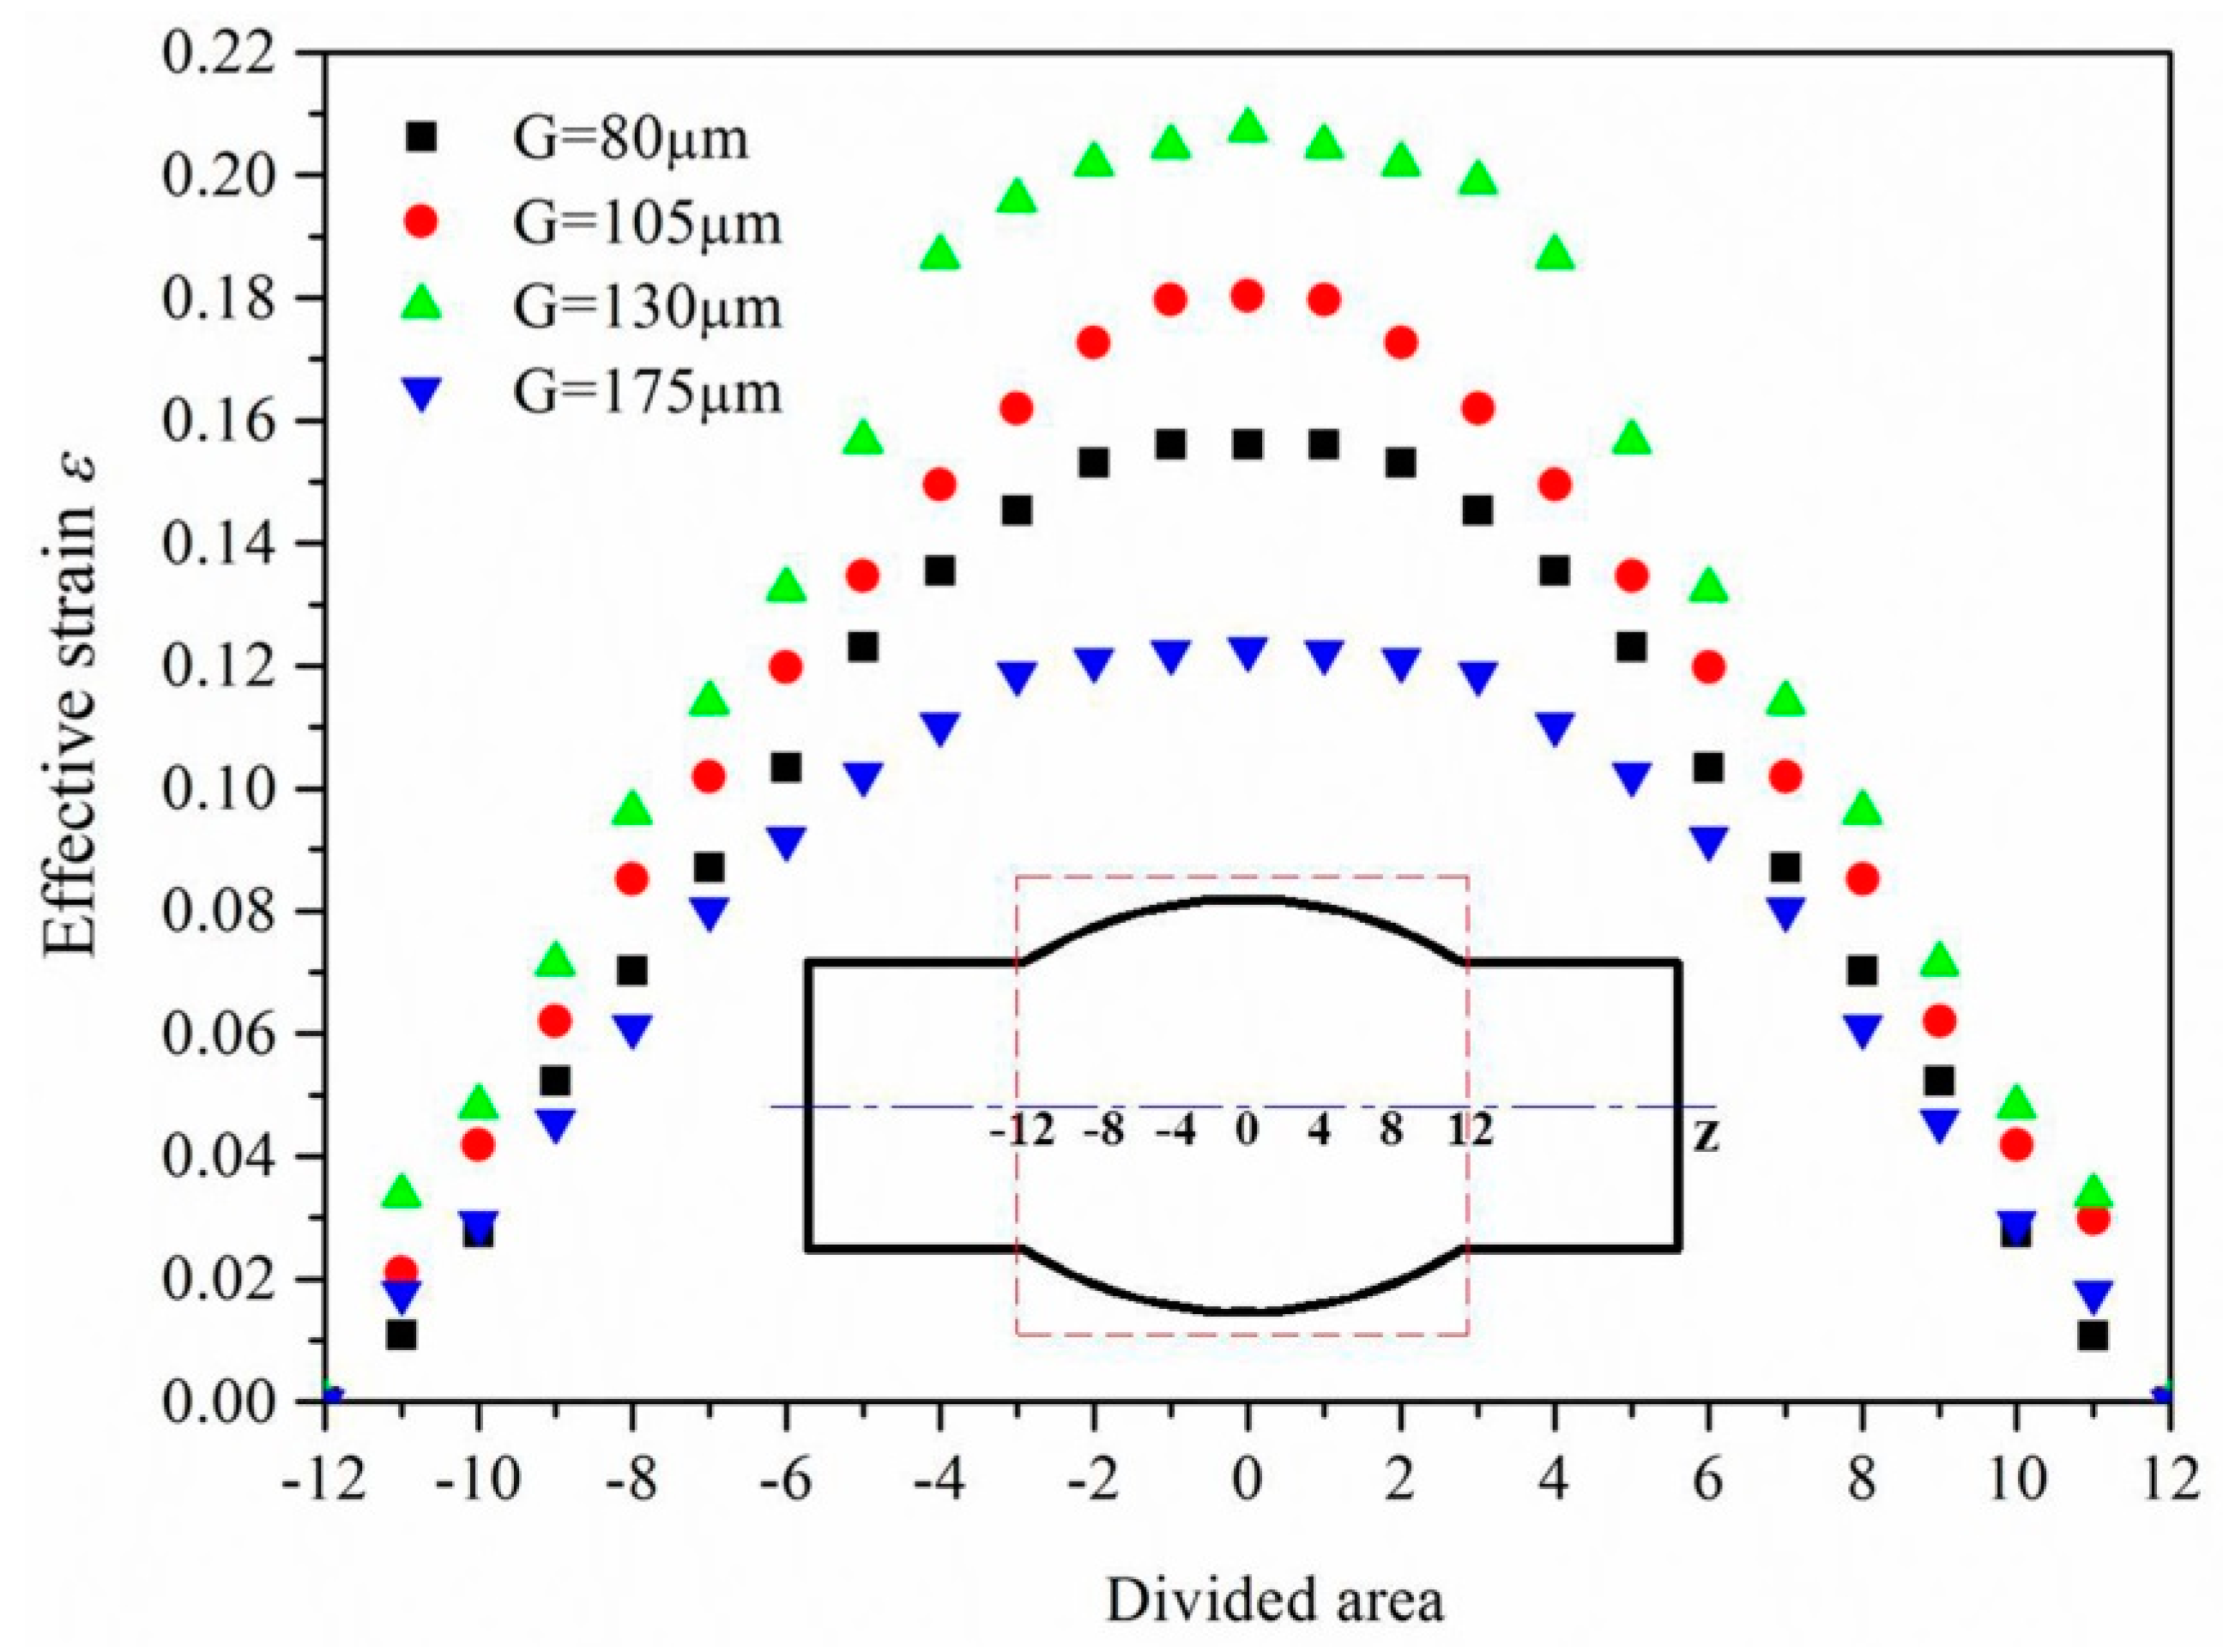
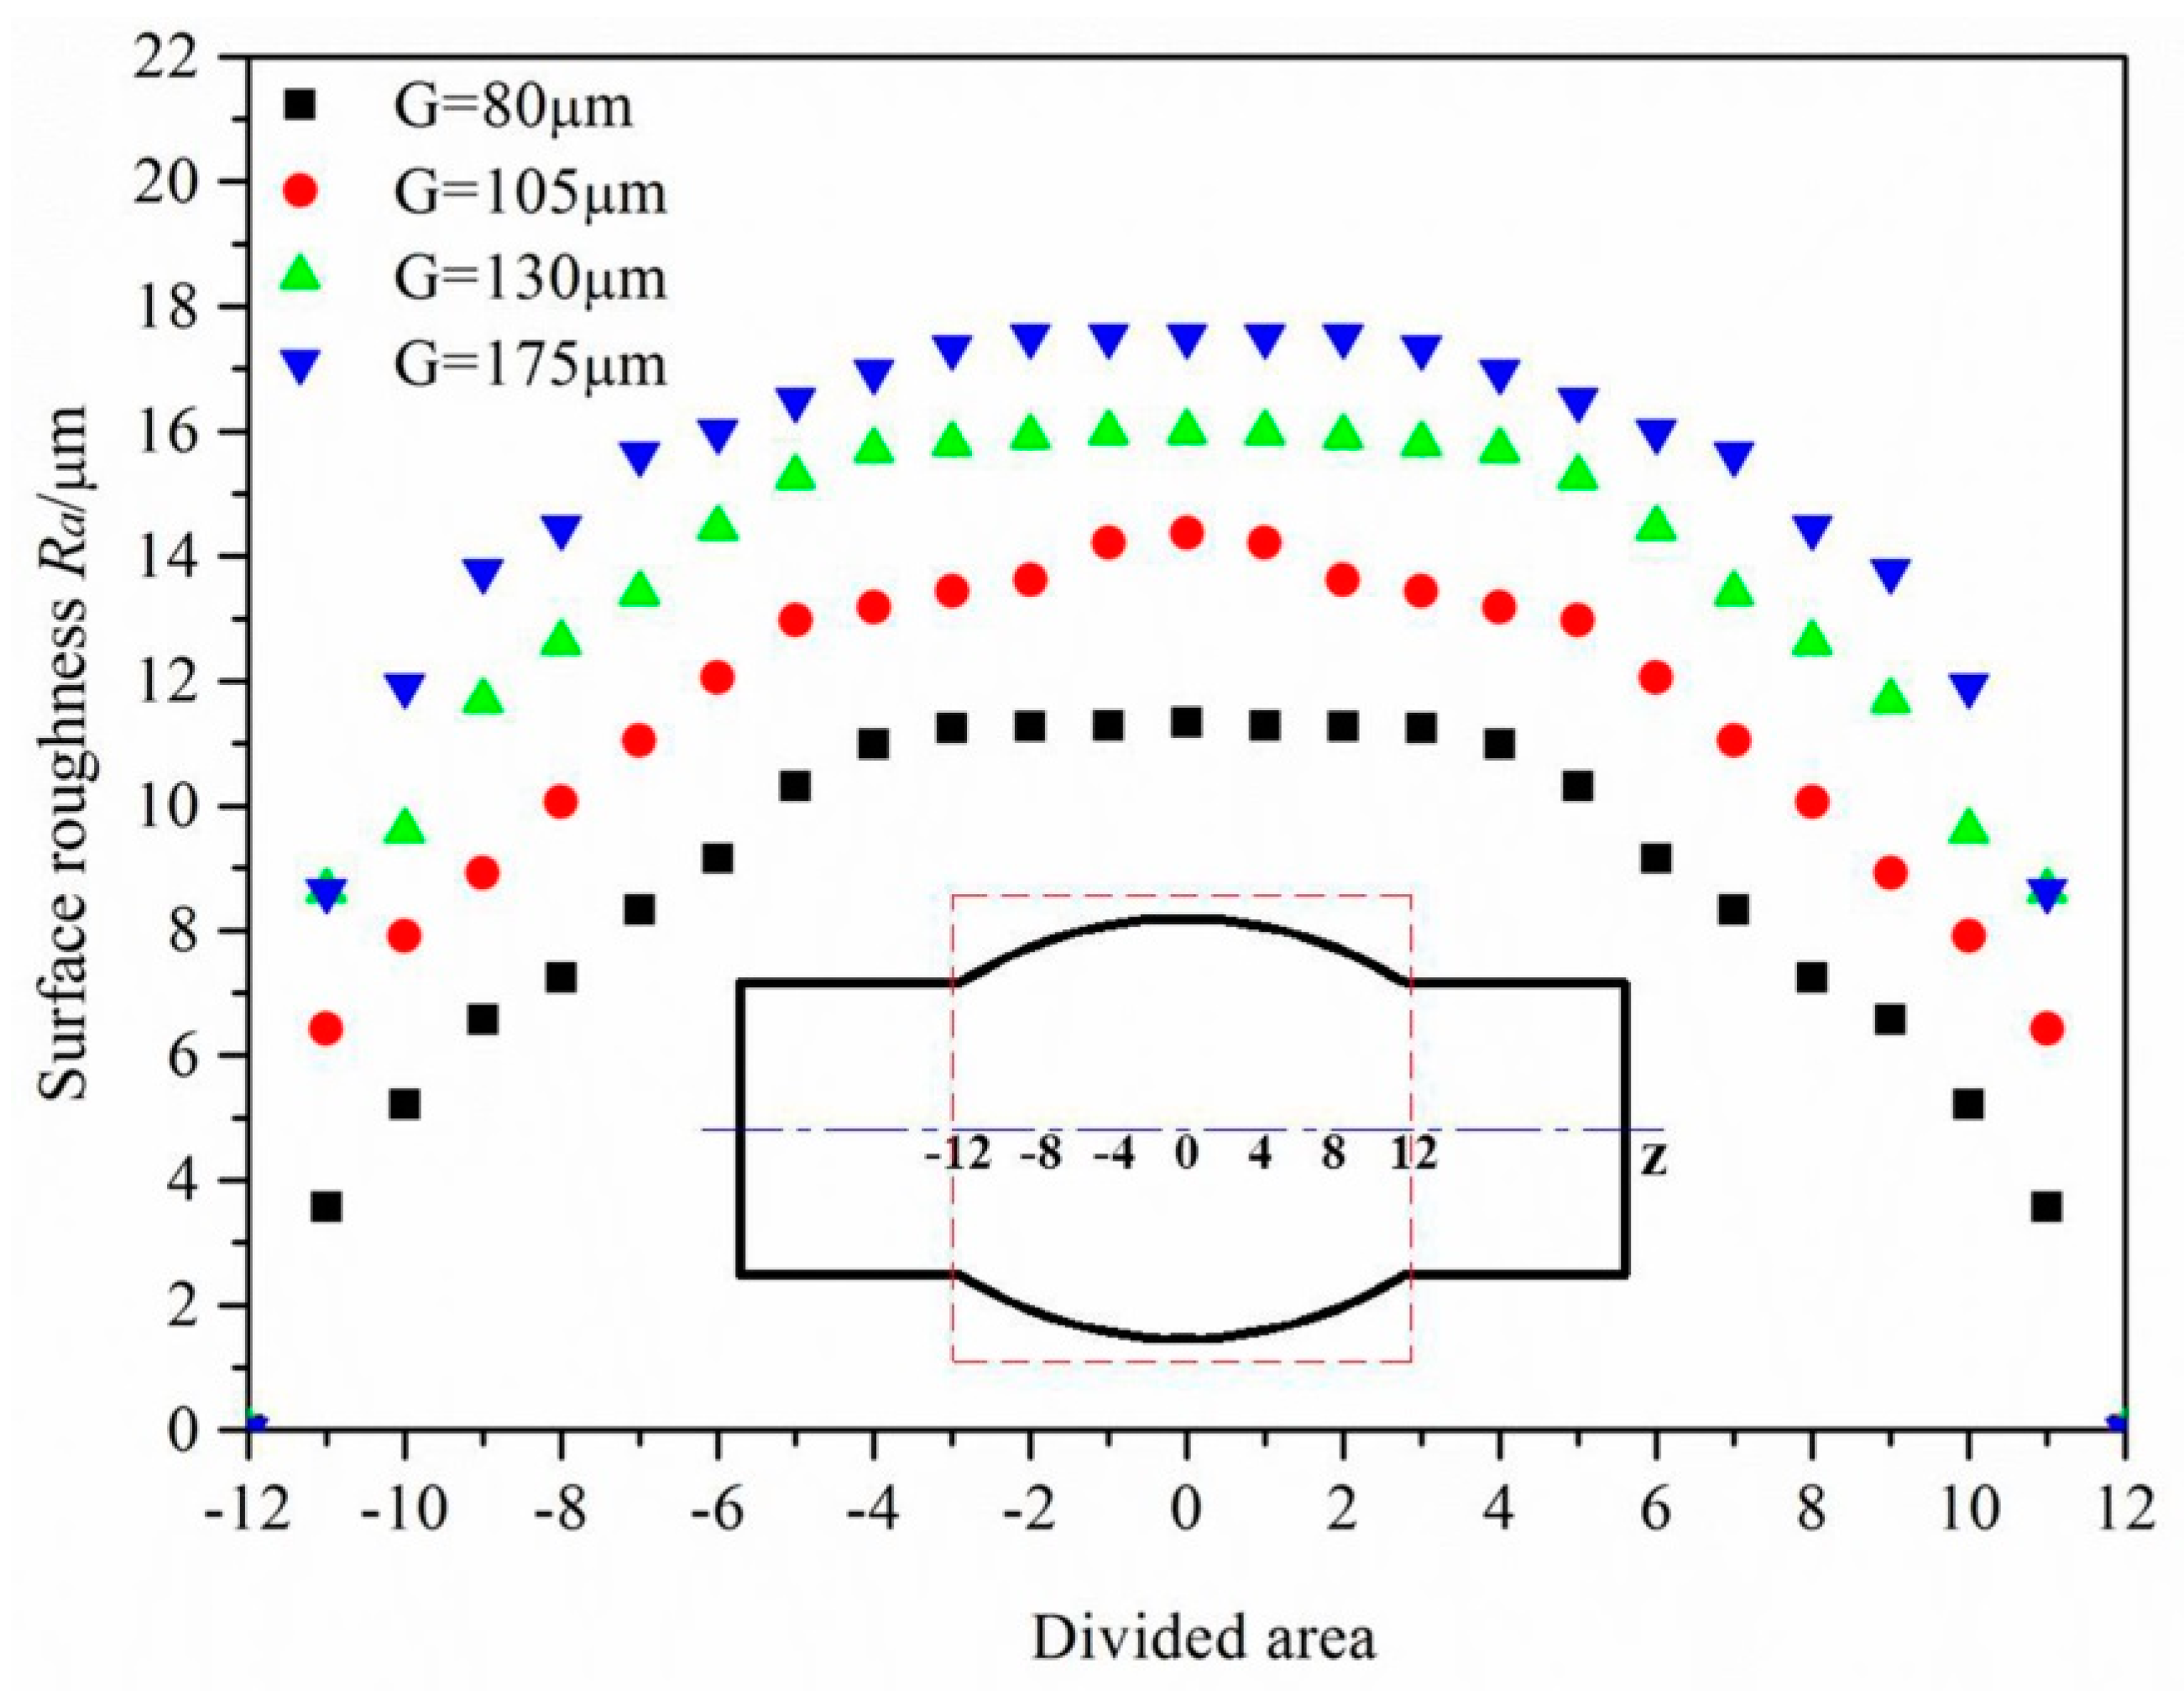
3.2. Roughening Macroscopical Behavior
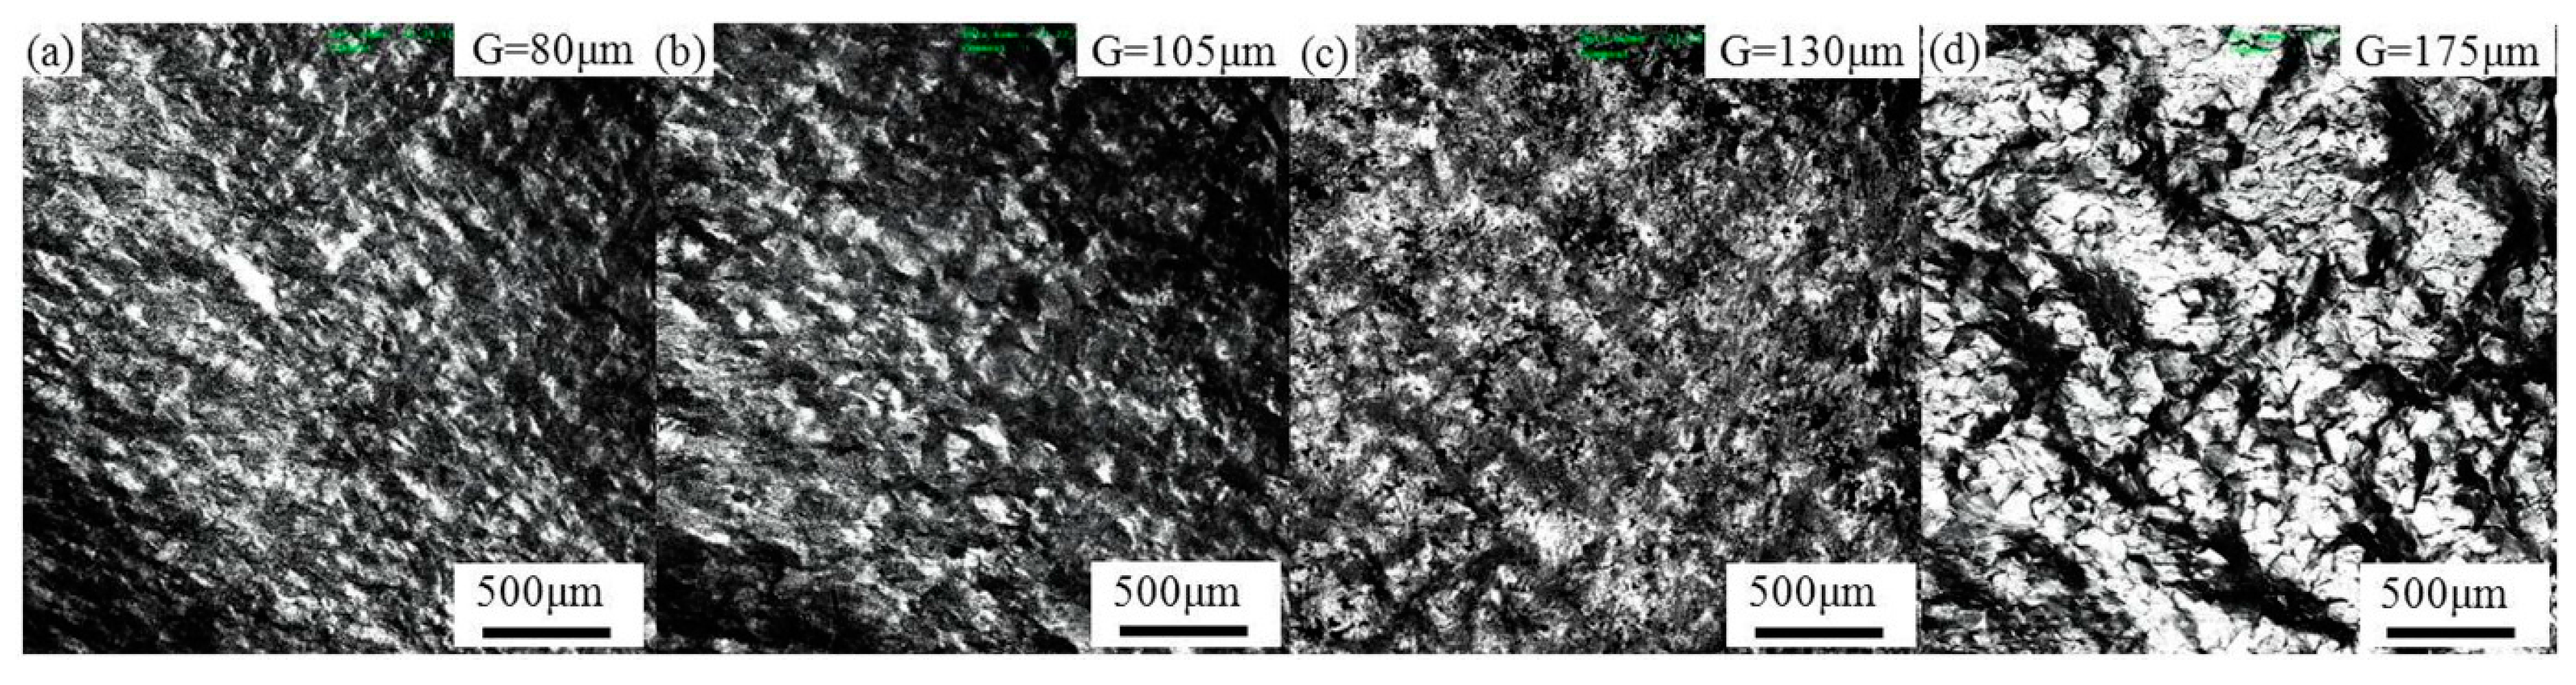
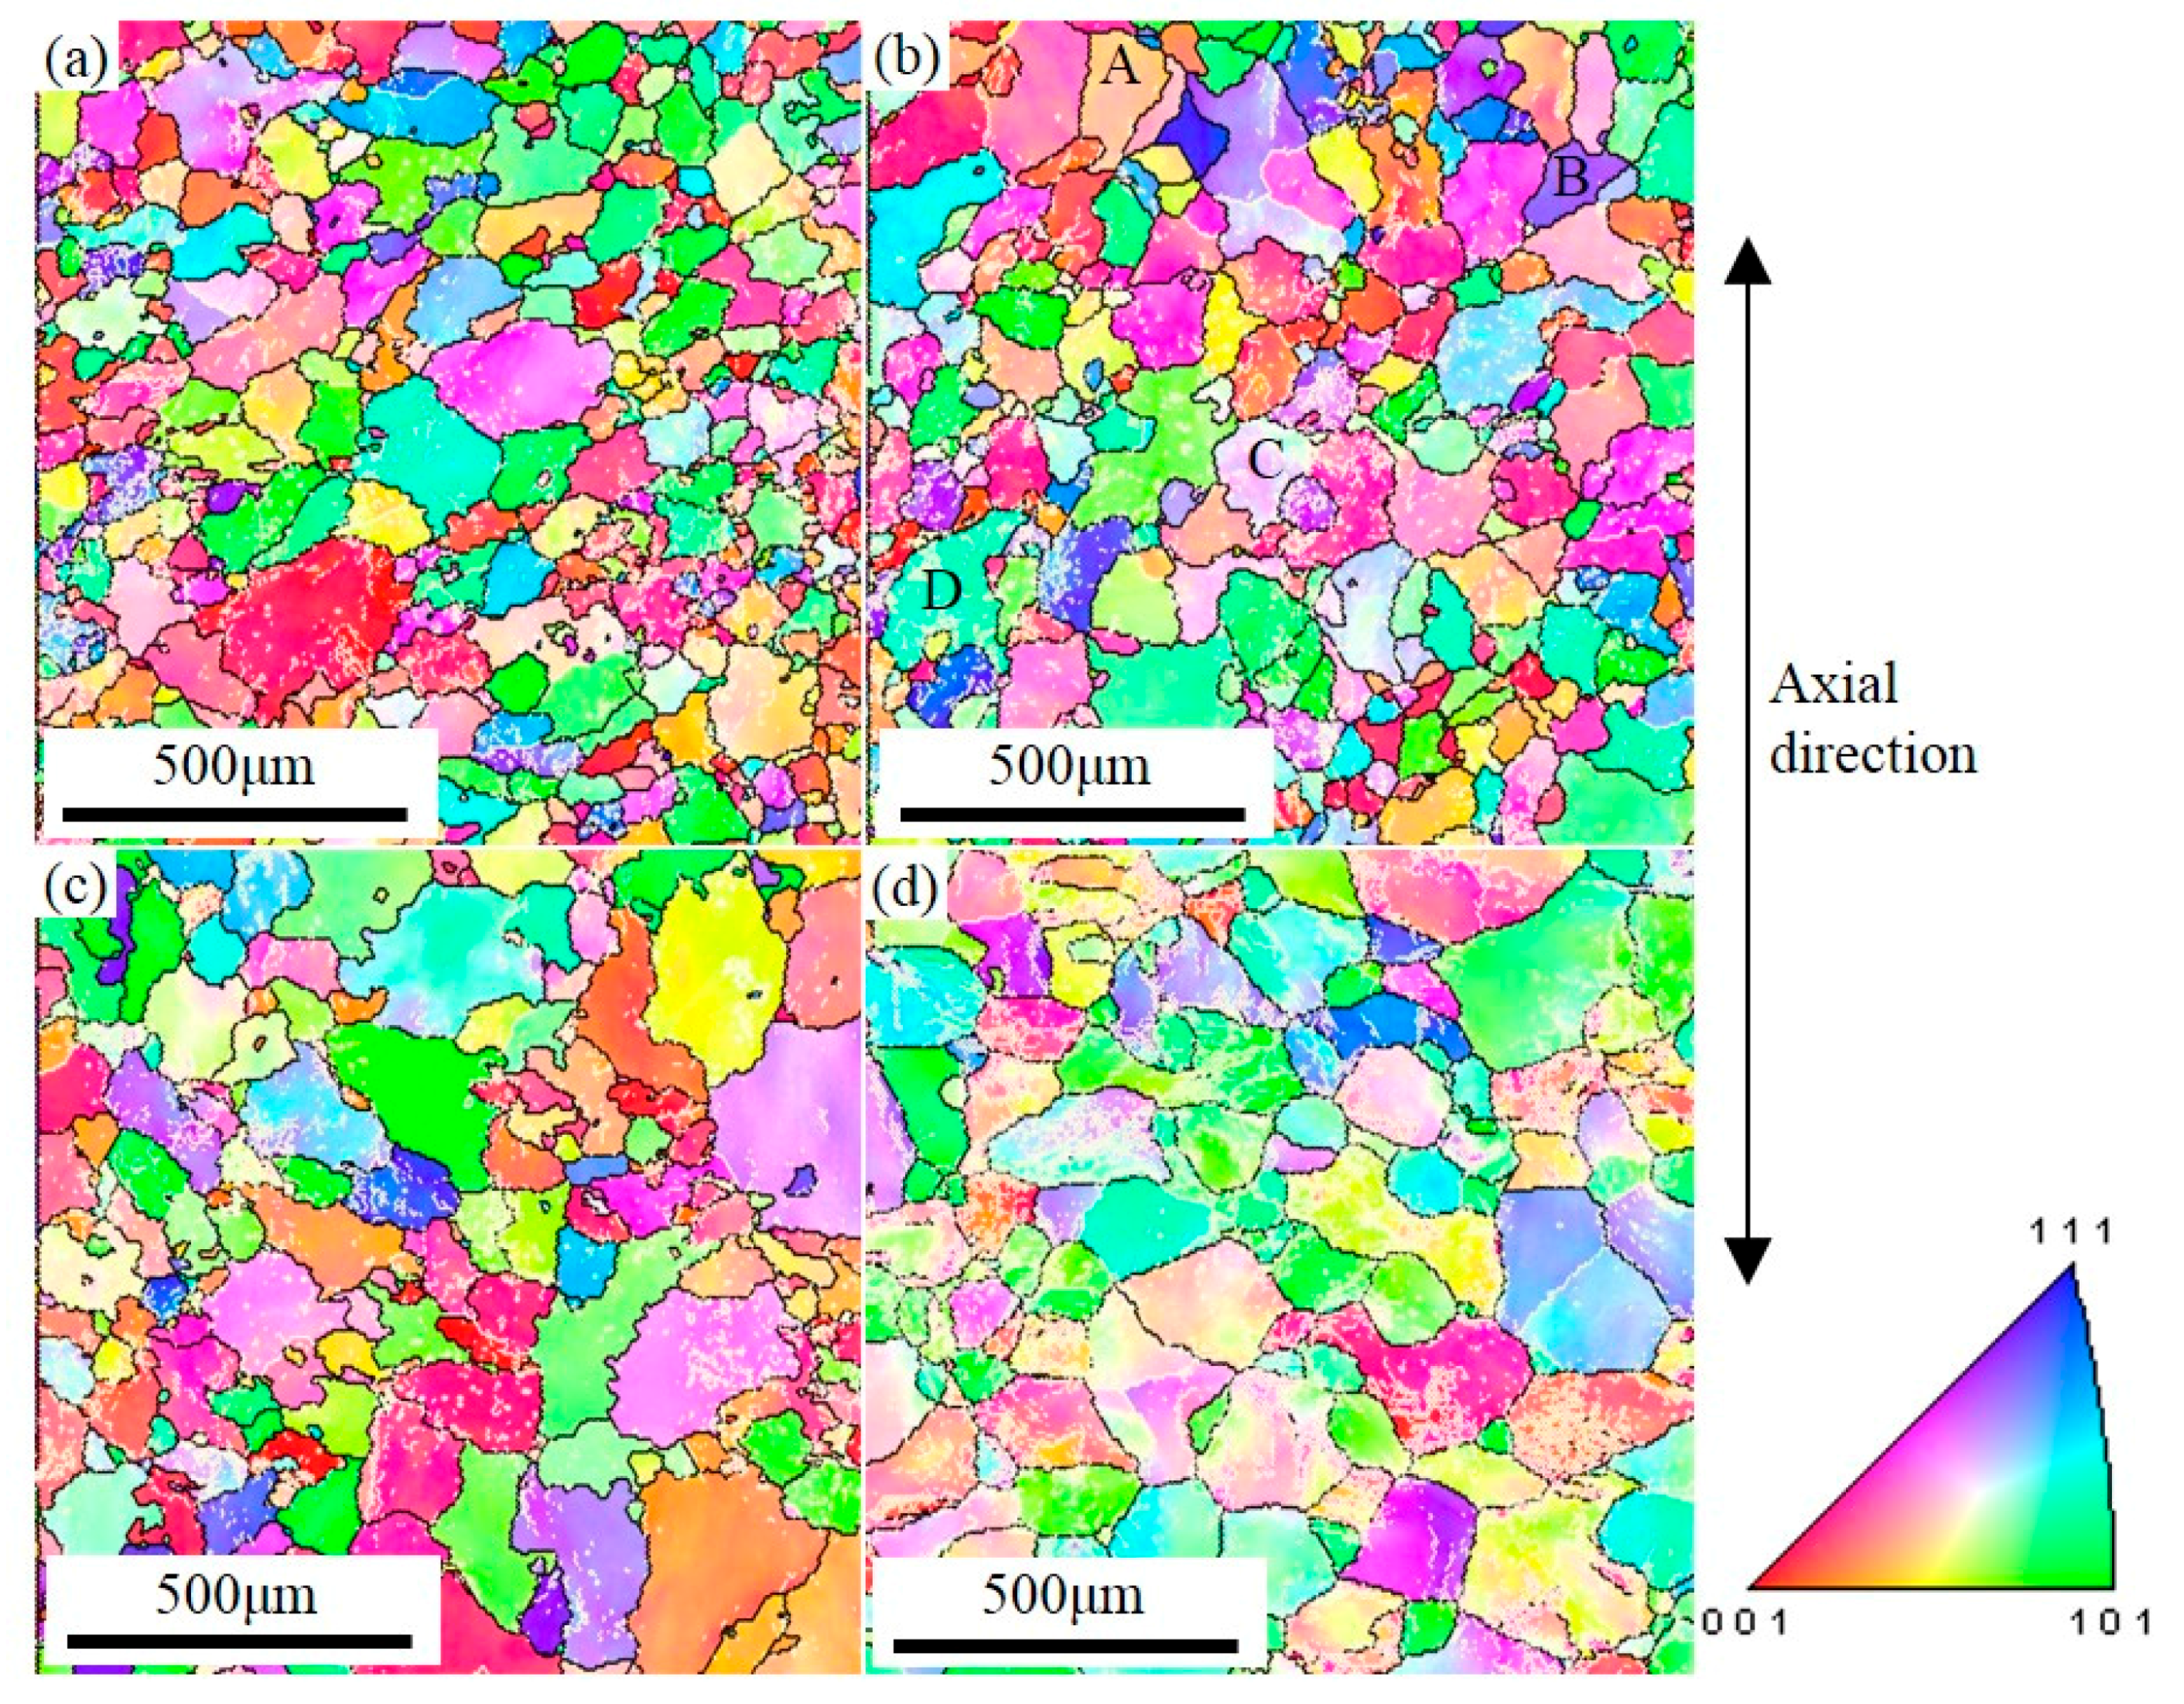
3.3. Roughening Microscopic Behavior
4. Conclusions
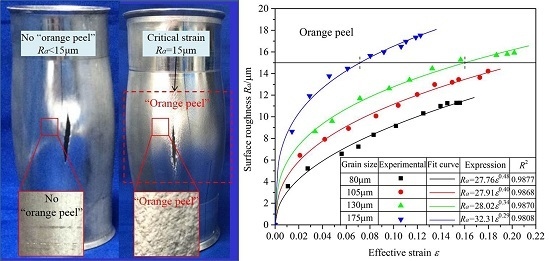
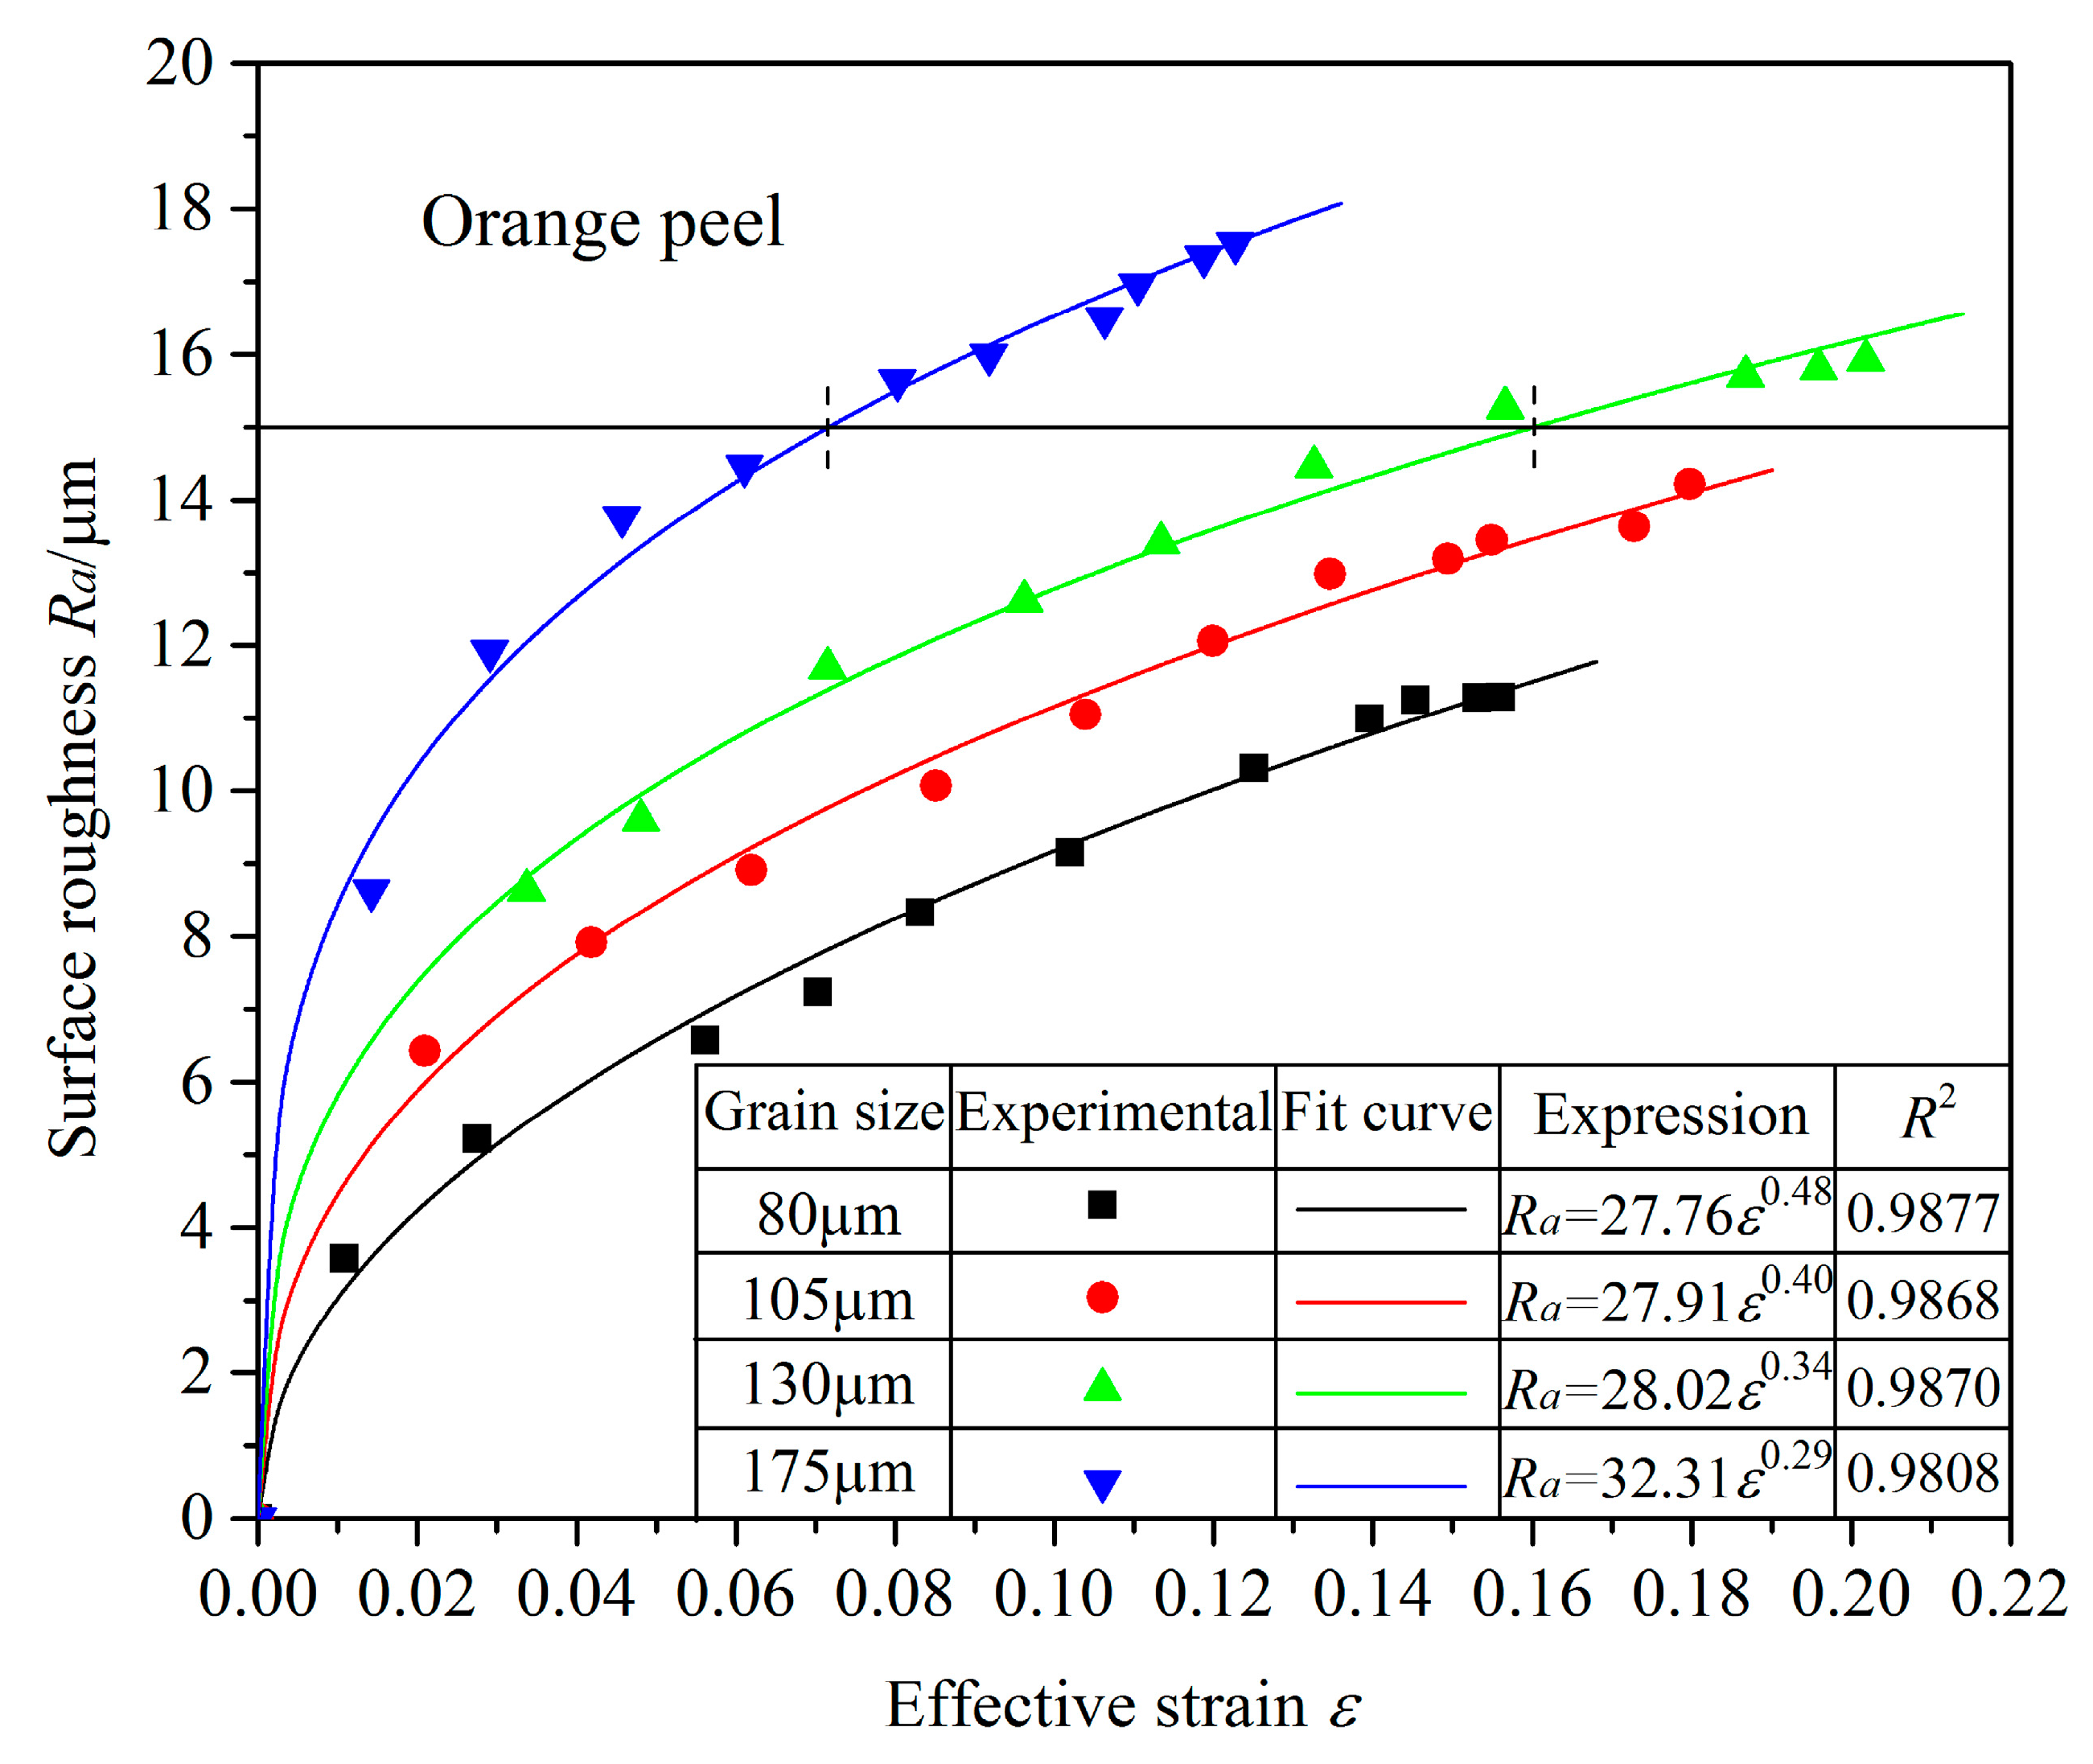
- Under biaxial stress conditions, the surface roughness increases with increasing grain size. When the grain size is less than 105 μm, there is no “orange peel” on the surface, nor is there any when the grain size is 130 μm provided the strain is less than 15.88%. Similarly, when the grain size is 175 μm, there is no “orange peel” on the surface when the strain is less than 7.15%.
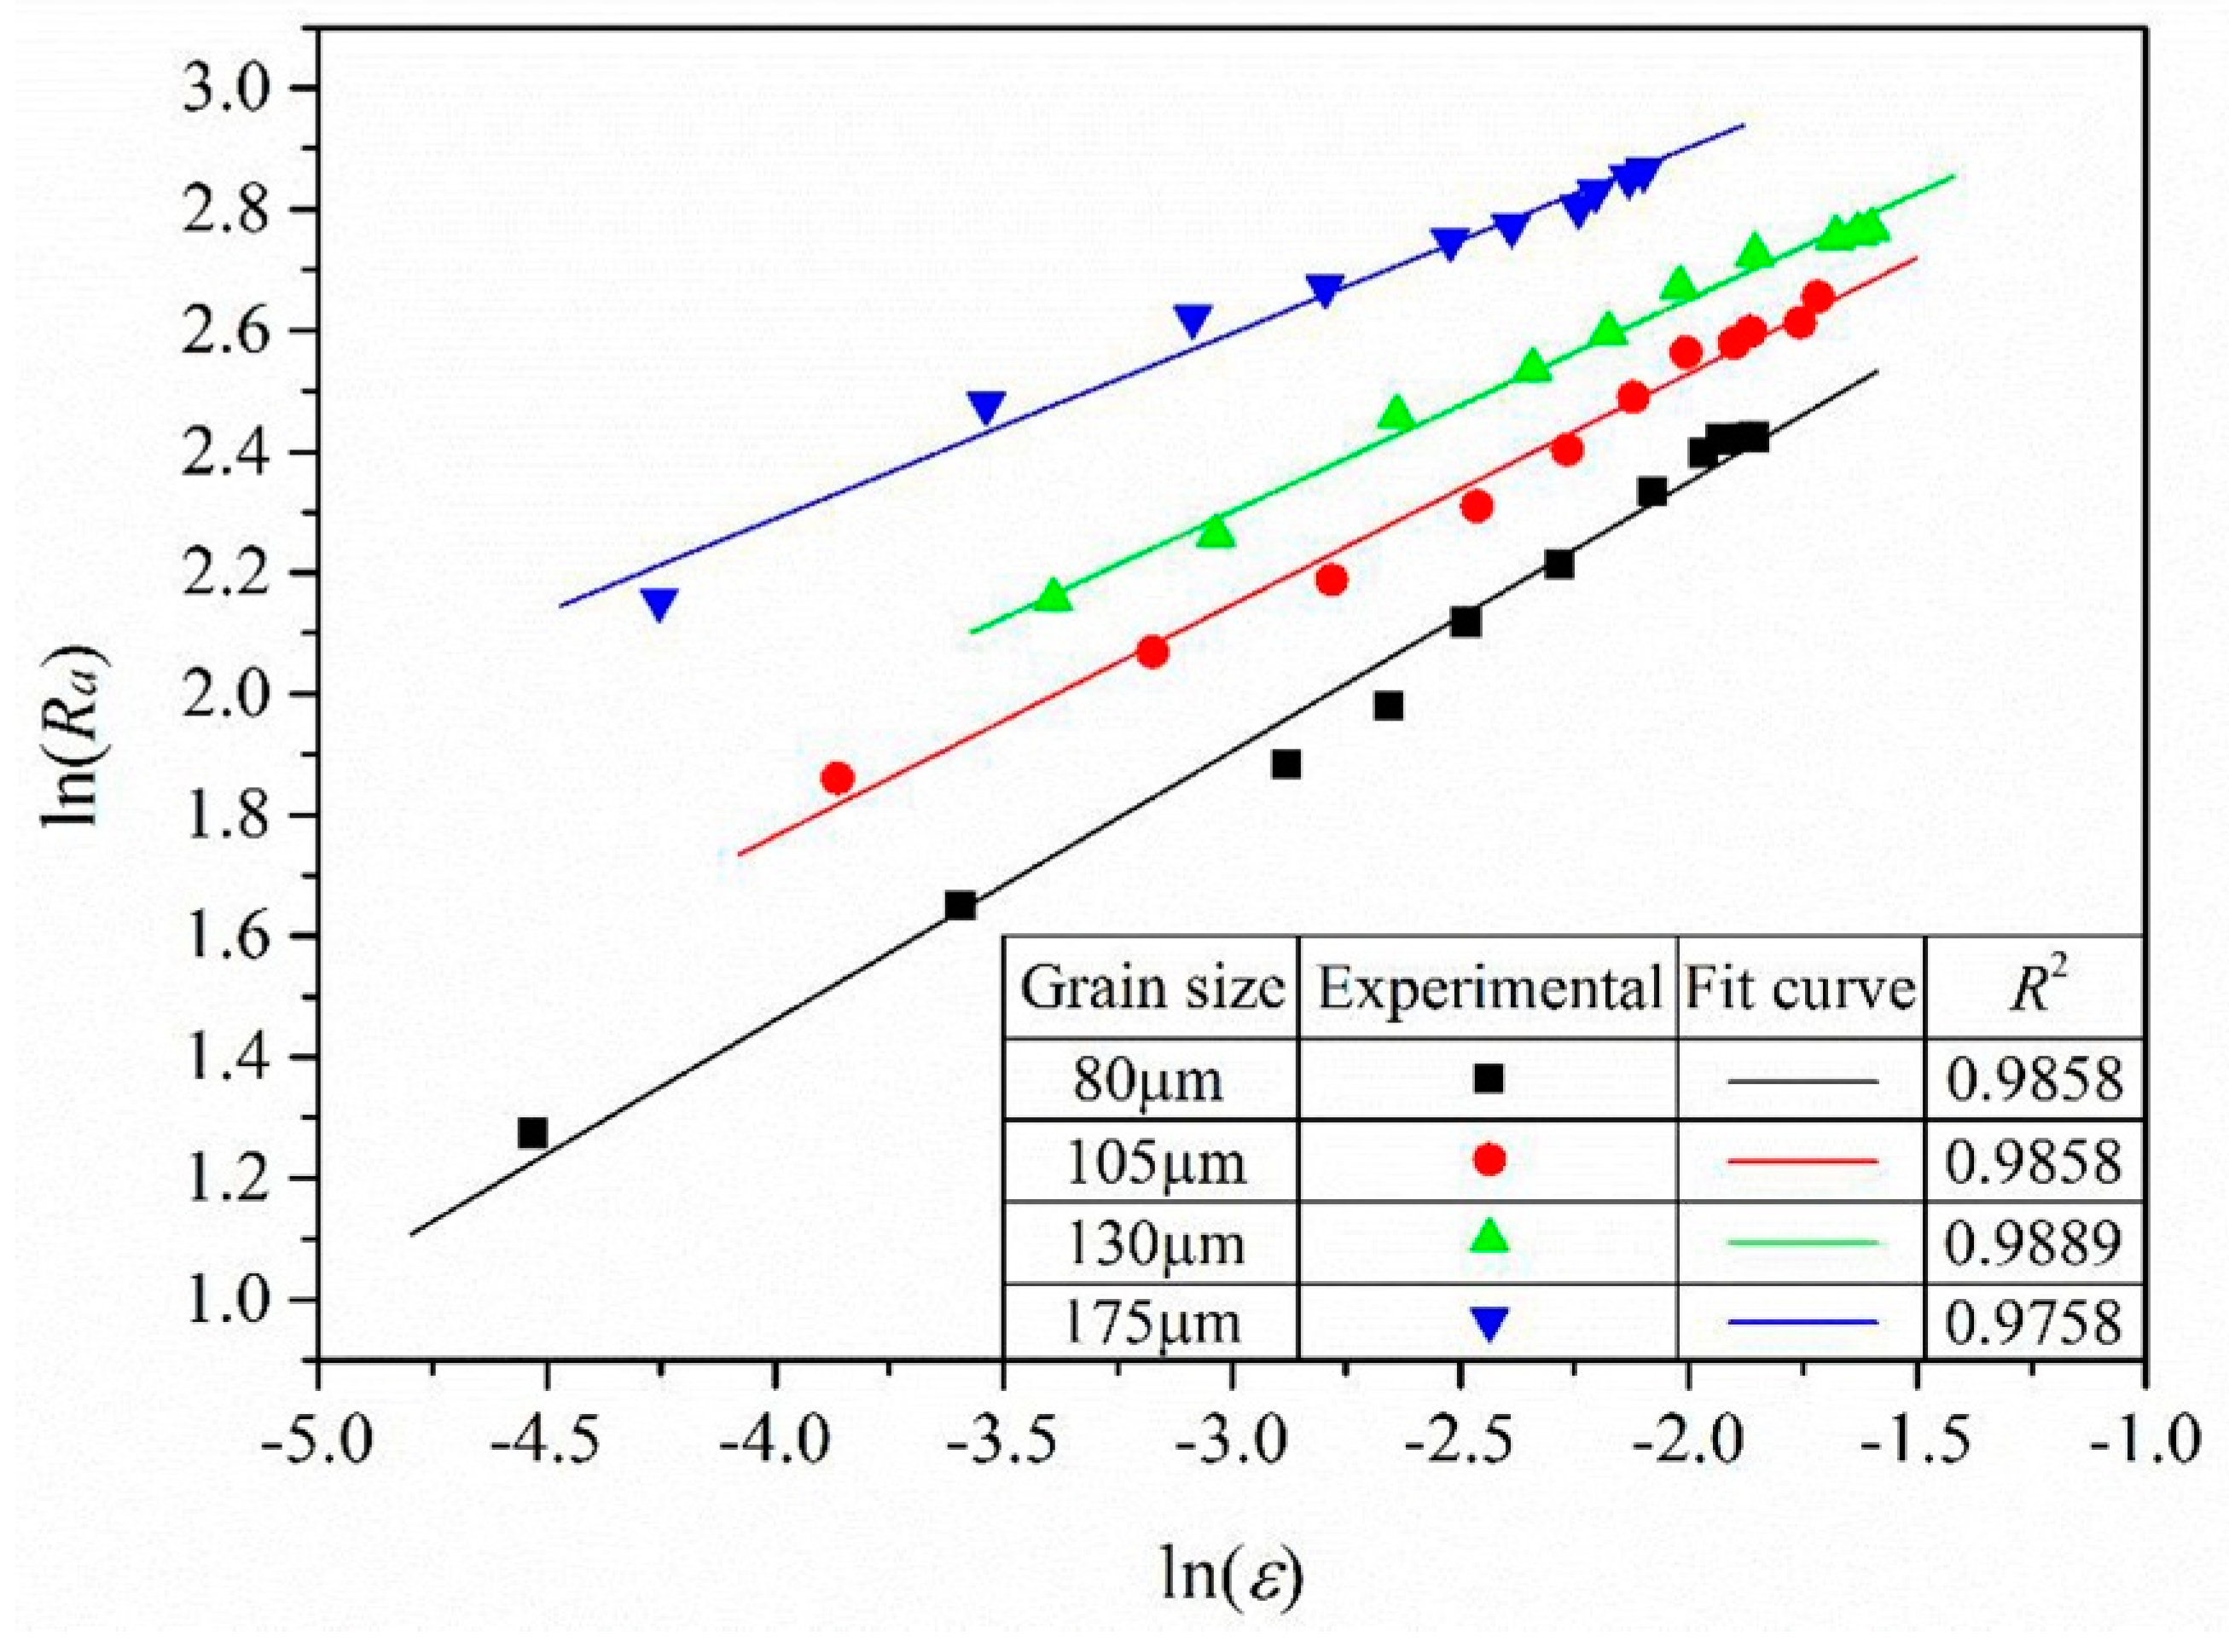
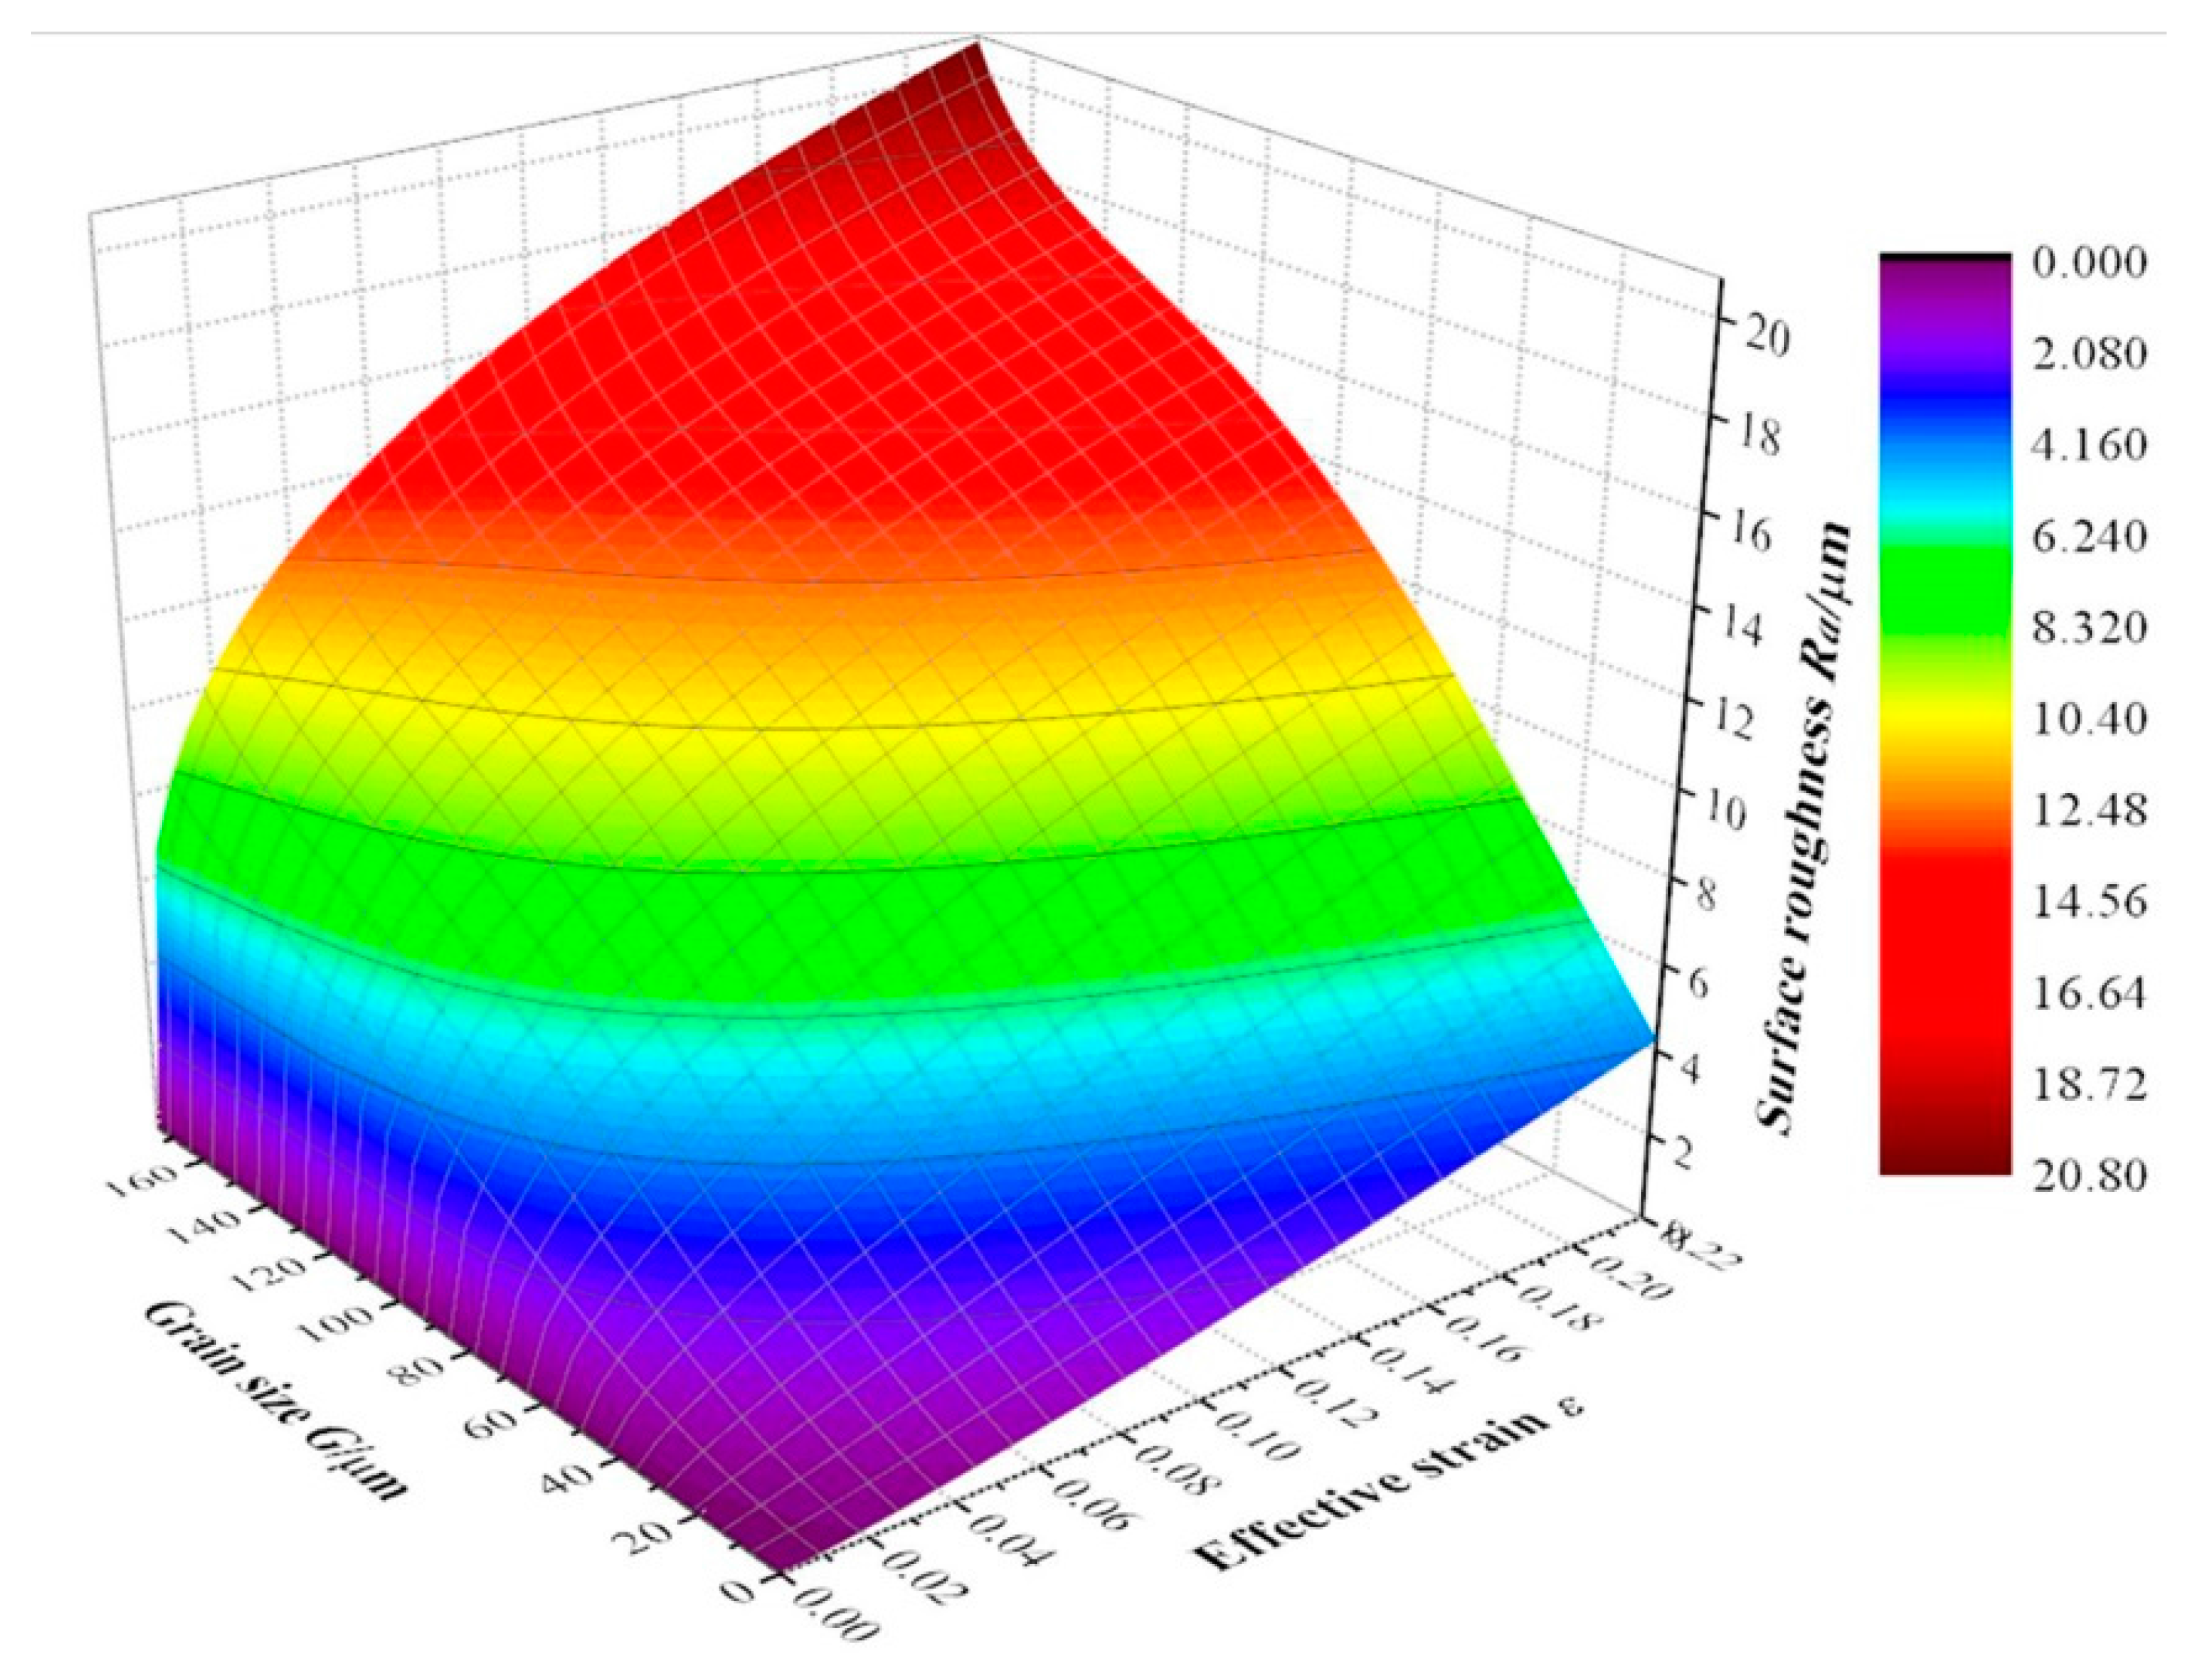
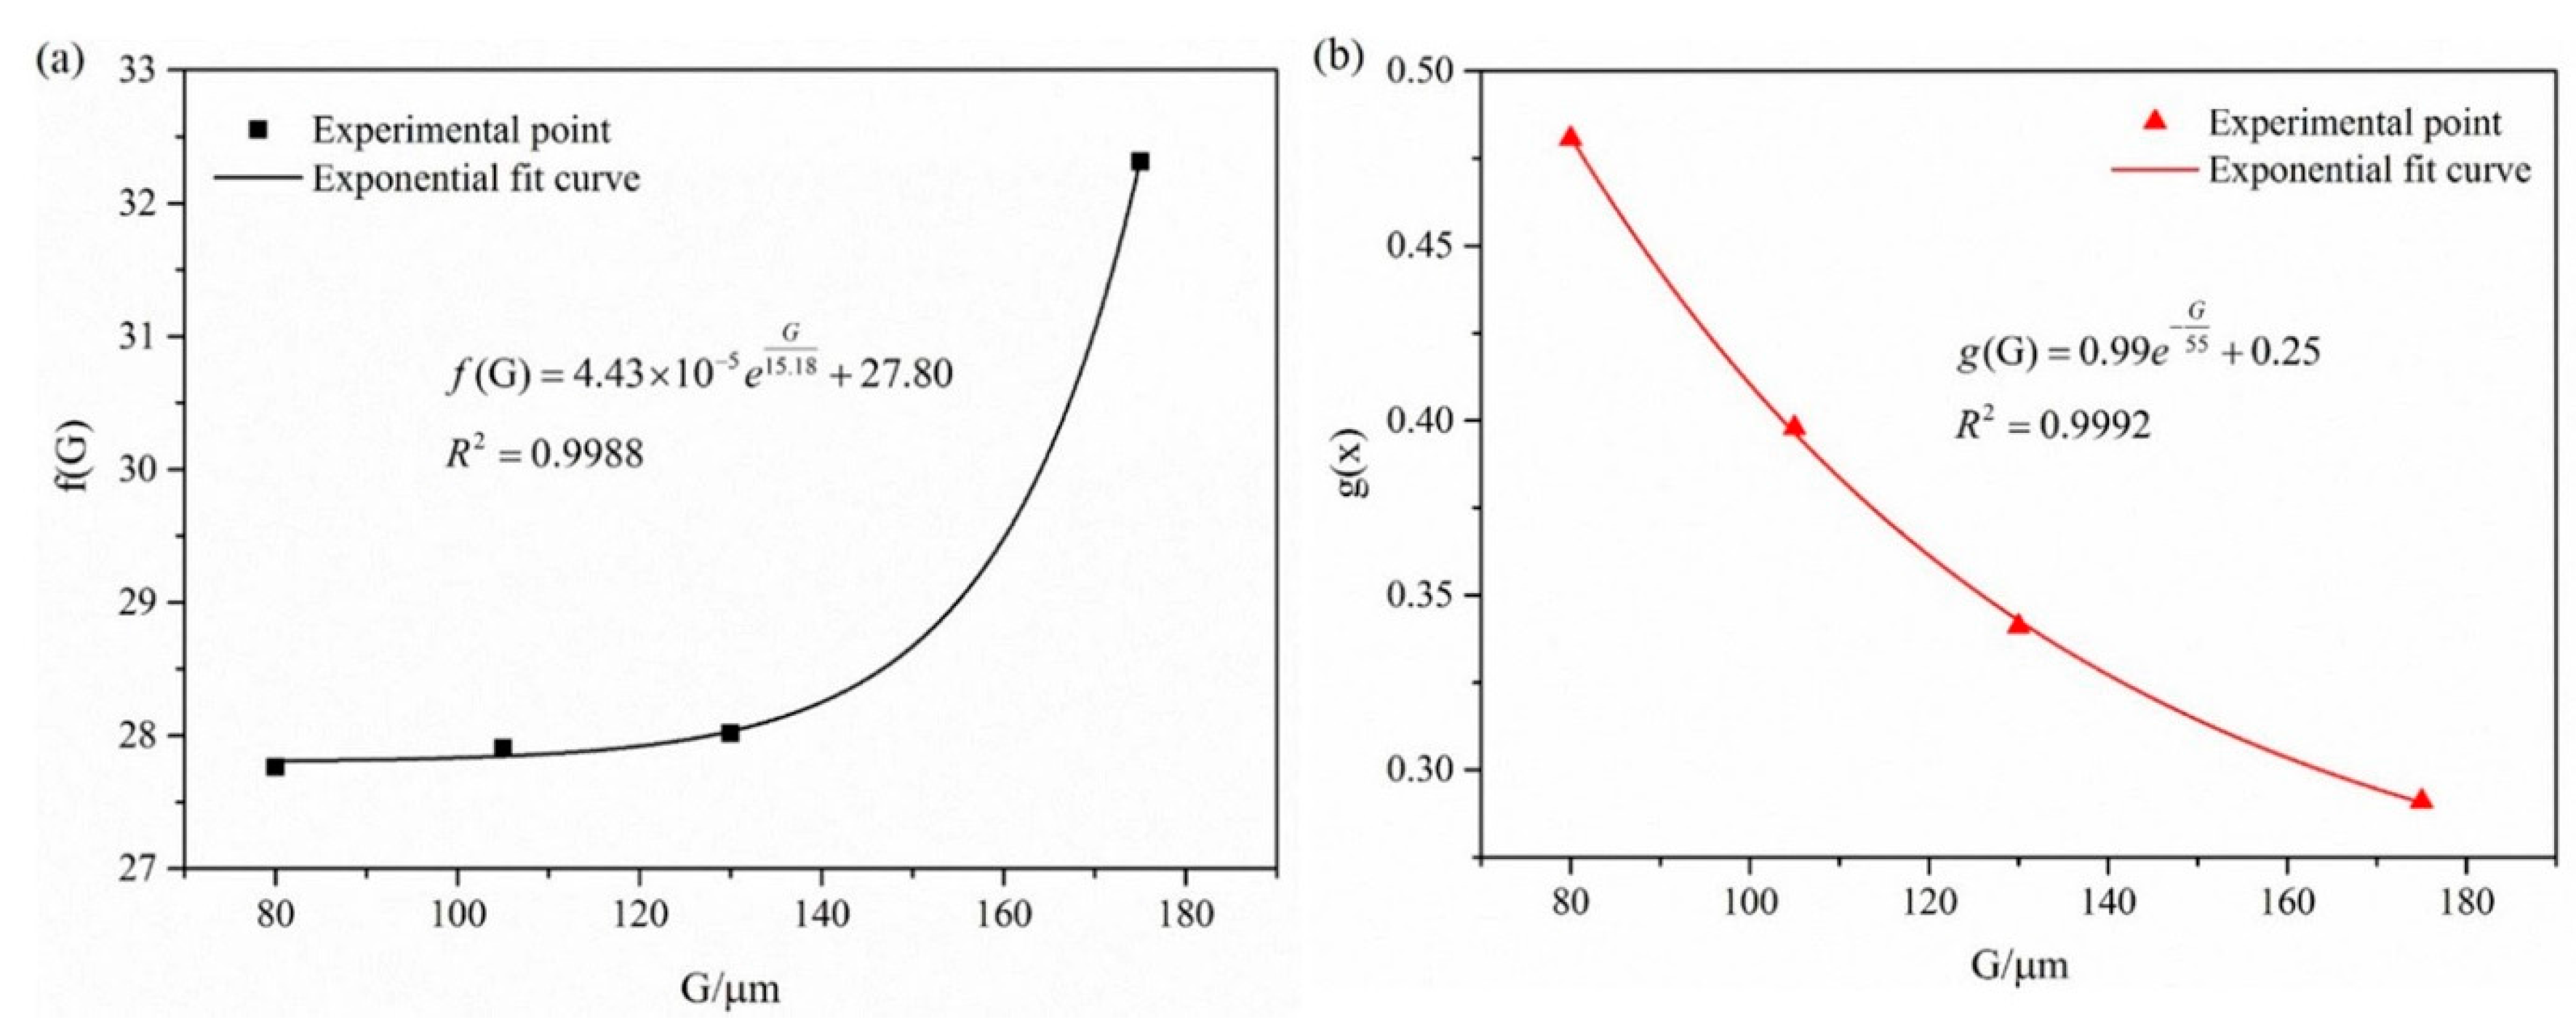
- Under biaxial stress conditions, the surface roughness increases exponentially with strain. The relational expression for the surface roughness of 6063 aluminum alloy tube was determined to be . The surface roughness of hydroformed tubes can therefore be controlled by adjusting the initial grain size or corresponding strain, thereby improving the surface quality of the final structural component.
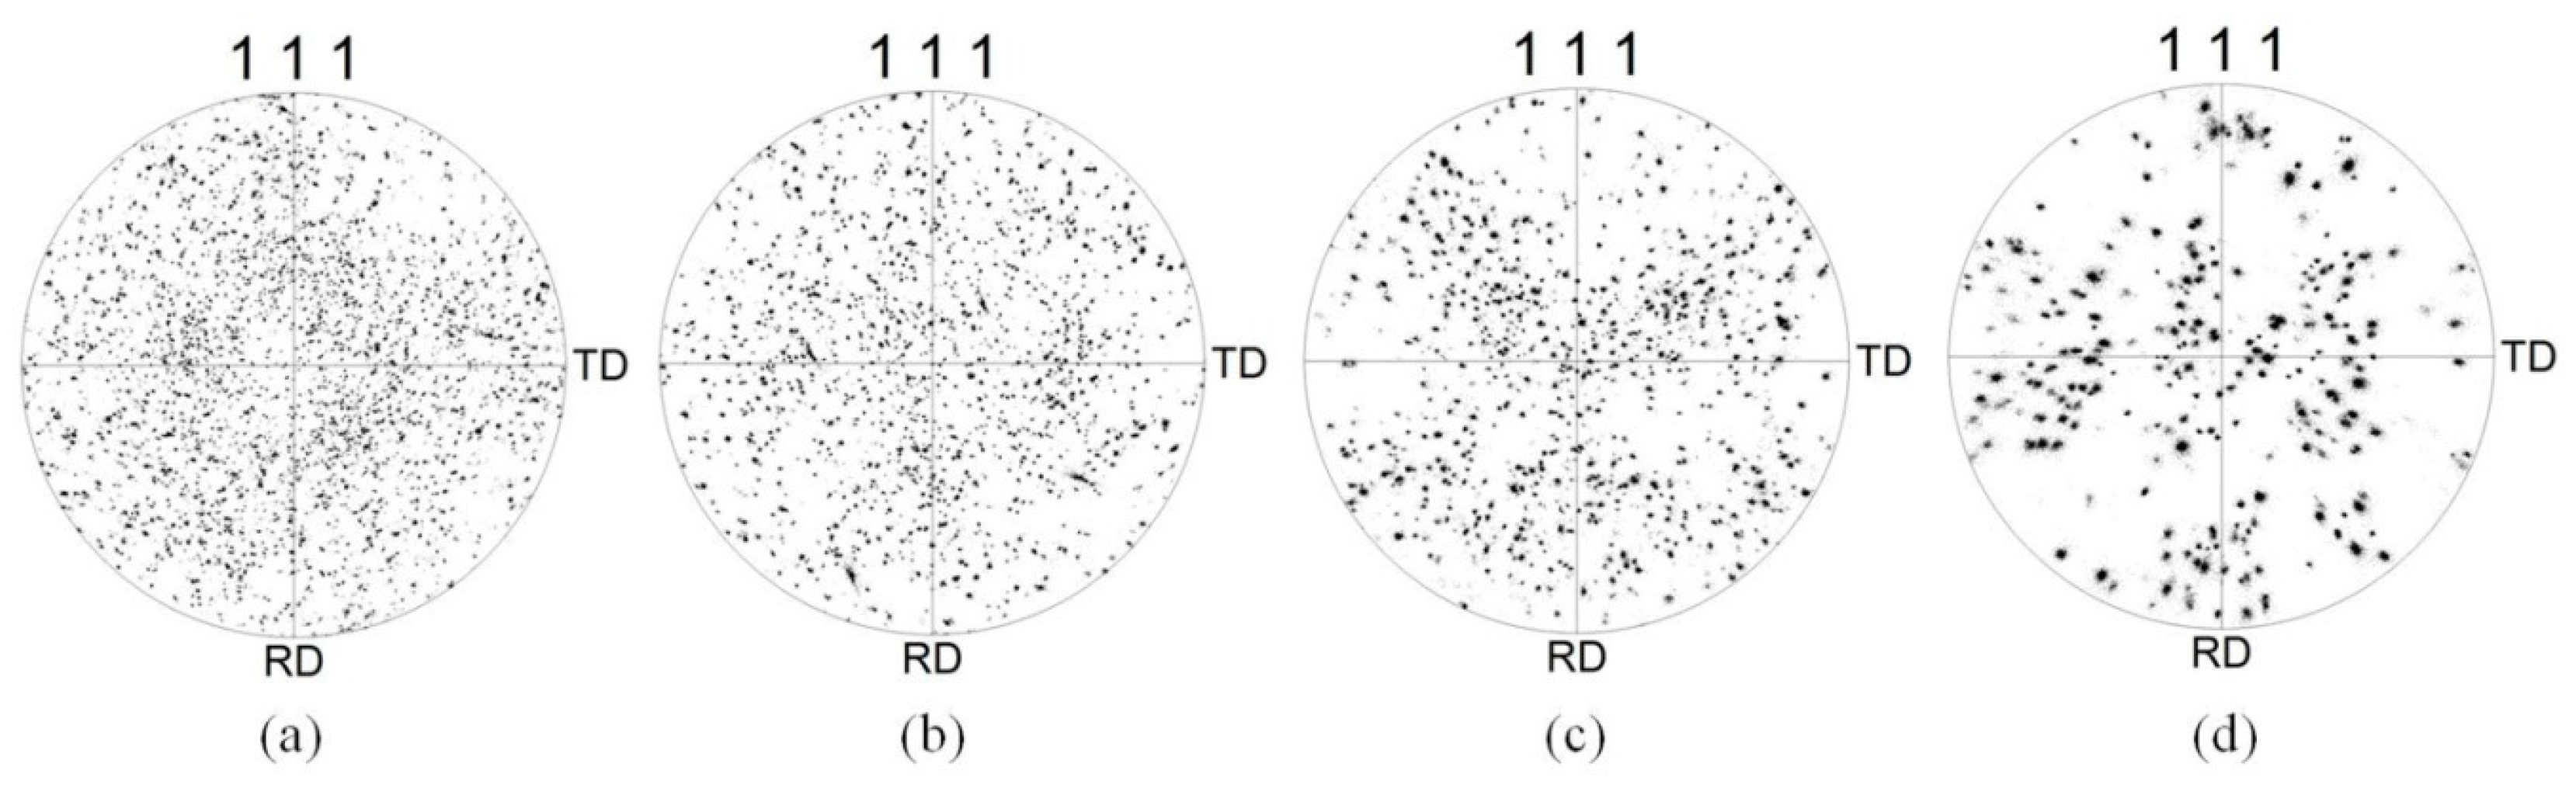
- The surface roughening microscopic behavior is an increase in the inhomogeneity of the grain size distribution with increasing grain size, resulting in greater local deformation. Concentrated grain orientation also caused the serious surface roughening during plastics deformation. Thus, surface roughening increases with grain size, its deviation and grain orientation.
Acknowledgments
Author Contributions
Conflicts of Interest
References
- Chu, E.; Xu, Y. Hydroforming of aluminum extrusion tubes for automotive applications. Part I: buckling, wrinkling and bursting analyses of aluminum tubes. Int. J. Mech. Sci. 2004, 46, 263–283. [Google Scholar] [CrossRef]
- Cai, Y.; Wang, X.S.; Yuan, S.J. Pre-form design for hydro-forming of aluminum alloy automotive cross members. Int. J. Adv. Manuf. Technol. 2016, 86, 463–474. [Google Scholar] [CrossRef]
- Palumbo, G. Hydroforming a small scale aluminum automotive component using a layered die. Mater. Des. 2013, 44, 365–373. [Google Scholar] [CrossRef]
- Liu, Z.; Wu, X.; Zhang, D.; Ding, Y.; Gao, L.; Yan, X. Improvement of Formability of Y-Shaped Tubular Part of 6016 Aluminium Alloy by Pulsating Hydroforming. In Proceedings of SAE-China Congress 2014: Selected Papers; Springer: Berlin/Heidelberg, Germany, 2015; pp. 221–225. [Google Scholar]
- Hashemi, S.J.; Naeini, H.M.; Liaghat, G.; Tafti, R.A.; Rahmani, F. Numerical and experimental investigation of temperature effect on thickness distribution in warm hydroforming of aluminum tubes. J. Mater. Eng. Perform. 2013, 22, 57–63. [Google Scholar] [CrossRef]
- Bihamta, R.; D’Amours, G.; Bui, Q.H.; Guillot, M.; Rahem, A.; Fafard, M. Numerical and experimental studies on the new design concept of hydroforming dies for complex tubes. Mater. Des. 2013, 47, 766–778. [Google Scholar] [CrossRef]
- Kommelt, P. Optimisation of the Initial Tube Geometry for Tube Hydroforming: A Mathematical Approach. Master’s Thesis, University of Twente, Enschede, The Netherlands, December 2004. [Google Scholar]
- Azim, A.; Ali, A.; Barkawi, S.B.; Nuraini, A.A.; Faieza, A.A.; Ismail, T.H.T.; Shahril, M. Performance of Aluminium Alloy Side Door Subjected to Pole Impact Test. Appl. Mech. Mater. 2012, 165, 280–284. [Google Scholar] [CrossRef]
- Raabe, D.; Sachtleber, M.; Weiland, H.; Scheele, G.; Zhao, Z. Grain-scale micromechanics of polycrystal surfaces during plastic straining. Acta Mater. 2003, 51, 1539–1560. [Google Scholar] [CrossRef]
- Raabe, D.; Sachtleber, M.; Zhao, Z.; Roters, F.; Zaefferer, S. Micromechanical and macromechanical effects in grain scale polycrystal plasticity experimentation and simulation. Acta Mater. 2001, 49, 3433–3441. [Google Scholar] [CrossRef]
- Roters, F.; Eisenlohr, P.; Hantcherli, L.; Tjahjanto, D.D.; Bieler, T.R.; Raabe, D. Overview of constitutive laws, kinematics, homogenization and multiscale methods in crystal plasticity finite-element modeling: Theory, experiments, applications. Acta Mater. 2010, 58, 1152–1211. [Google Scholar] [CrossRef]
- Zhao, Z.; Radovitzky, R.; Cuitino, A. A study of surface roughening in fcc metals using direct numerical simulation. Acta Mater. 2004, 52, 5791–5804. [Google Scholar] [CrossRef]
- Romanova, V.; Balokhonov, R.; Zinovieva, O. A micromechanical analysis of deformation-induced surface roughening in surface-modified polycrystalline materials. Meccanica 2016, 51, 359–370. [Google Scholar] [CrossRef]
- Liu, Y.; Jehanathan, N.; Yang, H.; Laeng, J. SEM observation of the “orange peel effect” of materials. Mater. Lett. 2007, 61, 1433–1435. [Google Scholar] [CrossRef]
- Cai, Y.; Wang, X.S.; Yuan, S.J. Analysis of surface roughening behavior of 6063 aluminum alloy by tensile testing of a trapezoidal uniaxial specimen. Mater. Sci. Eng. A 2016, 672, 184–193. [Google Scholar] [CrossRef]
- Shi, Y.; Zhao, P.Z.; Jin, H.; Wu, P.D.; Lloyd, D.J. Analysis of Surface Roughening in AA6111 Automotive Sheet Under Pure Bending. Metall. Mater. Trans. A 2016, 47, 949–960. [Google Scholar] [CrossRef]
- Wouters, O.; Vellinga, W.P.; Van Tijum, R.; De Hosson, J.T.M. On the evolution of surface roughness during deformation of polycrystalline aluminum alloys. Acta Mater. 2005, 53, 4043–4050. [Google Scholar] [CrossRef]
- Sachtleber, M.; Raabe, D.; Weiland, H. Surface roughening and color changes of coated aluminum sheets during plastic straining. J. Mater. Process. Technol. 2004, 148, 68–76. [Google Scholar] [CrossRef]
- Stoudt, M.R.; Ricker, R.E. The relationship between grain size and the surface roughening behavior of Al-Mg alloys. Metall. Mater. Trans. A 2002, 33, 2883–2889. [Google Scholar] [CrossRef]
- Tikhovskiy, I.; Raabe, D.; Roters, F. Simulation of earing during deep drawing of an Al-3% Mg alloy (AA 5754) using a texture component crystal plasticity FEM. J. Mater. Process. Technol. 2007, 183, 169–175. [Google Scholar] [CrossRef]
- Zhao, Z.; Mao, W.; Roters, F.; Raabe, D. A texture optimization study for minimum earing in aluminium by use of a texture component crystal plasticity finite element method. Acta Mater. 2004, 52, 1003–1012. [Google Scholar] [CrossRef]
- Shi, Y.; Wu, P.D.; Lloyd, D.J.; Embury, D. Numerical study of surface roughening in blow-formed aluminum bottle with crystal plasticity. Mater. Sci. Eng. A 2015, 638, 97–105. [Google Scholar] [CrossRef]
- He, Z.B.; Yuan, S.J.; Lin, Y.L. Analytical model for tube hydro-bulging test, part I: Models for stress components and bulging zone profile. Int. J. Mech. Sci. 2014, 87, 297–306. [Google Scholar] [CrossRef]
- He, Z.B.; Yuan, S.J.; Lin, Y.L. Analytical model for tube hydro-bulging tests, part II: Linear model for pole thickness and its application. Int. J. Mech. Sci. 2014, 87, 307–315. [Google Scholar] [CrossRef]
- Choi, Y.S.; Piehler, H.R.; Rollett, A.D. Introduction and application of modified surface roughness parameters based on the topographical distributions of peaks and valleys. Mater. Charact. 2007, 58, 901–908. [Google Scholar] [CrossRef]
- Zhao, Z.; Ramesh, M.; Raabe, D.; Cuitiño, A.M.; Radovitzky, R. Investigation of three-dimensional aspects of grain-scale plastic surface deformation of an aluminum oligocrystal. Int. J. Plast. 2008, 24, 2278–2297. [Google Scholar] [CrossRef]
- Watanabe, H.; Kurimoto, K.; Uesugi, T.; Takigawa, Y.; Higashi, K. Accommodation mechanisms for grain boundary sliding as inferred from texture evolution during superplastic deformation. Philos. Mag. 2013, 93, 2913–2931. [Google Scholar] [CrossRef]


| Annealing Temperature | Mean Grain Size | Standard Deviation |
|---|---|---|
| 350 °C | 80 μm | 28 μm |
| 400 °C | 105 μm | 39 μm |
| 450 °C | 130 μm | 47 μm |
| Initial tube | 175 μm | 70 μm |
© 2017 by the authors. Licensee MDPI, Basel, Switzerland. This article is an open access article distributed under the terms and conditions of the Creative Commons Attribution (CC BY) license ( http://creativecommons.org/licenses/by/4.0/).
Share and Cite
Cai, Y.; Wang, X.; Yuan, S. Surface Roughening Behavior of 6063 Aluminum Alloy during Bulging by Spun Tubes. Materials 2017, 10, 299. https://doi.org/10.3390/ma10030299
Cai Y, Wang X, Yuan S. Surface Roughening Behavior of 6063 Aluminum Alloy during Bulging by Spun Tubes. Materials. 2017; 10(3):299. https://doi.org/10.3390/ma10030299
Chicago/Turabian StyleCai, Yang, Xiaosong Wang, and Shijian Yuan. 2017. "Surface Roughening Behavior of 6063 Aluminum Alloy during Bulging by Spun Tubes" Materials 10, no. 3: 299. https://doi.org/10.3390/ma10030299