
Structure and Photocatalytic Properties of Mn-Doped TiO2 Loaded on Wood-Based Activated Carbon Fiber Composites

Department of Wood Science and Technology, Tianjin University of Science & Technology, Tianjin 300222, China
*
Author to whom correspondence should be addressed.
Materials 2017, 10(6), 631; https://doi.org/10.3390/ma10060631
Submission received: 20 April 2017
/
Revised: 24 May 2017
/
Accepted: 2 June 2017
/
Published: 9 June 2017
(This article belongs to the Special Issue Enhancing the Photocatalytic Activity of TiO2 Photocatalysts)
Abstract
:Mn-doped TiO2 loaded on wood-based activated carbon fiber (Mn/TiO2-WACF) was prepared by sol–gel and impregnation method using MnSO4·H2O as manganese source. The structure of Mn/TiO2–WACF was characterized by SEM, XRD, FTIR, N2 adsorption and UV–Vis, and its photocatalytic activity for methylene blue degradation was investigated. Results show that Mn-doped TiO2 were loaded on the surface of wood-based activated carbon fiber with high-development pore structures. The crystallite sizes of Mn-doped TiO2 in composites were smaller than that of the undoped samples. With an increase of Mn doping content, Ti–O bending vibration intensity of Mn/TiO2–WACF increased and then decreased. Moreover, Ti–O–Ti and Ti–O–Mn absorption peaks increased upon doping of Mn. Mn/TiO2–WACF with low specific surface area, and pore volume was improved at 3.5–6.0 nm of mesopore distributions due to the Mn-doped TiO2 load. In addition, the UV–Vis showed that Mn/TiO2–WACF (photodegradation rate of 96%) has higher photocatalytic activity than the undoped samples for methylene blue degradation under visible light irradiation.
1. Introduction
As a well-known photocatalyst, TiO2 has attracted lots of interest over the past decades due to its chemical stability, thermal stability, high efficiency, nontoxicity, and low cost [1]. It is extensively applied to the purification of air, bactericidal action, anti-fog, self-cleaning, and degradation of organic pollutant compounds in wastewater. However, the band gap of TiO2 photocatalyst is 3.2 eV, therefore only under ultraviolet (UV) excitation light this semiconductor exhibits catalytic, and the ultraviolet content of sunlight has only 3% to 5%, which limits the use of solar energy. Electrons and holes easily recombine on the surface and interior of TiO2 particles, which reduces the photocatalytic activity of TiO2 [2,3,4]. In addition, the degradation rate of the suspension-type TiO2 photocatalyst is slower when the concentration of target pollutant is low. On the other hand, TiO2 powder is difficult to be recycled, as the material gets easily inactivated and coagulates, which limits the application of nano-TiO2 [5,6]. Therefore, the most important and challenging issue is to develop efficient visible light responsive photocatalysts by the modification of TiO2 and curing.
At present, the main surface modifications used with TiO2 are compound semiconductor method [7,8,9], ion doping method [10,11,12,13] and precious metal deposition method [14,15], among which, ion doping of transition metal is an effective route. The studies suggest that a small amount of metal-ion-doped TiO2 can make TiO2 become potential wells to capture photogenerated electron–hole pairs; thus, the photo-generated electrons and holes are difficult to complex [16,17,18,19]. The focus of curing research is the choice of carrier and fixed process. Inorganic materials mainly used as carrier include glass, metal, ceramics, activated carbon and molecular sieves. Among them, the activated carbon fiber has become the main carrier of photocatalytic oxidation technology due to its good adsorption performance and photocatalytic synergistic effect [20]. With the growing awareness of environmental protection and the shortage of fossil resources, the sustainable development of biomass activated carbon fiber has gradually became an alternative photocatalyst carrier material and has shown excellent performance [21,22,23].
In the present study, using activated carbon fiber (wood-based activated carbon fiber, WACF) from liquefied wood as a carrier and Mn-doped TiO2 as photocatalyst, the photocatalytic composite materials (Mn/TiO2–WACF) were prepared by the sol-gel and impregnation method. The effects of different Mn doping ratios on the microcrystalline structure, specific surface area and pore size distribution of the composites were investigated in detail. Additionally, the photocatalytic degradation of photocatalytic composite for methylene blue (MB) under visible light conditions is also discussed.
2. Experimental
2.1. Chemicals
For the preparation of undoped and Mn-doped TiO2 photocatalytic composite materials, the materials used were ethanol (molecular mass (M) = 46.07, C2H6O), tetrabutyl titanate (M = 340.32, Ti(OC4H9)4), Manganese sulfate (M = 169.6, MnSO4·H2O) and aceticacid (M = 60.05, C2H4O2). For photocatalytic degradation, methylene blue dye; MB (M = 319.85, C16H18N3SCl) was used. All chemicals used were analytical reagent (AR) grade from Tianjin Jiangtian Chemical Co. Ltd. (Tianjin, China) and used without further purification.
2.2. Samples
10.2 g of Ti(OC4H9)4 was slowly poured into 90 mL of ethanol, and stirred with a magnetic stirrer for 30 min until colorless and transparent. Meanwhile, 3 mL of MnSO4·H2O solution (17 g/L) was added to 2.2 mL of distilled water, 2 mL of acetic acid, and 60 mL of ethanol to from another solution. Then, the latter solution was slowly poured into the former solution under vigorous stirring until completely dissolved. Finally, the mixed solution was placed in a thermostatic water bath at 40 °C for 2 h to obtain a yellowish emulsion colloid solution consisting of Mn–TiO2 gel.
WACF (0.2 g) [24] was evenly immersed into the colloid solution. The solution was taken out after vibration and left to stand for 30 min. Then, the solution was placed into a vacuum tube-furnace for drying process under 105 °C for 1 h. After heat treatment at 450 °C for 30 min under different calcination temperatures through N2 (flow rate was 100 mL/min), Mn/TiO2–WACF photocatalysis composite material was prepared. According to the molar ratio of Mn to Ti: 0:1, 1:600, 1:300, 1:100, and 1:50, the prepared samples were labeled as Ti–WACF, Mn/600Ti–WACF, Mn/300Ti–WACF, Mn/100Ti–WACF, and Mn/50Ti–WACF, respectively.
2.3. Measurements
2.3.1. Scanning Electron Microscopy Analysis
JSM-7500F cold-field-emission scanning microscope (resolution at 3.0 nm and acceleration voltage at 1 kV) produced by JEOL (Tokyo, Japan) was adopted for appearance and morphology diagrams of the samples. After Mn/TiO2–WACF photocatalysis, composite material samples were dried and bonded on the sample table to conduct surface vacuum metal spraying and observe their surface morphologies.
2.3.2. XRD Analysis
D/max2500 X-ray diffraction (XRD) was obtained on a RIGAKU instrument (Tokyo, Japan). Cu Kα X-ray was used, tube voltage was 40 kV, tube current was 100 mA, scanning angle scope 2θ was 20°–80°, and scanning speed was 8° min−1.
According to the Scherrer formula:
The average crystallite size D (nm) of TiO2 in photocatalysis samples is calculated. K1 is the shape factor of the crystalline with a value of 0.89, λ is the wavelength of X-ray with a value of 0.154 nm, β1/2 is full width at half maximum of diffraction peak (rad), and θ is the diffraction angle (°).
2.3.3. FT-IR Analysis
Nicolet 6700 Fourier transform infrared (FT-IR) spectrometer (Thermo Electron Corporation, Waltham, MA, USA) was used to analyze the samples. Samples were tested by 1:300 KBr disc technique. Absorbance spectra were acquired at 4 cm−1 resolution and signal-averaged over 32 scans in the scanning range of 400–4000 cm−1.
2.3.4. Specific Surface Area and Aperture Analysis
The surface area and the porosity of the samples were determined by N2 adsorption–desorption isotherm measured at 77 K in a Micromeritics ASAP-2020 apparatus (Micromeritics Instrument Corporation, Norcross, GA, USA). Before analysis, the samples were degassed at 350 °C for 2 h. The specific surface area (SBET) was calculated by the Brunauer–Emmett–Teller (BET) method using N2 adsorption isotherm data. The total pore volume (Vtot) was evaluated by converting the amount of N2 adsorbed at a relative pressure of 0.995 to the volume of liquid adsorbate. The micropore area (Smicro) and micropore volume (Vmicro) were obtained by t-plot method. The mesopore area (Smeso) and mesopore volume (Vmeso) were calculated by Barrett–Joyner–Halenda method. Pore size distributions were calculated using Density Functional Theory (DFT) Plus Software (provided by Micromeritics Instrument Corporation, Norcross, GA, USA), which is based on the calculated adsorption isotherms for pores of different sizes. This program performs an inversion of the integral equation for the overall adsorption isotherm with respect to pore size distributions.
2.3.5. Photocatalysis Performance Test
33 mg of methylene blue was dissolved in 1000 mL of distilled water at 60 °C and placed in a volumetric flask. Mn/TiO2–WACF (10 mg) prepared under different calcination temperatures were accurately weighted and placed in a beaker with 100 mL of MB solution. The solutions were placed into a black case and magnetically stirrer for 40 min until adsorption equilibrium. A spectrophotometer (UV-1600 model produced by Shanghai MAPADA Instrument Co. Ltd. (Shanghai, China)) was used to measure and record absorbance A0 in preliminary test at 665 nm. Optical filters (transmission wavelength 400–800 nm) were covered on beakers filled with samples. Under the conditions of illumination and magnetic stirring, their absorbance was measured with a spectrophotometer every 40 min, and the decolorization ratio D was calculated according to Equation (2):
where A0 is the solution absorbance before illuminance, and A is the solution absorbance at a certain time.
3. Results and Discussion
3.1. Morphological Characteristics
SEM micrographies of the WACF are shown in Figure 1a, the surface of Mn/Ti–WACF had a layer of Mn-doped nano-TiO2 film with uniform thickness (Figure 1c). Mn-doped nano-TiO2 films were loaded on the surface of WACF, but some tilted and shed in the edges, mainly due to the inconsistency of the fiber and modified photocatalyst shrinkage under high-temperature calcination. In addition, bare base materials existed on the surface of Mn/Ti–WACF (Figure 1d), which had well-reserved abundant pore structures and provided advantages for subsequent adsorption and photocatalytic reaction.
3.2. XRD Analysis
Figure 2 shows an X-ray diffractograms spectrum of the various samples. The diffraction peaks of anatase TiO2 (101) (at 2θ = 25.22°) and (004) (at 2θ = 37.93°) were not cancelled after Mn doping, and no diffraction peaks associated with rutile and brookite (the crystal structure of TiO2 was consistent with that of undoped Mn) was observed, suggesting that the crystal structure of TiO2 was not affected by Mn doping. In addition, the intensity of these peaks decreased, and the main peak position shifted slightly with increasing Mn doping concentration, indicative of a decrease in crystallization of TiO2. This phenomenon also reveals that Mn ions successfully enter into the TiO2 crystal lattice, replacing part of the Ti ions, destroying the symmetry of the crystal structure of TiO2, causing crystal lattice disorder and increasing distortion, which results in defects in the lattice [25,26]. The full-width half maximum increased with increasing Mn doping concentrations, which indicates that doping Mn effectively controlled the recrystallization or grain size of the TiO2 sintering during calcination. No impurity peak was associated with the Mn element in the XRD crystalline spectra of the samples due to scarce Mn doping.
Table 1 presents the average crystallite size of modified nano-TiO2, which were calculated based on Scherrer formula. The grain size of nano-TiO2 gradually increases with increasing Mn doping concentrations. The crystallite sizes (25.4–27.8 nm) of TiO2 after doping Mn were obviously smaller than that of undoped Mn, indicating that Mn doping can inhibit the growth and agglomeration of TiO2 grains. This small size promotes TiO2 to evenly and firmly wrap on the surface of WACF, providing a superior condition for the photocatalytic reaction.
3.3. FTIR Spectroscopy
FTIR spectra of TiO2 doped with different Mn doping concentration on WACF are shown in Figure 3. Stretching and bending vibration of hydroxyl groups of all loaded materials were in the range of 3200–3600 cm−1 and 1617–1635 cm−1, and the stretching vibration band intensity of Mn-doped samples was clearly stronger than that of the undoped sample, indicating that TiO2 had a stronger adsorption with Mn-doping. The absorption bands of loaded materials at 1444 cm−1 were associated to the stretching of C–H bonds and C–O–Ti. A smaller amount of Mn doping caused intensity enhancement of absorption bands, indicating that less Mn doping promotes TiO2 loading on the WACF surface, as observed in the XRD measurements. Moreover, the absorption bands of all loaded materials in the vicinity of 618 cm−1 belonged to the characteristic absorption peaks of anatase TiO2 (consistent with the XRD test results), which represented the bending vibration of Ti–O, and the peak intensity was bounded by the Mn/Ti molar ratio of 1:300. With the increase of Mn doping amount, Ti–O bending vibration intensity would initially increase and then decrease, and the intensity of Mn-doped materials was bigger than that of pure TiO2. The latter had only Ti–O bending vibration, and the former has Ti–O and Ti–O–Mn bond; this finding indicates that Mn doping was good for TiO2 loading on WACF and for the formation of anatase TiO2. The absorption band of the undoped and doped samples is over the range of 846–878 cm−1; the former had a weak band and only Ti–O–Ti stretching vibration. The latter had stronger intensity bands due to the dual role of Ti–O–Ti and Ti–O–Mn [27].
In addition, the samples showed a weak absorption band in the range of 2340–2360 cm−1 and 1006–1142 cm−1, representing the P–H stretching vibration and the P–O–C bond; this finding was mainly due to the addition of the phosphoric acid catalyst during the liquefaction of the wood.
3.4. Specific Surface Area, Pore Volume and Aperture Analysis
The adsorption/desorption isotherms of WACF and Mn/TiO2–WACF with different Mn doping concentrations are shown in Figure 4. The figure shows that all samples belong to the typical I-type adsorption isotherm (Langmuir isotherm), and the pore structure is dominated by micropores. The curves of WACF and Mn/50Ti–WACF experienced obvious hangover boosting phenomena, and they belonged to I-B type material; the other materials belonged to I-A type material. The N2 adsorption capacity of unloaded WACF sample was higher than that of Mn/TiO2–WACF sample. The hysteresis of the former adsorption and desorption processes was more obvious than the latter, indicating that the former had larger mesopores and macropores than the latter. This finding indicates that the photocatalyst was successfully loaded onto the fiber surface or filled with the pores of the load material. Meanwhile, N2 adsorption quantity of Mn-doped material was lower than that of the undoped material, indicating that the load rate of TiO2 became higher after Mn doping.
The pore diameter distribution (DFT method) of WACF and Mn/TiO2–WACF are shown in Figure 5. The curve shows that the pore size of WACF was mainly distributed between 0.4 nm and 3.5 nm, and that Mn/TiO2–WACF was mainly distributed between 0.4 nm and 6 nm. Therefore, the pore diameter distribution diagram of WACF and Mn/TiO2–WACF was similar, and no multimodal phenomenon was found. However, the Mn/TiO2–WACF had a small amount of mesopore between 3.5 and 6 nm, and the WACF was almost useless because the former was subjected to secondary calcination after loading the photocatalyst onto the latter surface. The latter was equivalent to the second activation by the evaporated photocatalyst to reduce, as much as possible, the TiO2 photocatalyst, resulting in pore diameter distribution of carrier fiber decline. In addition, the pore volume of the loaded material decreased compared with that of WACF, indicating that Mn-doped TiO2 photocatalyst can not only be wrapped on the fiber surface, but also it can be filled into the pores or attached to the hole wall. The pore volume of Mn-doped material was less than that of pure TiO2-loaded material, which again showed that Mn doping can improve the TiO2 loading rate. This result is consistent with the conclusion of adsorption isotherm.
Specific surface area, pore volume, and pore radius of the samples are shown in Table 2. In comparison with WACF and Ti–WACF, SBET, Smicro, Smeso, Vtot, Vmicro and Vmeso of Mn/TiO2–WACF were reduced. The surface area and pore volume of Mn/TiO2–WACF were as high as 1239 and 0.628 cm3/g, respectively. Moreover, with the increase of Mn doping content, PMic of Mn/TiO2–WACF increased first and then decreased, whereas Smeso, Vmeso and PMe decreased first and then increased, indicating that Mn doping had a certain effect on the micropores and mesopores.
3.5. UV–Vis Analysis
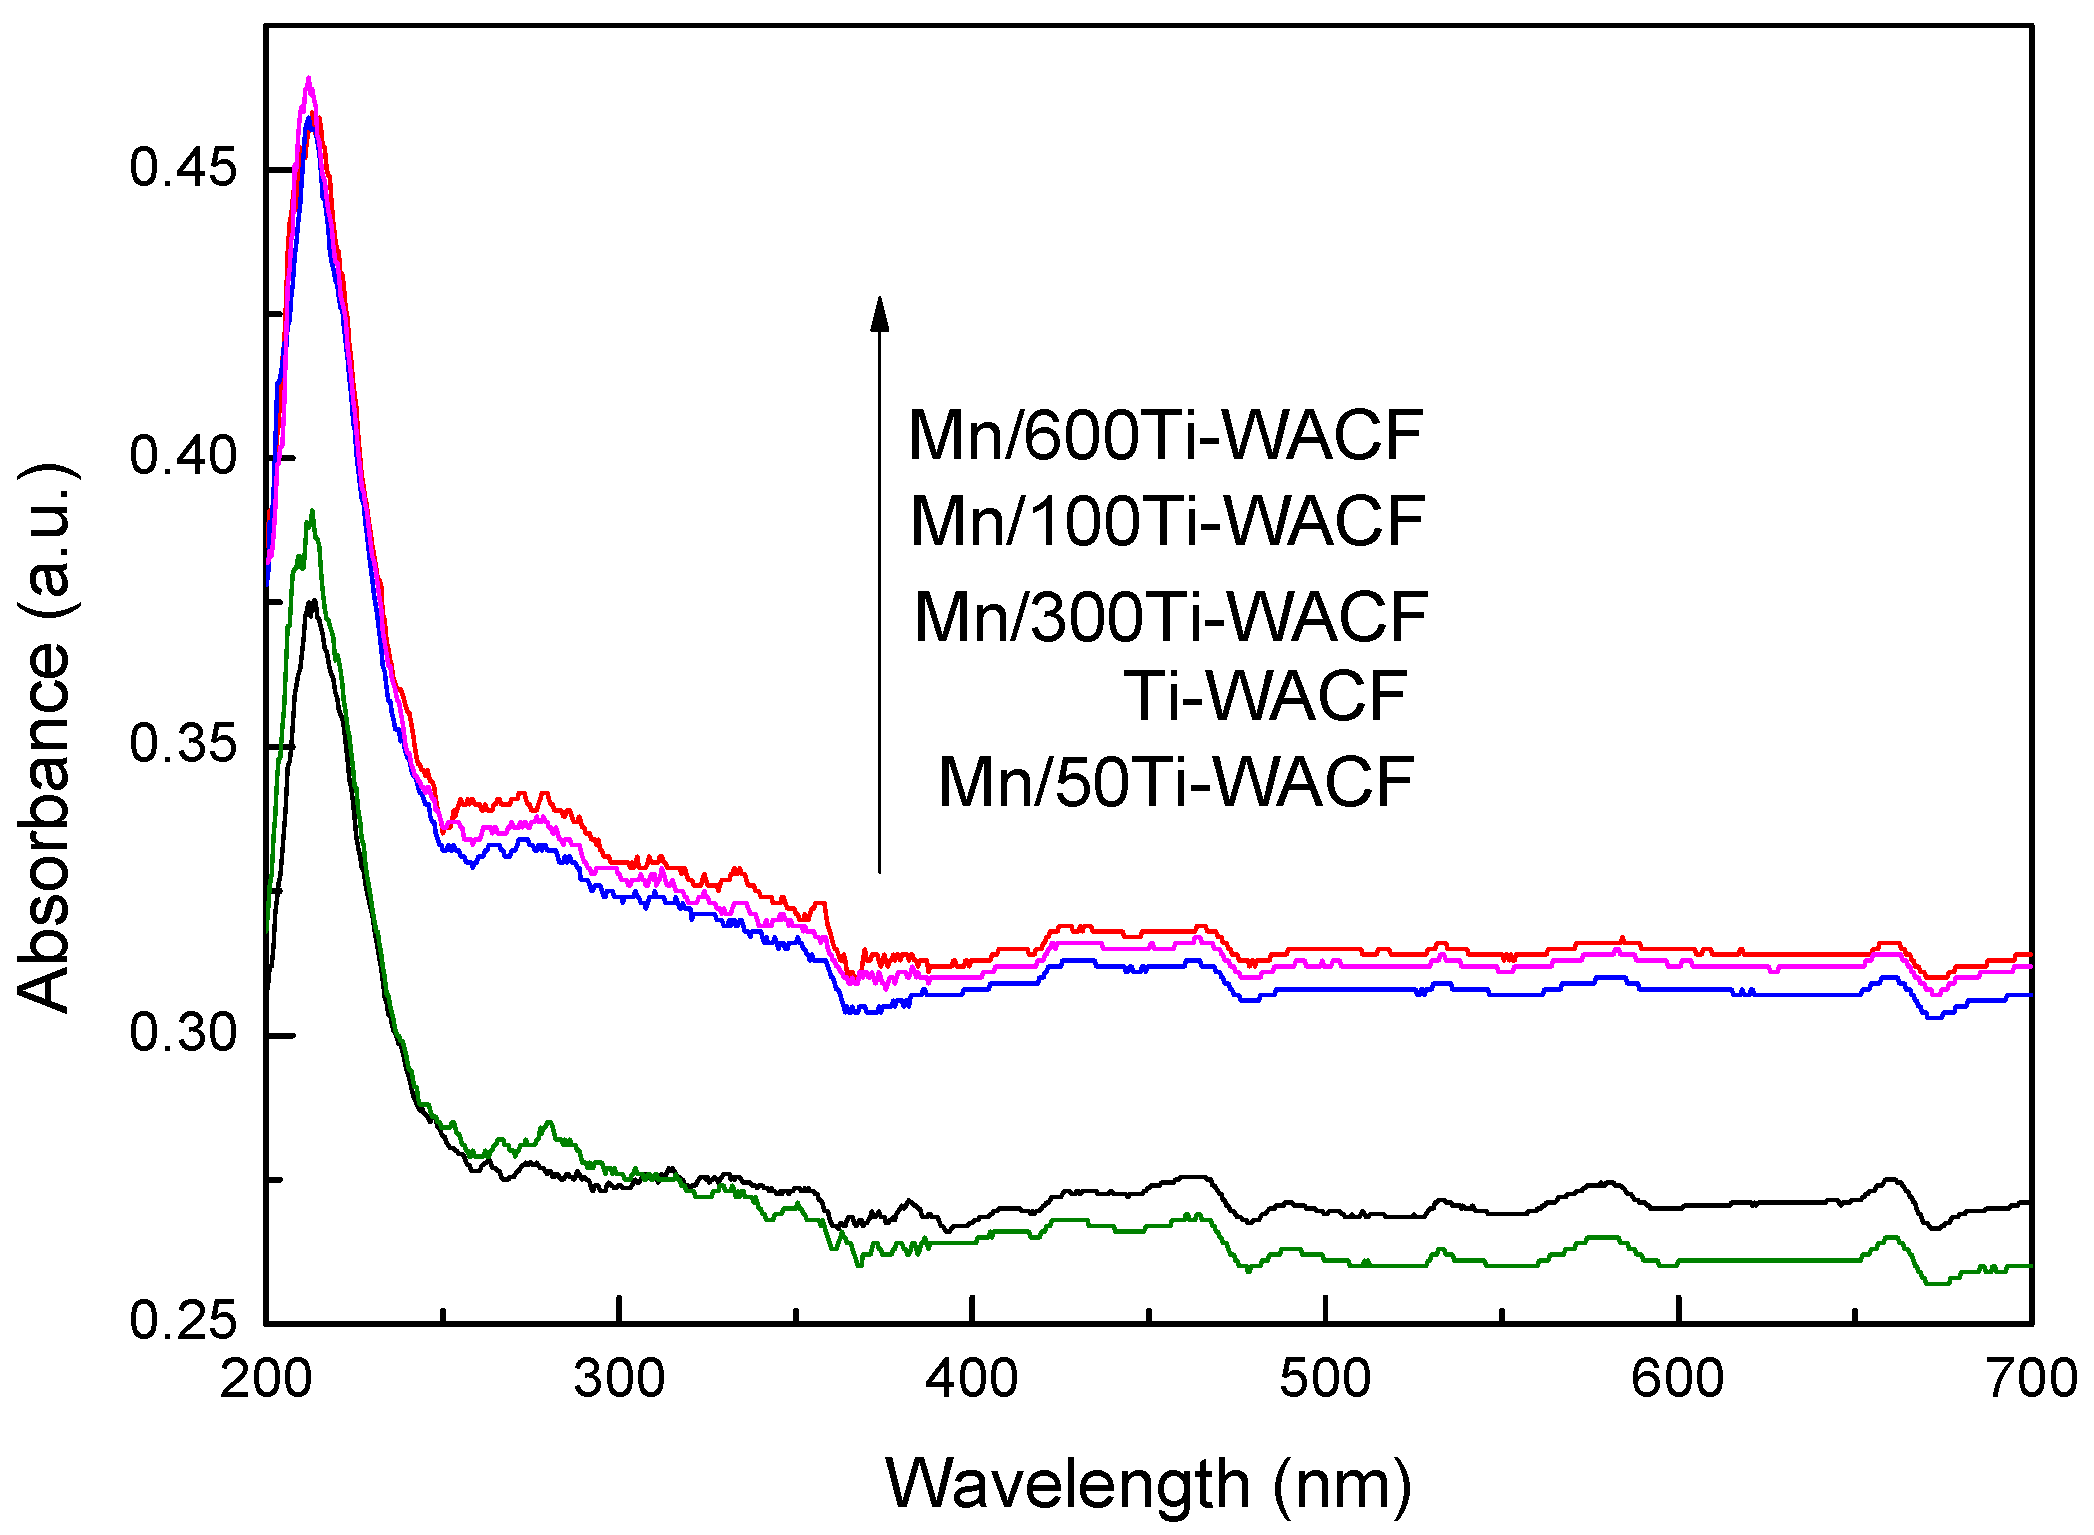
The UV–Vis spectral absorption curve of loaded materials with different Mn doping concentrations is shown in Figure 6. In the visible light region, the absorption difference of TiO2 material was not significant with different Mn:Ti molar ratios, i.e., 1:600, 1:300, and 1:100; these results are mainly due to the fact that the actual amount of Mn ions added was similar yet had greatly increased in comparison with pure TiO2-loaded materials (the maximum improvement was Mn/600Ti–WACF material). This finding indicated that Mn doping can change the light absorption properties of TiO2, and also showed that the effect of Mn doping was not affected by the loading process and the carrier fibers [28]. The visible light absorbance of Mn and Ti molar ratio of 1:50 was slightly lower than that of pure TiO2, while the Mn doping amount was excessive and some of the impurity levels provided the chance of electron–hole pairing in the photocatalytic reaction.
3.6. Visible Photodegradation of Methylene Blue Solution
The visible light degradation curves of MB solution with varying illumination time are shown in Figure 7. The Figure 7 shows that the degradation rate of the loading material increased with the prolongation of the illumination time, and the degradation effect of the Mn-doped sample was better than that of pure TiO2. The degradation of Mn/600Ti–WACF samples was the most satisfactory, which was up to 96%, and 73% higher than that of TiO2. With the increase of Mn doping concentration, the adsorption effect of the initial stage was enhanced, and the photocatalytic effect at later stage is enhanced; thus, Mn doping can improve the adsorption performance of the TiO2-loaded material in the liquid environment and the concentration of target contaminants around the photocatalytic material, providing favorable conditions for subsequent photodegradation ranges.
4. Conclusions
Mn-doped TiO2 loaded on WACF (Mn/TiO2–WACF) was prepared by sol–gel and impregnation method. The particle sizes of TiO2 in Mn/TiO2–WACF ranged from 25.4 to 27.8 nm, and were smaller than that of the undoped samples. With the increase of Mn doping content, Ti–O bending vibration intensity of Mn/TiO2–WACF increased and then decreased. Moreover, Ti–O–Ti and Ti–O–Mn absorption peaks increased because of the doped Mn. The surface area and pore volume of Mn/TiO2–WACF were as high as 1239 m2/g and 0.628 cm3/g, respectively. In addition, Mn/TiO2–WACF can reach the highest photodegradation rate of 96% on MB under visible-light irradiation, which is higher by 73% than that of WACF loaded with TiO2. Mn/TiO2–WACF possesses relatively strong absorbency and photocatalytic activity after Mn doping.
Acknowledgments
This work was supported by the National Natural Science Foundation of China (No. 31270607).
Author Contributions
Xiaojun Ma conceived and designed the experiments; Yin Chen and Wanru Zhou performed the experiments and analyzed the data; Xiaojun Ma and Wanru Zhou wrote the paper.
Conflicts of Interest
The authors declare no conflict of interest.
References
- Chou, C.S.; Guo, M.G.; Liu, K.H.; Chen, Y.S. Preparation of TiO2 particles and their applications in the light scattering layer of a dye-sensitized solar cell. Appl. Energy 2012, 92, 224–233. [Google Scholar] [CrossRef]
- Inagaki, M.; Hirose, Y.; Matsunaga, T.; Tsumura, T.; Toyoda, M. Carbon coatings of anatase-type TiO2 through their precipitation in PVA aqueous solution. Carbon 2003, 4, 2619–2624. [Google Scholar] [CrossRef]
- Rodrigues, S.; Ranjit, K.T.; Uma, S.; Martyanov, I.N.; Klabunde, K.J. Single-step synthesis of a highly active visible-light photocatalyst for oxidation of a common indoor air pollutant: Acetaldehyde. Adv. Mater. 2005, 17, 2467–2471. [Google Scholar] [CrossRef]
- Mills, A.; Elliott, N.; Hill, G.; Fallis, D.; Durrant, J.R.; Willis, R.L. Preparation and characterization of novel thick sol–gel titania film photocatalysts. Photochem. Photobiol. Sci. 2003, 2, 591–596. [Google Scholar] [CrossRef] [PubMed]
- Kudo, A.; Omori, K.; Kato, H. A novel aqueous process for preparation of crystal form-controlled and highly crystalline BiVO4 powder from layered vanadates at room temperature and its photocatalytic and photophysical properties. J. Am. Chem. Soc. 1999, 121, 11459–11467. [Google Scholar] [CrossRef]
- Dong, M.J.; In, H.K.; El, L.K.; Chan, S.J.; Hyung, S.L.; Kidong, P.; Jeunghee, P. Transition-Metal doping of oxide nanocrystals for enhanced catalytic oxygen evolution. J. Phys. Chem. C 2015, 119, 1921–1927. [Google Scholar]
- Muggli, D.S.; Ding, L.F. Photocatalytic performance of sulfated TiO2 and Degussa P-25 TiO2 during oxidation of organics. Appl. Catal. B Environ. 2001, 32, 181–194. [Google Scholar] [CrossRef]
- Zhao, W.X.; Bai, Z.P.; Ren, A.L.; Guo, B.; Wu, C. Sunlight photocatalytic activity of CdS modified TiO2 loaded on activated carbon fibers. Appl. Surf. Sci. 2010, 256, 3493–3498. [Google Scholar] [CrossRef]
- Onsuratoom, S.; Chavadej, S.; Screethawong, T. Hydrogen production from water splitting under UV light irradiation over Ag-loaded mesoporous-assembled TiO2-ZrO2 mixed oxide nanocrystal photocatalysts. Int. J. Hydrog. Energy 2011, 36, 5246–5261. [Google Scholar] [CrossRef]
- Wang, Y.D.; Chen, T.; Mu, Q.Y. Electrochemical performance of W-doped anatase TiO2 nanoparticles as an electrode material for lithium-ion batteries. J. Mater. Chem. 2011, 21, 6006–6013. [Google Scholar] [CrossRef]
- Choi, W.; Termin, A.; Hoffmann, M.R. The role of metal-ion dopants in quantum-sized TiO2: Correlation between photoreactivity and charge carrier recombination dynamics. J. Phys. Chem. 1994, 98, 13669–13679. [Google Scholar] [CrossRef]
- Xin, B.F.; Ren, Z.Y.; Wang, P.; Liu, J.; Jing, L.Q.; Fu, H.G. Study on the mechanisms of photoinduced carriers separation and recombination for Fe3+–TiO2 photocatalysts. Appl. Surf. Sci. 2007, 253, 4390–4395. [Google Scholar] [CrossRef]
- Cao, J.L.; Wu, Z.C.; Cao, F.H.; Zhang, J.Q. Cathodic Coelectro deposition of Fe3+-doped TiO2 thin films and their photocatalytic activity under visible light. J. Inorg. Mater. 2007, 22, 514–518. [Google Scholar]
- Van Grieken, R.; Marugan, J.; Sordo, C.; Martinez, P.; Pablos, C. Photocatalytic inactivation of bacteria in water using suspended and immobilized silver-TiO2. Appl. Catal. B Environ. 2009, 93, 112–118. [Google Scholar] [CrossRef]
- Ko, S. Photochemical synthesis, characterization and enhanced visible light induced photocatalysis of Ag Modified TiO2 Nanocatalyst. J. Nanosci. Nanotechnol. 2014, 14, 6293–6298. [Google Scholar] [CrossRef]
- Dholam, R.; Patel, N.; Adami, M.; Miotello, A. Hydrogen production by photocatalytic water-splitting using Cr- or Fe-doped TiO2 composite thin films photocatalys. Int. J. Hydrog. Energy 2009, 34, 5337–5346. [Google Scholar] [CrossRef]
- Osei, P.B.; Lu, X.M.; Xie, J.M.; Jiang, D.L.; Chen, M.; Wei, X.J. Synthesis, characterisation and application of copper modyfied brookite titania photocatalyst activated by visible light. J. Nanosci. Nanotechnol. 2014, 14, 7045–7053. [Google Scholar] [CrossRef] [PubMed]
- Choi, A.Y.; Han, C.H. A study on the band gap and the doping level of V-doped TiO2 with respect to the visible-light photocatalytic activity. J. Nanosci. Nanotechnol. 2014, 14, 8070–8073. [Google Scholar] [CrossRef] [PubMed]
- Ma, X.; Zhang, F.; Zhu, J.; Yu, L.; Liu, X. Preparation of highly developed mesoporous activated carbon fiber from liquefied wood using wood charcoal as additive and its adsorption of methylene blue from solution. Bioresour. Technol. 2014, 164, 1–6. [Google Scholar] [CrossRef] [PubMed]
- Liu, X.; Ma, X.; Zhu, L.; Li, D. Photocatalysis, microstructure and surface characterization of TiO2 loaded wooden activated carbon fibers. Polym. Compos. 2015, 36, 62–68. [Google Scholar] [CrossRef]
- Li, D.; Ma, X.; Liu, X.; Yu, L. Preparation and characterization of Nano-TiO2 loaded bamboo-based activated carbon fibers by H2O activation. BioResources 2014, 9, 602–612. [Google Scholar] [CrossRef]
- Liu, W.; Zhao, G. Effect of TiO2 content on the microstructure and antibacterial activity of TiO2-loaded activated carbon fibers derived from liquefied wood. Surf. Interface Anal. 2015, 47, 931–937. [Google Scholar] [CrossRef]
- Mo, D.Q.; Ye, D.Q. Surface study of composite photocatalyst based on plasma modified activated carbon fibers with TiO2. Surf. Coat. Technol. 2009, 203, 1154–1160. [Google Scholar] [CrossRef]
- Ma, X.; Yang, H.; Yu, L.; Chen, Y.; Li, Y. Preparation, surface and pore structure of high surface area activated carbon fibers from bamboo by steam activation. Materials 2014, 7, 4431–4441. [Google Scholar] [CrossRef]
- Momeni, M.M.; Hakimian, M.; Kazempour, A. Preparation and characterisation of manganese-TiO2 nanocomposites for solar water splitting. Surf. Eng. 2016, 32, 514–519. [Google Scholar] [CrossRef]
- Shu, Y.; Hyun-il, K.; Won-Chun, O. Quantitative photocatalytic activity under visible light with Mn-ACF/TiO2. J. Korean Ceram. Soc. 2016, 53, 343–348. [Google Scholar]
- Jensen, H.; Soloviev, A.; Li, Z.; Sogaard, E.G. XPS and FTIR investigation of the surface properties of different prepared titania nano-powders. Appl. Surf. Sci. 2005, 236, 239–249. [Google Scholar] [CrossRef]
- Binas, V.D.; Sambani, K.; Maggos, T.; Katsanaki, A.; Kiriakidis, G. Synthesis and photocatalytic activity of Mn-doped TiO2 nanostructured powders under UV and visible light. Appl. Catal. B Environ. 2012, 113, 79–86. [Google Scholar] [CrossRef]
Figure 1.
Scanning electron micrographies of the surface of wood-based activated carbon fiber (WACF) (a,b) and Mn/TiO2–WACF (c,d).
Figure 1.
Scanning electron micrographies of the surface of wood-based activated carbon fiber (WACF) (a,b) and Mn/TiO2–WACF (c,d).

Figure 2.
XRD diffractograms of loaded materials with different Mn doping concentrations.

Figure 3.
FTIR spectra of Mn/TiO2–WACF samples with different Mn doping concentrations.

Figure 4.
N2 adsorption/desorption isotherm of WACF and Mn/TiO2–WACF samples.

Figure 5.
Pore size distribution (density functional theory method) of WACF and Mn/TiO2–WACF.

Figure 6.
UV–Vis spectra of loaded materials with different Mn doping concentrations.

Figure 7.
Degradation curve chart of methylene blue by samples with different Mn-doping concentrations under visible lights.
Figure 7.
Degradation curve chart of methylene blue by samples with different Mn-doping concentrations under visible lights.


Table 1.
Average crystallite size of nano-TiO2 doped with different Mn doping concentrations.
| Samples | Ti–WACF | Mn/600Ti–WACF | Mn/300Ti–WACF | Mn/100Ti–WACF | Mn/50Ti–WACF |
|---|---|---|---|---|---|
| Average crystallite size | 36.4 | 25.4 | 26.6 | 27.8 | 27.5 |
Table 2.
Specific surface area, pore volume, and aperture parameters of WACF and Mn/TiO2–WACF.
| Sample | SBET | Smicro | Smeso | Vtot | Vmicro | Vmeso | PMic a | PMe b | D c |
|---|---|---|---|---|---|---|---|---|---|
| (m2/g) | (m2/g) | (m2/g) | (cm3/g) | (cm3/g) | (cm3/g) | (%) | (%) | (nm) | |
| WACF | 1802 | 1272 | 530 | 0.875 | 0.581 | 0.294 | 66.4 | 33.6 | 1.94 |
| Ti–WACF | 1418 | 852 | 408 | 0.710 | 0.384 | 0.272 | 54.1 | 38.3 | 2.00 |
| Mn/600Ti–WACF | 1160 | 764 | 309 | 0.602 | 0.348 | 0.230 | 57.8 | 38.2 | 2.08 |
| Mn/300Ti–WACF | 980 | 691 | 205 | 0.477 | 0.317 | 0.137 | 66.5 | 28.7 | 1.95 |
| Mn/100Ti–WACF | 1239 | 803 | 322 | 0.628 | 0.364 | 0.230 | 58.0 | 36.6 | 2.03 |
| Mn/50Ti–WACF | 966 | 624 | 342 | 0.556 | 0.284 | 0.272 | 51.1 | 48.9 | 2.03 |
a Ratio of the micropore volume to the total pore volume; b Ratio of the mesopore volume to the total pore volume; c Average pore diameter.
© 2017 by the authors. Licensee MDPI, Basel, Switzerland. This article is an open access article distributed under the terms and conditions of the Creative Commons Attribution (CC BY) license (http://creativecommons.org/licenses/by/4.0/).
Share and Cite
MDPI and ACS Style
Ma, X.; Zhou, W.; Chen, Y. Structure and Photocatalytic Properties of Mn-Doped TiO2 Loaded on Wood-Based Activated Carbon Fiber Composites. Materials 2017, 10, 631. https://doi.org/10.3390/ma10060631
AMA Style
Ma X, Zhou W, Chen Y. Structure and Photocatalytic Properties of Mn-Doped TiO2 Loaded on Wood-Based Activated Carbon Fiber Composites. Materials. 2017; 10(6):631. https://doi.org/10.3390/ma10060631
Chicago/Turabian StyleMa, Xiaojun, Wanru Zhou, and Yin Chen. 2017. "Structure and Photocatalytic Properties of Mn-Doped TiO2 Loaded on Wood-Based Activated Carbon Fiber Composites" Materials 10, no. 6: 631. https://doi.org/10.3390/ma10060631
Note that from the first issue of 2016, this journal uses article numbers instead of page numbers. See further details here.