Effects of Physical and Chemical States of Iron-Based Catalysts on Formation of Carbon-Encapsulated Iron Nanoparticles from Kraft Lignin


Abstract
: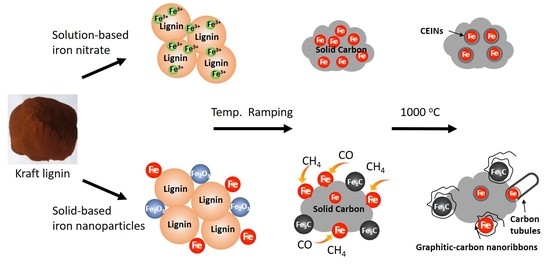
1. Introduction
2. Materials and Methods
2.1. Materials
2.2. Precursors Preparation
2.3. Thermal Treatment
2.4. Characterization
3. Results
3.1. Raw Materials and Precursors
3.1.1. FTIR
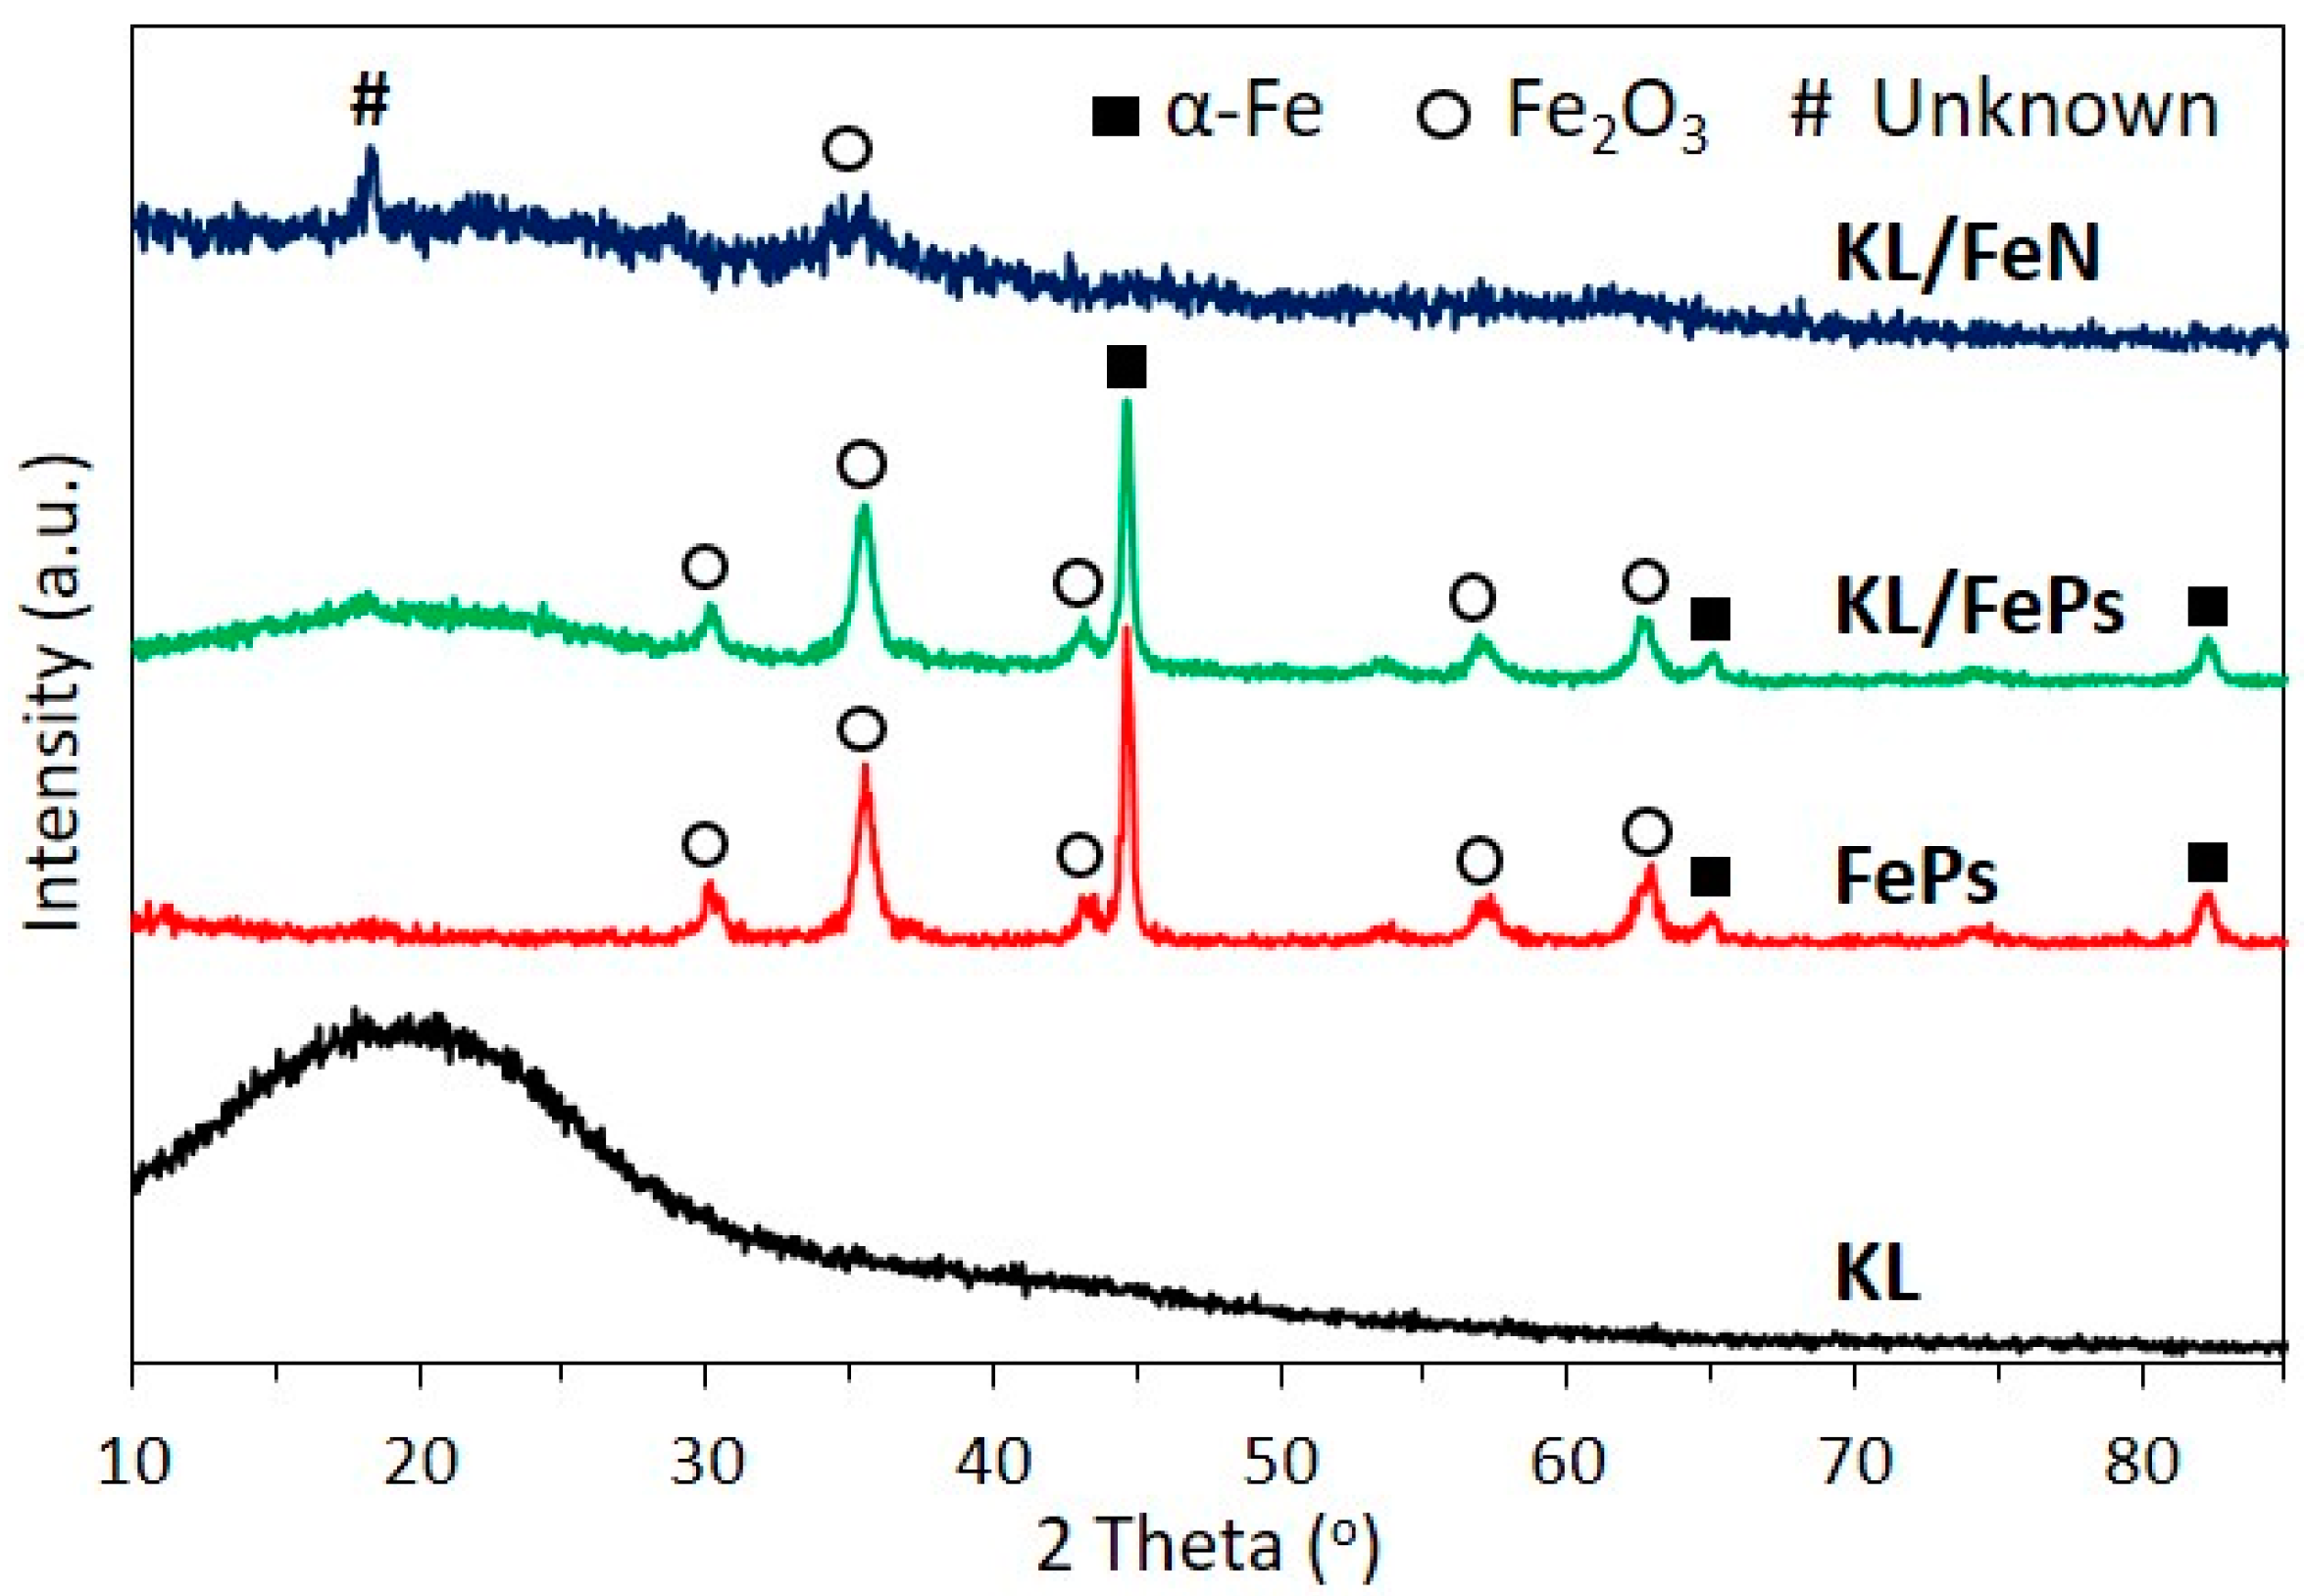
3.1.2. XRD
3.2. Thermally Treated Samples
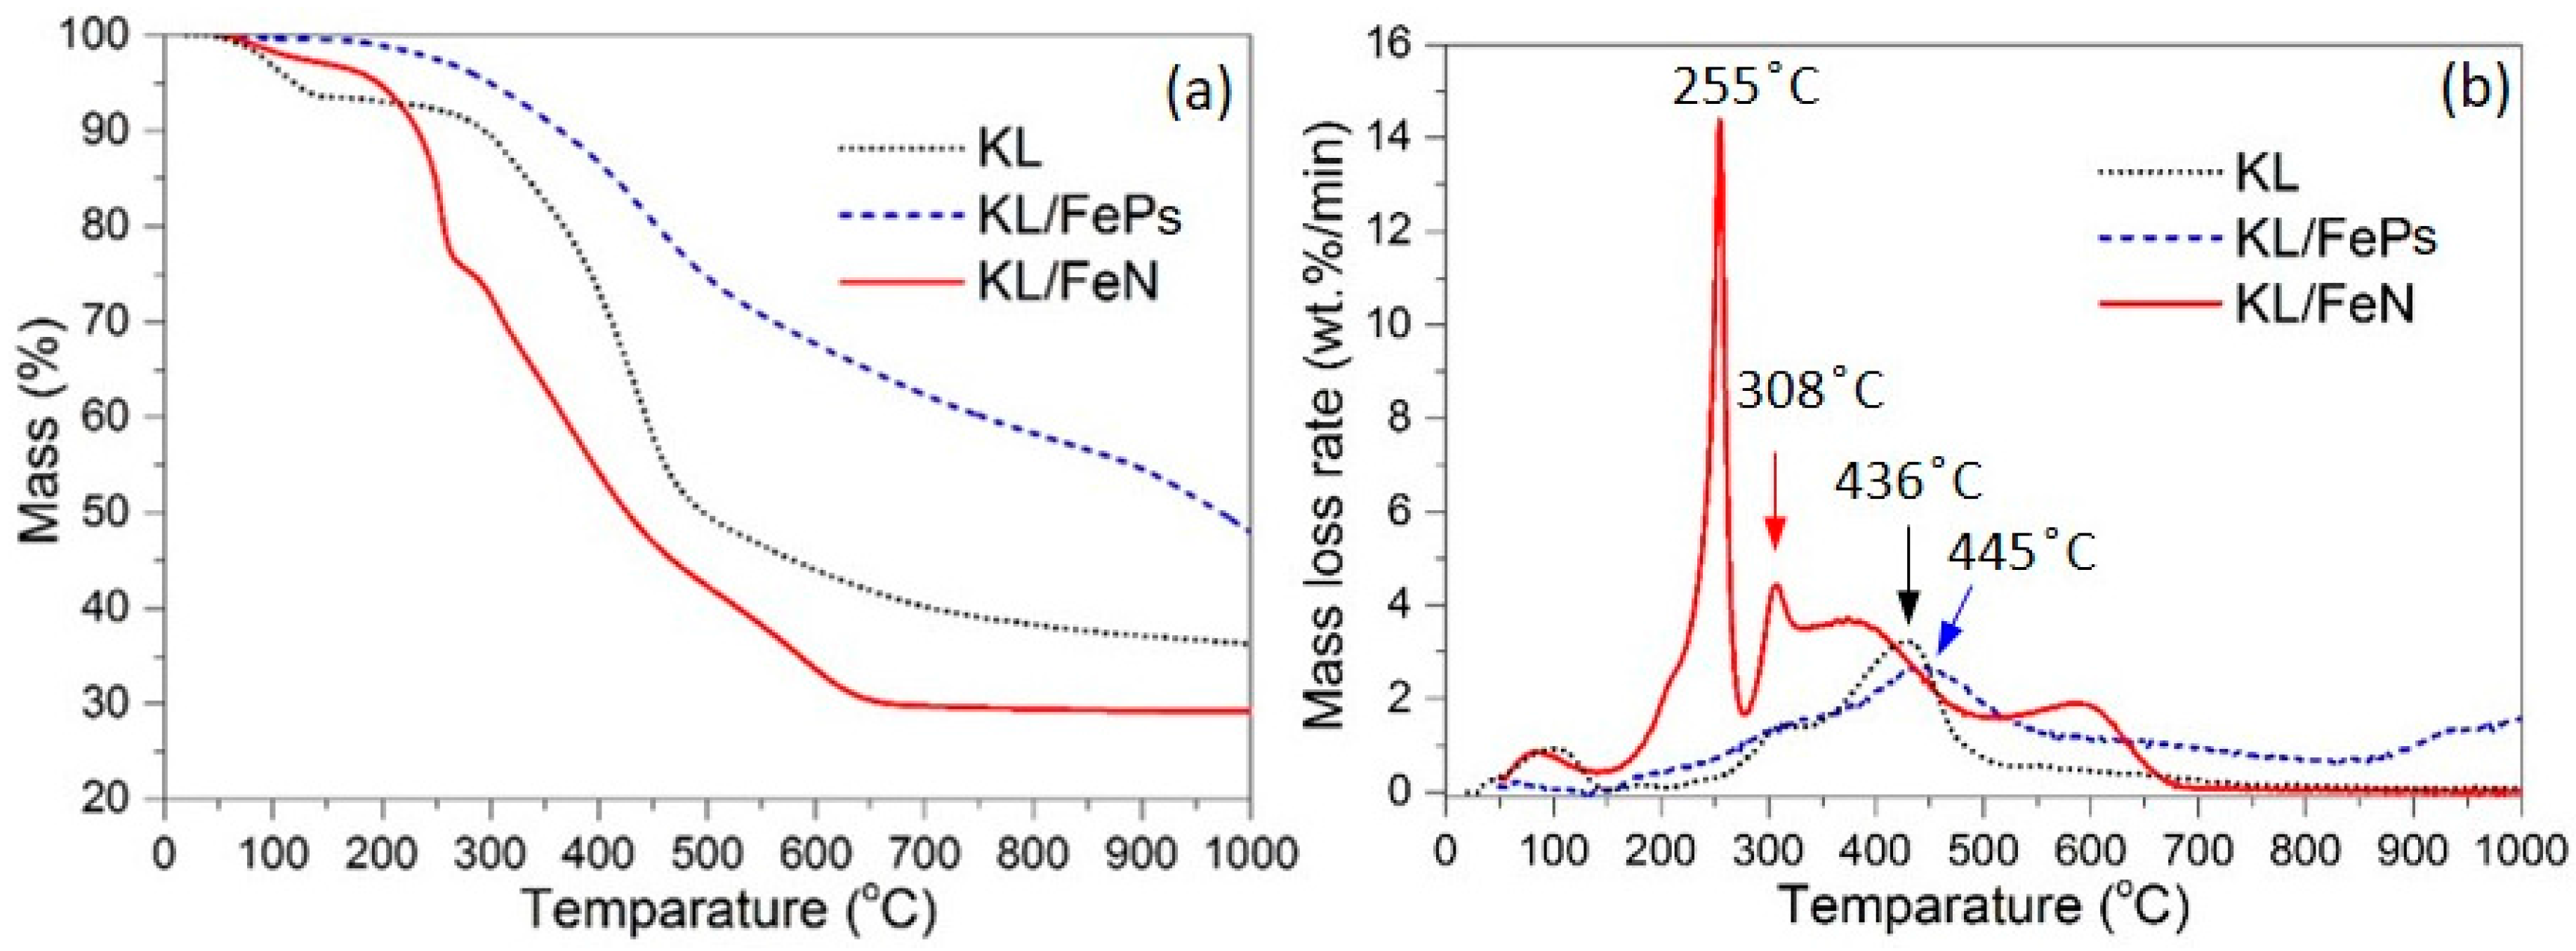
3.2.1. Thermal Treatment Yield and TG Analyses
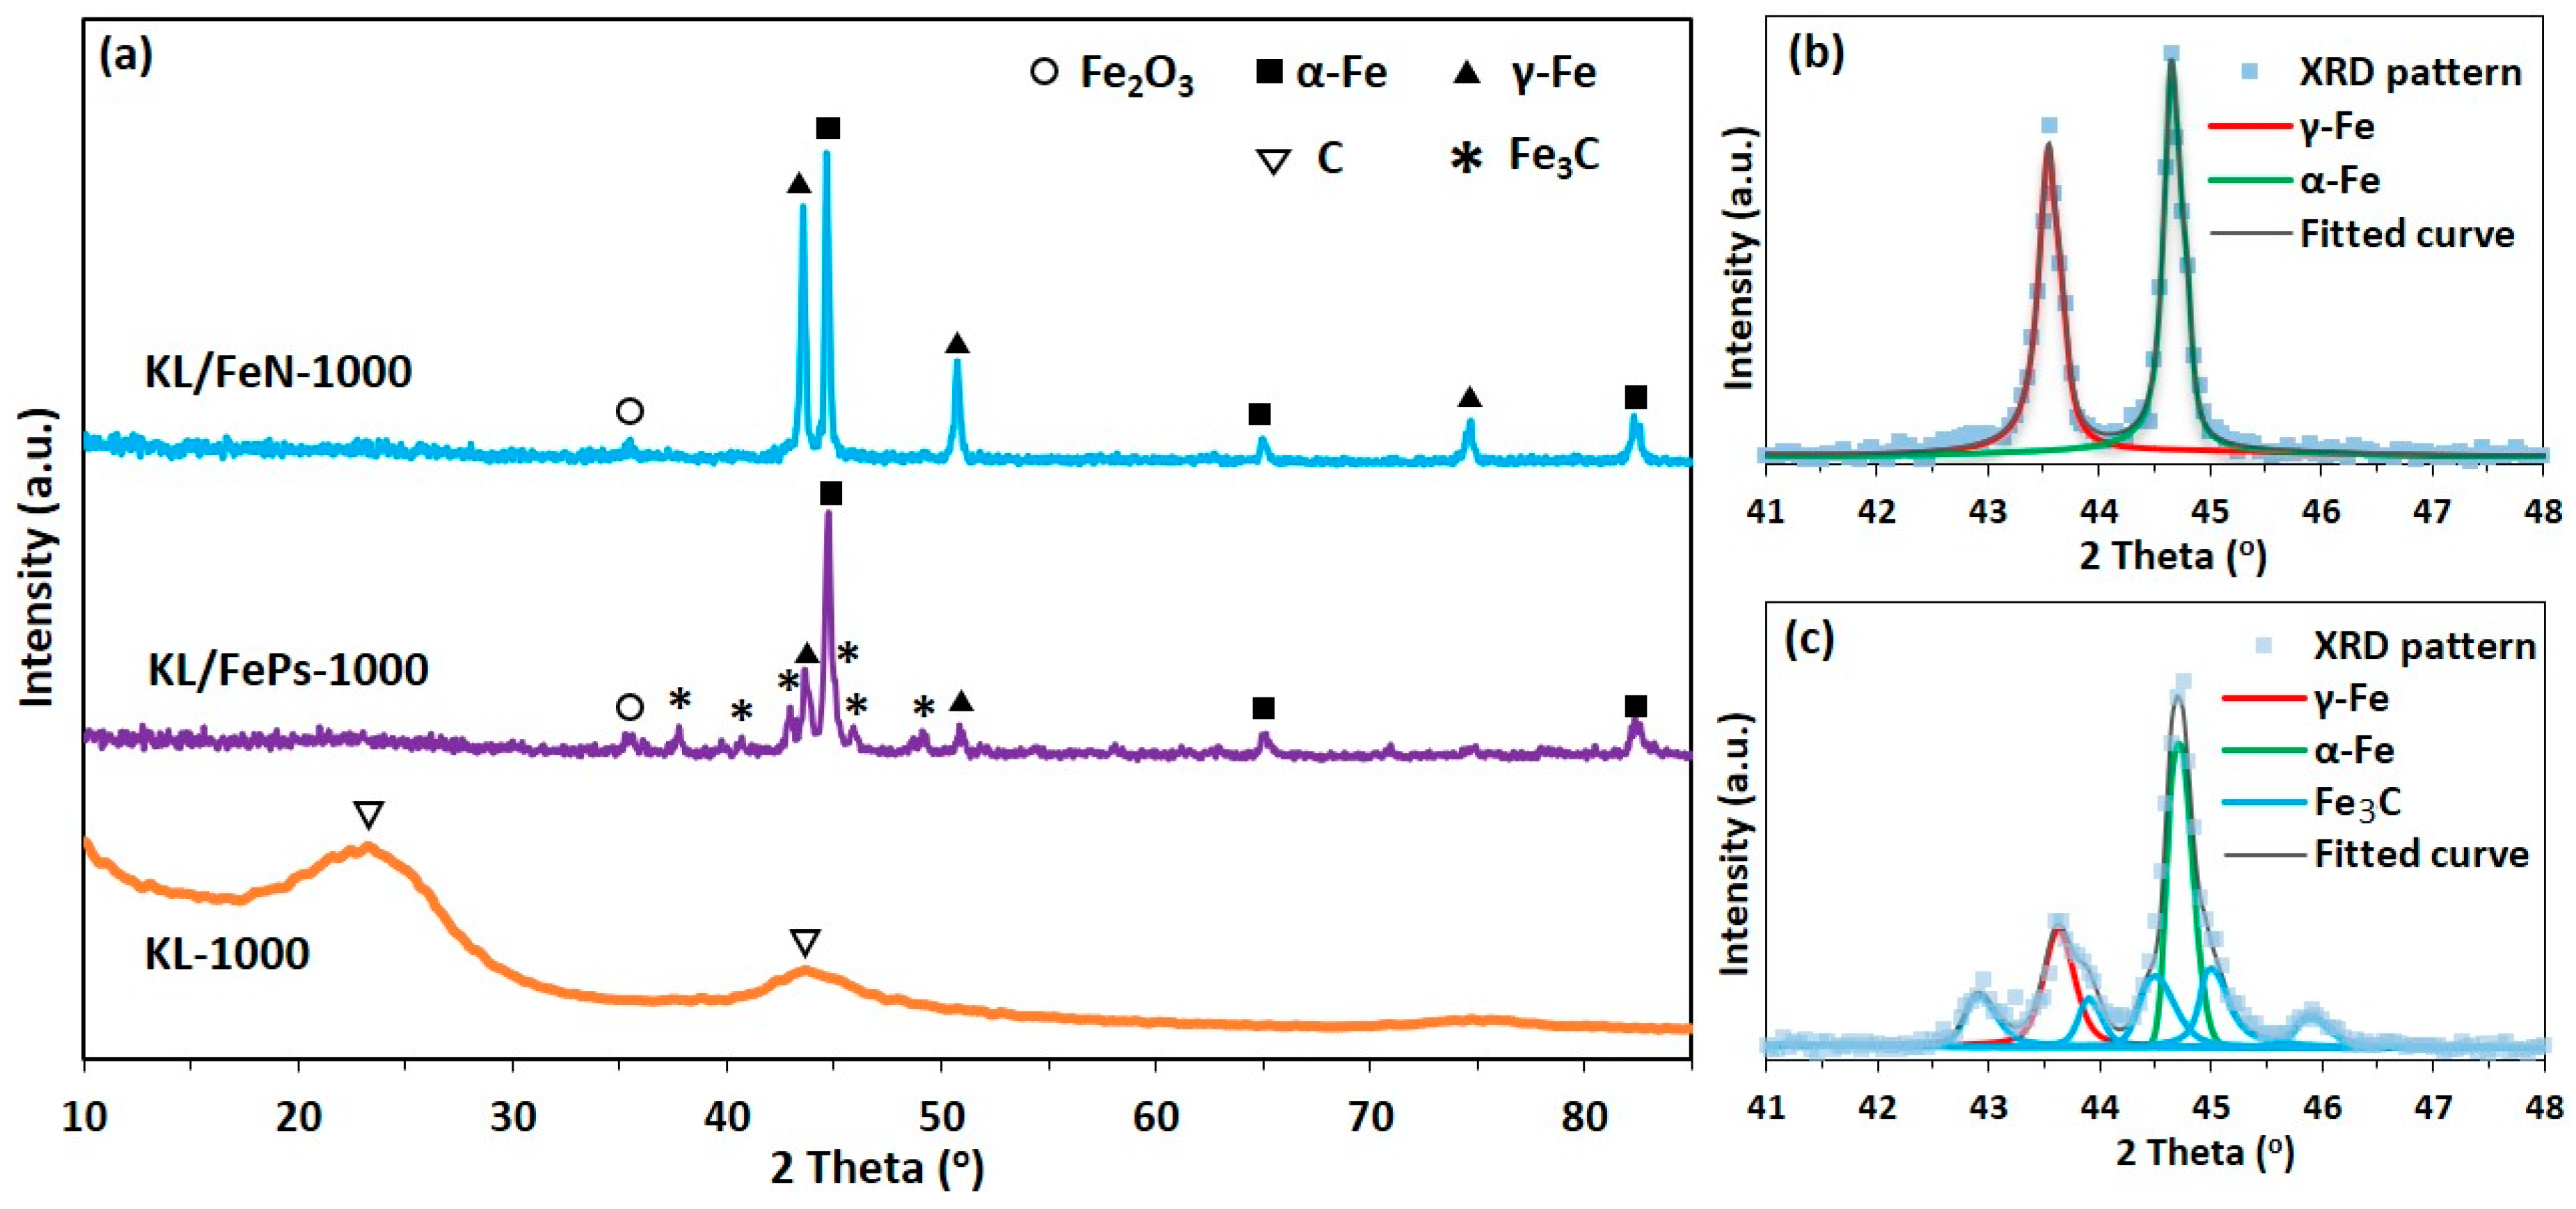
3.2.2. XRD
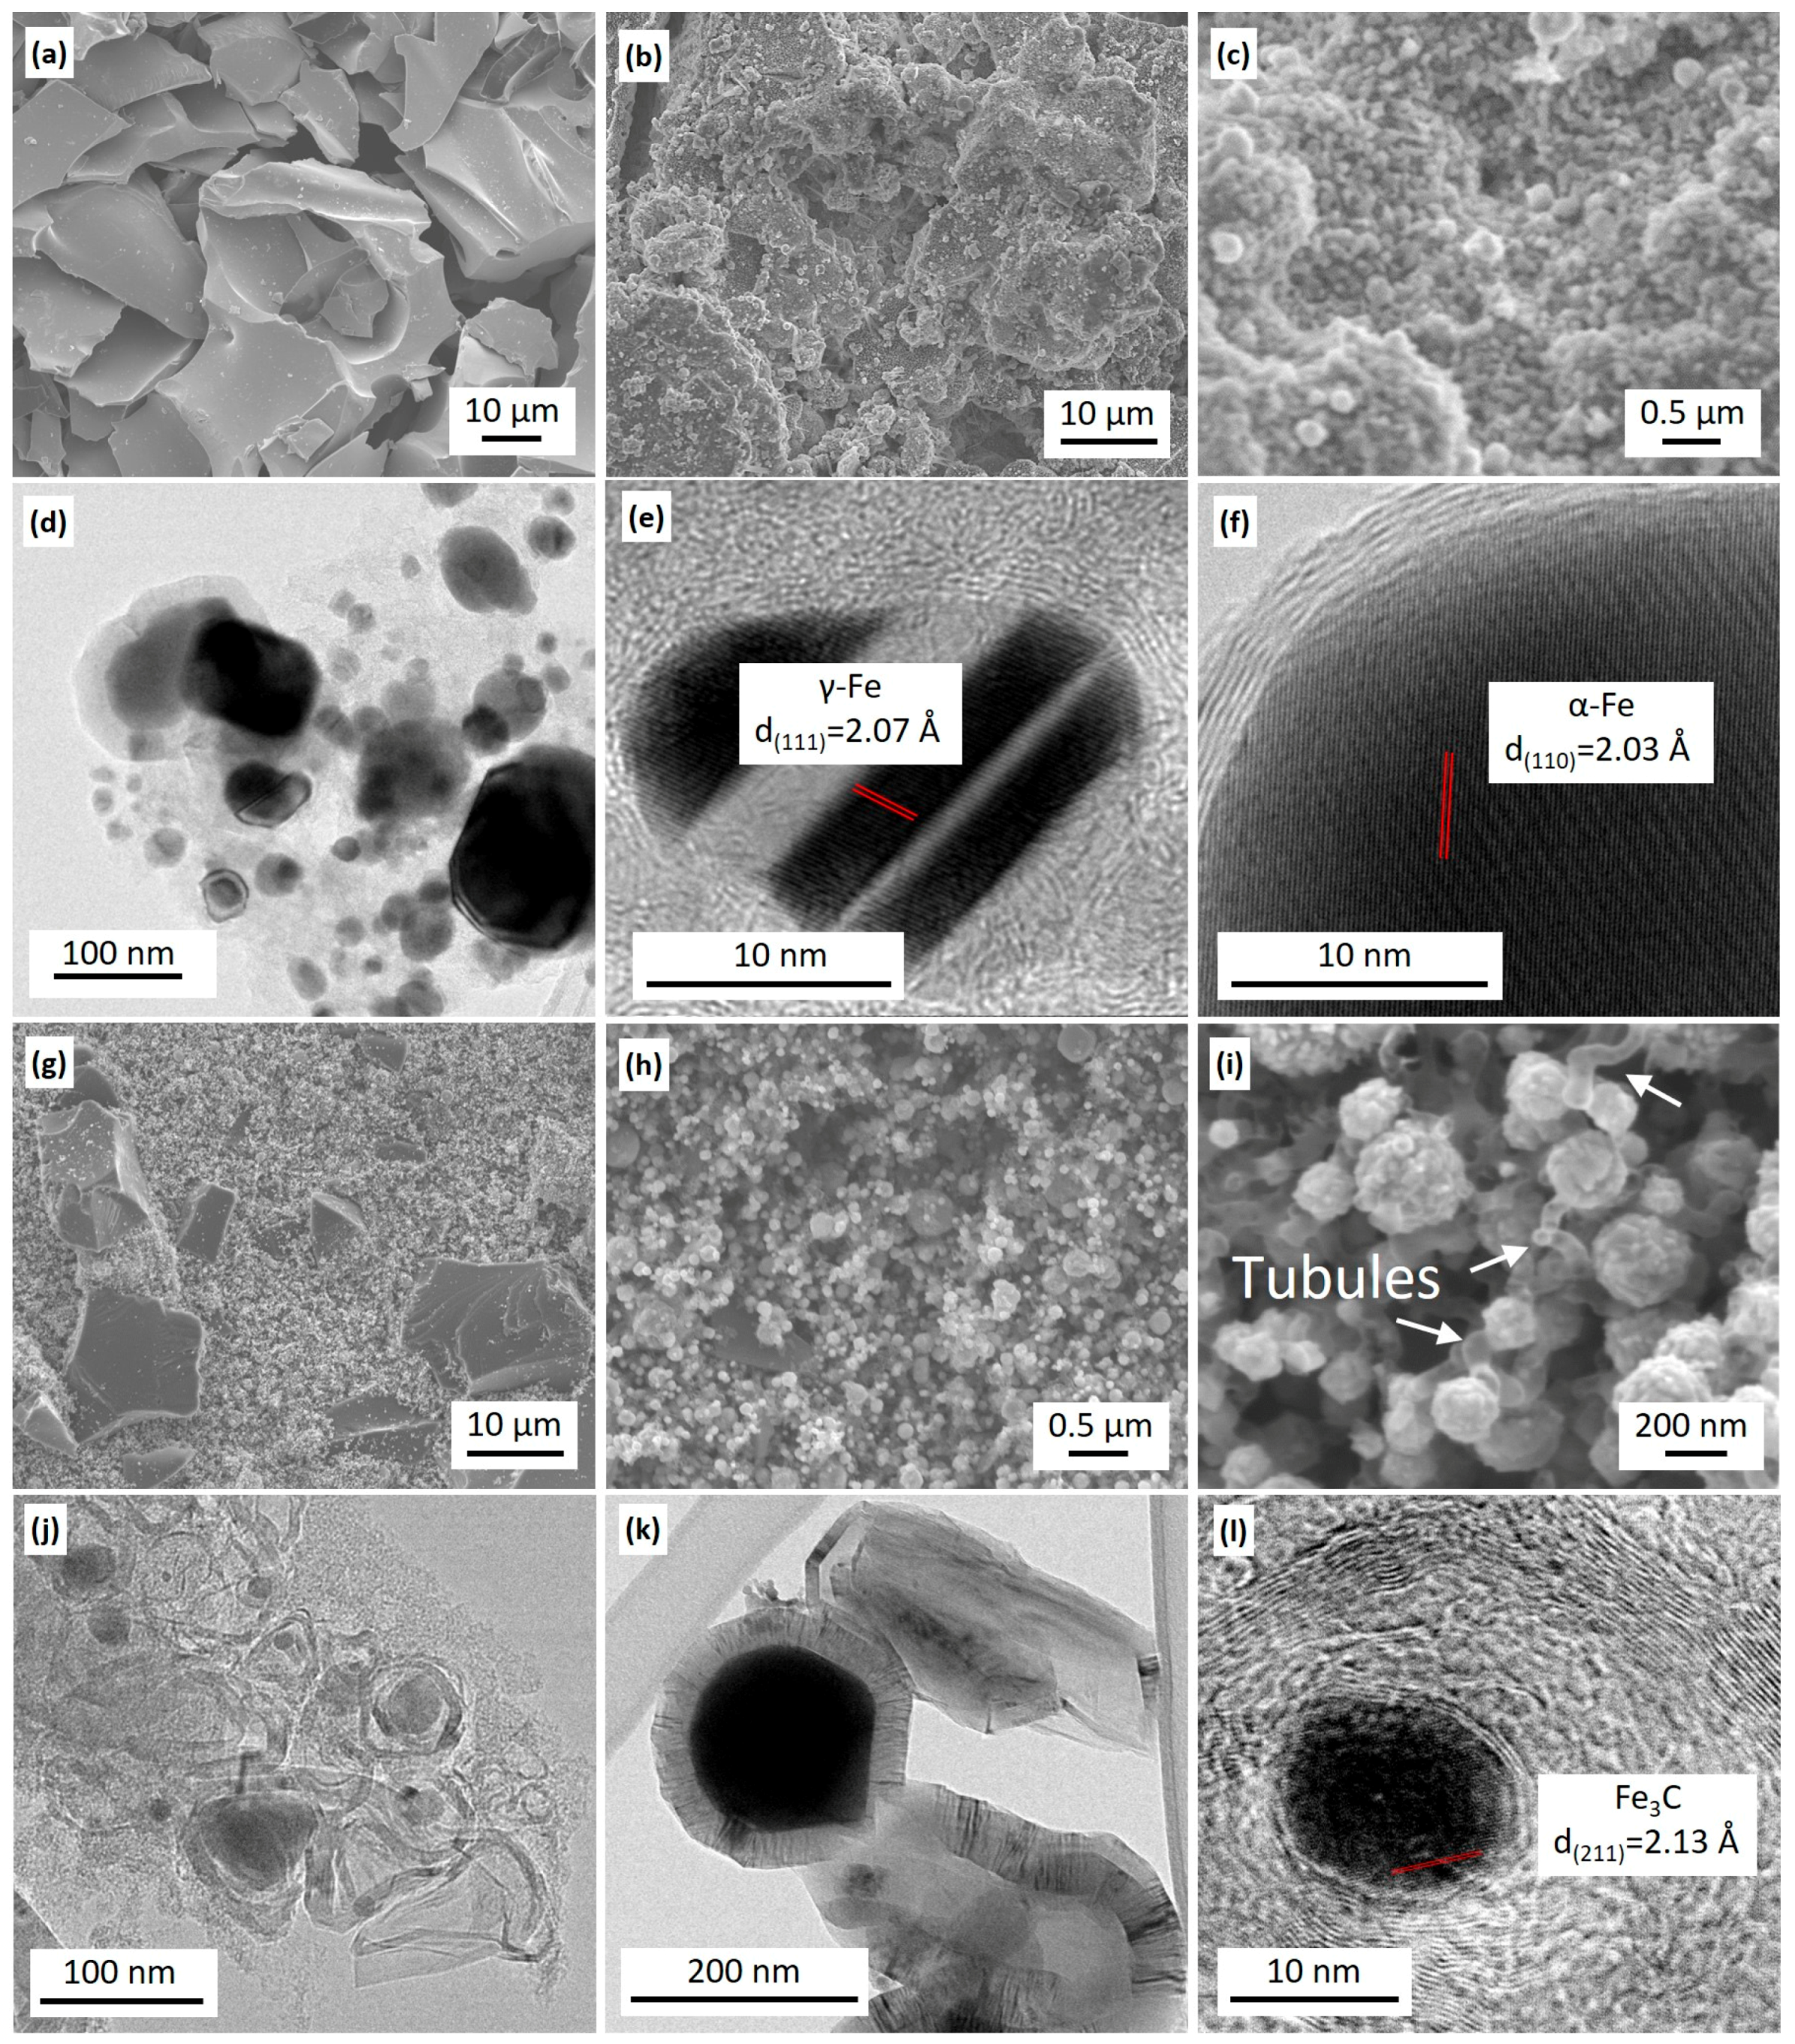
3.2.3. SEM and HRTEM
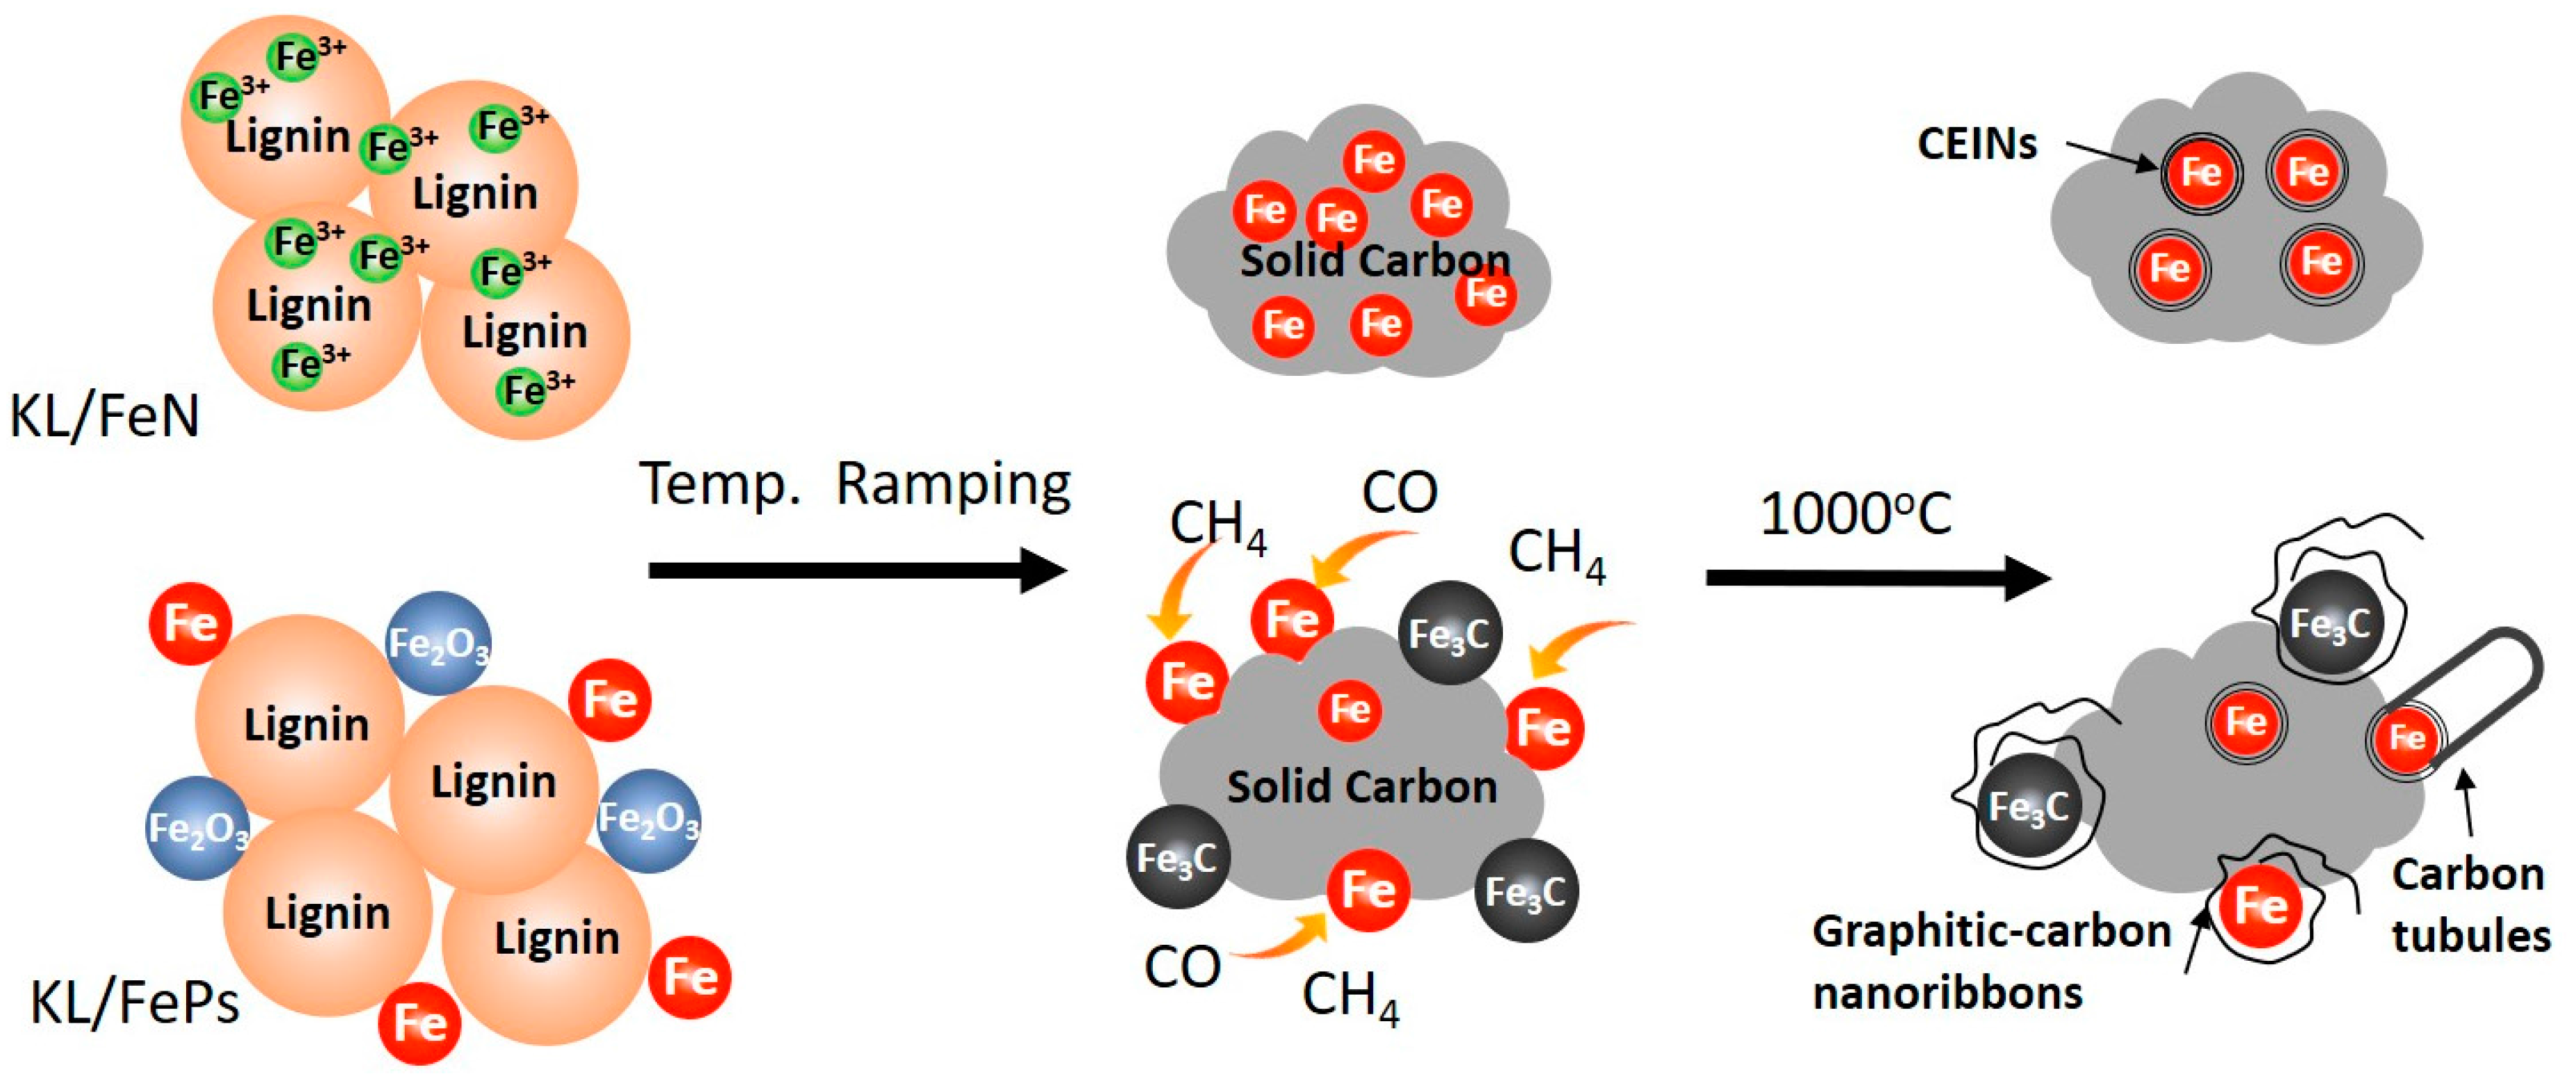
4. Discussion
5. Conclusions
Supplementary Materials
Acknowledgments
Author Contributions
Conflicts of Interest
References
- Zhang, X.; Yan, Q.; Hassan, E.B.; Li, J.; Cai, Z.; Zhang, J. Temperature effects on formation of carbon-based nanomaterials from kraft lignin. Mater. Lett. 2017, 203, 42–45. [Google Scholar] [CrossRef]
- Zhang, X.; Yan, Q.; Leng, W.; Li, J.; Zhang, J.; Cai, Z.; Hassan, E.B. Carbon nanostructure of kraft lignin thermally treated at 500 to 1000 °C. Materials 2017, 10, 975. [Google Scholar] [CrossRef] [PubMed]
- Kasprzak, A.; Bystrzejewski, M.; Koszytkowska-Stawinska, M.; Poplawska, M. Grinding-induced functionalization of carbon-encapsulated iron nanoparticles. Green Chem. 2017, 19, 3510–3514. [Google Scholar] [CrossRef]
- Bystrzejewski, M. Synthesis of carbon-encapsulated iron nanoparticles via solid state reduction of iron oxide nanoparticles. J. Solid State Chem. 2011, 184, 1492–1498. [Google Scholar] [CrossRef]
- Luo, N.; Li, X.-J.; Wang, X.-H.; Mo, F.; Wang, H.-T. Synthesis of carbon-encapsulated metal nanoparticles by a detonation method. Combust. Explos. Shock Waves 2010, 46, 609–613. [Google Scholar] [CrossRef]
- Park, J.B.; Jeong, S.H.; Jeong, M.S.; Kim, J.Y.; Cho, B.K. Synthesis of carbon-encapsulated magnetic nanoparticles by pulsed laser irradiation of solution. Carbon 2008, 46, 1369–1377. [Google Scholar] [CrossRef]
- Herrmann, I.K.; Grass, R.N.; Mazunin, D.; Stark, W.J. Synthesis and covalent surface functionalization of nonoxidic iron core−shell nanomagnets. Chem. Mater. 2009, 21, 3275–3281. [Google Scholar] [CrossRef]
- Jiao, J.; Seraphin, S.; Wang, X.; Withers, J.C. Preparation and properties of ferromagnetic carbon-coated Fe, Co, and Ni nanoparticles. J. Appl. Phys. 1996, 80, 103–108. [Google Scholar] [CrossRef]
- Borysiuk, J.; Grabias, A.; Szczytko, J.; Bystrzejewski, M.; Twardowski, A.; Lange, H. Structure and magnetic properties of carbon encapsulated Fe nanoparticles obtained by arc plasma and combustion synthesis. Carbon 2008, 46, 1693–1701. [Google Scholar] [CrossRef]
- Aguiló-Aguayo, N.; Liu, Z.; Bertran, E.; Yang, J. Thermal-induced structural evolution of carbon-encapsulated iron nanoparticles generated by two different methods. J. Phys. Chem. C 2013, 117, 19167–19174. [Google Scholar] [CrossRef]
- Qin, H.; Zhou, Y.; Bai, J.; Zhu, B.; Ni, Z.; Wang, L.; Liu, W.; Zhou, Q.; Li, X. Lignin-derived thin-walled graphitic carbon-encapsulated iron nanoparticles: Growth, characterization, and applications. ACS Sustain. Chem. Eng. 2017, 5, 1917–1923. [Google Scholar] [CrossRef]
- Sevilla, M.; Sanchís, C.; Valdés-Solís, T.; Morallón, E.; Fuertes, A.B. Direct synthesis of graphitic carbon nanostructures from saccharides and their use as electrocatalytic supports. Carbon 2008, 46, 931–939. [Google Scholar] [CrossRef]
- Mun, S.P.; Cai, Z.; Zhang, J. Preparation of Fe-cored carbon nanomaterials from mountain pine beetle-killed pine wood. Mater. Lett. 2015, 142, 45–48. [Google Scholar] [CrossRef]
- Leng, W.; Barnes, H.M.; Cai, Z.; Zhang, J. Temperature and copper concentration effects on the formation of graphene-encapsulated copper nanoparticles from kraft lignin. Materials 2017, 10. [Google Scholar] [CrossRef] [PubMed]
- Thompson, E.; Danks, A.E.; Bourgeois, L.; Schnepp, Z. Iron-catalyzed graphitization of biomass. Green Chem. 2014, 17, 551–556. [Google Scholar] [CrossRef]
- Maldonado-Hódar, F.J.; Moreno-Castilla, C.; Rivera-Utrilla, J.; Hanzawa, Y.; Yamada, Y. Catalytic graphitization of carbon aerogels by transition metals. Langmuir 2000, 16, 4367–4373. [Google Scholar] [CrossRef]
- Kubo, S.; Uraki, Y.; Sano, Y. Catalytic graphitization of hardwood acetic acid lignin with nickel acetate. J. Wood Sci. 2003, 49, 188–192. [Google Scholar] [CrossRef]
- ASTM International. ASTM D1102-84(2007), Standard Test Method for Ash in Wood; ASTM International: West Conshohocken, PA, USA, 2007. [Google Scholar] [CrossRef]
- Fernandez de la Ossa, M.A.; Torre, M.; García-Ruiz, C. Nitrocellulose in propellants: Characteristics and thermal properties. In Advances in Materials Science Research; Nova Science Publishers: Hauppauge, NY, USA, 2012; Volume 7, pp. 201–220. ISBN 978-1-61209-821-0. [Google Scholar]
- Lu, J.; Qi, D.; Deng, C.; Zhang, X.; Yang, P. Hydrothermal synthesis of α-Fe2O3@SnO2 core–shell nanotubes for highly selective enrichment of phosphopeptides for mass spectrometry analysis. Nanoscale 2010, 2, 1892–1900. [Google Scholar] [CrossRef] [PubMed]
- Wang, T.; Li, Y.; Wang, L.; Liu, C.; Geng, S.; Jia, X.; Yang, F.; Zhang, L.; Liu, L.; You, B.; et al. Synthesis of graphene/α-Fe2O3 composites with excellent electromagnetic wave absorption properties. RSC Adv. 2015, 5, 60114–60120. [Google Scholar] [CrossRef]
- Zhang, S.; Wu, W.; Xiao, X.; Zhou, J.; Ren, F.; Jiang, C. Preparation and characterization of spindle-like Fe3O4 mesoporous nanoparticles. Nanoscale Res. Lett. 2011, 6, 1–9. [Google Scholar] [CrossRef] [PubMed]
- Luo, Y.; Hassan, E.B.; Guda, V.; Wijayapala, R.; Steele, P.H. Upgrading of syngas hydrotreated fractionated oxidized bio-oil to transportation grade hydrocarbons. Energy Convers. Manag. 2016, 115, 159–166. [Google Scholar] [CrossRef]
- Zhang, Y.; Xiao, R.; Gu, X.; Zhang, H.; Shen, D.; He, G. Catalytic pyrolysis of biomass with Fe/La/SBA-15 catalyst using TGA–FTIR analysis. BioResources 2014, 9. [Google Scholar] [CrossRef]


| Sample | Wave Number (cm−1) | Functional Groups |
|---|---|---|
| KL | ~3400 | O–H stretching |
| ~2937 | C–Hx stretching | |
| 1700–1730 | C=O stretching (unconjugated) | |
| 1595 | aromatic skeletal vibration and C=O stretch | |
| 1511 | aromatic skeletal vibrations | |
| 1455, 1425 | –CH3 deformation | |
| 1365 | In-plane deformation vibration of phenolic | |
| 1266, 1213 | C–O stretching of guaiacyl ring | |
| 1150 | guaiacyl C–H deformation | |
| 1079 | C–O, secondary alcohols | |
| 1030 | C–O, primary alcohols | |
| 967 | –C–C–H and –HC=CH– deformation | |
| 851, 812 | C–H, aromatic | |
| FeN | ~2900, 1630 | O–H stretching, non-dissociated water |
| 1300, 815 | N–O, nitrate group | |
| 690 | Fe–O–H | |
| 470 | Fe–O | |
| FePs | 540 | Fe–O |
| KL/FeN | 1670 | C=O stretching (unconjugated) |
| 1590 | aromatic skeletal vibration and C=O stretch | |
| 1300 | N–O, nitrate group | |
| 1266, 1213 | C–O stretching of guaiacyl ring | |
| 1079, 1030 | aliphatic C–O vibration | |
| 690 | Fe–O–H | |
| 470 | Fe–O |
| Sample | Yield (%) | Tstart 1 (°C) | Tmax 2 (°C) | Tend 3 (°C) | dW/dTmax (wt %/min) | ΔW(Tstart–Tend) 4 (%) | ΔW(T700–T1000) 5 (%) |
|---|---|---|---|---|---|---|---|
| KL | 36.4 | 291 | 436 | 482 | 3.2 | 38.7 | 3.9 |
| KL/FePs | 48.0 | 275 | 445 | 689 | 2.7 | 33.6 | 14.4 |
| KL/FeN | 29.2 | 182 | 255, 308 | 636 | 14.4, 4.4 | 65.0 | 0.6 |
© 2018 by the authors. Licensee MDPI, Basel, Switzerland. This article is an open access article distributed under the terms and conditions of the Creative Commons Attribution (CC BY) license (http://creativecommons.org/licenses/by/4.0/).
Share and Cite
Zhang, X.; Yan, Q.; Li, J.; Zhang, J.; Cai, Z. Effects of Physical and Chemical States of Iron-Based Catalysts on Formation of Carbon-Encapsulated Iron Nanoparticles from Kraft Lignin. Materials 2018, 11, 139. https://doi.org/10.3390/ma11010139
Zhang X, Yan Q, Li J, Zhang J, Cai Z. Effects of Physical and Chemical States of Iron-Based Catalysts on Formation of Carbon-Encapsulated Iron Nanoparticles from Kraft Lignin. Materials. 2018; 11(1):139. https://doi.org/10.3390/ma11010139
Chicago/Turabian StyleZhang, Xuefeng, Qiangu Yan, Jinghao Li, Jilei Zhang, and Zhiyong Cai. 2018. "Effects of Physical and Chemical States of Iron-Based Catalysts on Formation of Carbon-Encapsulated Iron Nanoparticles from Kraft Lignin" Materials 11, no. 1: 139. https://doi.org/10.3390/ma11010139