Diffusivities and Atomic Mobilities in bcc Ti-Mo-Zr Alloys
by
Weimin Bai
1, 
Guanglong Xu
2,
Mingyue Tan
1,
Zhijie Yang
1,
Lijun Zeng
1,
Di Wu
1,
Libin Liu
1,* and
Ligang Zhang
1,* 1
School of Material Science and Engineering, Central South University, Changsha 410083, China
2
Tech Institute for Advanced Materials & School of Materials Science and Engineering, Nanjing Tech University, Nanjing 211800, China
*
Authors to whom correspondence should be addressed.
Materials 2018, 11(10), 1909; https://doi.org/10.3390/ma11101909
Submission received: 18 September 2018
/
Revised: 3 October 2018
/
Accepted: 5 October 2018
/
Published: 8 October 2018
(This article belongs to the Special Issue Ti-Based Biomaterials: Synthesis, Properties and Applications)
Abstract
:β-type (with bcc structure) titanium alloys have been widely used as artificial implants in the medical field due to their favorable properties. Among them, Ti-Mo alloy attracted numerous interests as metallic biomaterials. Understanding of kinetic characteristics of Ti alloys is critical to understand and manipulate the phase transformation and microstructure evolution during homogenization and precipitation. In this work, diffusion couple technique was employed to investigate the diffusion behaviors in bcc Ti-Mo-Zr alloys. The diffusion couples were prepared and annealed at 1373 K for 72 h and 1473 K for 48 h, respectively. The composition-distance profiles were obtained via electron probe micro-analysis (EPMA). The chemical diffusion coefficients and impurity diffusion coefficients were extracted via the Whittle-Green method and Hall method. The obtained diffusion coefficients were assessed to develop a self-consistent atomic mobility database of bcc phase in Ti-Mo-Zr system. The calculated diffusion coefficients were compared with the experimental results. They showed good agreement. Simulations were implemented by Dictra Module in Thermo-Calc software. The predicted composition-distance profiles, inter-diffusion flux, and diffusion paths are consistent with experimental data, confirming the accuracy of the database.
1. Introduction
Due to their biocompatibility, low modulus, high specific strength, and high corrosion resistance, β-type (with bcc structure) and near β titanium alloys have been widely used as surgery implants [1,2,3,4]. Previous studies have verified that Nb, Zr, Mo, Hf, and Ta are effective alloying elements leading to low elastic modulus, nontoxic, and non-allergic β-Ti alloys [4,5,6]. Moreover, Zr can increase hardenability and corrosion resistance for the alloy [7,8]. Mo is a strong β-phase stabilizing element for titanium alloys and the Ti-Mo based alloys exhibit adequate mechanical compatibility and good cyto-compatibility [9,10,11,12]. Therefore, the Ti-Mo-Zr system, which showed good performances and magnificent prospects in biomaterial application, has been intensively studied [3,6,10,11,12,13]. Several alloys related to the Ti-Mo-Zr system have been investigated recently, for example, Ti-12Mo-6Zr-2Fe [14], Ti-15Mo-5Zr-3Al [15], and Ti-8Mo-4Nb-2Zr [6].
Inter-diffusion in alloys plays an important role in materials processing. Understanding diffusion kinetics of Ti alloys is critical to manipulate phase transformation and microstructure evolution during homogenization and precipitation [16,17,18]. The reliable inter-diffusion coefficients are the essential input parameters in various quantitative modeling of phase transformation [17,19,20]. It is also valuable to determine thermodynamic stability under long-term service conditions.
Inspired by the CALPHAD (CALculation of PHAse Diagram) method, Andersson and Ågren [21] developed a phenomenological kinetic technique which present the atomic mobilities of individual species using Redlick-Kister polynomials. This technique assesses the discrete diffusion coefficients that were extracted experimentally and then employs a set of parameters to describe composition dependent mobilities and diffusivities. Combined with thermodynamic information, diffusion simulation can be implemented in DICTRA module embedded in Thermo_Calc software [22,23].
Various of measurements of self- and impurity diffusion coefficients in bcc Ti, Zr, and Mo have been conducted [24] as well as inter-diffusion coefficients in bcc Ti-Mo [25,26,27], Ti-Zr [28,29,30,31] and Mo-Zr alloys [32]. Based these diffusion coefficients, Liu et al. [33,34] assessed the atomic mobilities in bcc Ti-Mo, Ti-Zr, and Mo-Zr alloys with the CALPHAD method. Simulations of concentration profiles and Kirkendall movement using these mobility parameters show good agreement with the experimental results from literatures. However, the ternary diffusion coefficients and mobilities in bcc Ti-Mo-Zr alloys is still open to be evaluated and barely reported. The purpose of this work is to study the diffusion behavior of Mo and Zr in β-Ti alloys and establish a CALPHAD-type atomic mobility database of bcc phase in Ti-Mo-Zr system.
2. Model
2.1. Extraction of Inter-Diffusion Coefficients and Impurity Diffusion Coefficients
According to Kirkaldy [35], in one dimension, the inter-diffusion flux of component i with concentration ci in a ternary system can be expressed as:
where are the inter-diffusion coefficients;, are the concentration of species and ; is the concentration of at the left end of the diffusion couple; is the distance; is the Matano plane for the diffusion couple; and, is the diffusion time.
In a ternary system, it involves four independent diffusion coefficients, , , and . However only two composition-distance profiles for independent elements 1 and 2 can be derived from one diffusion couple. Hence, two diffusion couples result in two diffusion paths which intersect at one point, are needed to obtain four profiles. Then, the diffusion coefficients at this point can be solved mathematically. The old-fashioned Boltzmann-Matano had to position the Matano planes of four profiles, which is time-consuming and might lead to unnecessary inaccuracy. To avoid this drawback, Whittle and Green [36] introduced a normalized concentration variable:
where and are concentrations of two elements in the left and right end of the diffusion couple.
With the variable Y, the inter-diffusion flux of element i is no longer referred to a fixed laboratory coordinate and can be transformed into:
Reformulating the right-hand side of Equations (1) and (3) lead to:
By solving a set of four equations from one pair of diffusion couples, the diffusion coefficients , , and at the intersecting composition can be extracted. Note that the molar volume was taken to be constant for the lack of reliable data on the composition-dependent molar volume in bcc Ti-Mo-Zr alloys. Errors that are introduced by this approximate treatment are believed to be within the accuracy of the results obtained via the Whittle-Green method [36].
By applying a generalized Hall method [37,38], the impurity diffusion coefficients of Zr in Ti-Mo alloys and Mo in Ti-Zr at the terminal compositions of the diffusion couples can be obtained. The profiles were transformed to a plot of μ vs λ, in which and . By fitting the plot with a linear equation , the , for the left terminal, and , for the right terminal of the diffusion couples can be obtained and the impurity diffusion coefficients can be derived via the following formulas:
where represents the content of in binary alloys and is the content of at the other end of the diffusion couple.
2.2. Atomic Mobility and Diffusivity
As initiated by Andersson and Ågren [21] and later modified by Jönsson [39], the atomic mobility of species can be expressed as:
where R is the gas constant; T is the temperature; is the frequency factor; is the activation energy; and, is the ferromagnetic contribution. Since there is no ferromagnetic transition reported in Ti-Mo-Zr alloys, can be taken as 1. Provided , Equation (7) can be written as [21]:
the parameter is composition dependent and is expressed in the Redlich-Kister polynomial form as:
where denotes the solid solution phase; is the mole fraction of species ; is the value of species in pure species ; and, and are the binary and ternary interaction parameters.
Assuming the mono-vacancy exchange is the dominant diffusion mechanism, and neglecting correlation factors, the tracer diffusion coefficients of species i is directly related to the mobility Mi by means of the Einstein relation:
For a substitutional solution phase, the inter-diffusion coefficients in terms of the volume-fixed reference frame is given by the following general expression:
where is the Kronecker delta ( when i=k, and 0 otherwise).
Then, the inter-diffusion flux of species i, can be calculated via Equation (1), and the concentration evolution of component i in ternary systems can be solved by the mass conservation law:
What calls for special attention in the formula derivation is that the transformation of concentration of species i, , and the mole fraction :
where Vm is the molar volume of a phase that was taken to be constant in this work.
3. Experiment
Pure Ti, binary Ti-Mo and Ti-Zr alloys, and ternary Ti-Mo-Zr alloys were prepared from pure Ti (99.99 wt %), Mo (99.99 wt %), and Zr (99.99 wt %) by arc melting in electric arc furnace under an argon atmosphere. All of the alloys compositions were designed in the bcc phase region according the binary phase diagram of Ti-Mo [40], Ti-Zr [41], and Zr-Mo [42] systems and ternary phase diagram of Ti-Mo-Zr system at 1473 K [43] (shown in Figure 1). The compositions of all alloys were listed in Table 1. The ingots were re-melted for six times to attain homogeneity and then annealed at 1473 K for 24 h to obtain microstructure with large grain size above millimeters, such that the effect of grain boundary diffusion can be ignored.
The annealed ingots were cut into blocks with a size of 10 × 10 × 5 mm using wire-electrode cutting. After one surface of the blocks polished to mirror-like quality, the well-contacted diffusion couples were assembled with appropriate pairs of blocks in Table 1 under vacuum at 1173 K for 4 h. The diffusion couples were sealed into quartz capsules that were filled with pure argon. The M1-M8 diffusion couples were annealed at 1373 K for 72 h and N1-N8 diffusion couples were annealed 1473 K for 48 h, followed by quenching in ice water.
After the annealing process, the diffusion couples were then cut into halves parallel to the ends using wire-electrode cutting, and then mounted, ground, and polished by standard metallographic techniques. The composition-distance profiles of 16 diffusion couples were determined using electron probe micro-analysis (EPMA, JEOL, JXA-8230, Tokyo, Japan, 15 kV, 20 nA) with 15 kV voltage, 20 nA current, and a 40° take-off angle. The accuracy of the EPMA test is >98% (mass percent).
4. Results and Discussions
4.1. Inter-Diffusion and Impurity Diffusion Coefficients At 1373 K and 1473 K
All of the diffusion couples show single bcc phase microstructure. The SEM backscattered electron image (BSE) of diffusion zone of the diffusion couple M1 is taken as an example and is presented in Figure 2a. There is no Kirkendal void existing in the diffusion zone and no microstructure is evident, revealing that the alloys were annealed in single bcc phase. After being annealed at high temperature and quenched, the martensite transformation may present in the samples. However, because martensite transformation is a diffusionless phase transformation, the composition profile will not change. We can still extract the diffusion coefficients from the composition profile that was obtained in this sample.
The composition-distance profiles that were determined from couple M2 is shown in Figure 2b. It is worth mentioning that, to avoid the errors from fitting or smoothing, a robust error function expansion (ERFEX) was put forward to represent the experimental profiles in an accurate analytical form [37,44]:
where X(r) is the effective alloying element content at location z; a, b, c, and d are the fitting parameters.
It could be evidenced by practice that the profiles smoothed using ERFEX method exhibits higher accuracy than using traditional method, such as moving average smoothing, Savitzky-Golay smoothing method, and Piecewise Cubic Hermite Interpolating Polynomial (PCHIP) interpolation, and it can present the details of the composition profiles. For example, the Mo pill-up at the right end of couple M6 (shown in Figure 2c). The ERFEX method also has its advantages in fitting asymmetrical curves when the diffusivities of the elements in one end of the diffusion couple are much larger than that of the other end. The couple M6 is compared with M8, for instance. The left-hand side of M6 is pure titanium and the other end has a high Mo concentration. The slop of profile M6 is steep at the right end of diffusion (Figure 2c). It is because the diffusivity of Mo in Ti alloys is much lower than that of Ti. In comparison, it is appropriately smooth and it shows the conventional S-shape (Figure 2d) in M8. The steep slope will introduce a larger error when calculating the diffusion coefficients at the concentration on it. That means that the accuracy of the calculated diffusion coefficients at the component close to Ti-Mo boundary will be lower.
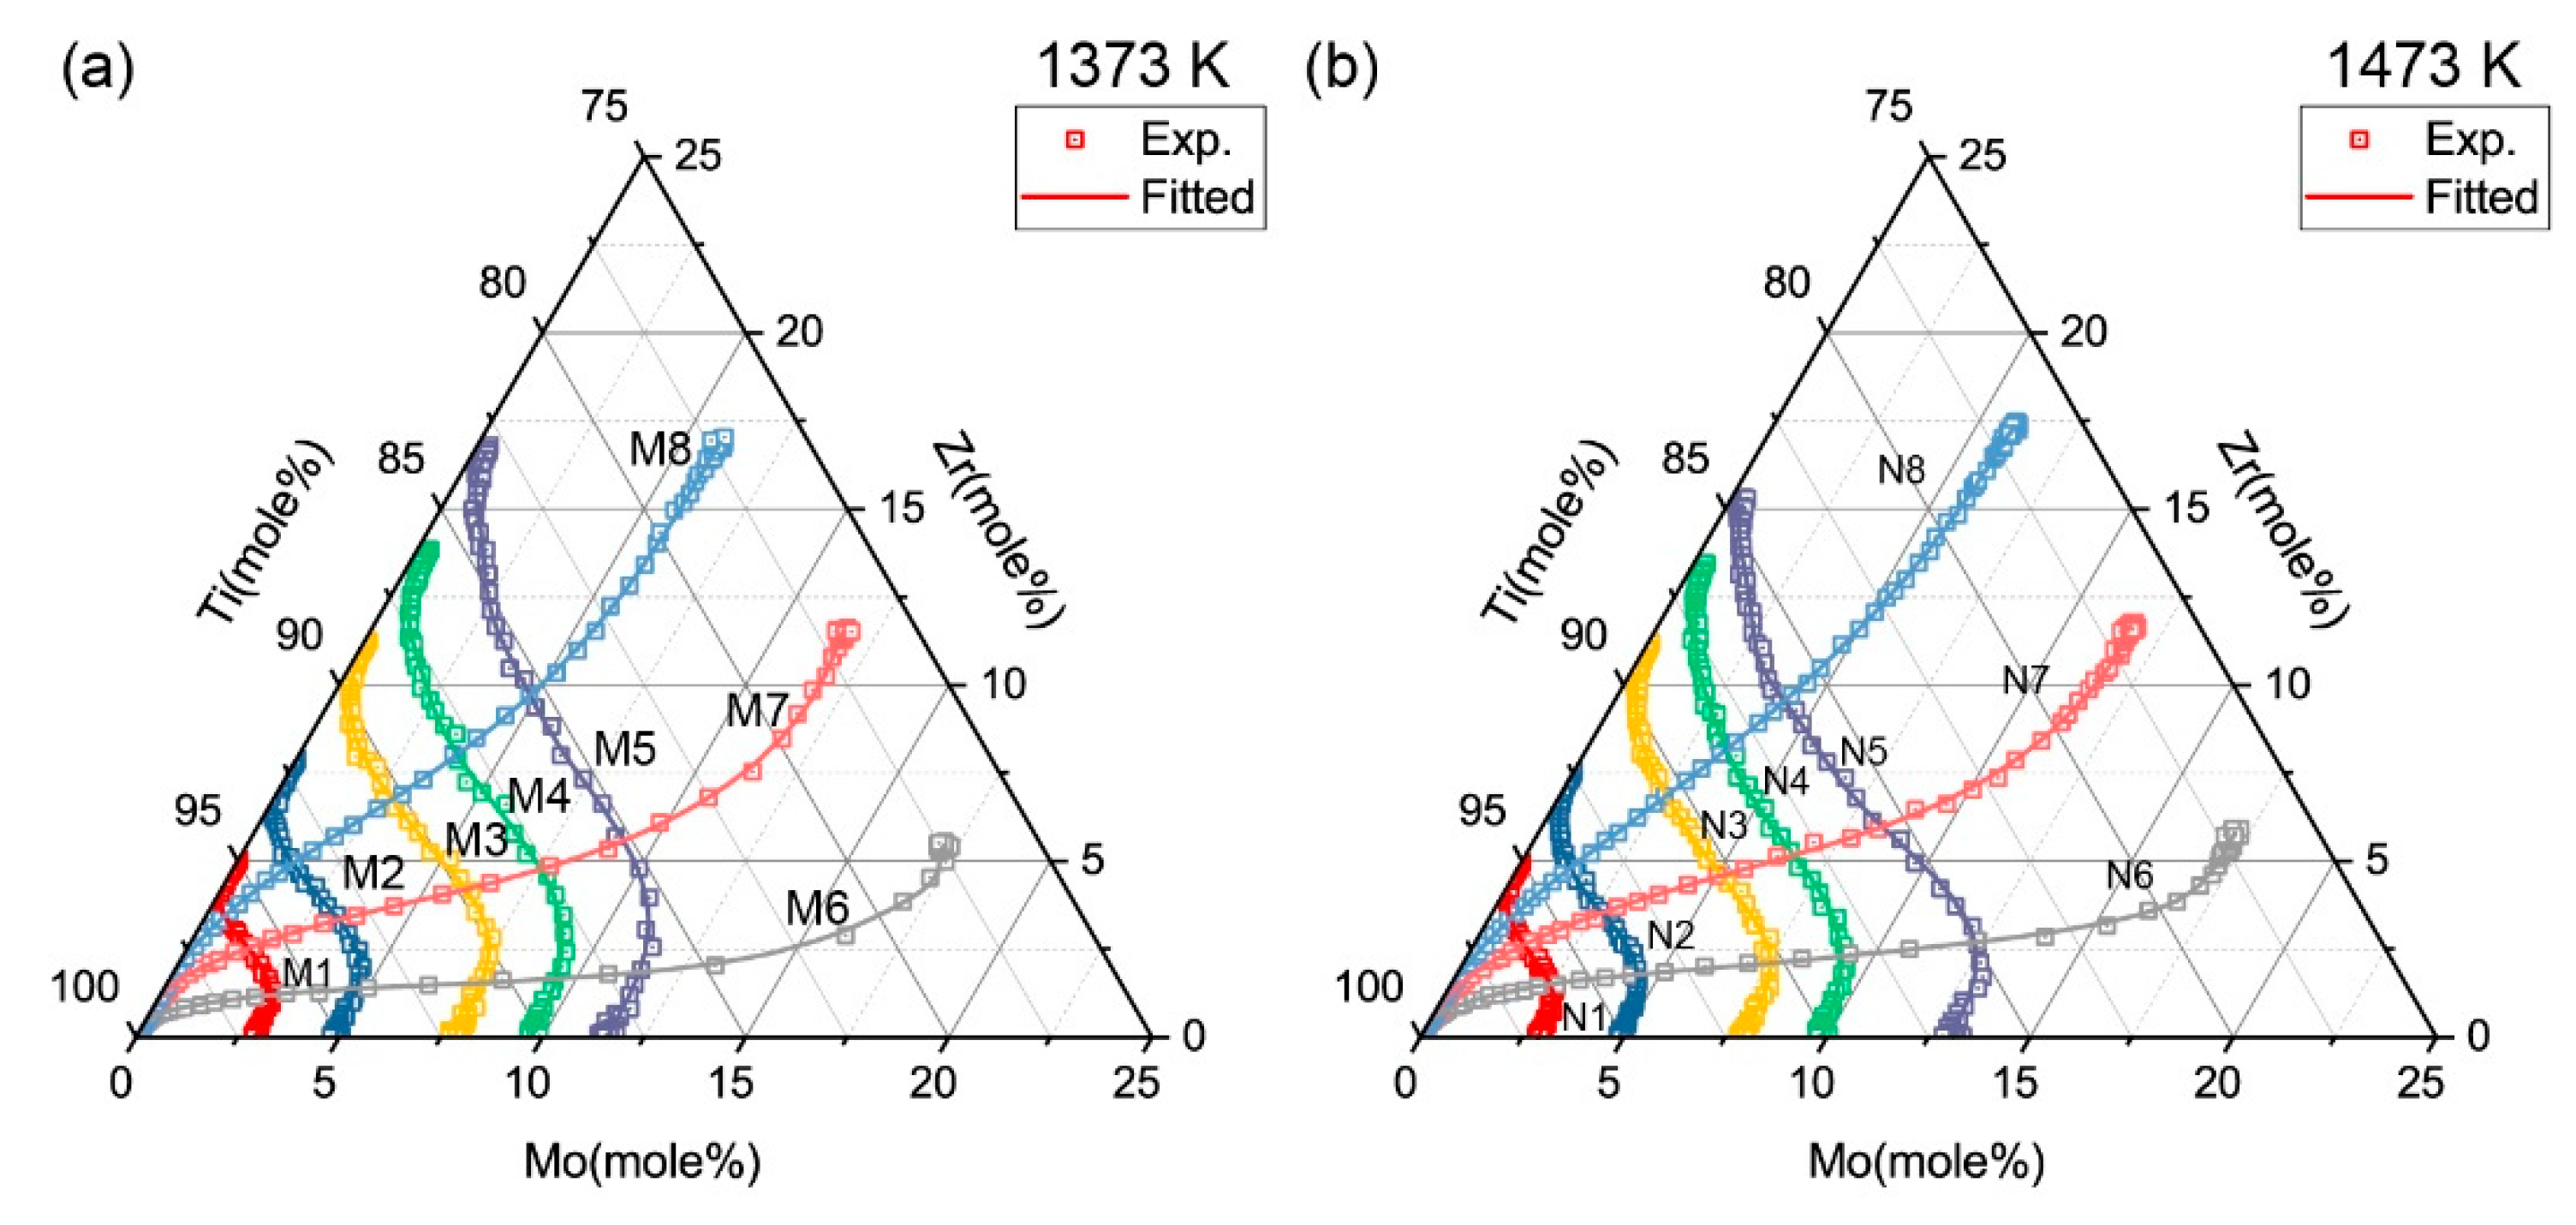
The diffusion paths of all diffusion couples after annealing process are presented in Figure 3. According to the Whittle-Green method, the inter-diffusion coefficients at the intersecting compositions can be extracted. The impurity diffusion of Zr in Ti-Mo alloys and Mo in Ti-Zr alloys can be obtained via the Hall method at the ends of couple M1-M5 and N1-N5.
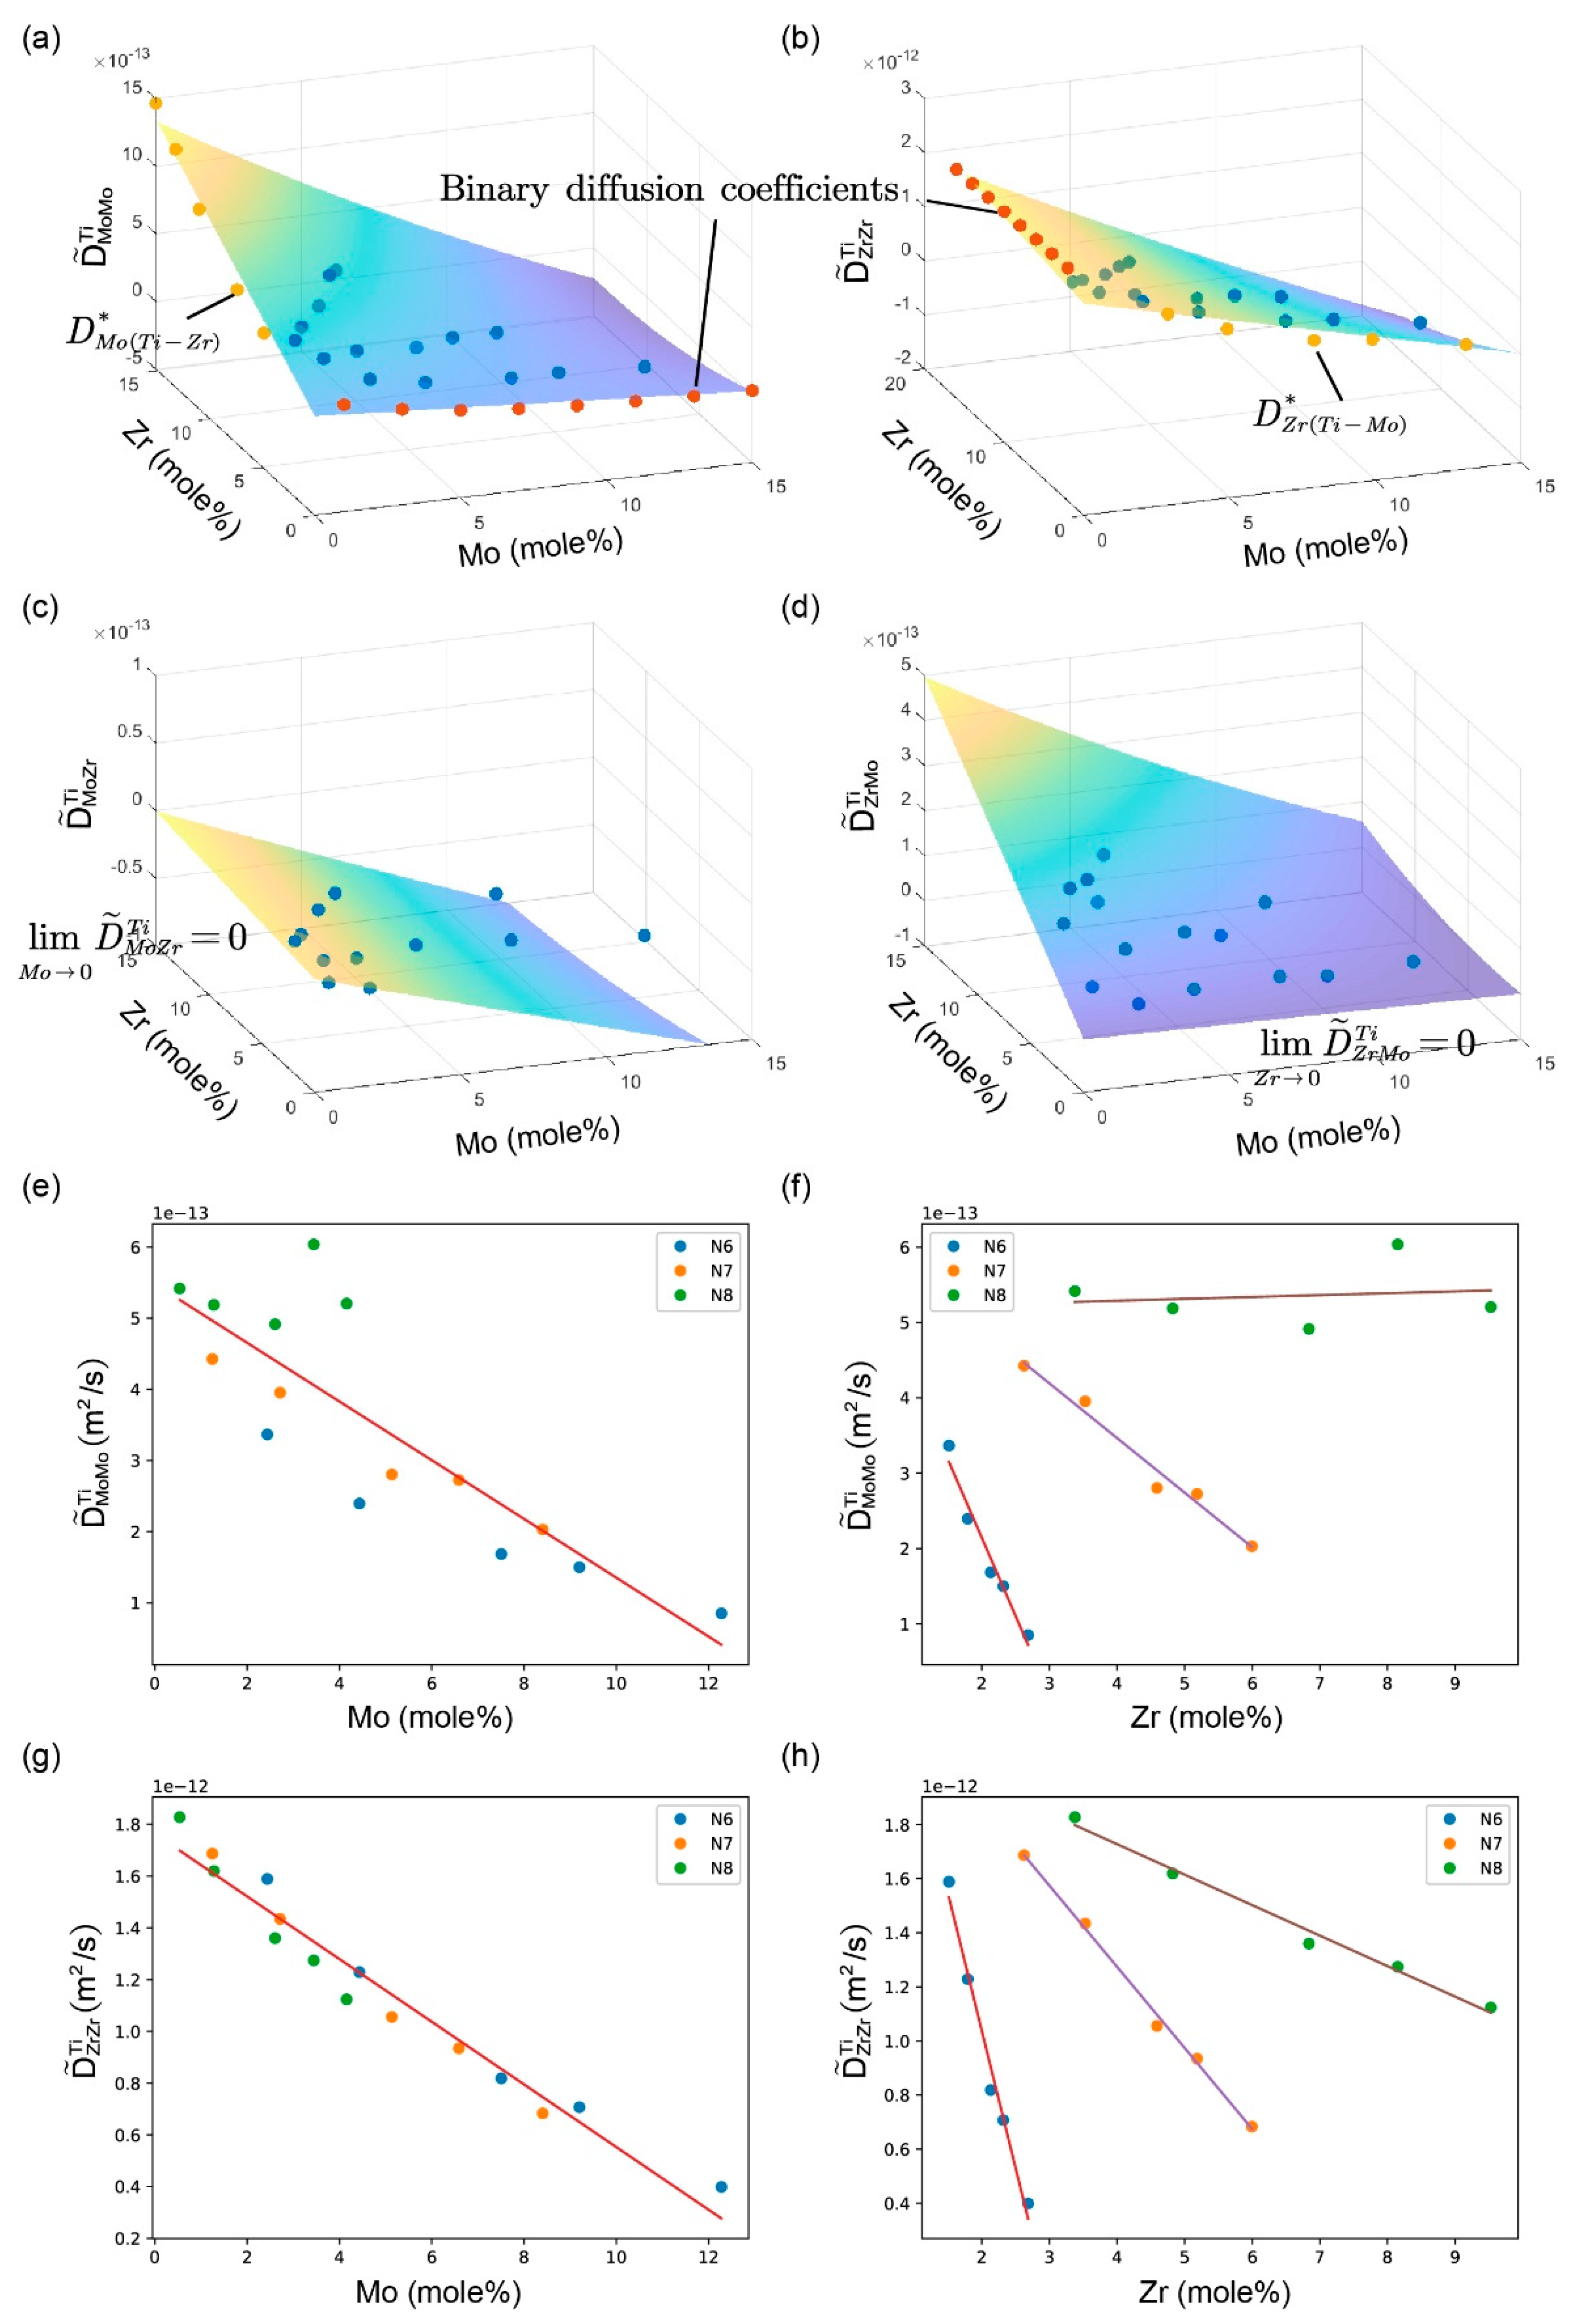
The determined inter-diffusion coefficients are summarized in Table 2 and graphically presented with three-dimensional plots in Figure 4. The standard deviations were determined from four independent calculations upon two independent measurements. All of the results can satisfactorily fulfill the thermodynamic constrains derived by Kirkaldy [45]:
The impurity diffusion coefficients that were obtained by Hall methods are listed in Table 3, and also illustrated in Figure 4, along with the inter-diffusion coefficients. In Figure 4a,b, the main inter-diffusion coefficients coincide with the impurity diffusion coefficients when the concentration of diffusion elements tends to 0.
Scrutinizing the map of the diffusion coefficients in Figure 4, it can also be observed that, when the concentration of the gradient elements j tends to 0, the limit of main inter-diffusion coefficients will match the binary diffusion coefficients from literature [33] well, and when the concentration of the diffusion elements i tend to 0, the limits of cross inter-diffusion coefficients will be 0. The main diffusion coefficients are larger than the cross ones and they showed less fluctuation than cross ones. Values of are negative, which means that the element Zr has a negative effect on the diffusion of Mo in Ti-based alloys.
The variation of and with the composition of Mo and Zr at 1373 K are presented in Figure 5. It can be found that decrease with the increase concentration of Mo in Figure 5a. In Figure 5b, also decrease with the increase concentration of Zr. However, the decreasing rate varies with different diffusion Mo contents (the three colors correspond to inter-diffusion coefficients extracted from three different diffusion couples, M6, M7, and M8). In general, a great ratio of x(Zr)/x(Mo) slows down the process of decrease. As to , as is shown in Figure 5c,d, show similar trends, like , when it varies with the concentration of Mo and Zr. From these phenomena, we can infer that the influence of element Mo on the variations of and is much larger than Zr.
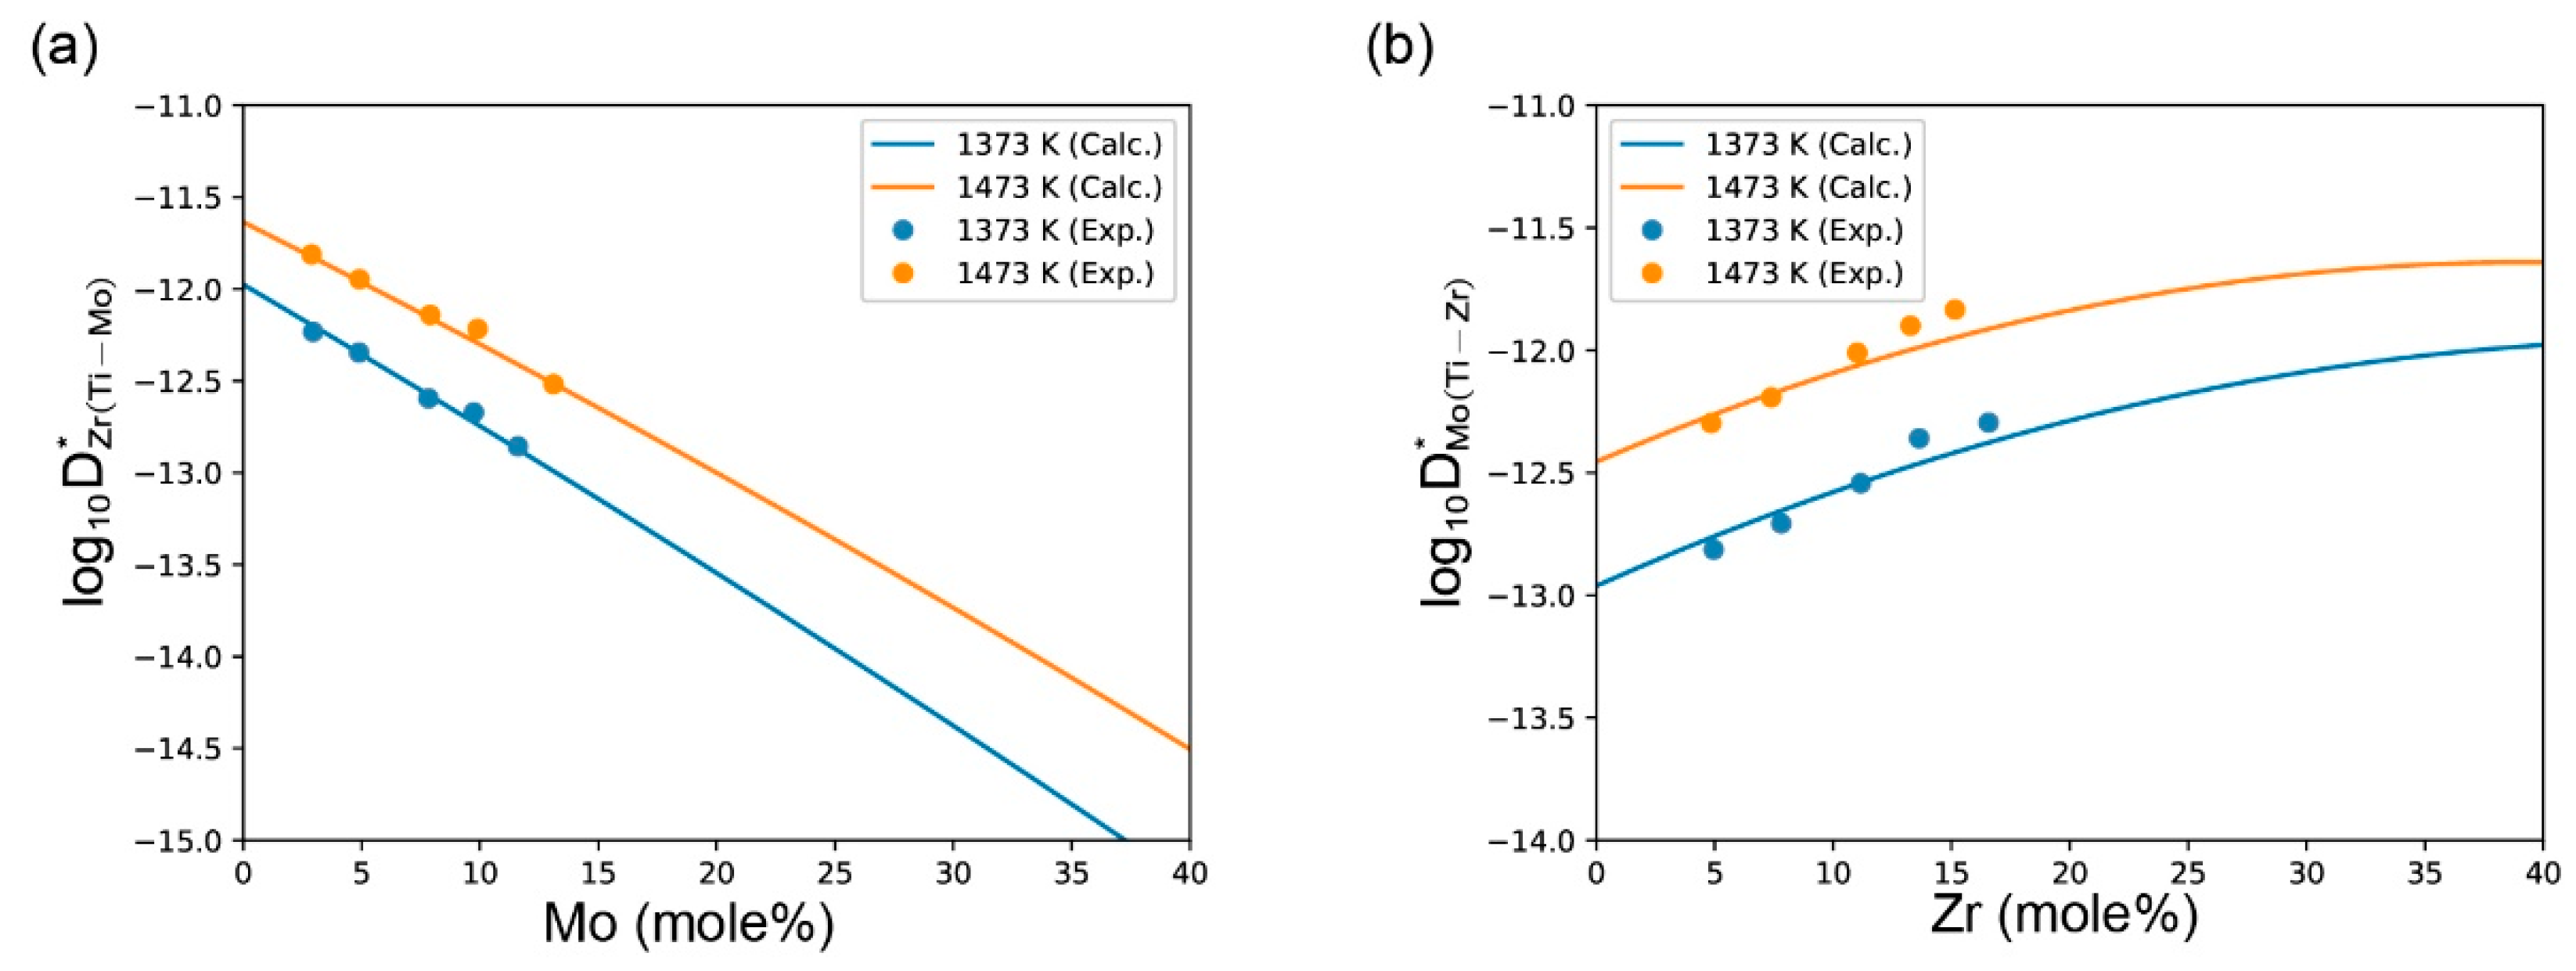
When extent to boundary, the impurity diffusion coefficients of Mo in Ti-Zr alloys, show an increasing trend with the increase of Zr concentration. The impurity diffusion coefficients of Zr in Ti-Mo alloys show a decreasing trend with the increase of Mo concentration.
Figure 6 presents the three-dimensional (3D) plot of diffusion coefficients in the bcc Ti-Mo-Zr alloys and the variations of and with of the concentration of Mo and Zr at 1473 K. They showed similar trends as those at 1373 K.
4.2. Atomic Mobilities in bcc Ti-Zr-Mo System
The DICTRA module that was embedded in ThermoCalc software [21,22] was employed to obtain the atomic mobility parameters for the Ti-Mo-Zr ternary bcc alloys. Mobility parameters of boundary binary systems were taken from Liu’s work [33,34]. Thermodynamic description of boundary binary systems were also the same as Liu’s work [40,41,42]. Thermodynamic modeling of bcc phase in the ternary system can be carried out by simply extrapolation based on three binary systems. By assessing the experimental diffusion coefficients in this work, a set of self-consistent atomic mobility parameters were obtained, as listed in Table 4.
Using these parameters and DICTRA software, the inter-diffusion coefficients at the intersection composition at 1373 K and 1473 K were calculated and compared with the experimental results, as shown in Figure 7. The calculated results agree with the main inter-diffusion coefficients well, within the error allowed. In contrast, the cross coefficients show certain fluctuation with a large error range. Since the calculated and experimental cross coefficients show values in the same order of magnitude, and a same variation tendency with compositions, the accessed mobilities are feasible to represent the cross coefficients.
Figure 8 shows the comparison of the calculated impurity diffusion coefficients and the experimental results. The calculated impurity diffusion coefficients also agree well with the experimental results.
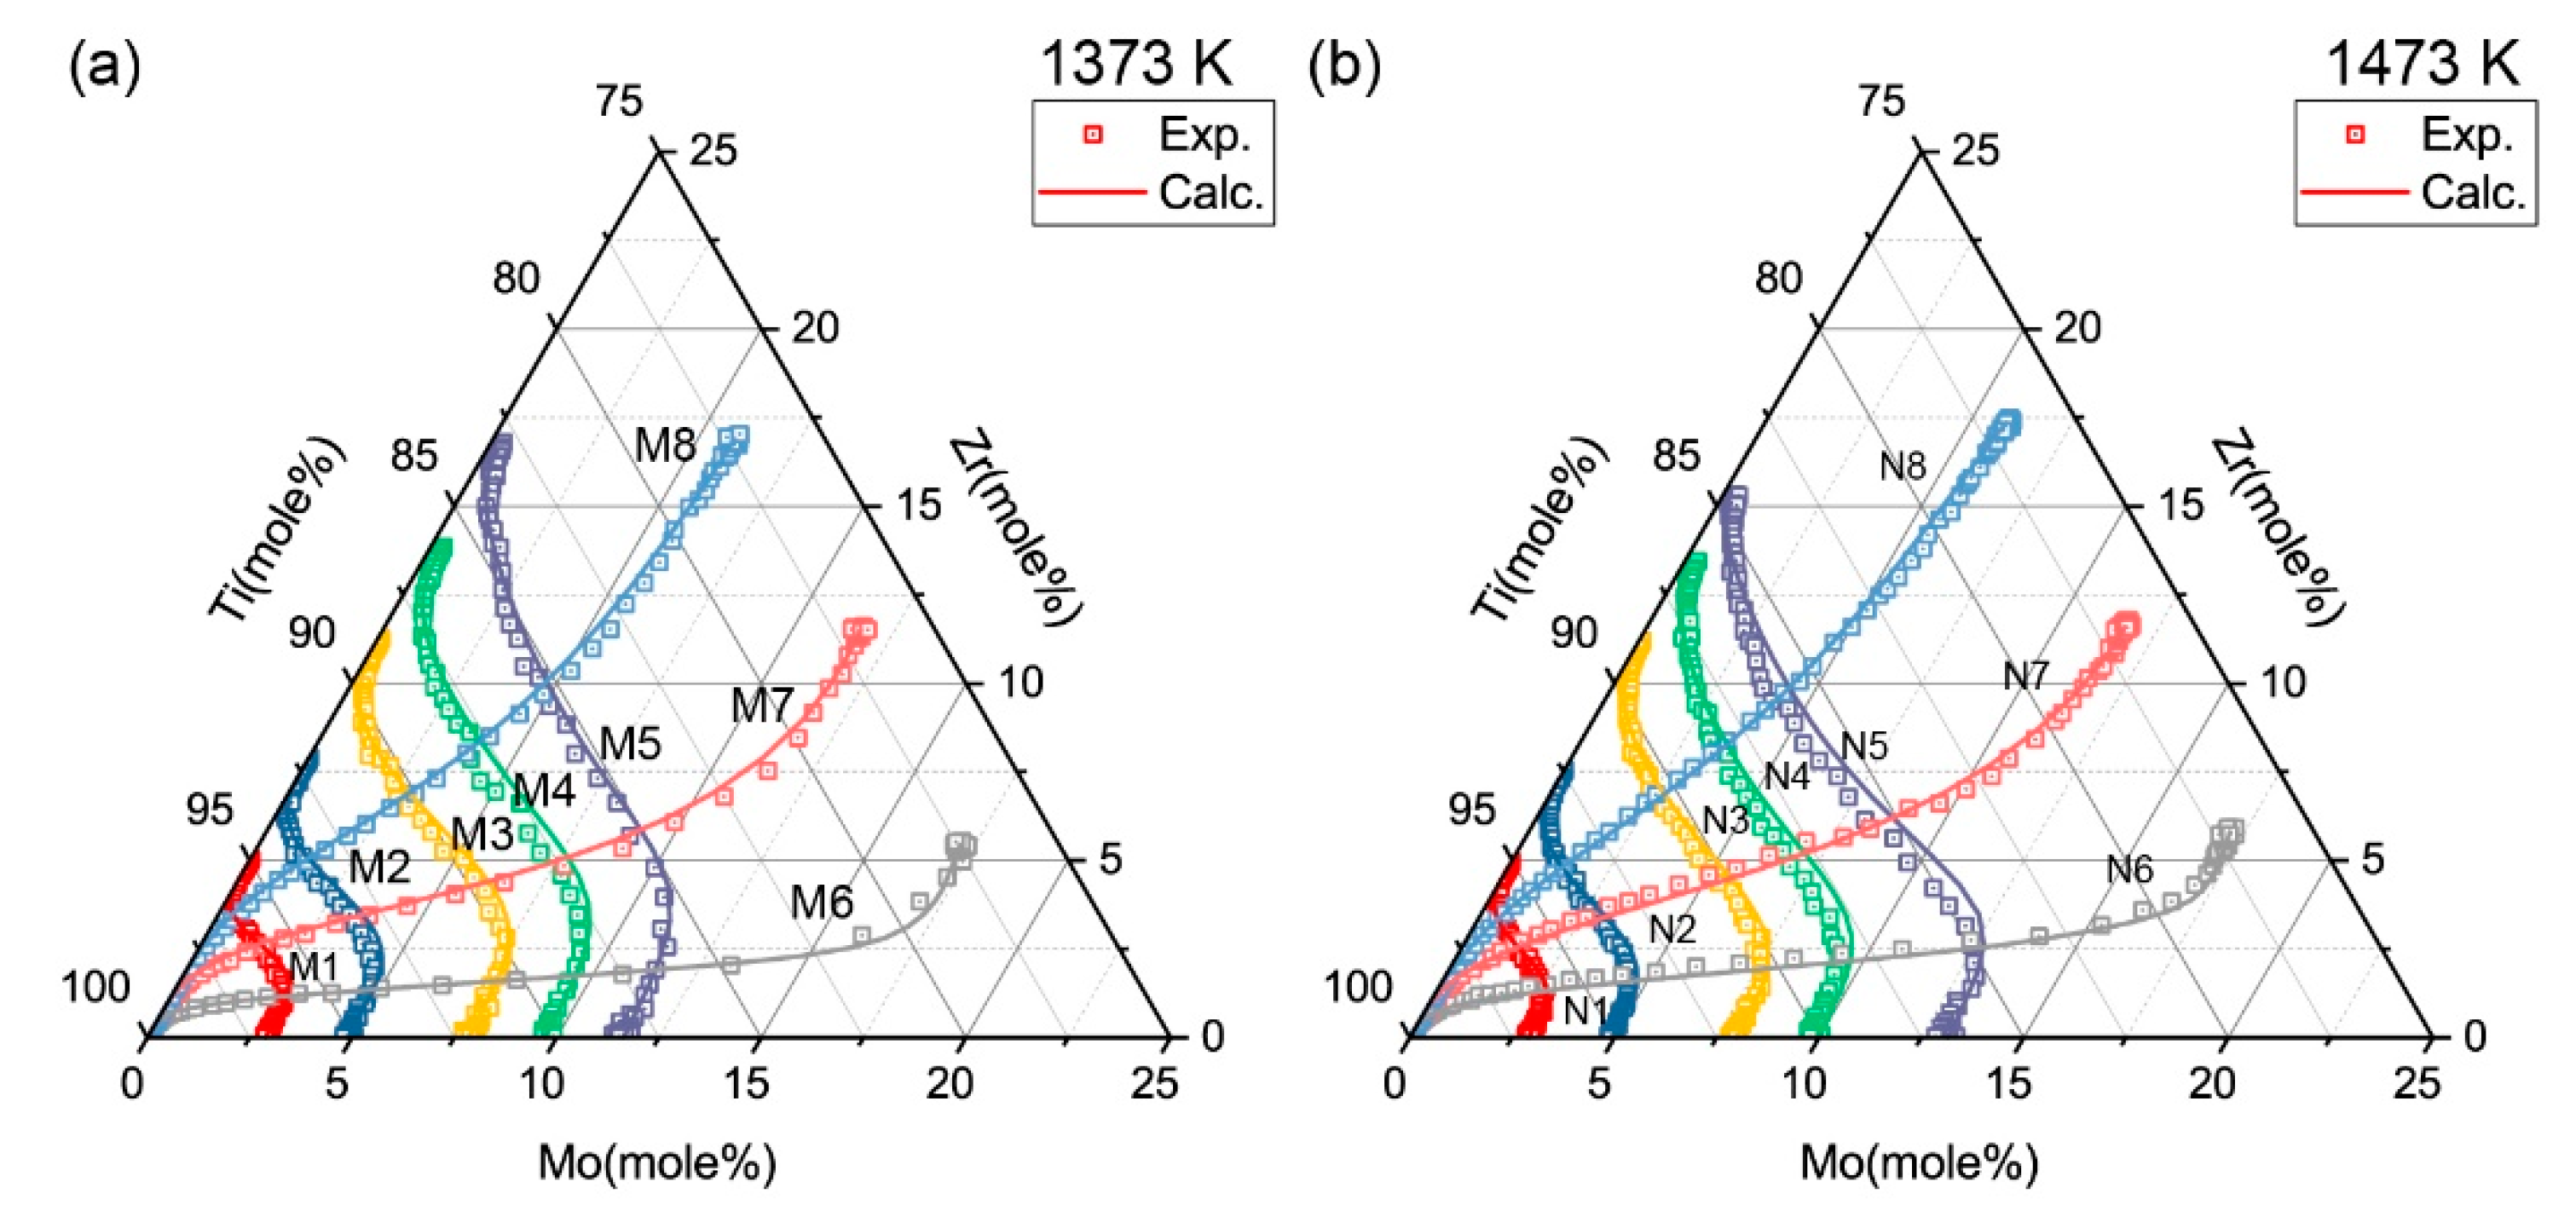
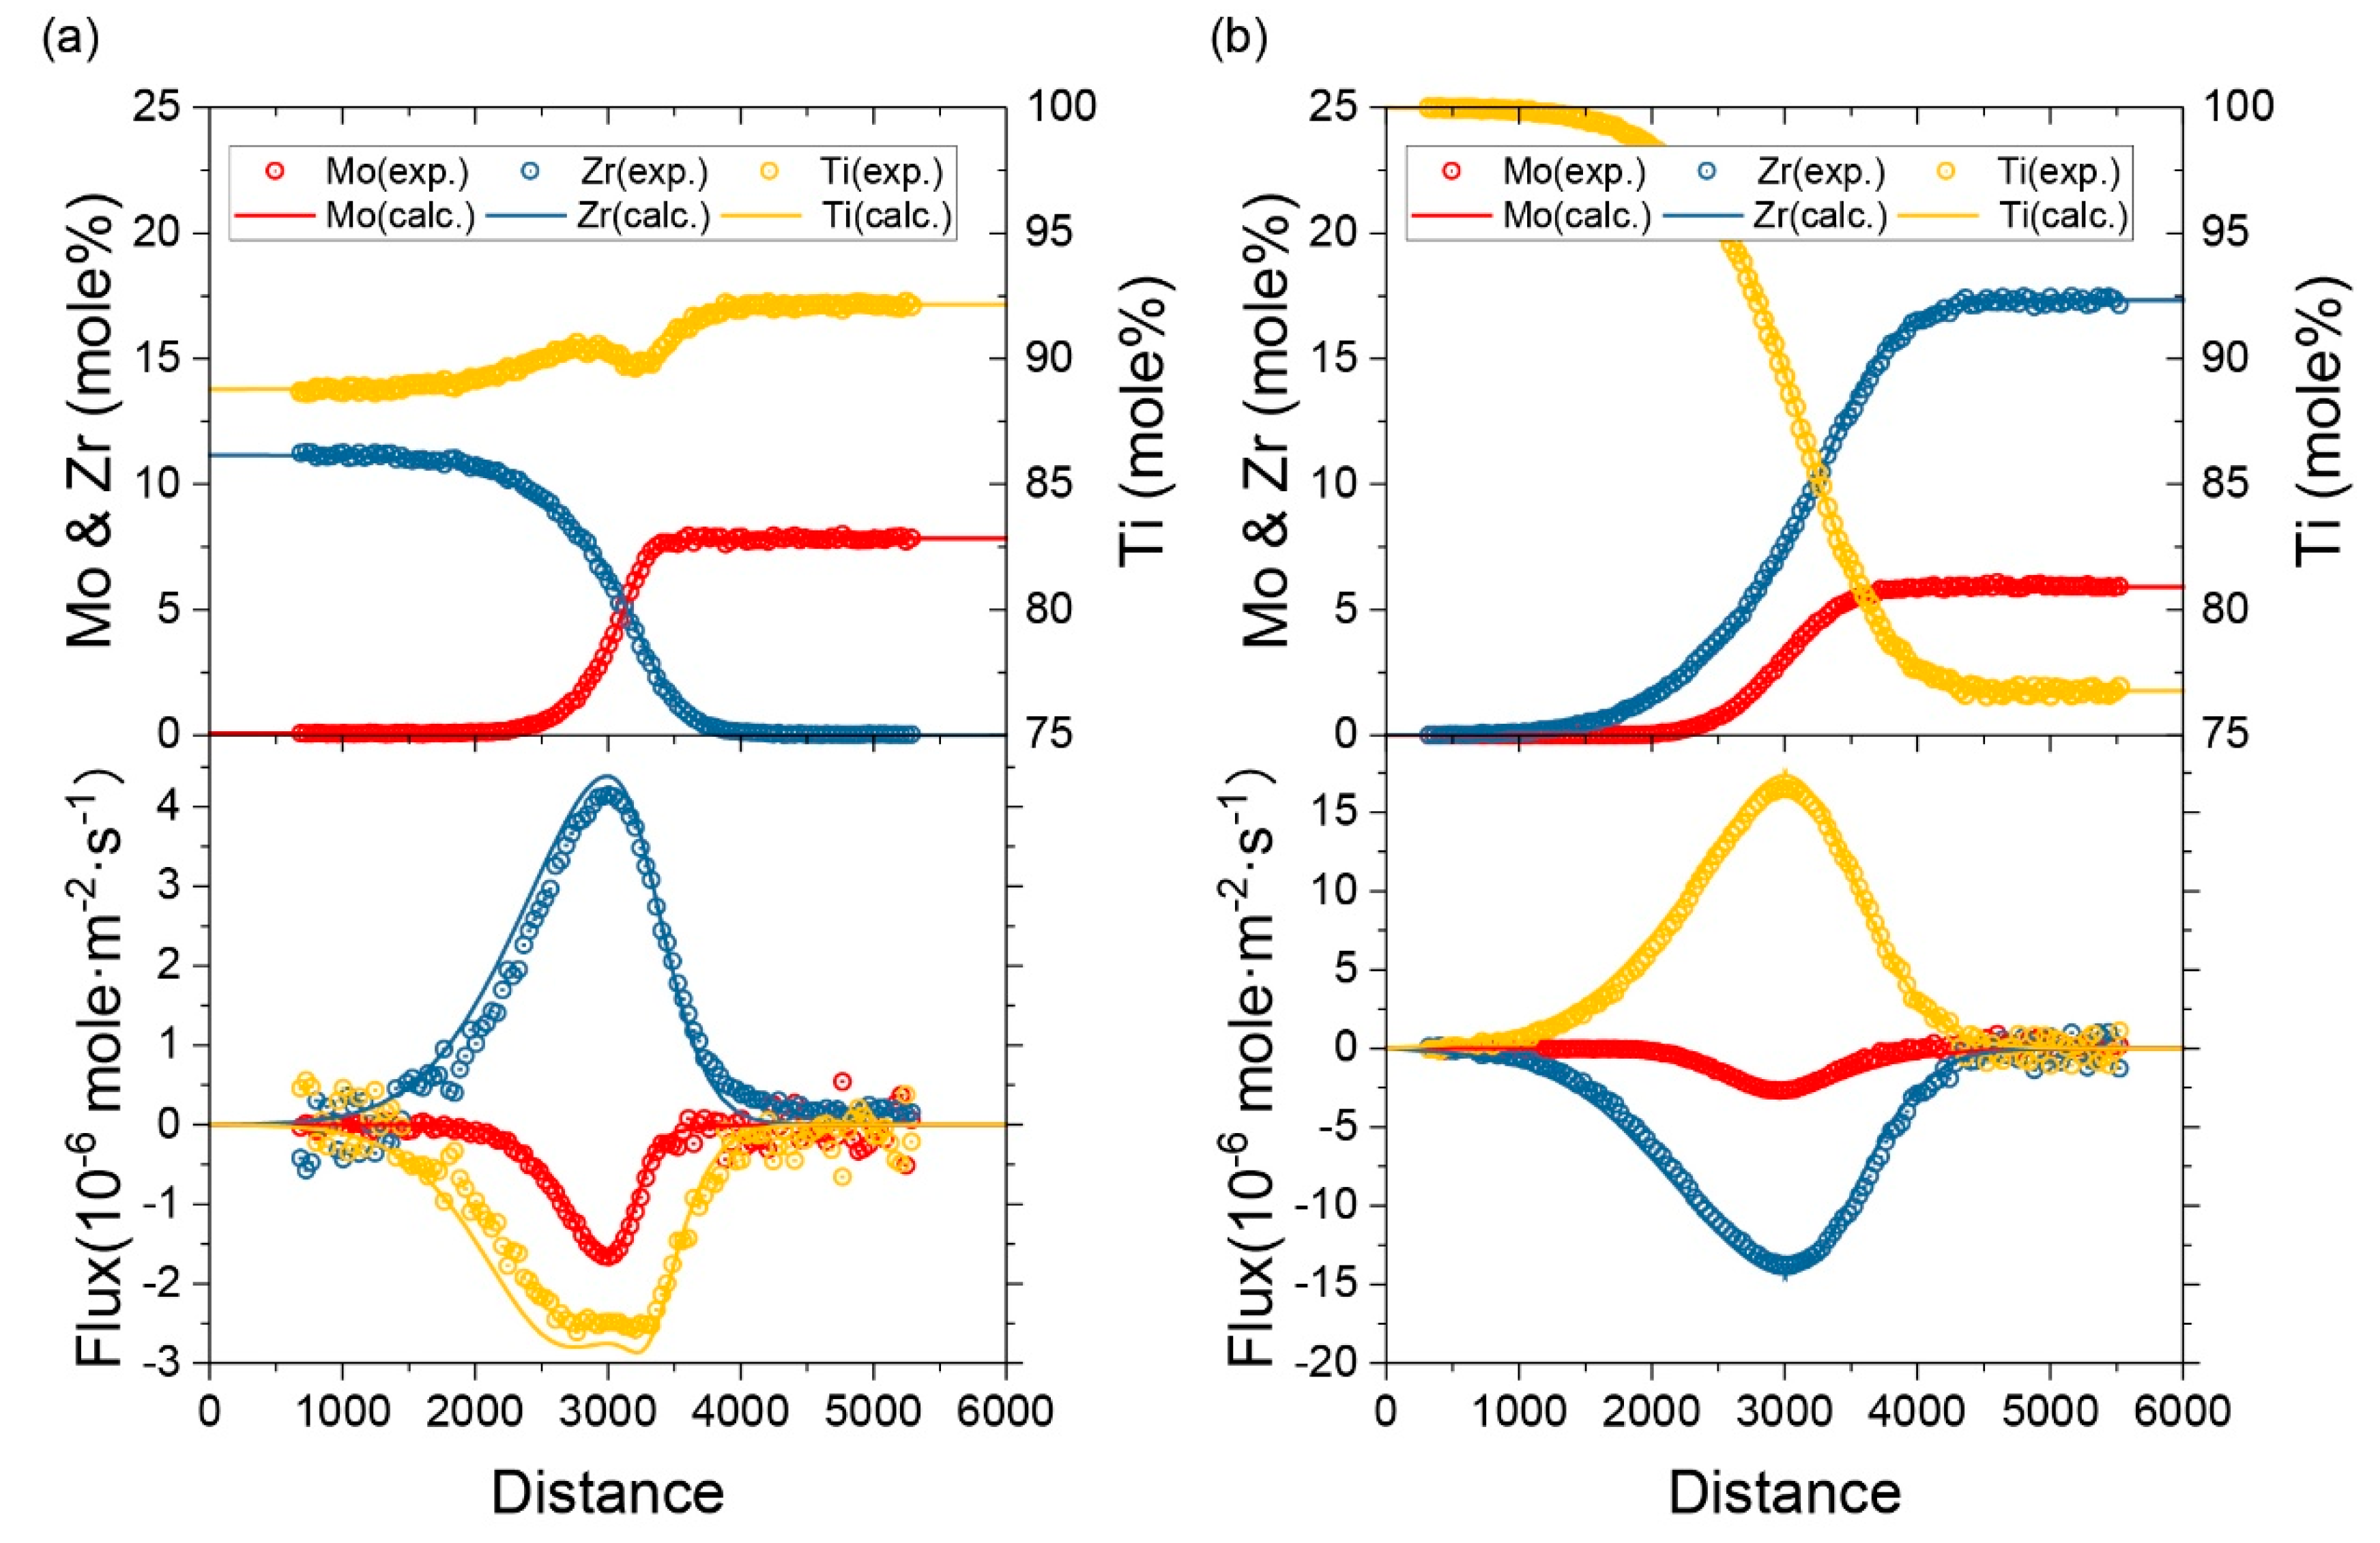
In order to further verify the atomic mobility parameters that were obtained in the present work, the simulation of several diffusion couples were implemented. The diffusion simulation was set up to model the semi-infinite ternary diffusion couples in experiment. It was conducted using the same initial conditions and heat treatment processes in the experiment. The predict composition-distance profiles show good agreement with the experimental profiles. For instance, the predicted composition-distance profiles and fluxes of couple M3 and N8 compared with experimental data are exhibited in Figure 9 and Figure 10 presented the simulated diffusion paths of 16 diffusion couples annealed at 1373 K and 1473 K. The calculated results show good agreement with the experimental results.
5. Conclusions
In this work, two set of diffusion couples of bcc Ti-Mo-Zr alloys were made and annealed at 1373 K for 72 h and 1473 K for 48 h, respectively. The composition-distance profiles of these diffusion couples were determined using EPMA. The ternary inter-diffusion coefficients and impurity diffusion coefficients were extracted using the Whittle-Green and Hall method. Based on the experimental results and thermodynamic descriptions, as well as atomic mobility parameters of the sub-binary systems of Ti-Mo-Zr system, an atomic mobility database for the bcc phase in the Ti-Mo-Zr ternary system was developed. Inter-diffusion coefficients at the intersection points of diffusion couples and impurity diffusion coefficients were calculated using the database and compared with the data extracted directly from the composition-distance profiles. In addition, simulations of the diffusion couples with the same initial conditions and heat treatment processes of the experiment were proceeded. The composition-distance profiles and diffusion paths were compared with the experimental results. All of the calculated results show good agreement with experimental data.
Author Contributions
W.B., G.X., L.L. and L.Z. (Ligang Zhang) designed the study. W.B., M.T., L.Z. (Lijun Zeng), D.W and Z.Y. conducted the experiments; W.B., L.Z. (Lijun Zeng) and G.X. analyzed the results. W.B., G.X., L.L, M.T. and L.Z. (Ligang Zhang) contributed to preparation of the manuscript.
Funding
The work was funded by Aof the National Nature Science Foundation of China (Grant No. 51671218), the National Key Research and Development Program of China (Grant No. 2016YFB0701301) and the National Key Basic Research Program of China (973Program) (Grant No. 2014CB644000).
Conflicts of Interest
The authors declare no conflict of interest.
References
- Gogia, A.K. High-temperature Titanium Alloys. Defence Sci. J. 2005, 55, 149–173. [Google Scholar] [CrossRef] [Green Version]
- Geetha, M.; Singh, A.K.; Asokamani, R.; Gogia, A.K. Ti based biomaterials, the ultimate choice for orthopaedic implants—A review. Prog. Mater. Sci. 2009, 54, 397–425. [Google Scholar] [CrossRef]
- Correa, D.R.N.; Kuroda, P.A.B.; Grandini, C.R. Structure, Microstructure, and Selected Mechanical Properties of Ti-Zr-Mo Alloys for Biomedical Applications. Adv. Mater. 2014, 922, 75–80. [Google Scholar] [CrossRef]
- Niinomi, M. Recent metallic materials for biomedical applications. Metall. Mater. Trans. A 2002, 33, 477. [Google Scholar] [CrossRef]
- Song, Y.; Xu, D.S.; Yang, R.; Li, D.; Wu, W.T.; Guo, Z.X. Theoretical study of the effects of alloying elements on the strength and modulus of β-type bio-titanium alloys. Mater. Sci. Eng. A 1999, 260, 269–274. [Google Scholar] [CrossRef]
- Nnamchi, P.S.; Obayi, C.S.; Todd, I.; Rainforth, M.W. Mechanical and electrochemical characterisation of new Ti-Mo-Nb-Zr alloys for biomedical applications. J. Mech. Behav. Biomed. Mater. 2016, 60, 68–77. [Google Scholar] [CrossRef] [PubMed]
- Eisenbarth, E.; Velten, D.; Müller, M.; Thull, R.; Breme, J. Biocompatibility of β-stabilizing elements of titanium alloys. Biomaterials 2004, 25, 5705–5713. [Google Scholar] [CrossRef] [PubMed]
- Han, M.-K.; Hwang, M.-J.; Yang, M.-S.; Yang, H.-S.; Song, H.-J.; Park, Y.-J. Effect of zirconium content on the microstructure, physical properties and corrosion behavior of Ti alloys. Mater. Sci. Eng. A 2014, 616, 268–274. [Google Scholar] [CrossRef]
- Ho, W.F.; Ju, C.P.; Lin, J.C. Structure and properties of cast binary Ti-Mo alloys. Biomaterials 1999, 20, 2115–2122. [Google Scholar] [CrossRef]
- Trentani, L.; Pelillo, F.; Pavesi, F.C.; Ceciliani, L.; Cetta, G.; Forlino, A. Evaluation of the TiMo12Zr6Fe2 alloy for orthopaedic implants: In vitro biocompatibility study by using primary human fibroblasts and osteoblasts. Biomaterials 2002, 23, 2863–2869. [Google Scholar] [CrossRef]
- Gordin, D.M.; Gloriant, T.; Texier, G.; Thibon, I.; Ansel, D.; Duval, J.L.; Nagel, M.D. Development of a β-type Ti-12Mo-5Ta alloy for biomedical applications: Cytocompatibility and metallurgical aspects. J. Mater. Sci. Mater. Med. 2004, 15, 885–891. [Google Scholar] [CrossRef] [PubMed]
- Nag, S.; Banerjee, R.; Fraser, H.L. Microstructural evolution and strengthening mechanisms in Ti-Nb-Zr-Ta, Ti-Mo-Zr-Fe and Ti-15Mo biocompatible alloys. Mater. Sci. Eng. C 2005, 25, 357–362. [Google Scholar] [CrossRef]
- Yu, Z.T.; Wang, G.; Ma, X.Q.; Dargusch, M.S.; Han, J.Y.; Yu, S. Development of Biomedical Near β Titanium Alloys. Mater. Sci. Forum 2009, 618, 303–306. [Google Scholar] [CrossRef]
- Wang, K.; Gustavson, L.; Dumbleton, J. The characterization of Ti-12Mo-6Zr-2Fe a new biocompatible titanium alloy developed for surgical implants. In Beta Titanium in the 1990’s; The Mineral, Metals and Materials Society: Warrendale, PA, USA, 1993; pp. 2697–2704. [Google Scholar]
- Steinemann, S.G.; Mäusli, P.A.; Szmukler-Moncler, P.; Semlitsch, M.; Pohler, O.; Hintermann, H.E.; Perren, S.M. Beta-titanium alloy for surgical implants. In Beta Titanium in the 1990’; The Mineral, Metals and Materials Society: Warrendale, PA, USA, 1993; pp. 2689–2696. [Google Scholar]
- Helander, T.; Ågren, J. Diffusion in the B2-b.c.c. phase of the Al-Fe-Ni system—Application of a phenomenological model. Acta Mater. 1999, 47, 3291–3300. [Google Scholar] [CrossRef]
- Chen, Q.; Ma, N.; Wu, K.; Wang, Y. Quantitative phase field modeling of diffusion-controlled precipitate growth and dissolution in Ti-Al-V. Scr. Mater. 2004, 50, 471–476. [Google Scholar] [CrossRef]
- Mao, C.; Tan, M.; Zhang, L.; Wu, D.; Bai, W.; Liu, L. Experimental reinvestigation and thermodynamic description of Bi-Te binary system. Calphad 2018, 60, 81–89. [Google Scholar] [CrossRef]
- Chen, F.; Xu, G.; Zhang, X.; Zhou, K. Exploring the Phase Transformation in β-Quenched Ti-55531 Alloy During Continuous Heating via Dilatometric Measurement, Microstructure Characterization, and Diffusion Analysis. Metall. Mater. Trans. A 2016, 1–12. [Google Scholar] [CrossRef]
- Zhang, L.; Stratmann, M.; Du, Y.; Sundman, B.; Steinbach, I. Incorporating the CALPHAD sublattice approach of ordering into the phase-field model with finite interface dissipation. Acta Mater. 2015, 88, 156–169. [Google Scholar] [CrossRef]
- Andersson, J.-O.; Ågren, J. Models for numerical treatment of multicomponent diffusion in simple phases. J. Appl. Phys. 1992, 72, 1350–1355. [Google Scholar] [CrossRef]
- Borgenstam, A.; Höglund, L.; Ågren, J.; Engström, A. DICTRA, a tool for simulation of diffusional transformations in alloys. J. Phase Equilib. 2000, 21, 269. [Google Scholar] [CrossRef]
- Andersson, J.-O.; Helander, T.; Höglund, L.; Shi, P.; Sundman, B. Thermo-Calc & DICTRA, computational tools for materials science. Calphad 2002, 26, 273–312. [Google Scholar] [CrossRef]
- Neumann, G.; Tuijn, C. Self-Diffusion and Impurity Diffusion in Pure Metals: Handbook of Experimental Data, 1st ed.; Pergamon: Oxford, UK, 2009. [Google Scholar]
- Heumann, T.; Imm, R. Untersuchungen über den Kirkendall-Effekt in kub. raumzentrierten Titan-Molybdän Legierungen; Forschungsberichte des Landes Nordrhein-Westfalen; VS Verlag für Sozialwissenschaften: Wiesbaden, Germany, 1978. [Google Scholar]
- Thibon, I.; Ansel, D.; Baliveau, M.; Debuigne, J. Interdiffusion in the β Mo-Ti solid solution at high temperatures. Z. Metallkd. 1998, 89, 187–191. [Google Scholar]
- Sprengel, W.; Yamada, T.; Nakajima, H. Interdiffusion in Binary β-Titanium Alloys. Defect Diffusion Forum 1997, 143, 431–436. [Google Scholar] [CrossRef]
- Thibon, I.; Ansel, D.; Gloriant, T. Interdiffusion in β-Ti-Zr binary alloys. J. Alloys Compd. 2009, 470, 127–133. [Google Scholar] [CrossRef]
- Brunsch, A.; Steeb, S. Diffusionsuntersuchungen im System Ti-Zr mittels Mikrosonde / Interdiffusion in the System Ti-Zr. Z. Naturforsch. A 1974, 29, 1319–1324. [Google Scholar] [CrossRef]
- Raghunathan, V.S.; Tiwari, G.P.; Sharma, B.D. Chemical diffusion in the β phase of the Zr-Ti alloy system. Metallogr. Trans. 1972, 3, 783–788. [Google Scholar] [CrossRef]
- Bhanumurthy, K.; Laik, A.; Kale, G.B. Novel Method of Evaluation of Diffusion Coefficients in Ti-Zr System. In Phase Transformation and Diffusion; Defect and Diffusion Forum; Trans Tech Publications: Zurich, Switzerland, 2008; pp. 53–62. [Google Scholar]
- Bhatt, Y.J.; Kumar, L.; Patil, R.V.; Kale, G.B.; Garg, S.P. Diffusion studies in Hf-Mo, Zr-Mo, Cr-Nb, Cr-Ta and Th-Re systems above 1900 K. J. Alloys Compd. 2000, 302, 177–186. [Google Scholar] [CrossRef]
- Liu, Y.; Zhang, L.; Yu, D. Computational Study of Mobilities and Diffusivities in bcc Ti-Zr and bcc Ti-Mo Alloys. J. Phase Equilib. Diffus. 2009, 30, 334–344. [Google Scholar] [CrossRef]
- Liu, Y.; Wang, G.; Wang, J.; Kang, Z. Mobilities and diffusivities for bcc Nb-W, Nb-Ta, Zr-Mo and Zr-Hf alloys. J. Alloys Compd. 2013, 555, 381–389. [Google Scholar] [CrossRef]
- Kirkaldy, J.S. Diffusion in Multicomponent Metallic Systems. Can. J. Phys. 1957, 35, 435–440. [Google Scholar] [CrossRef]
- Whittle, D.P.; Green, A. The measurement of diffusion coefficients in ternary systems. Scr. Metall. 1974, 8, 883–884. [Google Scholar] [CrossRef]
- Chen, Y.; Tang, B.; Xu, G.; Wang, C.; Kou, H.; Li, J.; Cui, Y. Diffusion Research in BCC Ti-Al-Mo Ternary Alloys. Metall. Mater. Trans. A 2014, 45, 1647–1652. [Google Scholar] [CrossRef]
- Hall, L.D. An Analytical Method of Calculating Variable Diffusion Coefficients. J. Chem. Phys. 1953, 21, 87–89. [Google Scholar] [CrossRef]
- Jönsson, B. Assessment of the mobility of carbon in fcc C-Cr-Fe-Ni alloys. Z. Metallkd. 1994, 85, 502–509. [Google Scholar]
- Shim, J.-H.; Oh, C.-S.; Lee, D.N. A thermodynamic evaluation of the Ti-Mo-C system. Metall. Mater. Trans. B 1996, 27, 955–966. [Google Scholar] [CrossRef]
- Turchanin, M.A.; Agraval, P.G.; Abdulov, A.R. Thermodynamic assessment of the Cu-Ti-Zr system. II. Cu-Zr and Ti-Zr systems. Powder. Metall. Metal Cream. 2008, 47, 428. [Google Scholar] [CrossRef]
- Jerlerud Pérez, R.; Sundman, B. Thermodynamic assessment of the Mo–Zr binary phase diagram. Calphad 2003, 27, 253–262. [Google Scholar] [CrossRef]
- Watson, A. Molybdenum-Titanium-Zirconium. In Refractory metal systems; Springer: Berlin/Heidelberg, Germany, 2010; pp. 441–454. [Google Scholar]
- Wang, C.; Xu, G.; Cui, Y. Mapping of Diffusion and Nanohardness Properties of Fcc Co-Al-V Alloys Using Ternary Diffusion Couples. Metall. Mater. Trans. A 2017, 48, 4286–4296. [Google Scholar] [CrossRef]
- Kirkaldy, J.S.; Weichert, D.; Haq, Z.U. Diffusion in Multicomponent Metallic Systems: Vi. Some Thermodynamic Properties of the D Matrix and the Corresponding Solutions of the Diffusion Equations. Can. J. Phys. 1963, 41, 2166–2173. [Google Scholar] [CrossRef]
Figure 1.
Phase diagram of (a) Ti-Mo [40], (b) Ti-Zr [41], (c) Zr-Mo [42], and (d) Ti-Mo-Zr [43] systems.

Figure 2.
(a) Microstructure (BSE) of the diffusion couple M1 annealed at 1373 K for 72 h and the robust error function expansion (ERFEX) representation of the composition-distance profiles of the different couples annealed in 1373 K for 72 h: (b) for M2; (c) for M6; (d) for M8.
Figure 2.
(a) Microstructure (BSE) of the diffusion couple M1 annealed at 1373 K for 72 h and the robust error function expansion (ERFEX) representation of the composition-distance profiles of the different couples annealed in 1373 K for 72 h: (b) for M2; (c) for M6; (d) for M8.

Figure 3.
Diffusion paths of diffusion couples determined using electron probe micro-analysis (EPMA) after annealing process.
Figure 3.
Diffusion paths of diffusion couples determined using electron probe micro-analysis (EPMA) after annealing process.

Figure 4.
Three-dimensional (3D) plot of the ternary inter-diffusion coefficients (a) , (b) , (c) and (d) in the bcc Ti-Mo-Zr alloys at 1373 K, together with the impurity diffusion coefficients and , and binary diffusion coefficients obtained from the literature [33].
Figure 4.
Three-dimensional (3D) plot of the ternary inter-diffusion coefficients (a) , (b) , (c) and (d) in the bcc Ti-Mo-Zr alloys at 1373 K, together with the impurity diffusion coefficients and , and binary diffusion coefficients obtained from the literature [33].

Figure 5.
The variation of ternary inter-diffusion coefficients with the compositions: (a) with Mo, (b) with Zr, (c) with Mo and (d) with Zr at 1373 K.
Figure 5.
The variation of ternary inter-diffusion coefficients with the compositions: (a) with Mo, (b) with Zr, (c) with Mo and (d) with Zr at 1373 K.
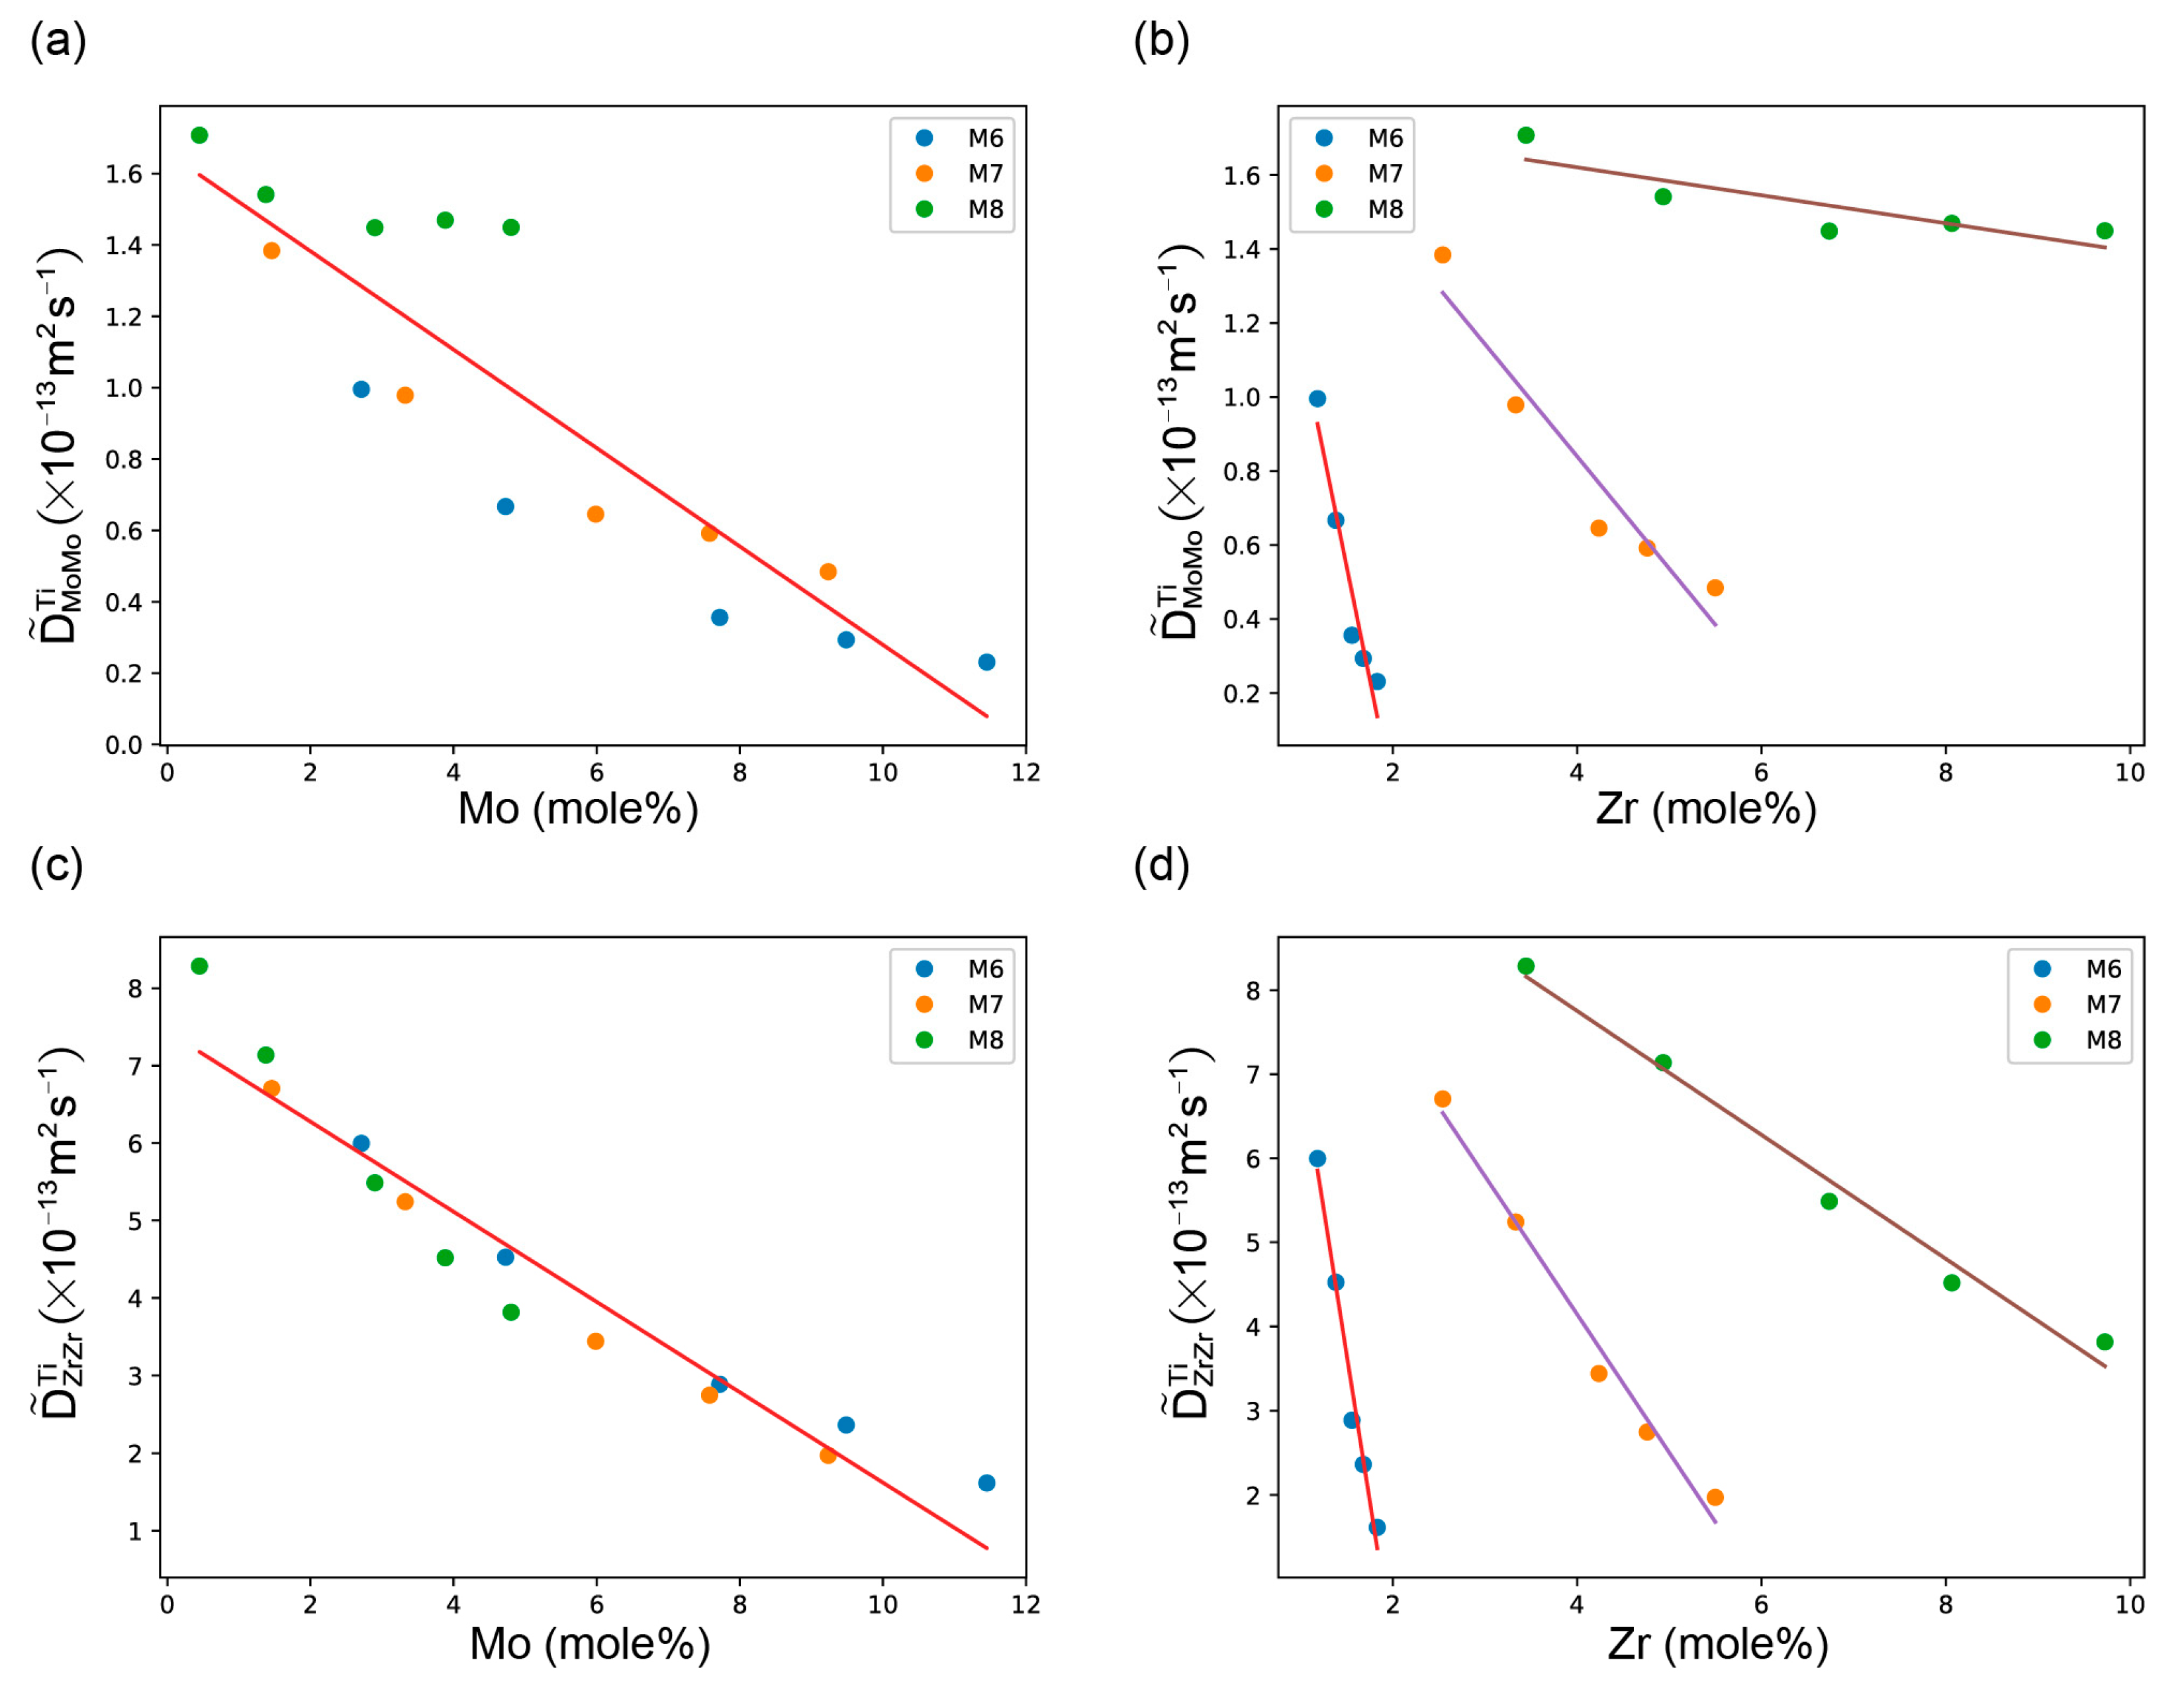
Figure 6.
The 3D plot of the ternary inter-diffusion coefficients (a) , (b) , (c) , and (d) in the bcc Ti-Mo-Zr alloys and the variation of ternary inter-diffusion coefficients with the compositions: (e) with Mo, (f) with Zr, (g) with Mo, and (h) with Zr at 1473 K.
Figure 6.
The 3D plot of the ternary inter-diffusion coefficients (a) , (b) , (c) , and (d) in the bcc Ti-Mo-Zr alloys and the variation of ternary inter-diffusion coefficients with the compositions: (e) with Mo, (f) with Zr, (g) with Mo, and (h) with Zr at 1473 K.

Figure 7.
Calculated inter-diffusion coefficients of the ternary Ti-Mo-Zr system compared with the experimental measurements (in brackets) in this work: (a) , (b) , (c) and (d) at 1373 K and (e) , (f) , (g) and (h) at 1473 K.
Figure 7.
Calculated inter-diffusion coefficients of the ternary Ti-Mo-Zr system compared with the experimental measurements (in brackets) in this work: (a) , (b) , (c) and (d) at 1373 K and (e) , (f) , (g) and (h) at 1473 K.
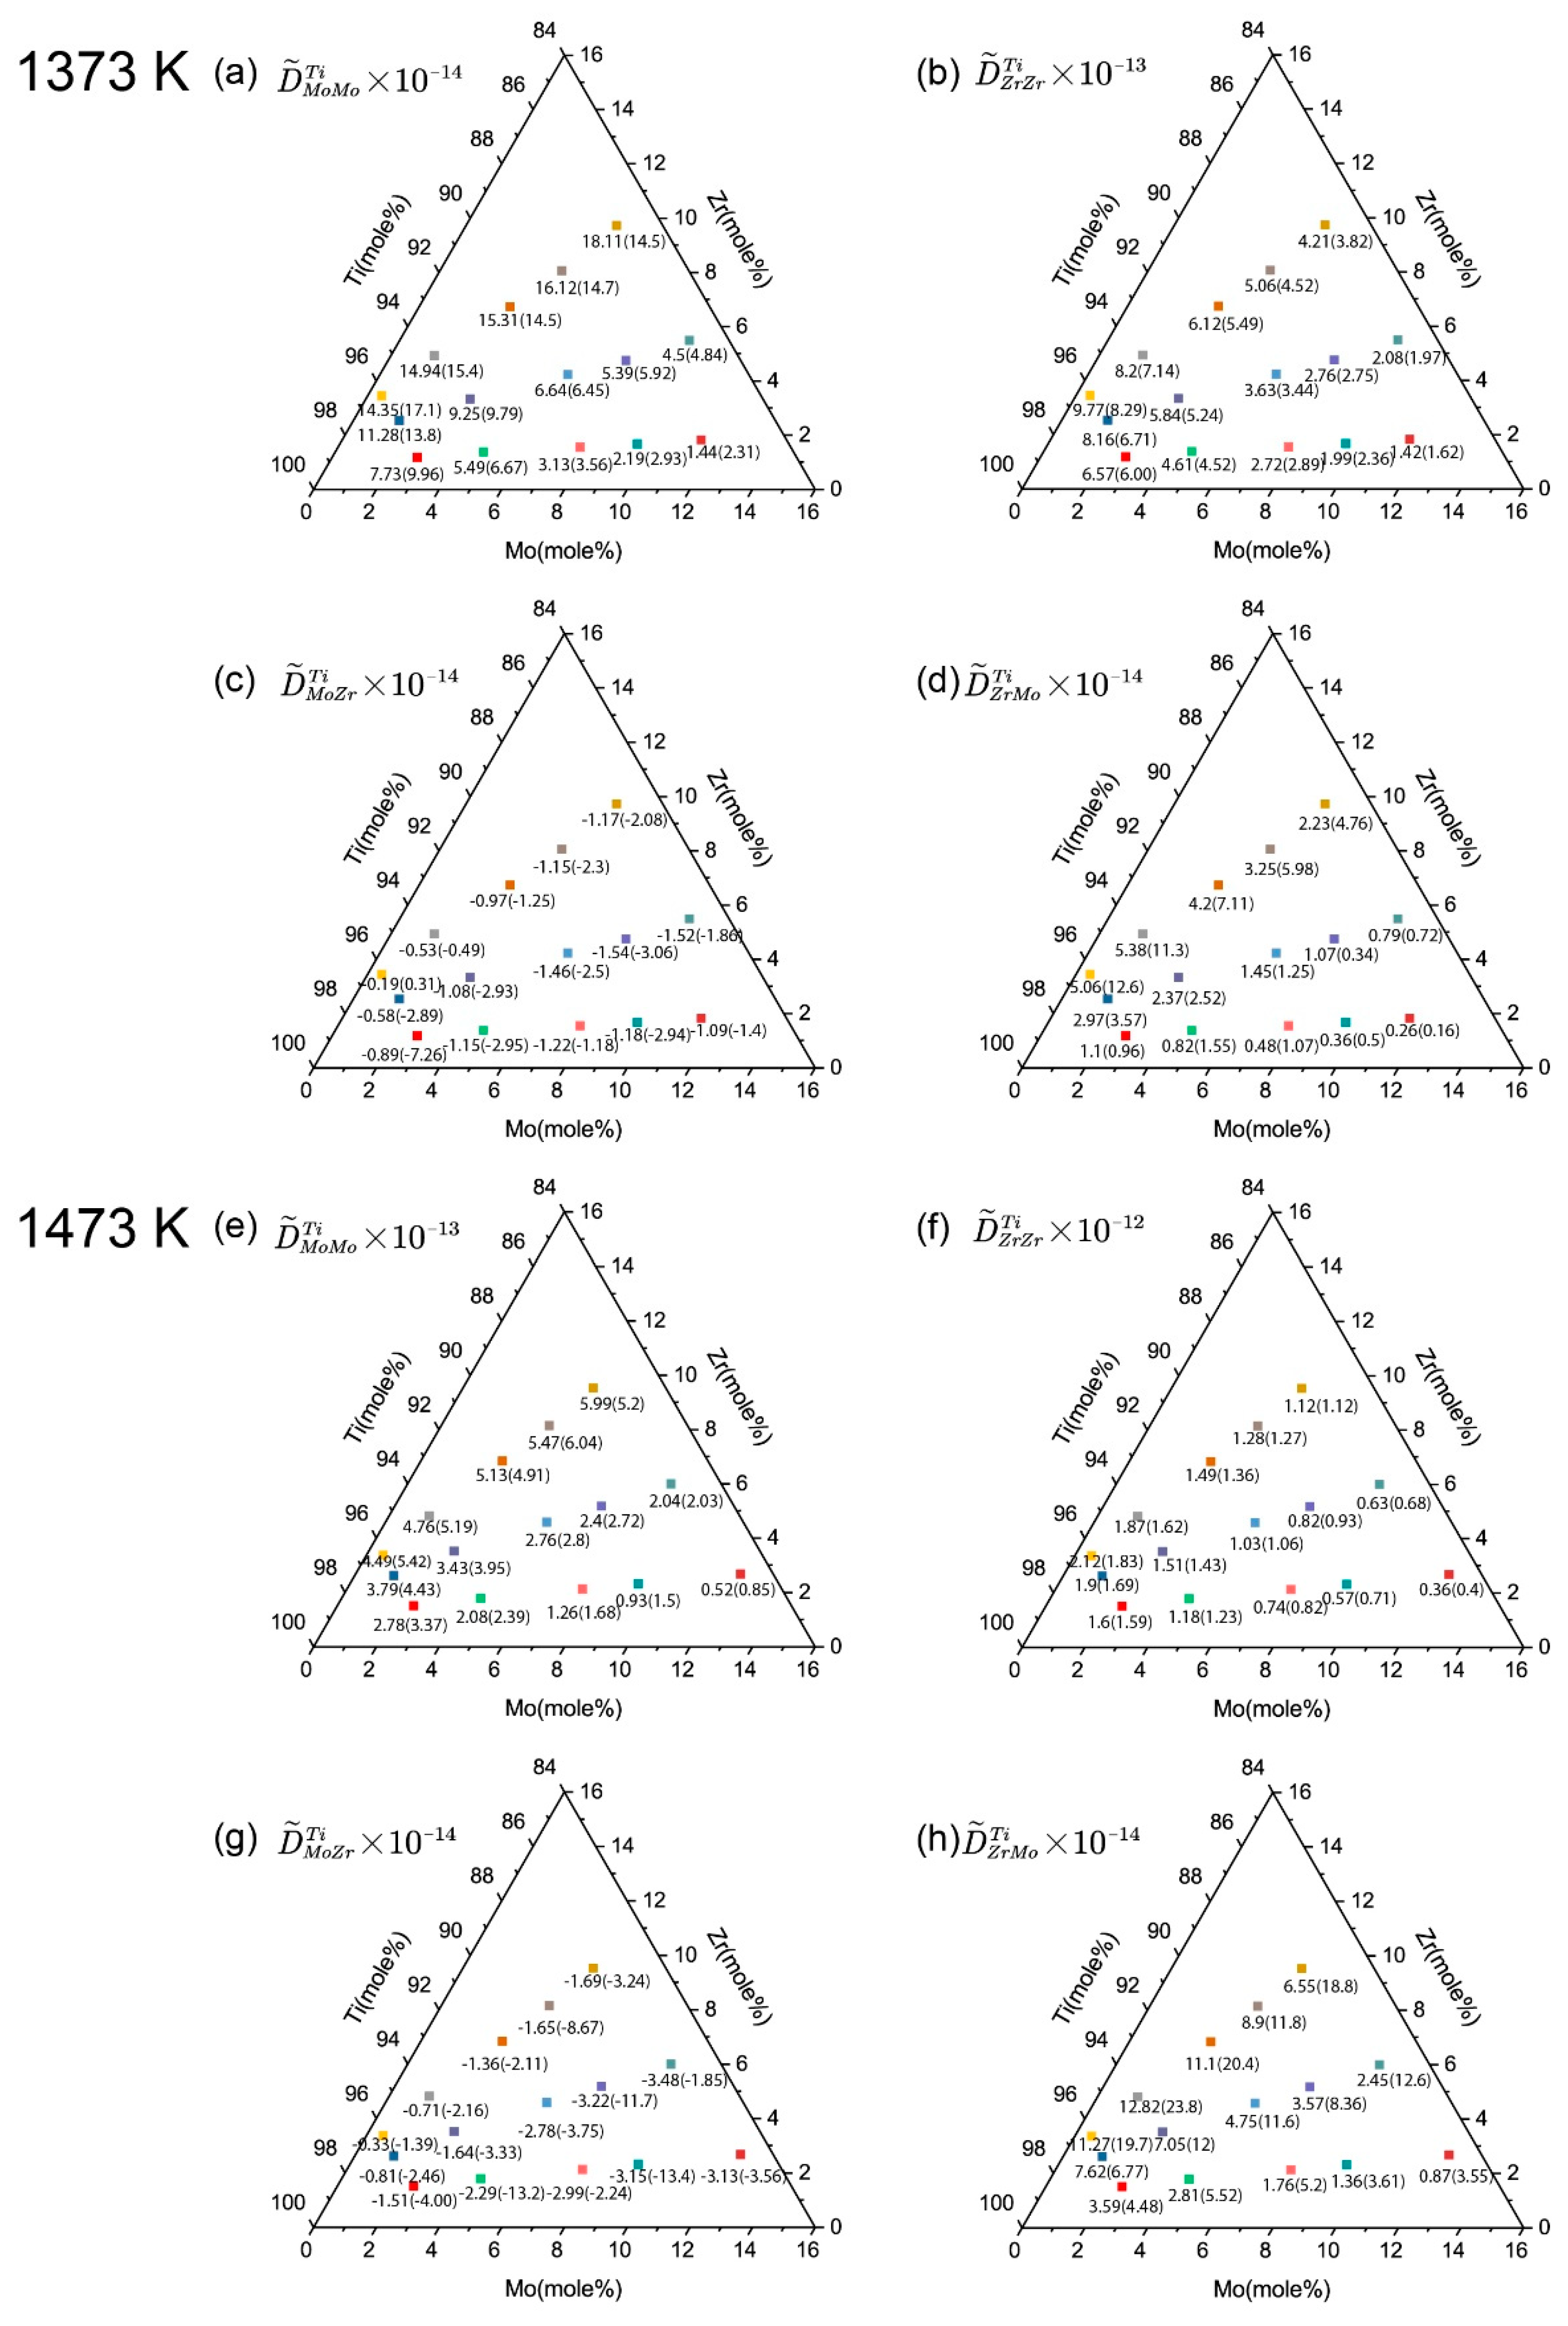
Figure 8.
Calculated impurity diffusion coefficients (a) and (b) as compared with the experimental data.
Figure 8.
Calculated impurity diffusion coefficients (a) and (b) as compared with the experimental data.

Figure 9.
Predicted composition-distance profiles and inter-diffusion fluxes of M3 and N8 as compared with experimental data.
Figure 9.
Predicted composition-distance profiles and inter-diffusion fluxes of M3 and N8 as compared with experimental data.

Figure 10.
Simulated diffusion paths for diffusion couples compared with the experimental measurements: (a) 1373 K and (b) 1473 K.
Figure 10.
Simulated diffusion paths for diffusion couples compared with the experimental measurements: (a) 1373 K and (b) 1473 K.

Table 1.
Compositions of diffusion couples.
| Temperature (K) | Diffusion Couples | Composition (mole %) |
|---|---|---|
| 1373 | M1 | Ti-2.95Mo/Ti-4.95Zr |
| M2 | Ti-4.90Mo/Ti-7.81Zr | |
| M3 | Ti-7.83Mo/Ti-11.17Zr | |
| M4 | Ti-9.74Mo/Ti-13.64Zr | |
| M5 | Ti-11.61Mo/Ti-16.57Zr | |
| M6 | Pure Ti/Ti-17.18Mo-5.48Zr | |
| M7 | Pure Ti/Ti-11.63Mo-11.51Zr | |
| M8 | Pure Ti/Ti-5.91Mo-16.90Zr | |
| 1473 | N1 | Ti-2.85Mo/Ti-4.85Zr |
| N2 | Ti-4.92Mo/Ti-7.39Zr | |
| N3 | Ti-7.90Mo/Ti-11.02Zr | |
| N4 | Ti-9.90Mo/Ti-13.27Zr | |
| N5 | Ti-13.11Mo/Ti-15.15Zr | |
| N6 | Pure Ti/Ti-17.14Mo-5.81Zr | |
| N7 | Pure Ti/Ti-11.67Mo-11.61Zr | |
| N8 | Pure Ti/Ti-5.91Mo-17.32Zr |
Table 2.
Inter-diffusion coefficients in the bcc Ti-Mo-Zr alloys at 1373 K and 1473 K.
| Temp. (K) | Diffusion Couple | Intersection Composition (mole %) | Inter-Diffusion Coefficients (m2·s−1) | ||||
|---|---|---|---|---|---|---|---|
| Mo | Zr | ||||||
| ×10−14 | ×10−14 | ×10−14 | ×10−13 | ||||
| 1373 | M1-M6 | 2.71 | 1.18 | 9.96 ± 1.12 | −7.26 ± 5.24 | 0.96 ± 0.38 | 6.00 ± 0.42 |
| M1-M7 | 1.46 | 2.54 | 13.84 ± 0.56 | −2.89 ± 1.72 | 3.57 ± 2.24 | 6.71 ± 0.37 | |
| M1-M8 | 0.45 | 3.45 | 17.08 ± 1.81 | 0.31 ± 0.25 | 12.63 ± 5.54 | 8.29 ± 0.31 | |
| M2-M6 | 4.73 | 1.38 | 6.67 ± 0.60 | −2.95 ± 1.93 | 1.55 ± 0.20 | 4.52 ± 0.11 | |
| M2-M7 | 3.32 | 3.33 | 9.79 ± 0.25 | −2.93 ± 0.27 | 2.52 ± 1.47 | 5.24 ± 0.10 | |
| M2-M8 | 1.38 | 4.93 | 15.41 ± 0.56 | −0.49 ± 0.33 | 11.30 ± 1.09 | 7.14 ± 0.10 | |
| M3-M6 | 7.72 | 1.56 | 3.56 ± 0.41 | −1.18 ± 0.41 | 1.07 ± 0.13 | 2.89 ± 0.10 | |
| M3-M7 | 5.99 | 4.24 | 6.45 ± 0.11 | −2.50 ± 0.36 | 1.25 ± 0.60 | 3.44 ± 0.15 | |
| M3-M8 | 2.90 | 6.74 | 14.48 ± 0.28 | −1.25 ± 0.48 | 7.11 ± 0.99 | 5.49 ± 0.15 | |
| M4-M6 | 9.49 | 1.68 | 2.93 ± 0.17 | −2.94 ± 1.04 | 0.50 ± 0.15 | 2.36 ± 0.06 | |
| M4-M7 | 7.58 | 4.76 | 5.92 ± 0.28 | −3.06 ± 0.58 | 0.34 ± 0.71 | 2.75 ± 0.14 | |
| M4-M8 | 3.88 | 8.07 | 14.69 ± 0.93 | −2.30 ± 0.84 | 5.98 ± 1.07 | 4.52 ± 0.04 | |
| M5-M6 | 11.45 | 1.83 | 2.31 ± 0.29 | −1.40 ± 1.31 | 0.16 ± 0.46 | 1.62 ± 0.06 | |
| M5-M7 | 9.24 | 5.50 | 4.84 ± 0.60 | −1.86 ± 0.68 | 0.72 ± 0.78 | 1.97 ± 0.02 | |
| M5-M8 | 4.80 | 9.73 | 14.49 ± 1.04 | −2.08 ± 0.50 | 4.76 ± 3.54 | 3.82 ± 0.16 | |
| ×10−13 | ×10−14 | ×10−13 | ×10−12 | ||||
| 1473 | N1-N6 | 1.524 | 3.605 | 3.37 ± 0.18 | −4.00 ± 2.19 | 0.45 ± 0.22 | 1.59 ± 0.06 |
| N1-N7 | 2.597 | 1.898 | 4.43 ± 0.01 | −2.46 ± 1.08 | 0.68 ± 0.40 | 1.69 ± 0.02 | |
| N1-N8 | 3.365 | 0.81 | 5.42 ± 0.13 | −1.39 ± 1.30 | 1.97 ± 1.16 | 1.83 ± 0.05 | |
| N2-N6 | 1.707 | 4.399 | 2.39 ± 0.19 | −13.24 ± 4.86 | 0.55 ± 0.06 | 1.23 ± 0.01 | |
| N2-N7 | 3.589 | 3.386 | 3.95 ± 0.12 | −3.33 ± 2.17 | 1.20 ± 0.23 | 1.43 ± 0.03 | |
| N2-N8 | 5.701 | 1.951 | 5.19 ± 0.12 | −2.16 ± 1.40 | 2.38 ± 0.21 | 1.62 ± 0.02 | |
| N3-N6 | 2.43 | 8.144 | 1.68 ± 0.04 | −2.24 ± 2.12 | 0.52 ± 0.09 | 0.82 ± 0.02 | |
| N3-N7 | 4.724 | 5.243 | 2.80 ± 0.05 | −3.75 ± 0.51 | 1.16 ± 0.15 | 1.06 ± 0.02 | |
| N3-N8 | 6.881 | 2.508 | 4.91 ± 0.08 | −2.11 ± 0.76 | 2.04 ± 0.51 | 1.36 ± 0.03 | |
| N4-N6 | 2.552 | 8.725 | 1.50 ± 0.09 | −13.40 ± 4.90 | 0.36 ± 0.10 | 0.71 ± 0.01 | |
| N4-N7 | 5.489 | 6.461 | 2.72 ± 0.17 | −11.73 ± 2.86 | 0.84 ± 0.06 | 0.93 ± 0.01 | |
| N4-N8 | 8.913 | 3.466 | 6.04 ± 0.46 | −8.67 ± 2.82 | 1.18 ± 0.19 | 1.27 ± 0.02 | |
| N5-N6 | 3.438 | 12.795 | 0.85 ± 0.03 | −3.56 ± 1.06 | 0.36 ± 0.06 | 0.40 ± 0.01 | |
| N5-N7 | 6.723 | 8.091 | 2.03 ± 0.07 | −1.85 ± 0.97 | 1.26 ± 0.26 | 0.68 ± 0.01 | |
| N5-N8 | 9.993 | 3.932 | 5.20 ± 0.44 | −3.24 ± 2.66 | 1.88 ± 0.66 | 1.12 ± 0.03 | |
Table 3.
Impurity diffusion coefficients of Zr in Ti-Mo and Mo in Ti-Zr alloys at 1373 K and 1473 K.
Table 3.
Impurity diffusion coefficients of Zr in Ti-Mo and Mo in Ti-Zr alloys at 1373 K and 1473 K.
| Temperature/K | Composition | Impurity Diffusion Coefficients (×10−13 m2·s−1) | Composition | Impurity Diffusion Coefficients (×10−13 m2·s−1) |
|---|---|---|---|---|
| 1373 | 5.85 ± 0.58 | 1.54 ± 0.09 | ||
| 4.51 ± 0.88 | 1.96 ± 0.62 | |||
| 2.55 ± 0.05 | 2.86 ± 0.71 | |||
| 2.13 ± 0.14 | 4.37 ± 1.68 | |||
| 1.39 ± 0.15 | 5.07 ± 1.45 | |||
| 1473 | 15.45 ± 1.22 | 5.04 ± 1.24 | ||
| 11.31 ± 0.74 | 6.42 ± 2.38 | |||
| 7.24 ± 0.07 | 9.78 ± 1.82 | |||
| 6.08 ± 0.26 | 12.61 ± 3.46 | |||
| 3.04 ± 0.17 | 14.66 ± 2.39 |
Table 4.
Atomic mobility parameters for the bcc phase of the Ti-Mo-Zr ternary system.
| Mobility | Parameter, J/mole | Reference |
|---|---|---|
| Mobility of Mo | ||
| −479740.87 − 63.98·T | [33] | |
| −196255.40 − 105.21·T | [33] | |
| −154895.63 − 140.91·T (T ≤ 1450 K) −214913.77 − 114.17·T (T ≥ 1450 K) | [34] | |
| −24153.22 − 45.32·T | [33] | |
| −61804.04 | [33] | |
| 150325.48 + 10.03·T | [34] | |
| −268357.13 + 283.18·T | This work | |
| 53485.75 | This work | |
| 2707991.87 | This work | |
| −719018.41 | This work | |
| Mobility of Ti | ||
| −435701.23 − 72.67·T | [33] | |
| −151989.95 − 127.37·T | [33] | |
| −140356.54 − 138.12·T | [33] | |
| −91728.48 + 64.56·T | [33] | |
| −96300.05 | [33] | |
| −15826.04 + 62.55·T | [33] | |
| 8243.54 | [33] | |
| −1304851.67 | This work | |
| −6019149.28 | This work | |
| −1128202.89 | This work | |
| Mobility of Zr | ||
| −464587.32 − 64.72·T | [34] | |
| −131670.56 − 133.36·T | [33] | |
| −104624.81 − 163.15·T (T≤1573 K) −161543.53 − 126.10·T (T≥1573 K) | [33] | |
| −81189.65 + 88.51·T | This work | |
| 210325.67 + 15.19·T | [34] | |
| −12581.03 + 33.38·T | [33] | |
| 2898.60 | [33] | |
| 2864755.37 | This work | |
| −340701.76 | This work | |
| −609499.74 | This work |
© 2018 by the authors. Licensee MDPI, Basel, Switzerland. This article is an open access article distributed under the terms and conditions of the Creative Commons Attribution (CC BY) license (http://creativecommons.org/licenses/by/4.0/).
Share and Cite
MDPI and ACS Style
Bai, W.; Xu, G.; Tan, M.; Yang, Z.; Zeng, L.; Wu, D.; Liu, L.; Zhang, L. Diffusivities and Atomic Mobilities in bcc Ti-Mo-Zr Alloys. Materials 2018, 11, 1909. https://doi.org/10.3390/ma11101909
AMA Style
Bai W, Xu G, Tan M, Yang Z, Zeng L, Wu D, Liu L, Zhang L. Diffusivities and Atomic Mobilities in bcc Ti-Mo-Zr Alloys. Materials. 2018; 11(10):1909. https://doi.org/10.3390/ma11101909
Chicago/Turabian StyleBai, Weimin, Guanglong Xu, Mingyue Tan, Zhijie Yang, Lijun Zeng, Di Wu, Libin Liu, and Ligang Zhang. 2018. "Diffusivities and Atomic Mobilities in bcc Ti-Mo-Zr Alloys" Materials 11, no. 10: 1909. https://doi.org/10.3390/ma11101909
Note that from the first issue of 2016, this journal uses article numbers instead of page numbers. See further details here.