Investigation of Zirconium Effect on the Corrosion Resistance of Aluminum Alloy Using Electrochemical Methods and Numerical Simulation in an Acidified Synthetic Sea Salt Solution

 ,
,
Abstract
:1. Introduction
2. Experimental Methods
2.1. Specimens and Solution Preparation
2.2. Electrochemical Tests
2.3. Analysis of IMPs
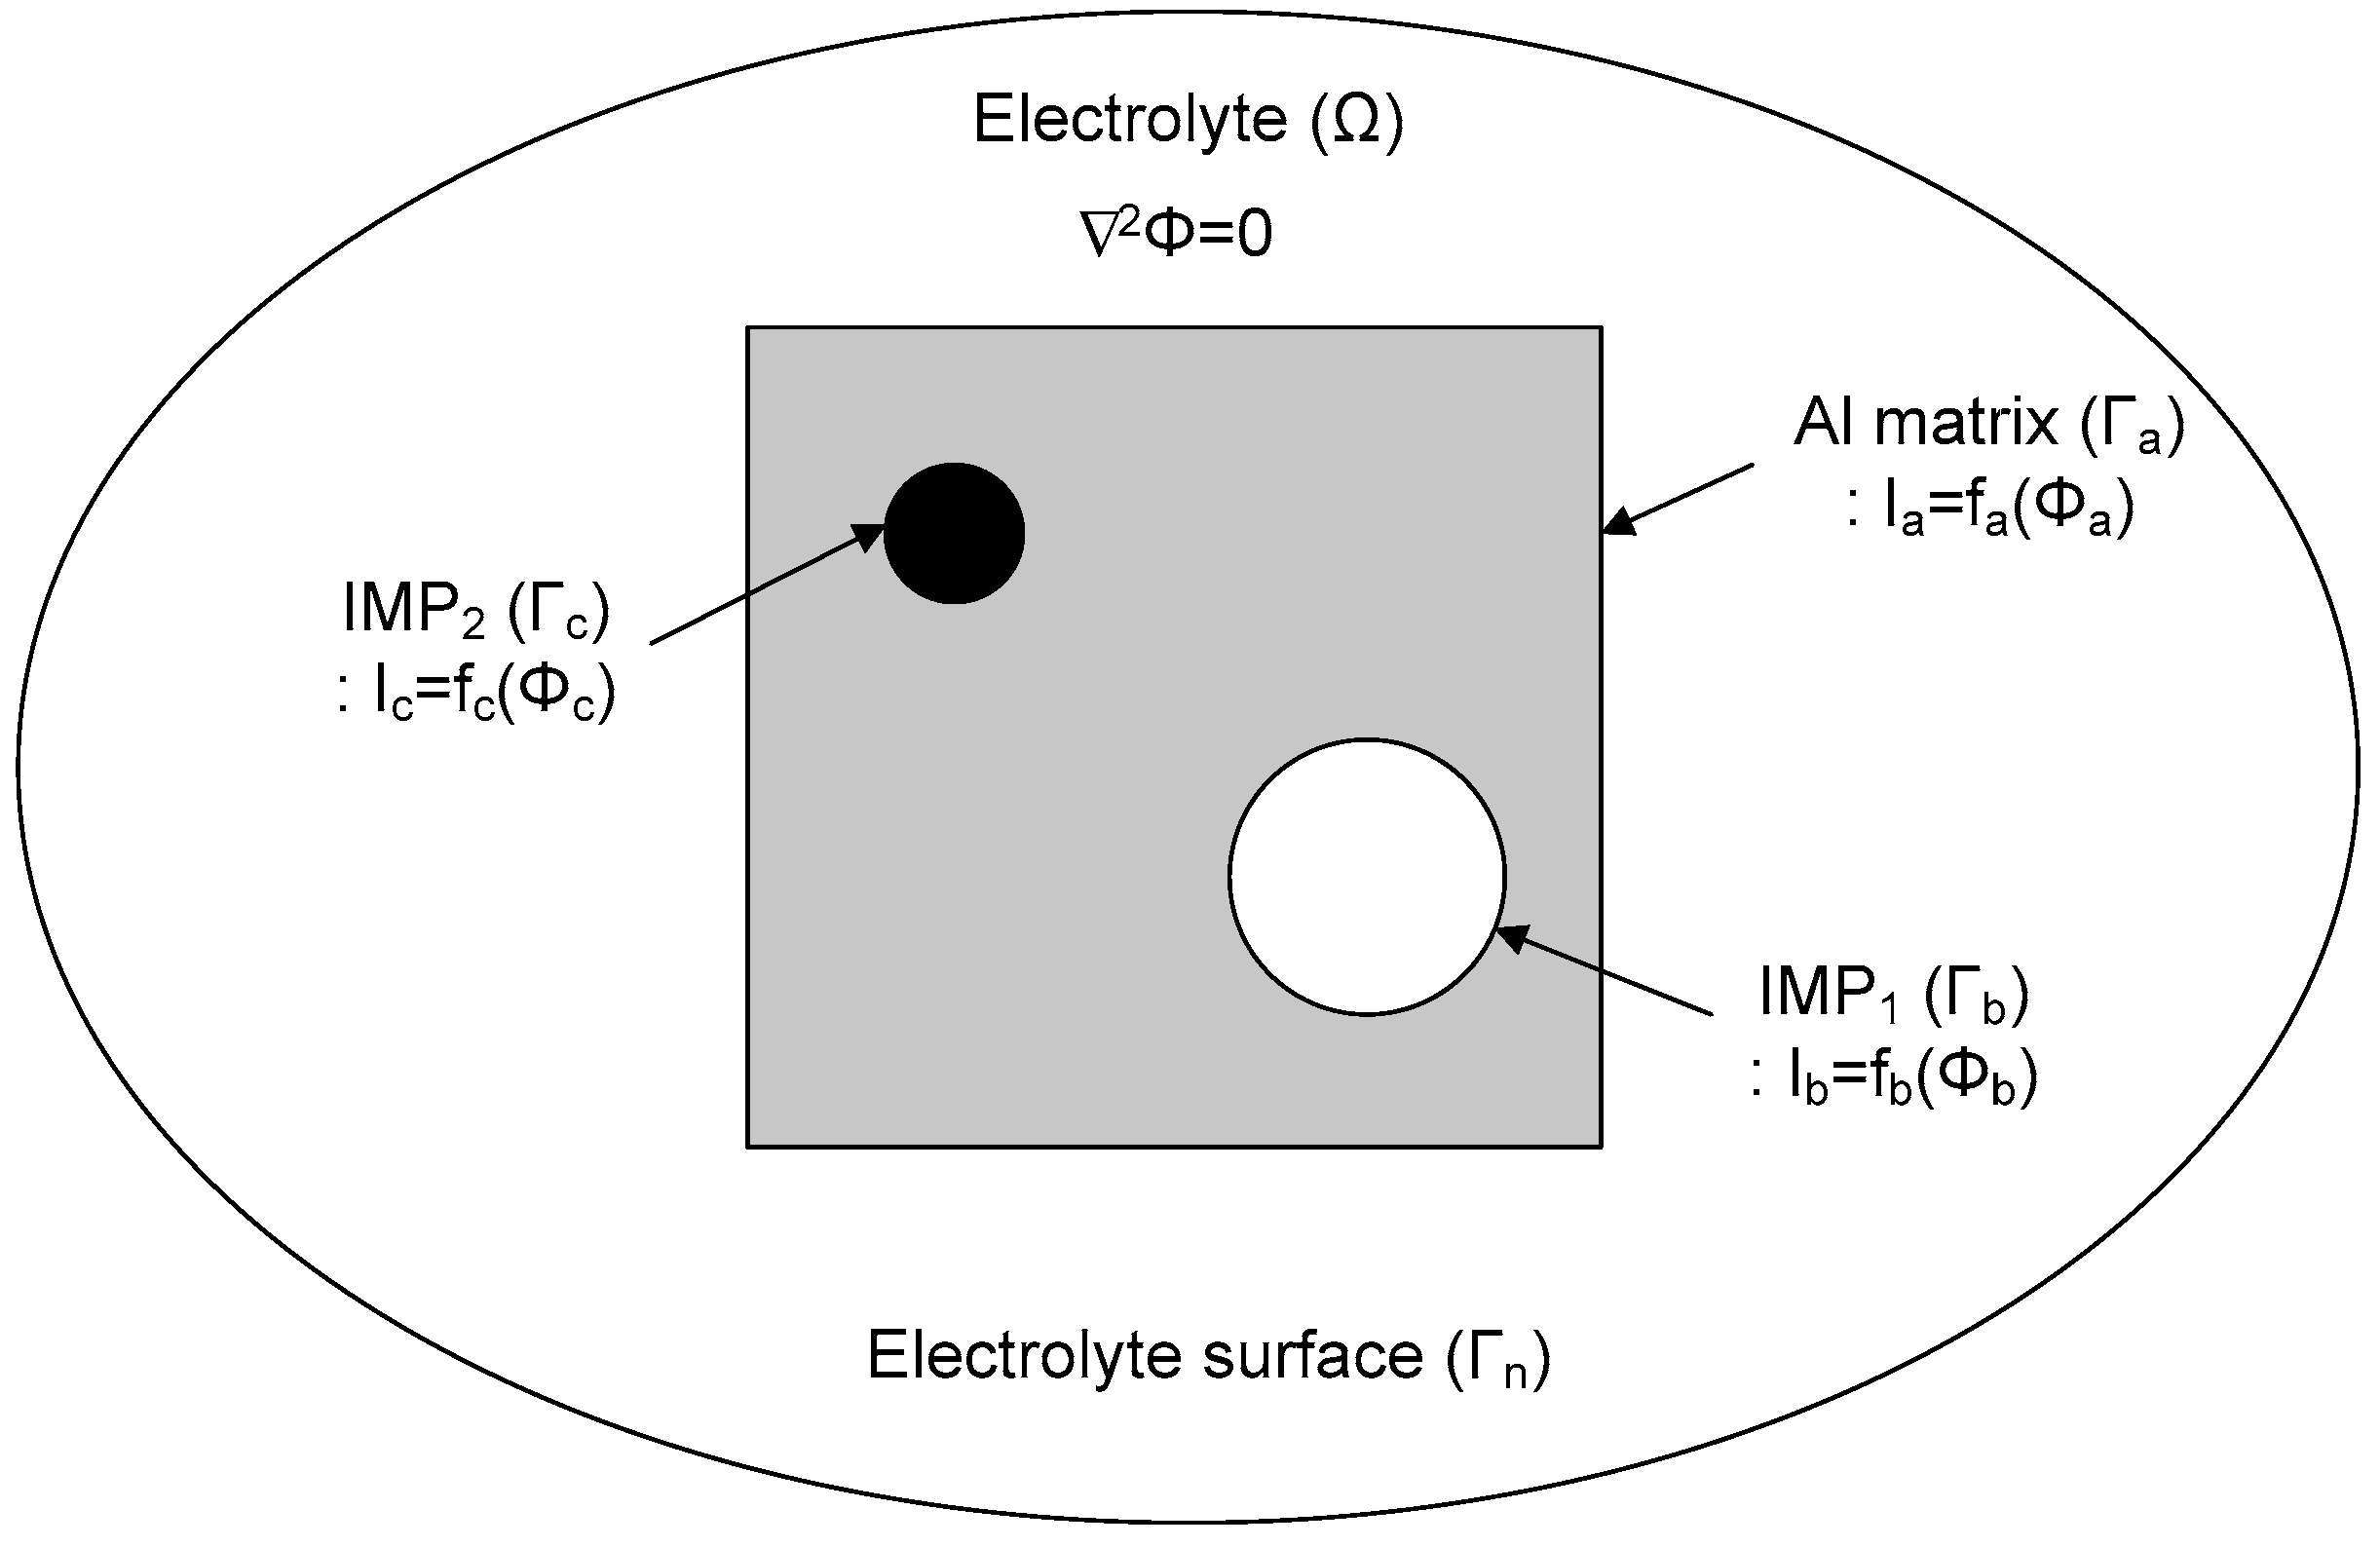
2.4. Modeling and Boundary Conditions
3. Results and Discussion
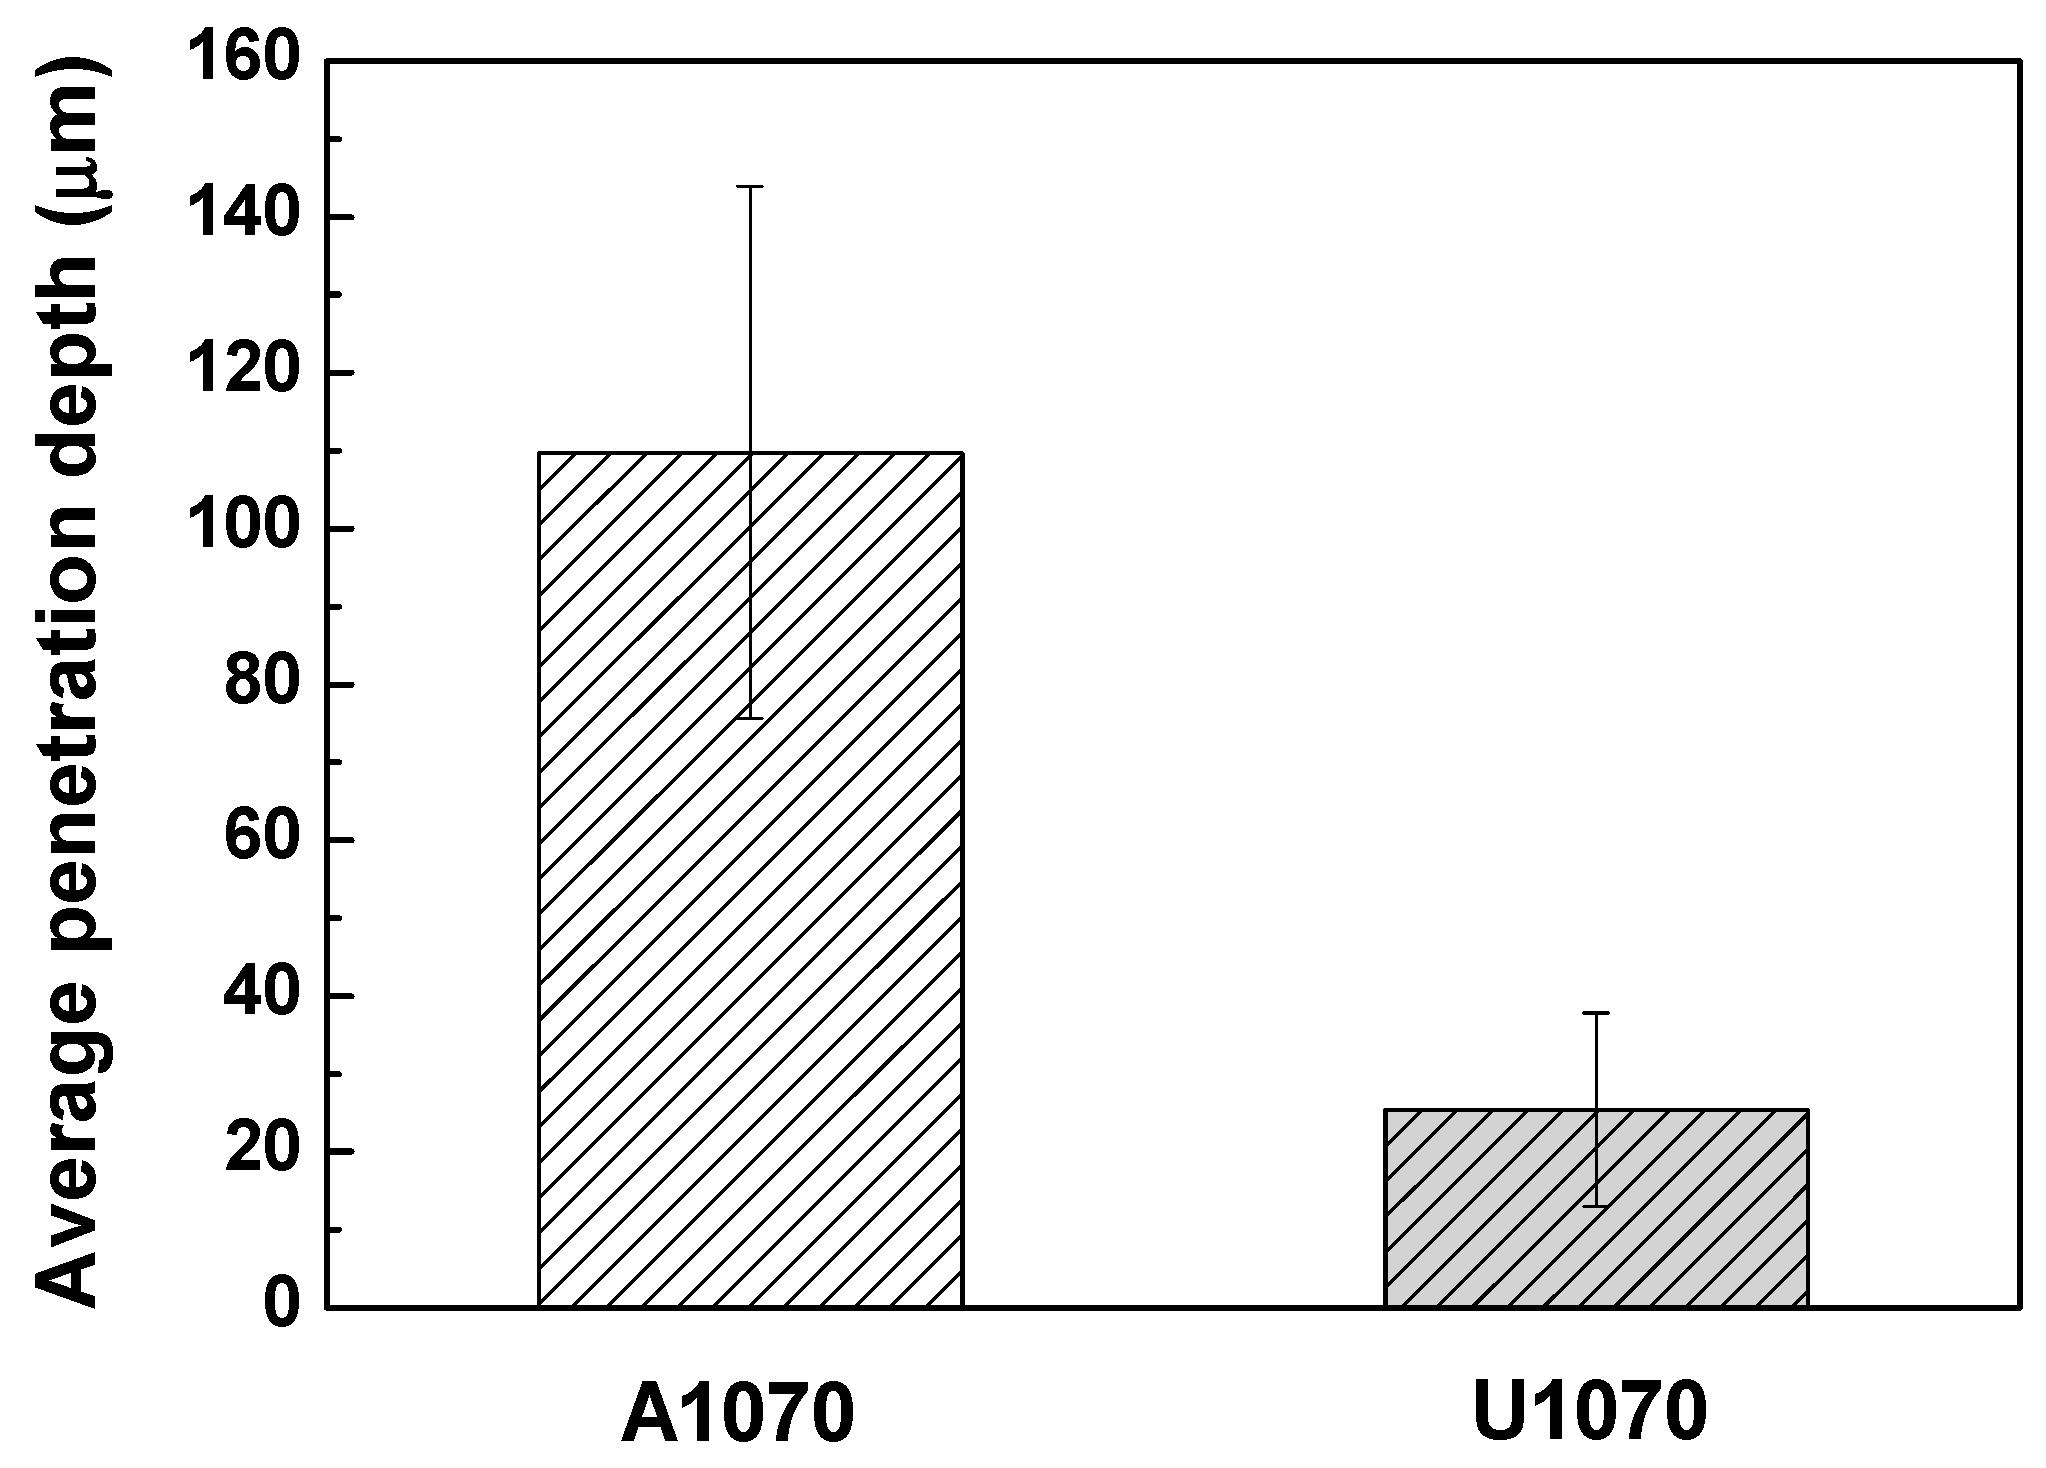
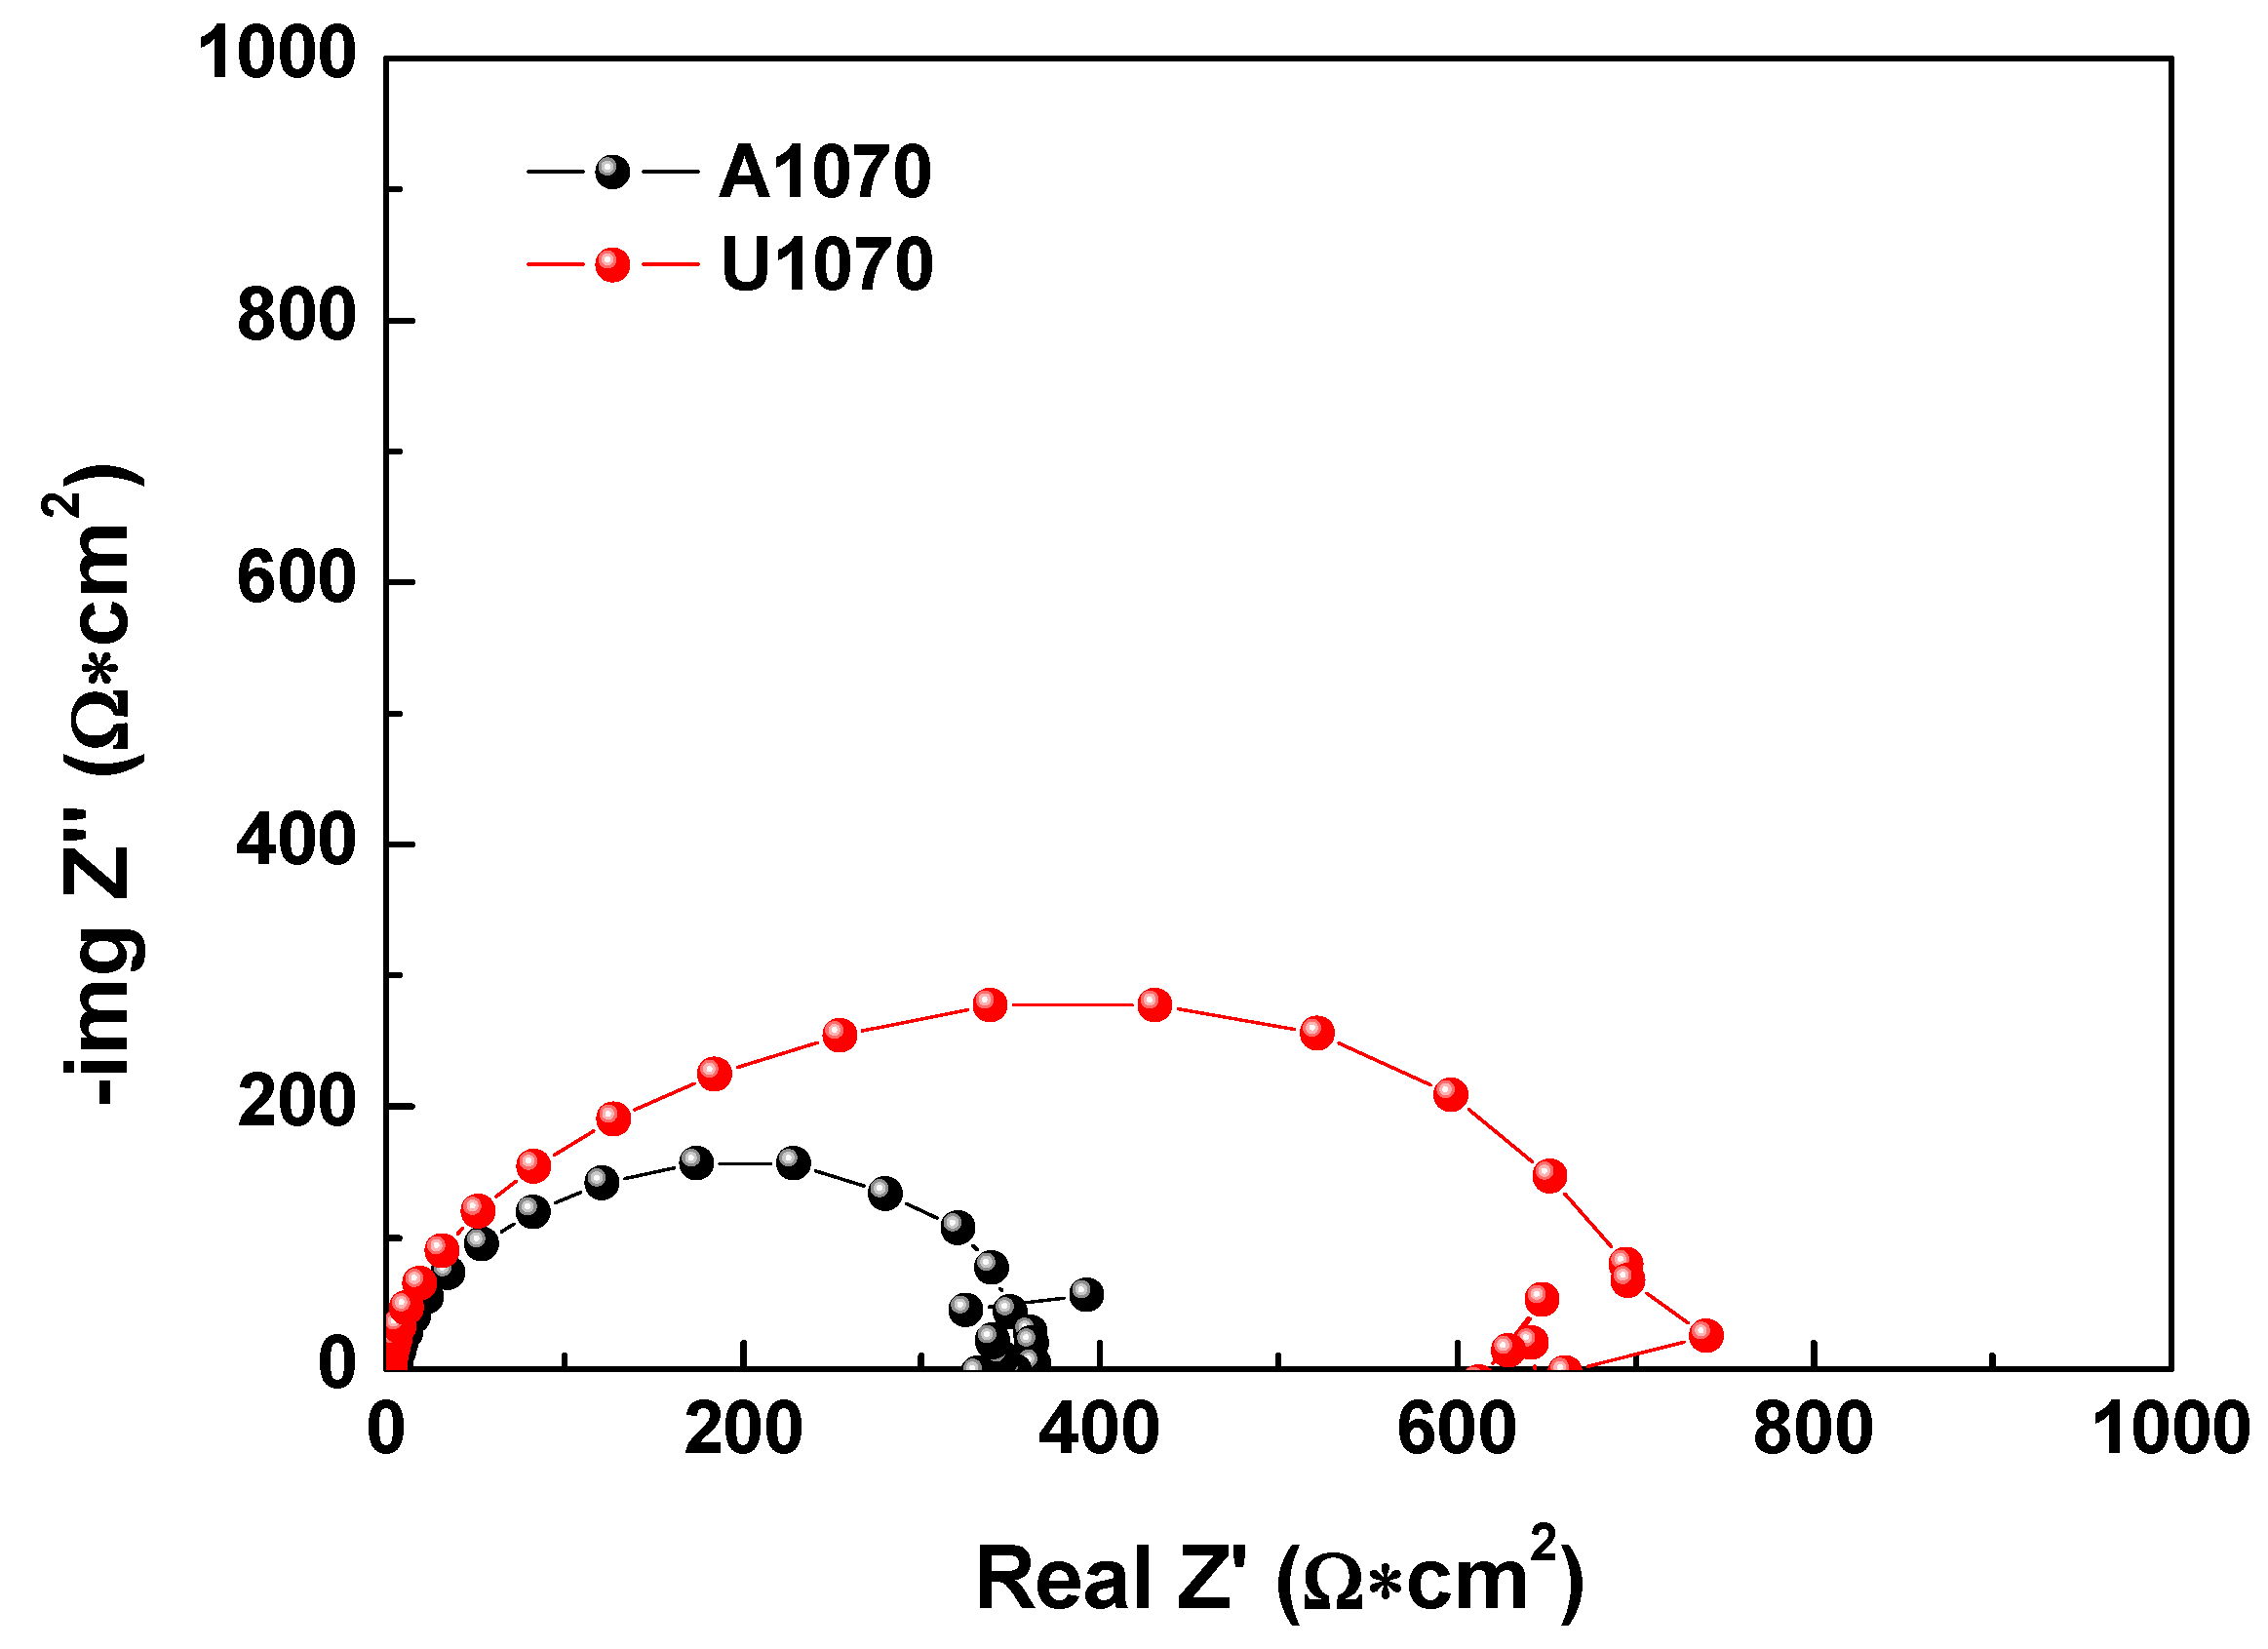
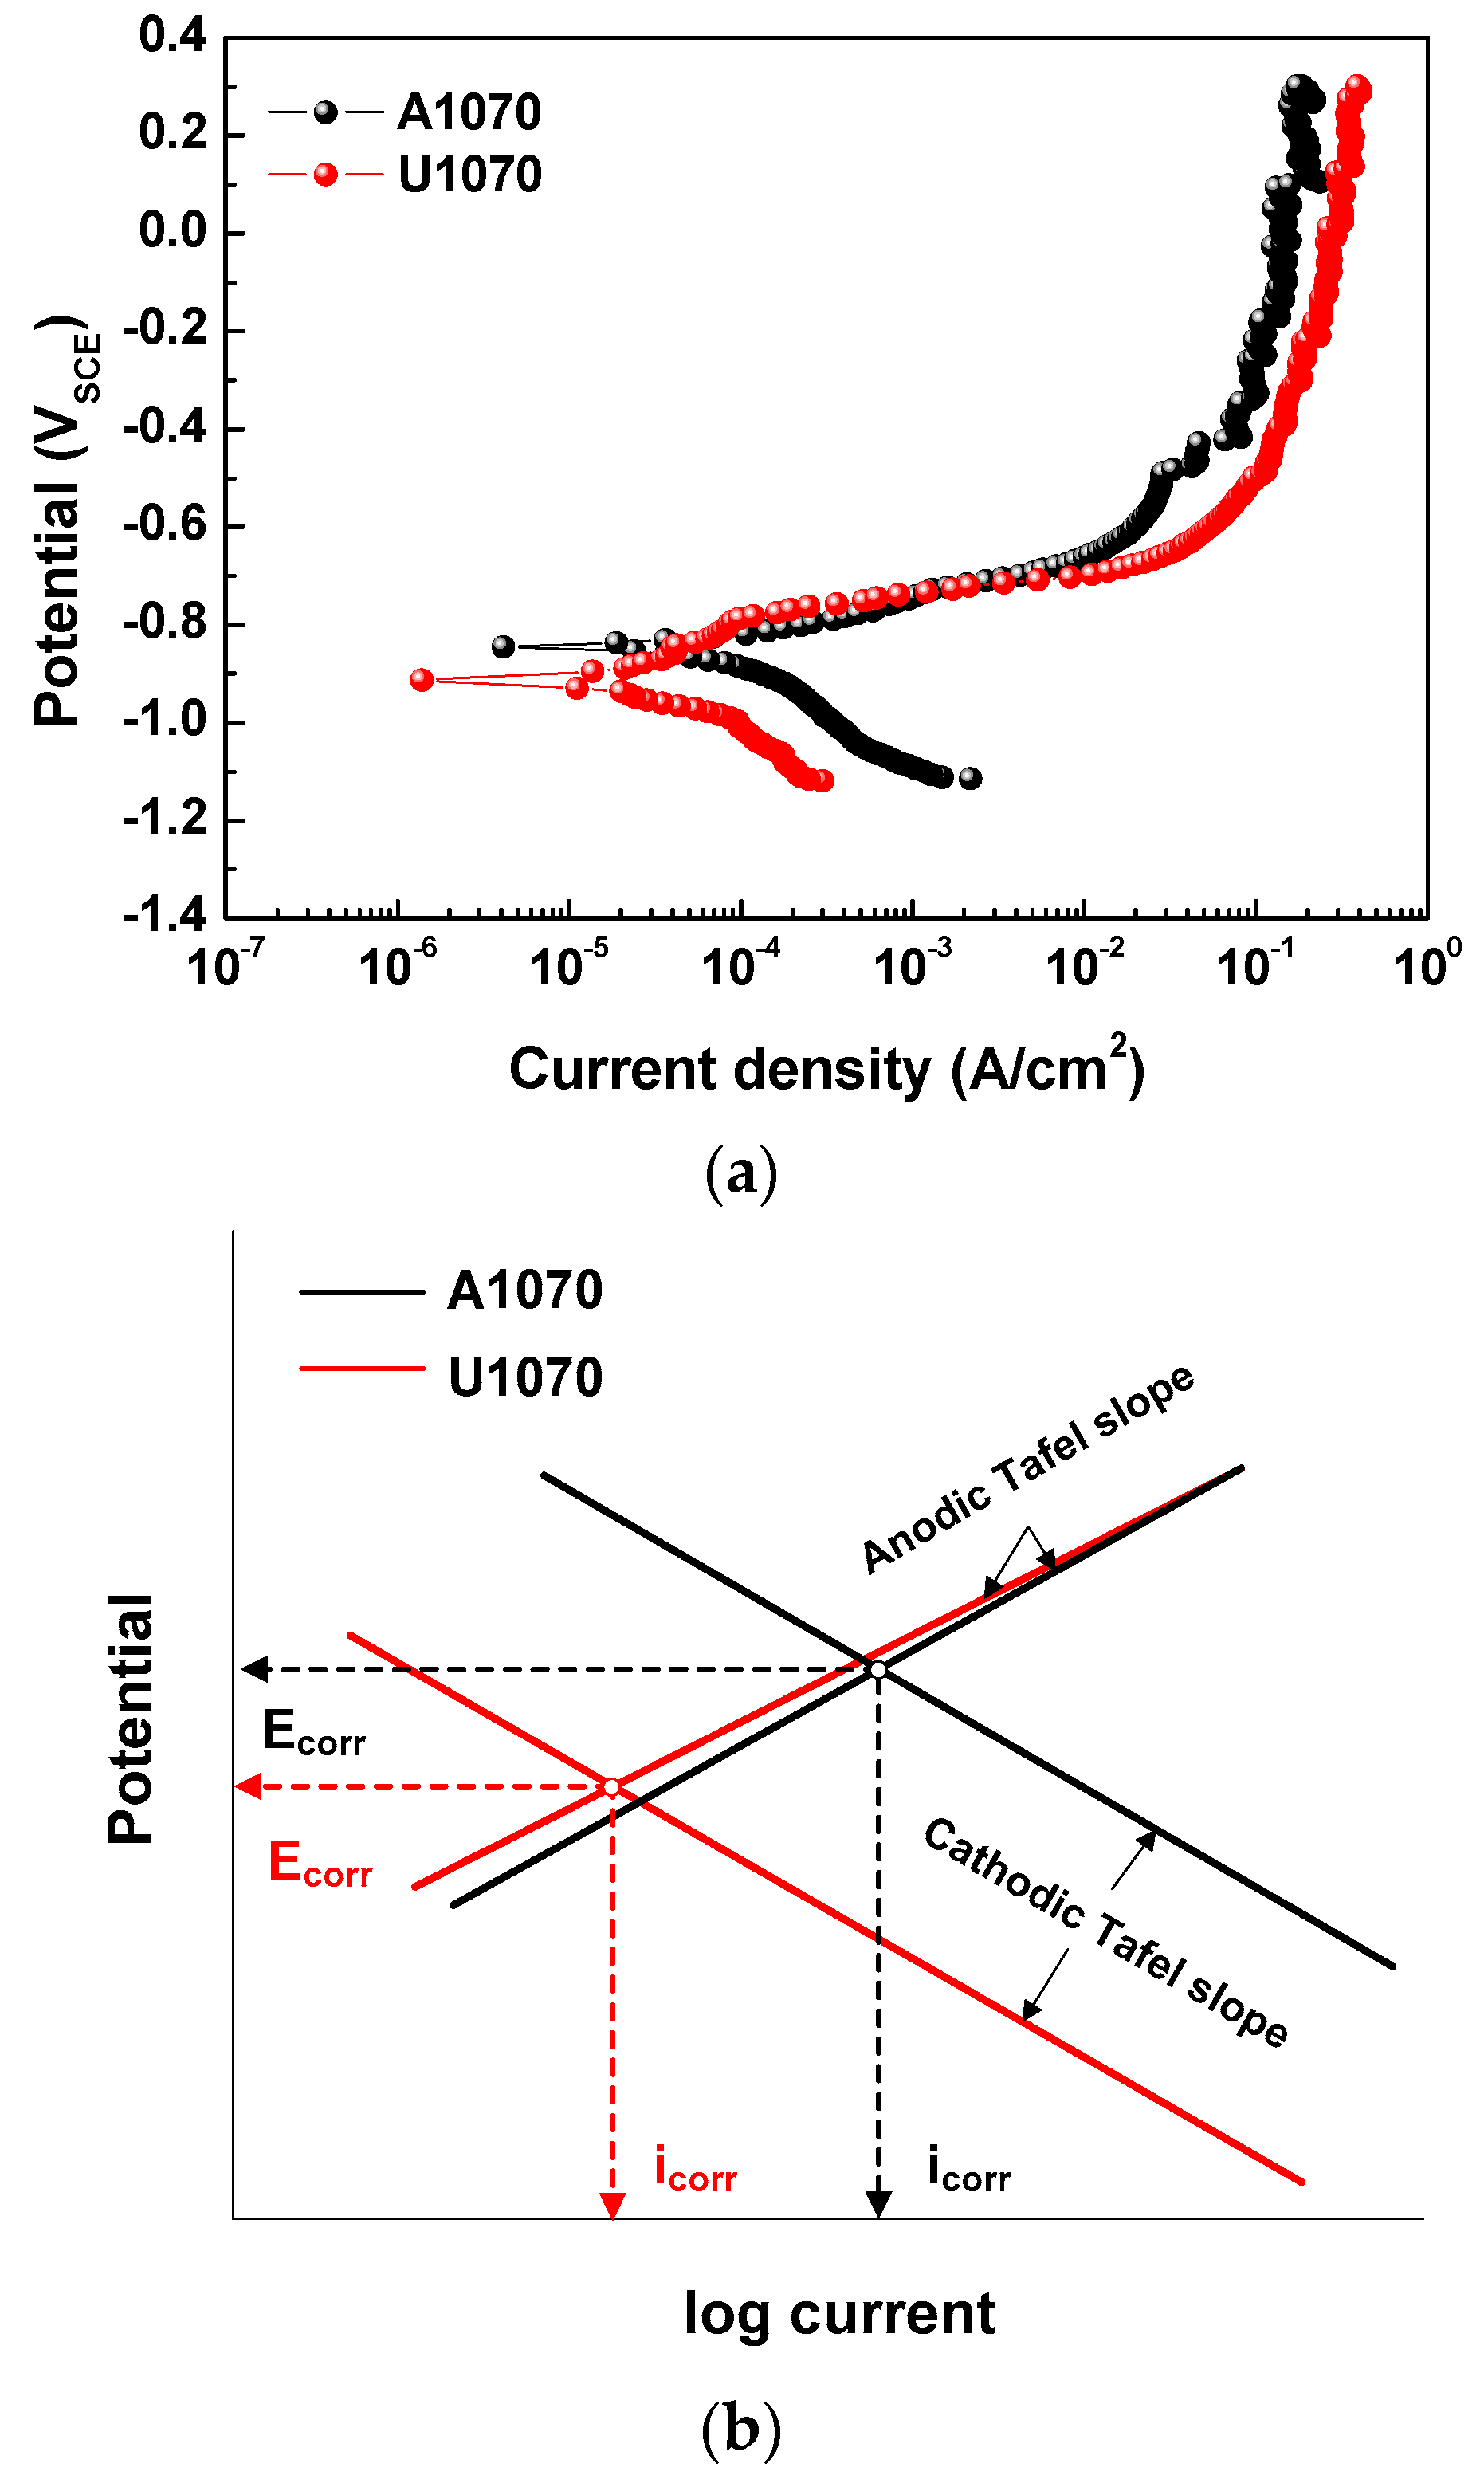
3.1. Corrosion Behavior
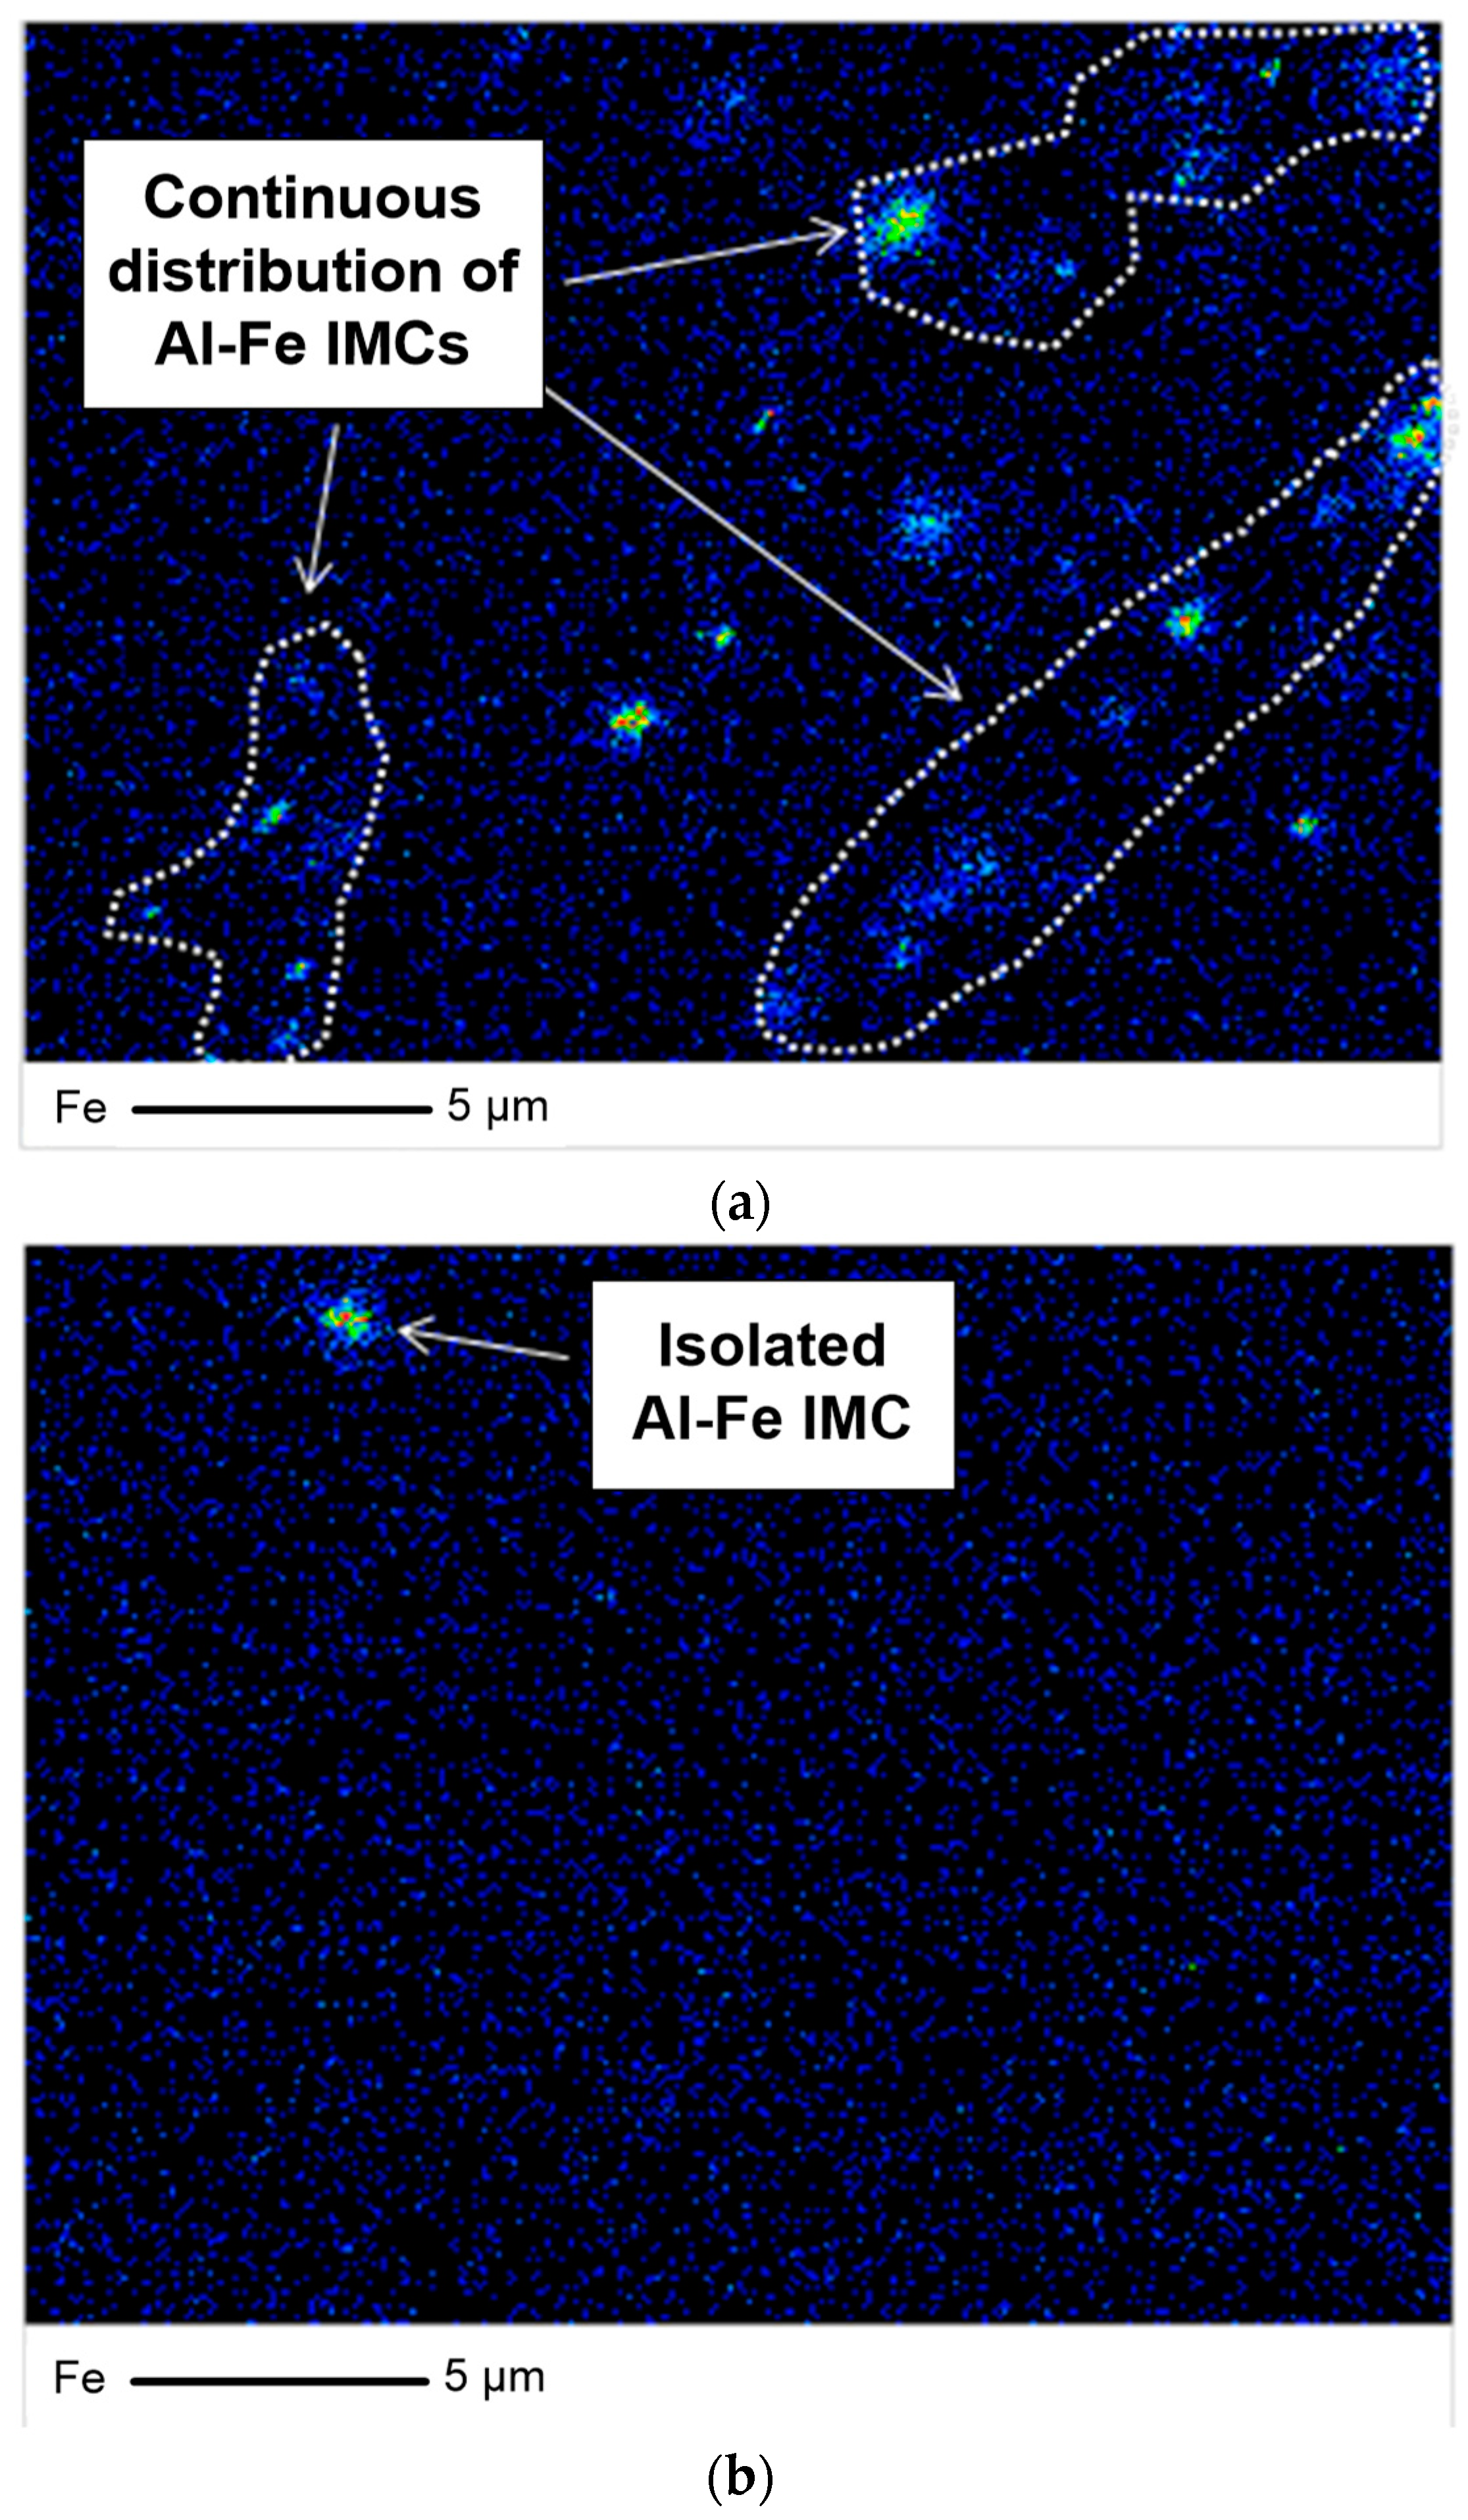
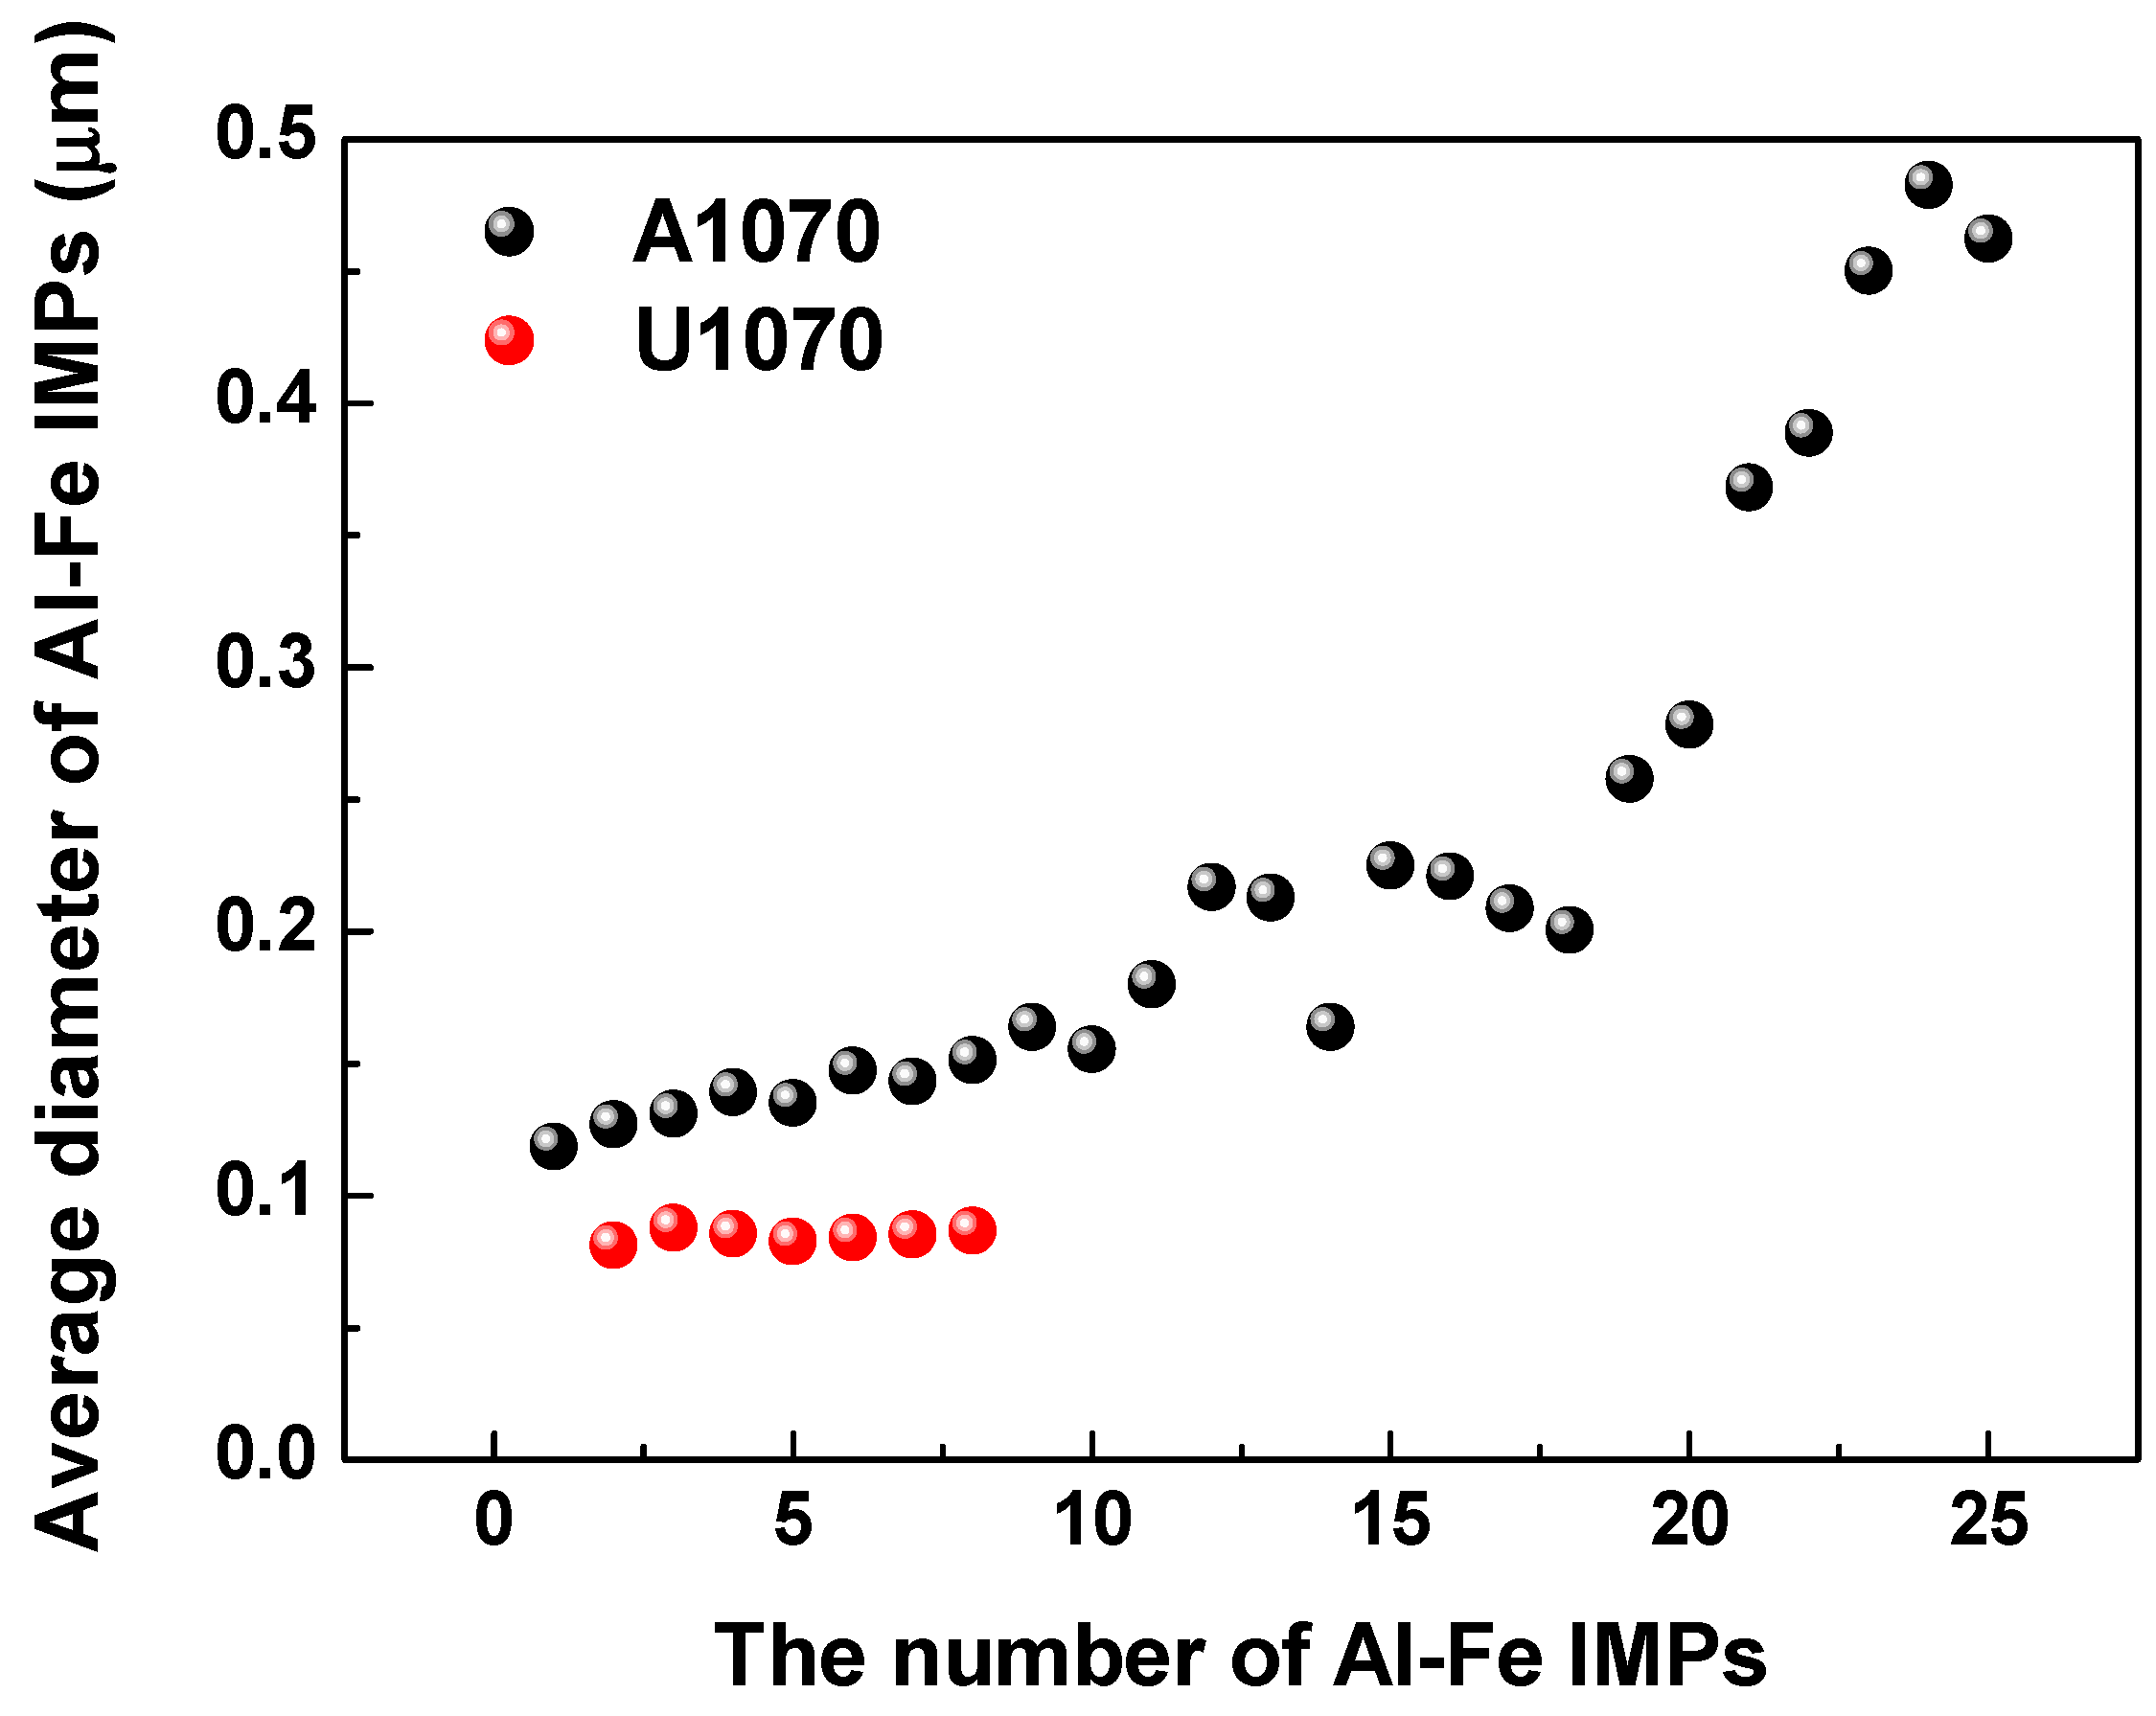
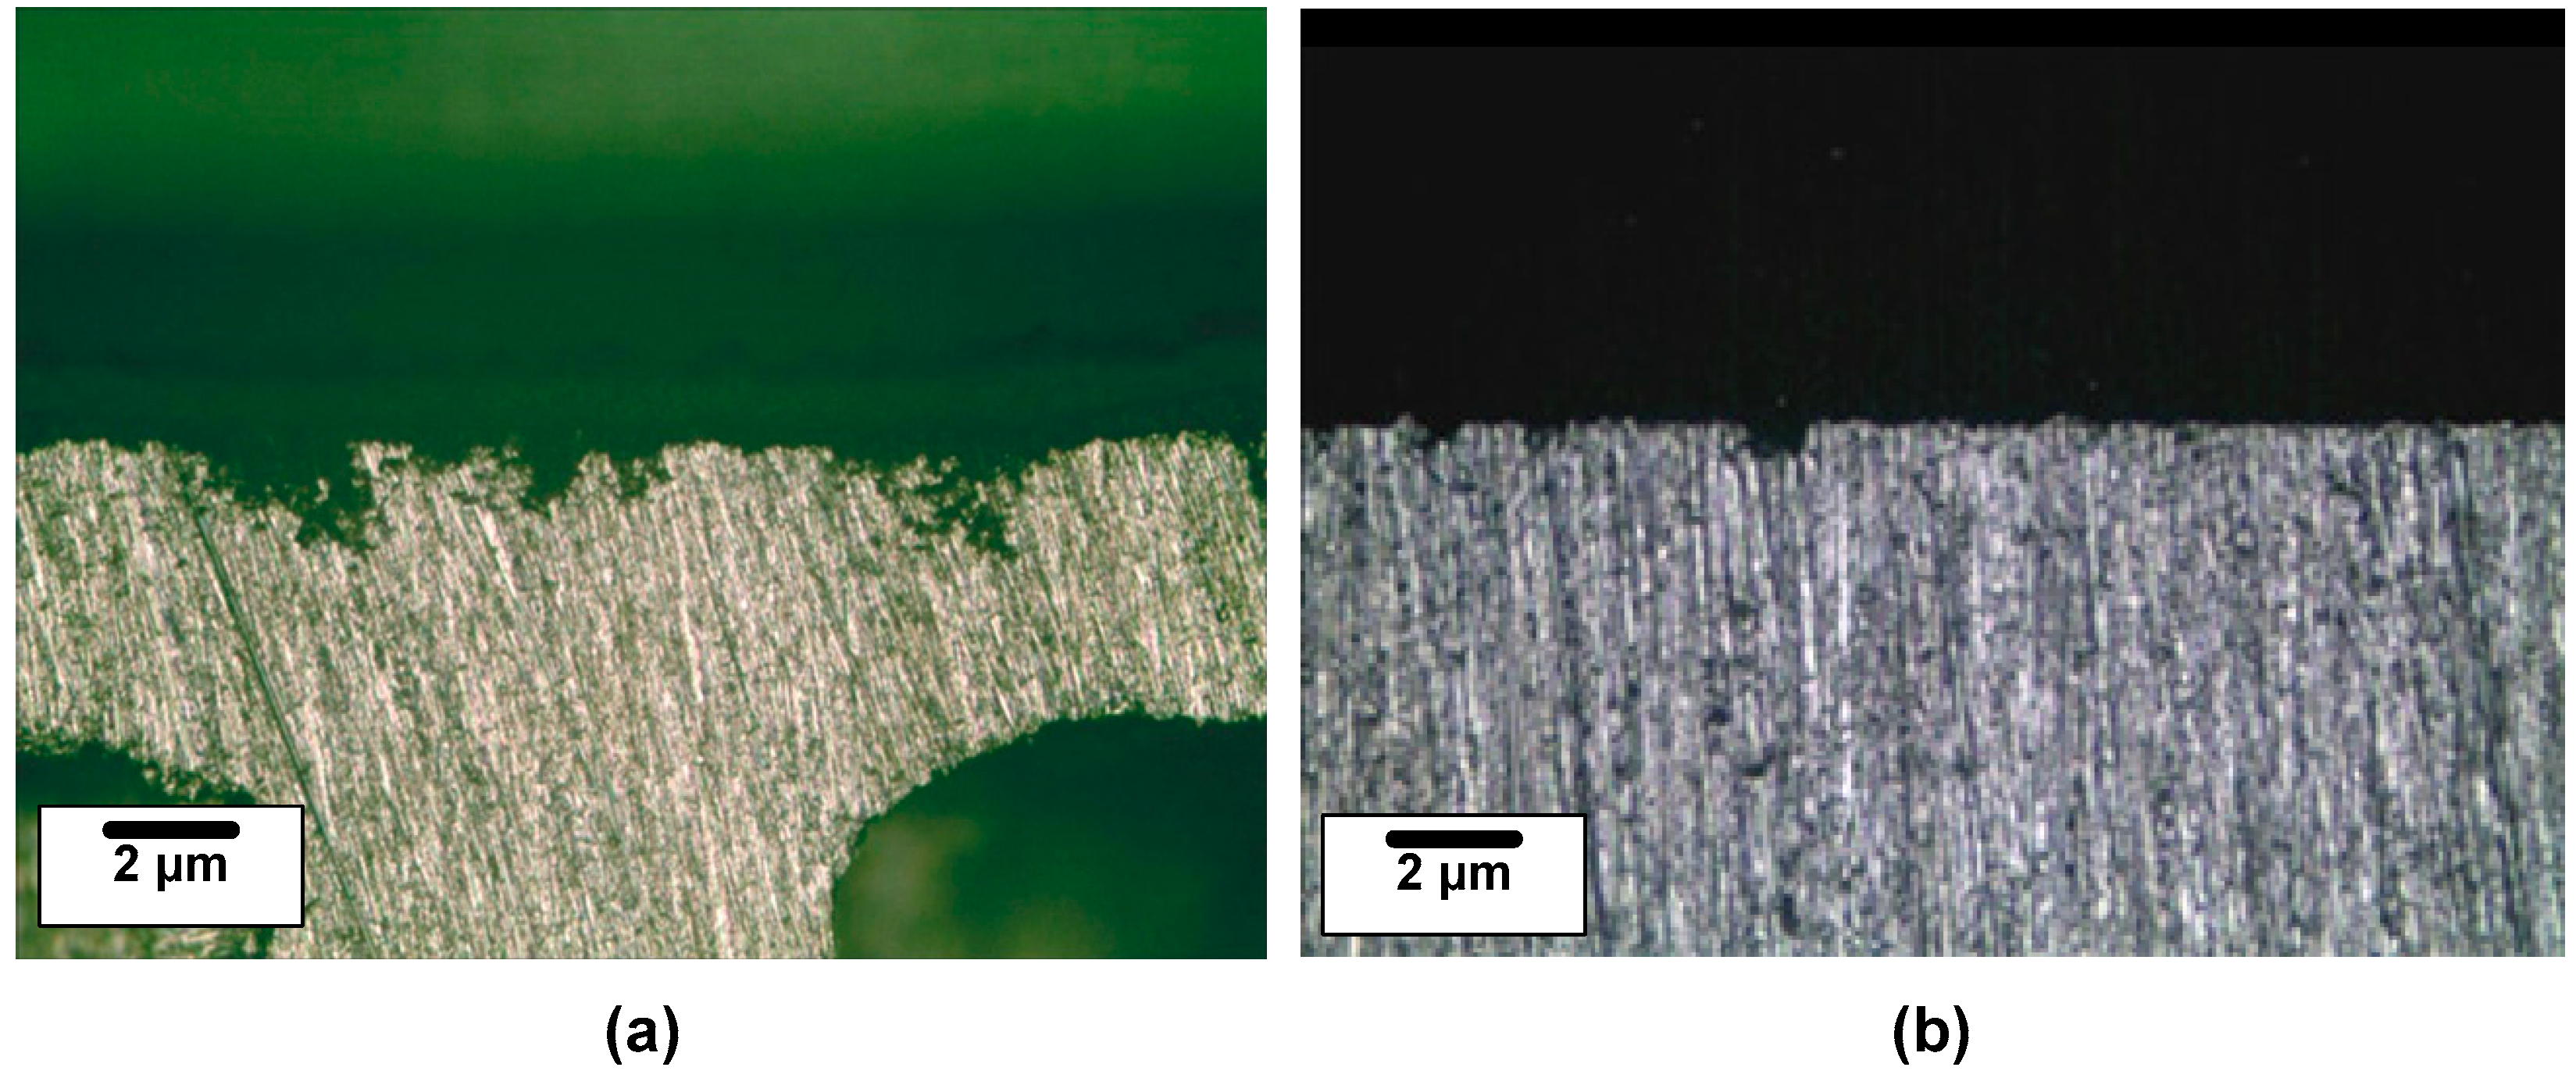
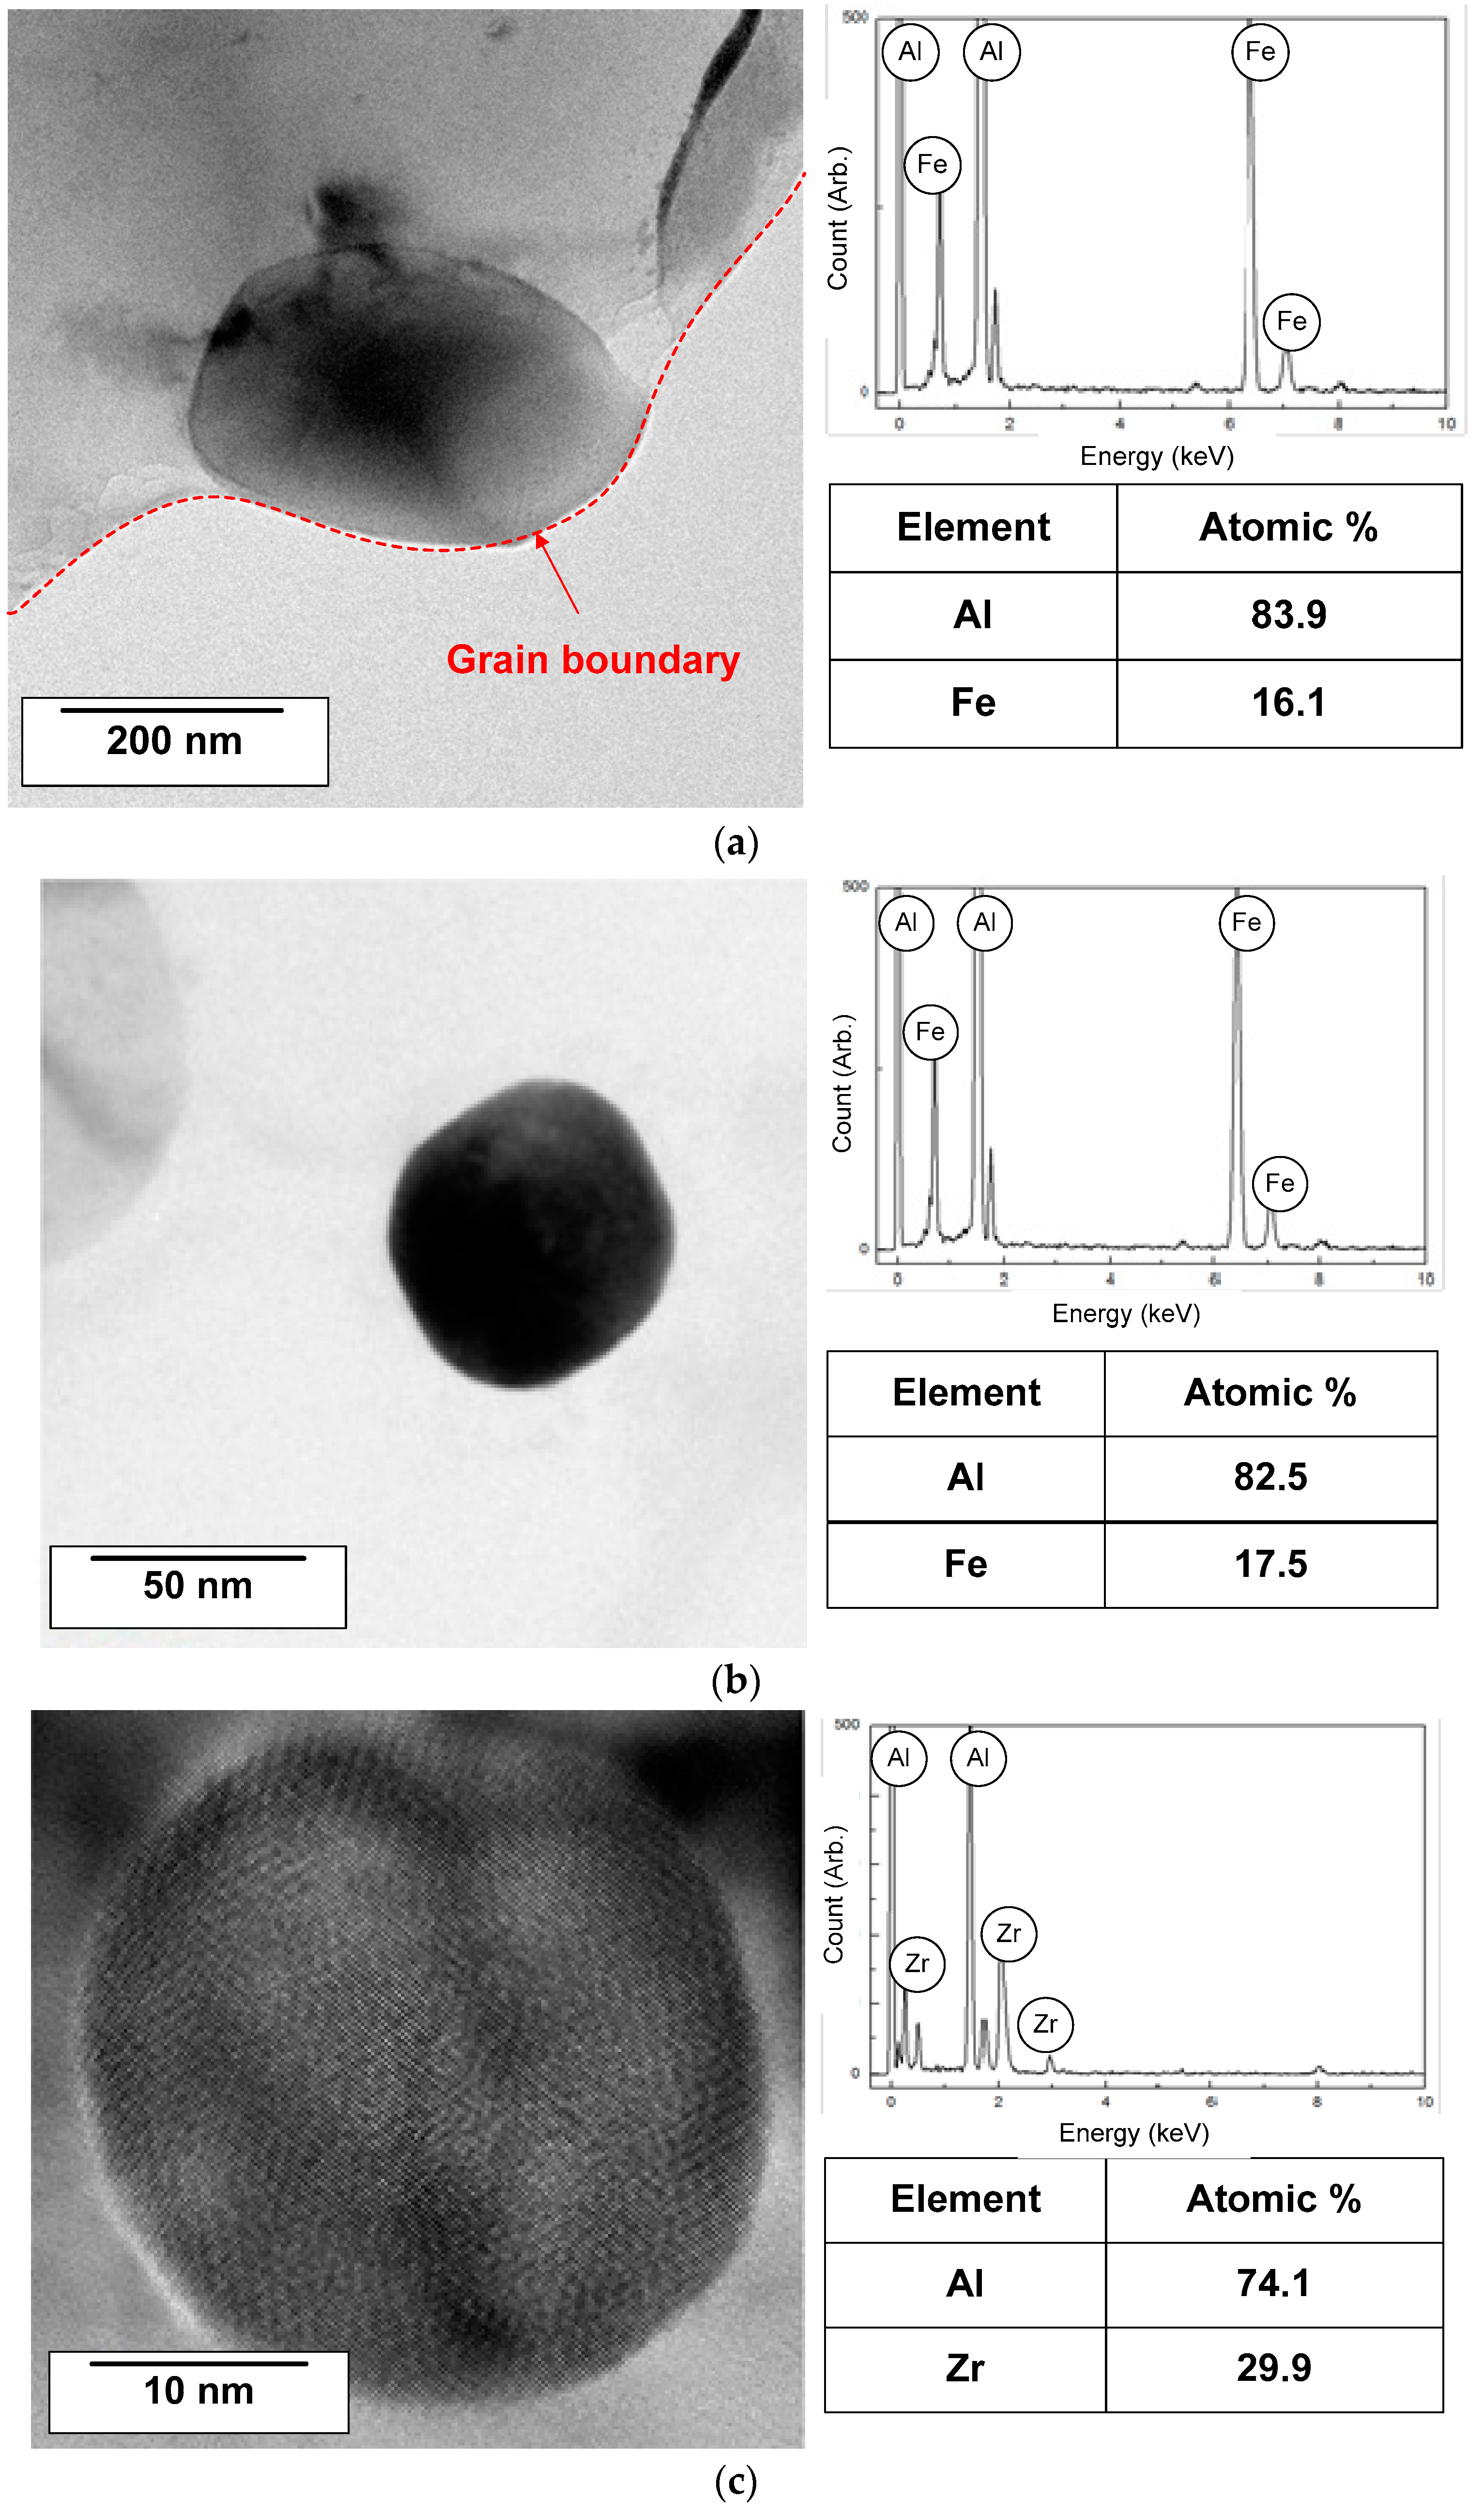
3.2. Analysis of IMPs
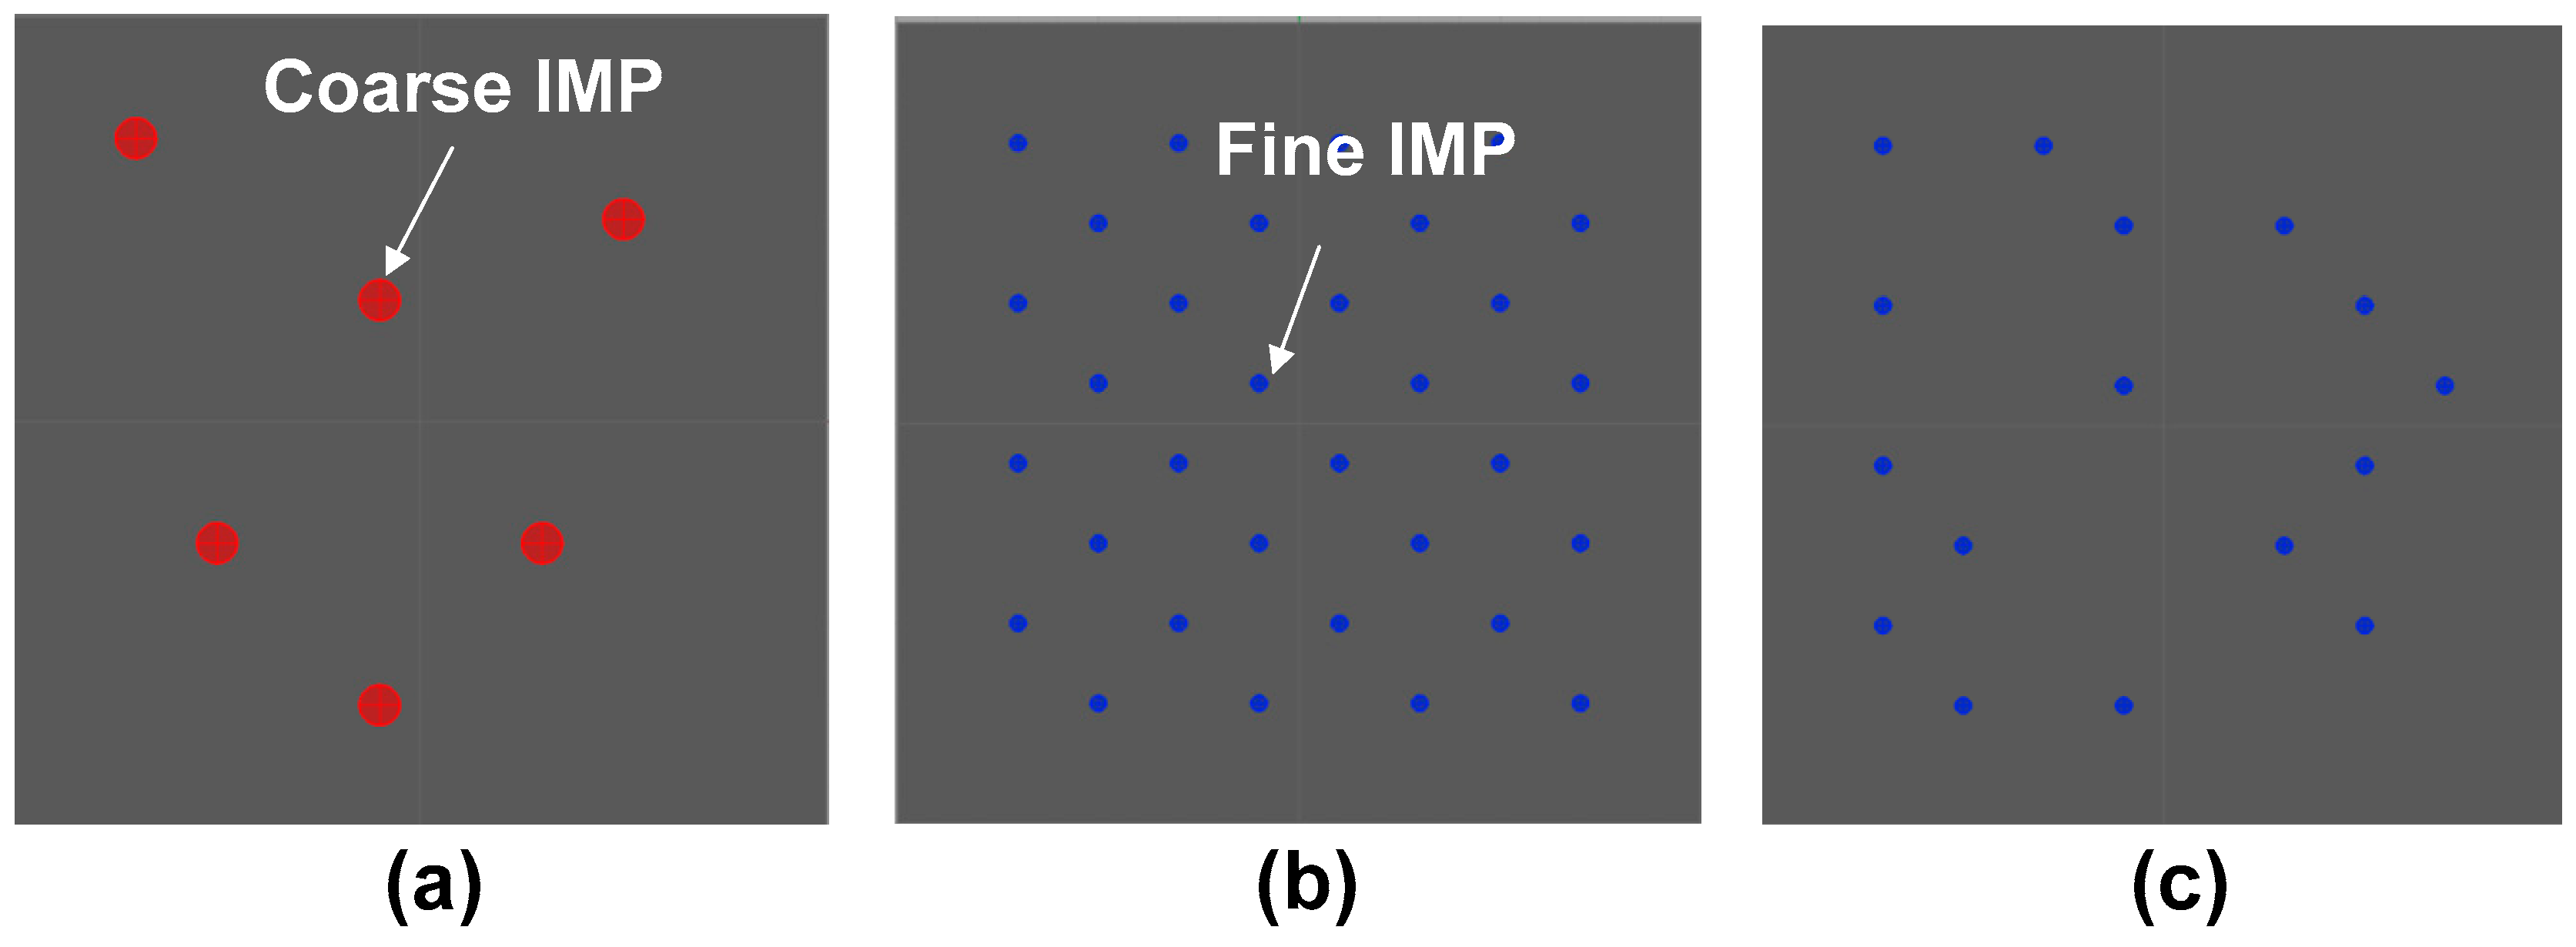
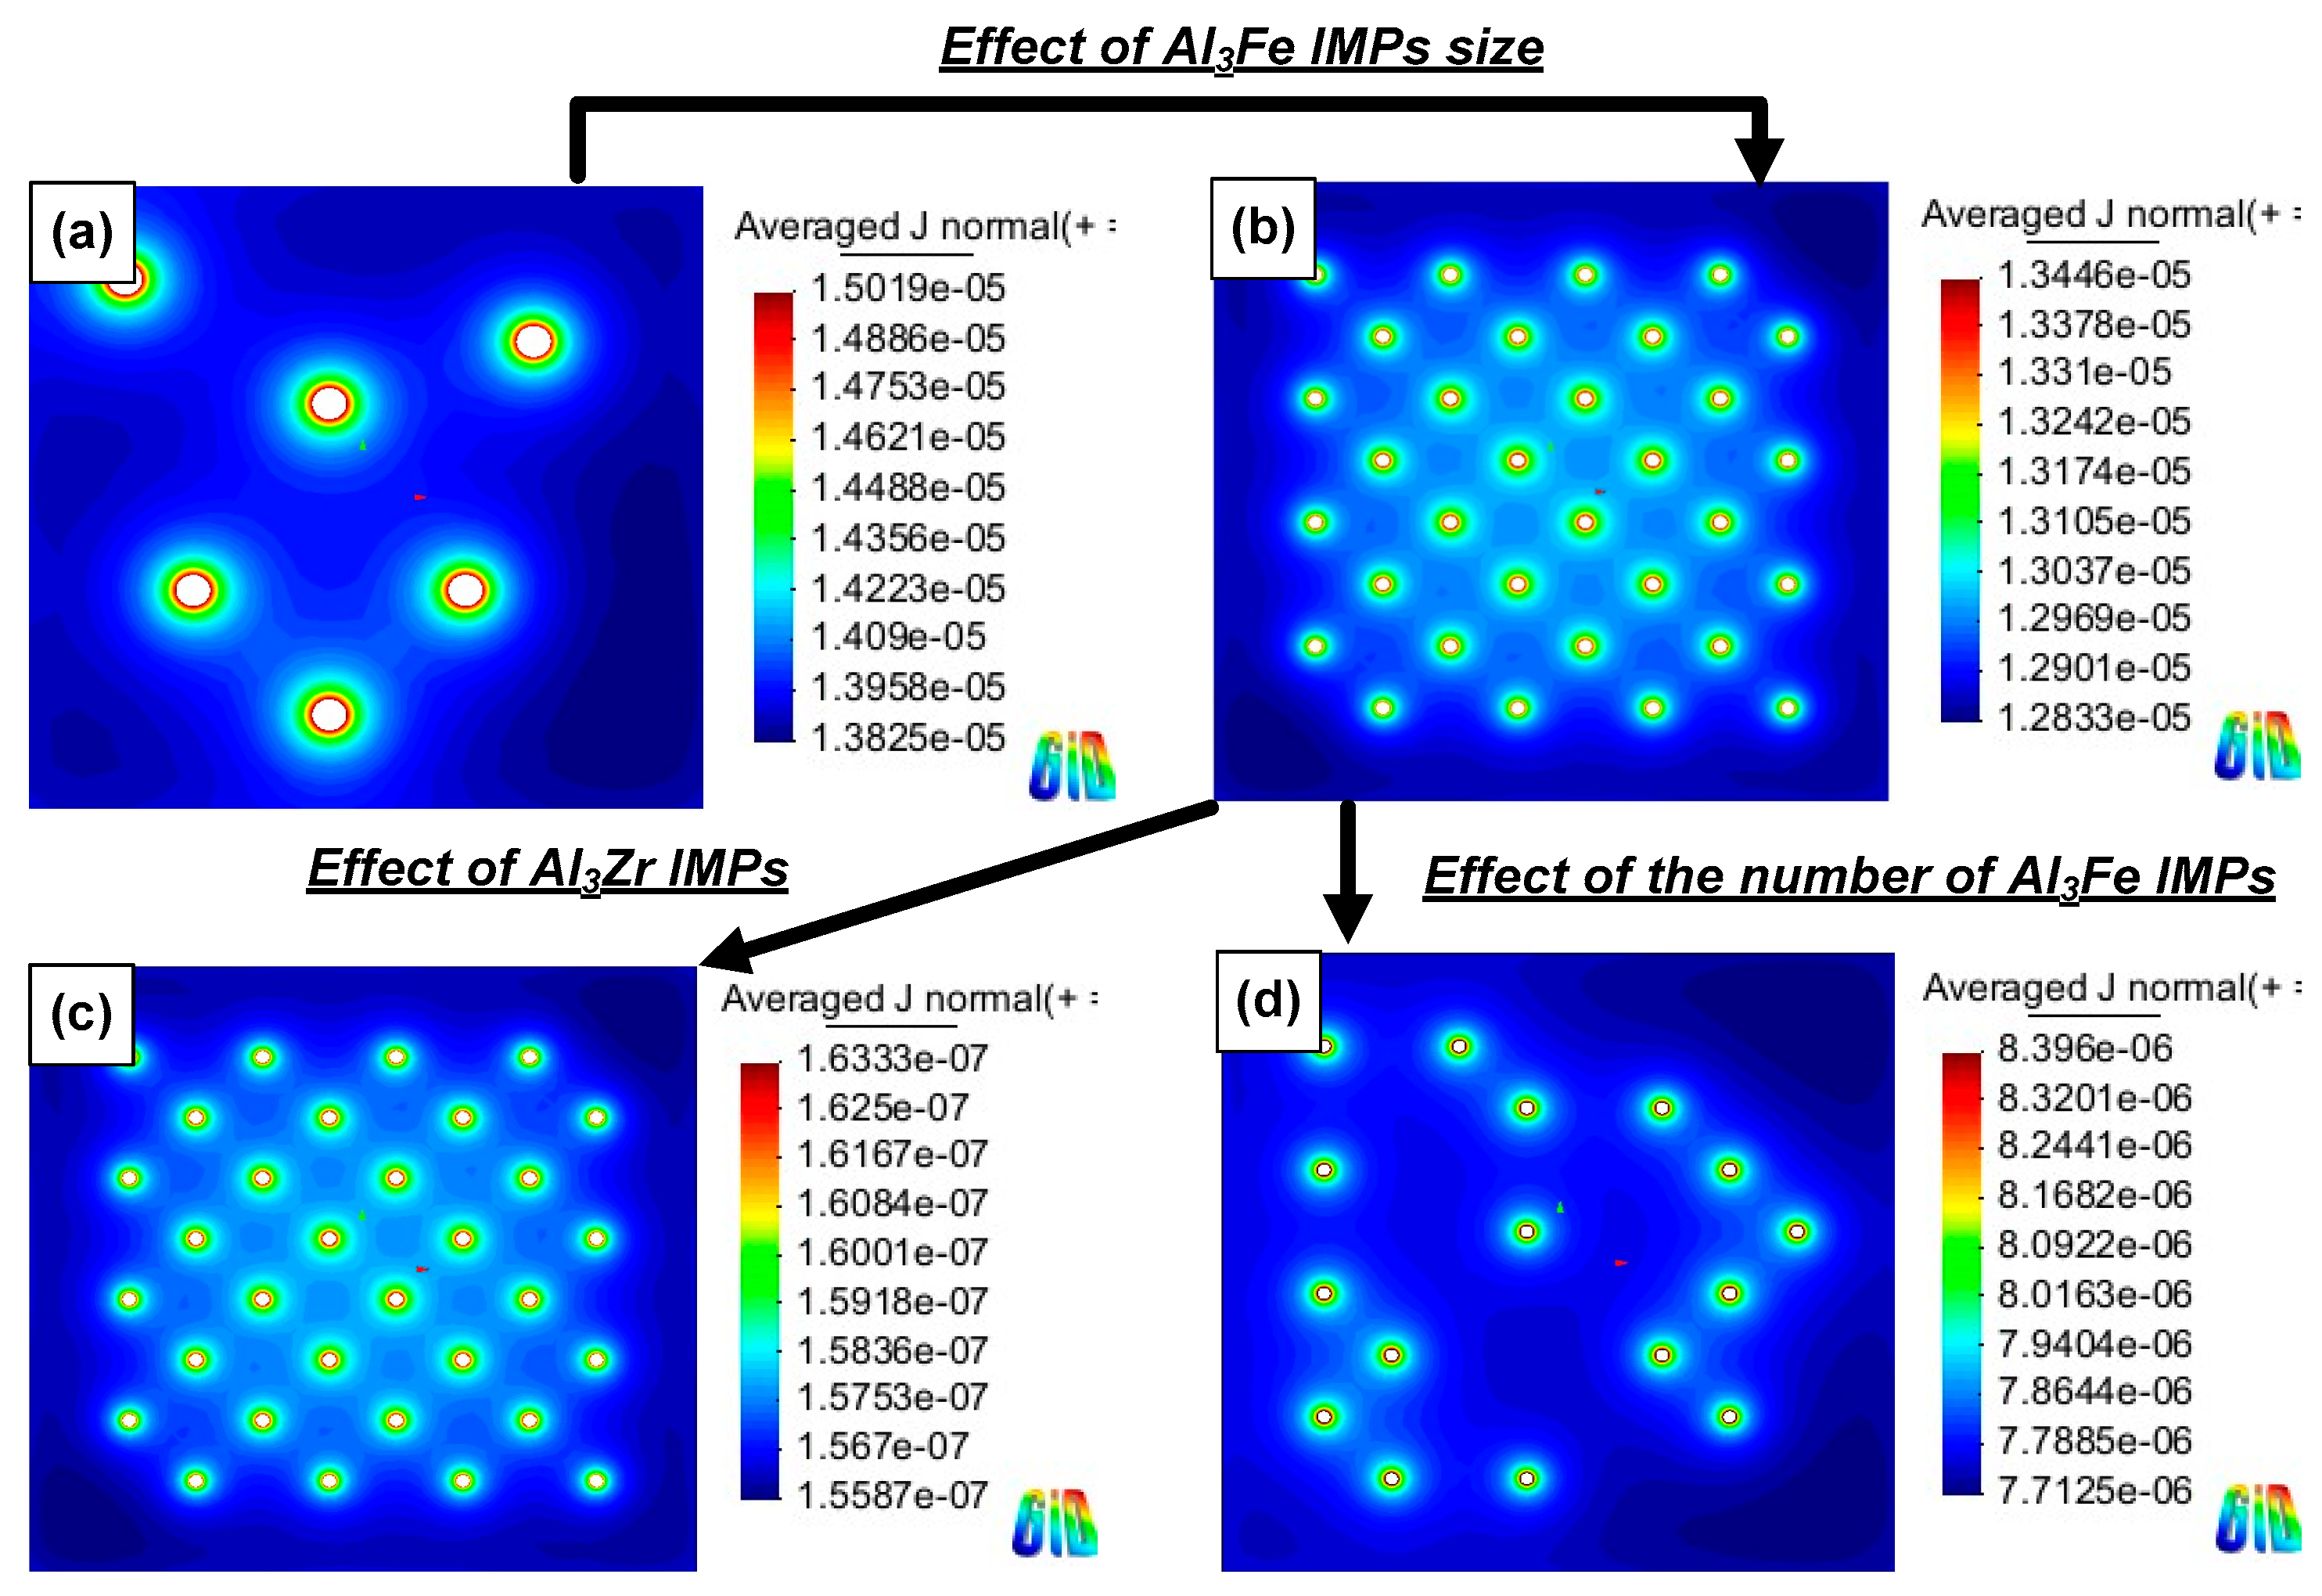
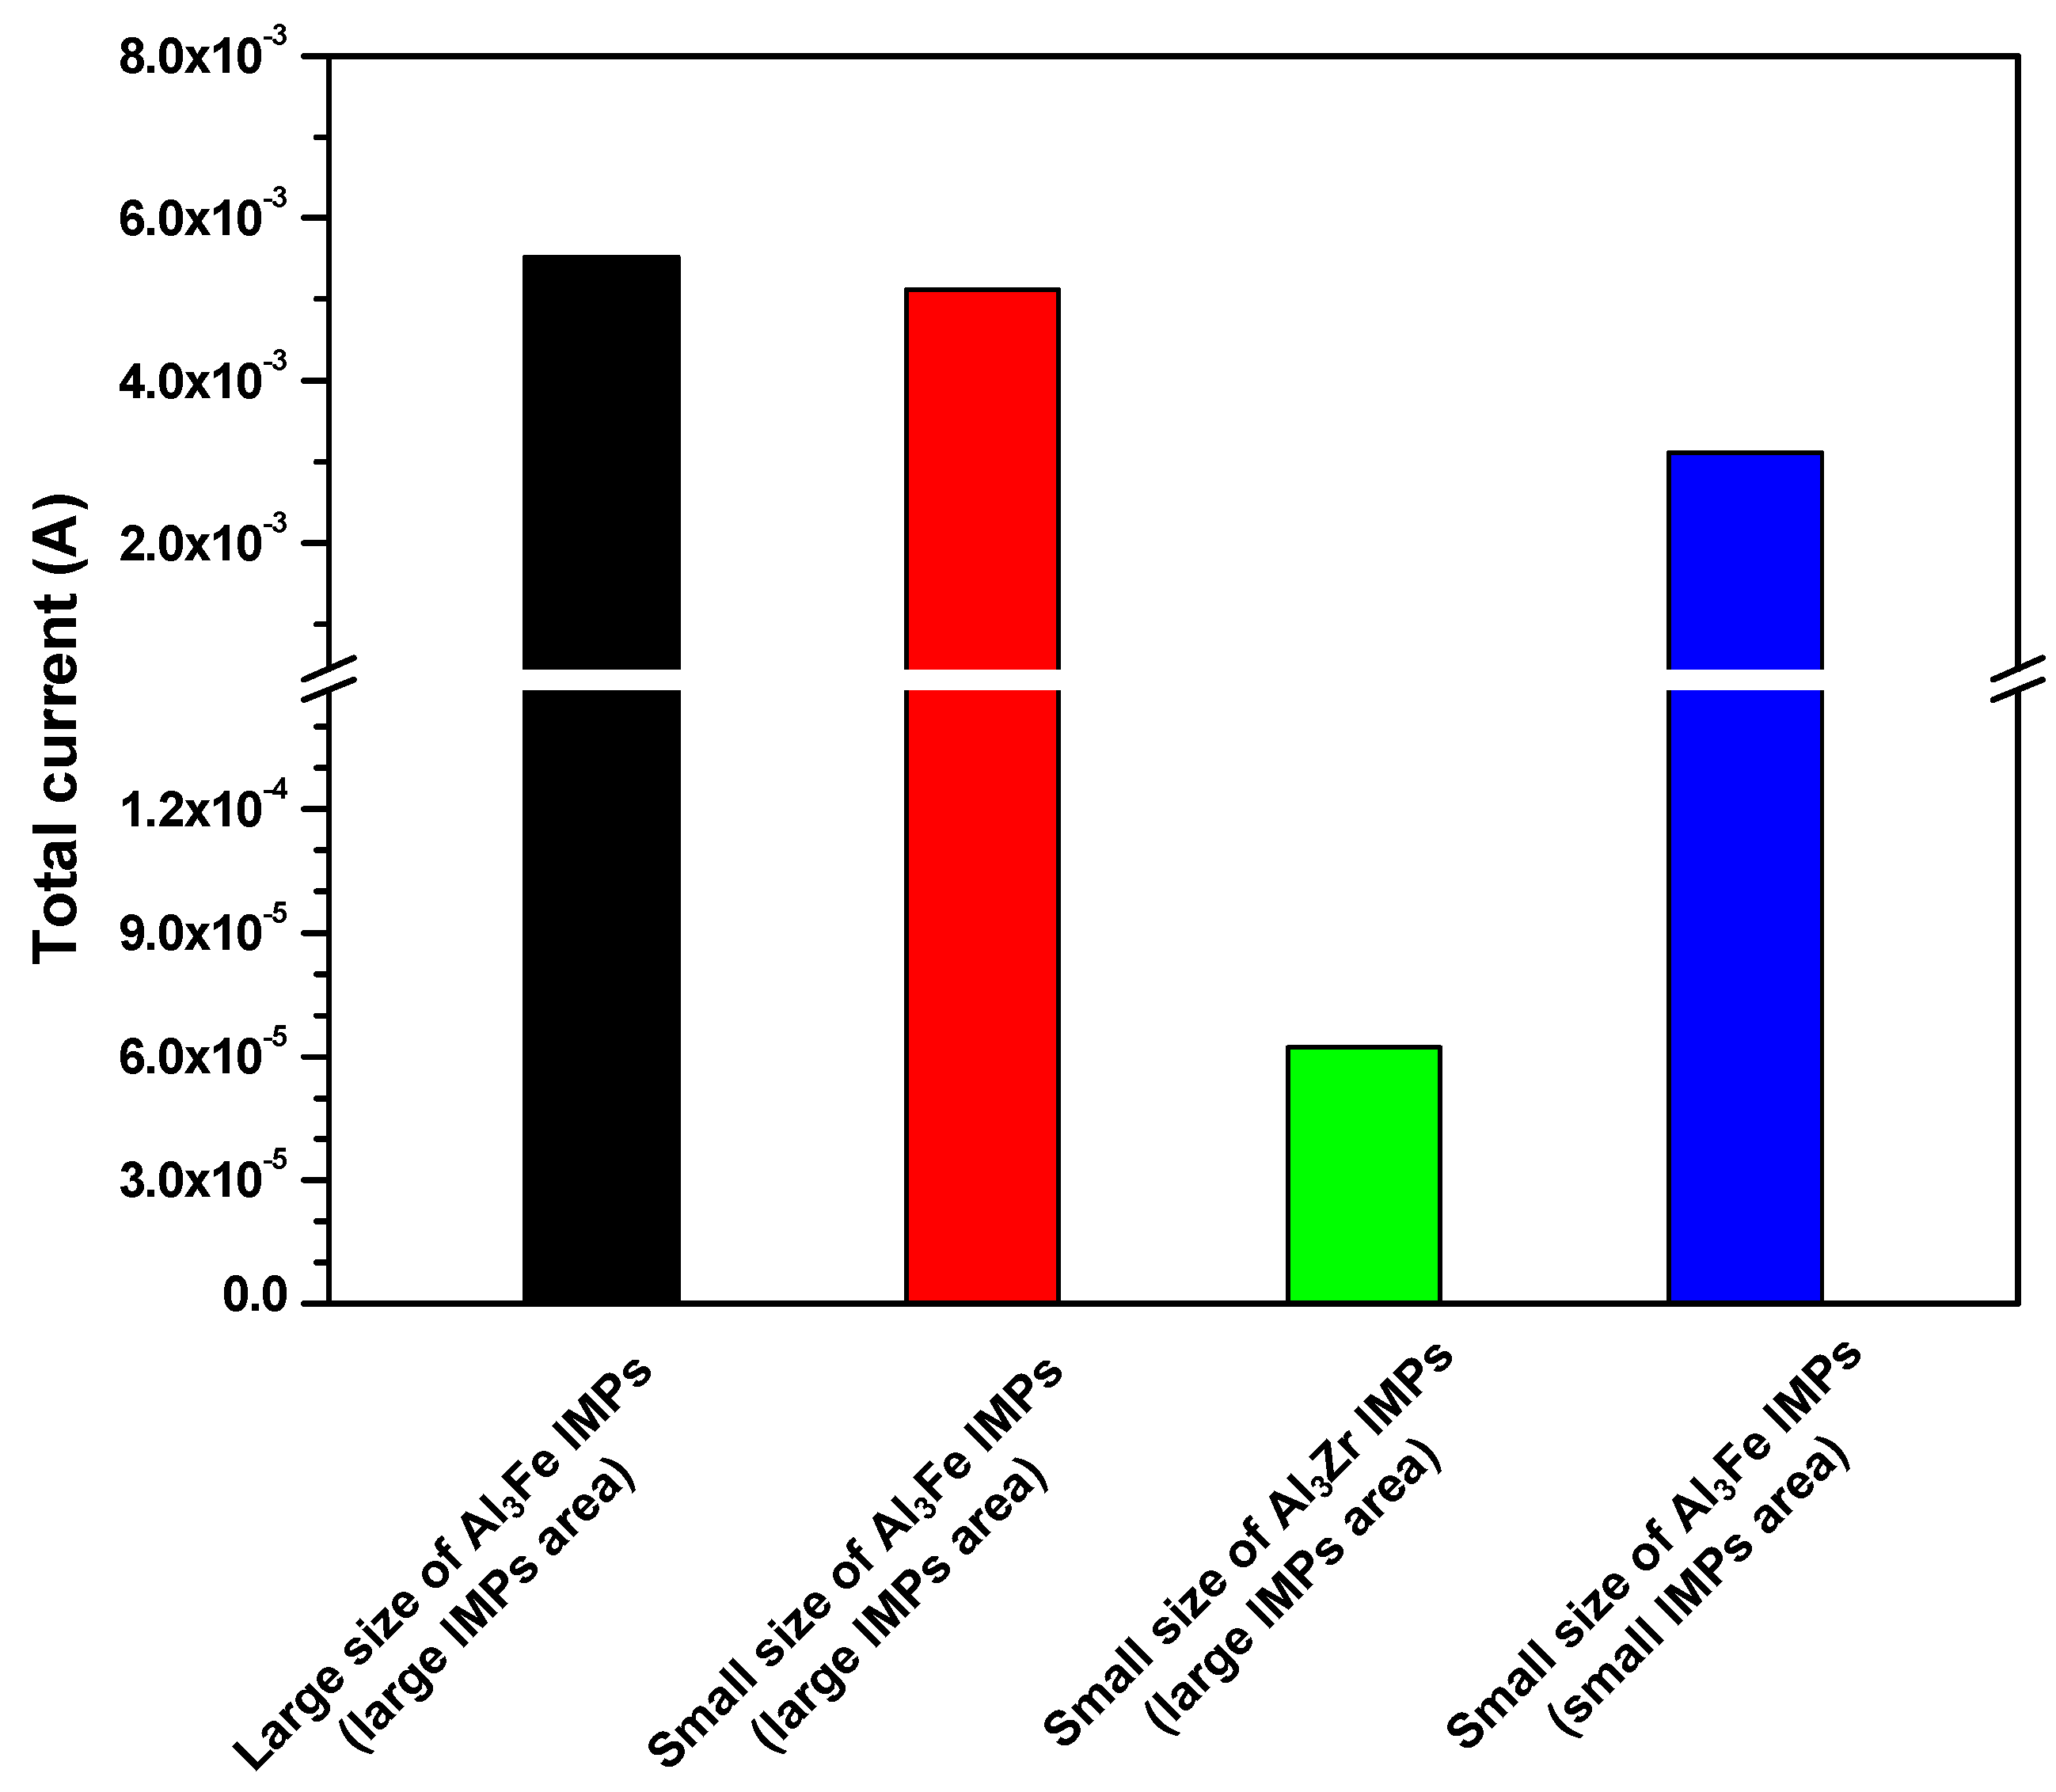
3.3. Case Study of Numerical Corrosion Simulation
4. Conclusions
Author Contributions
Funding
Conflicts of Interest
References
- Davis, J.R. Corrosion of Aluminum and Aluminum Alloys; ASM International: Materials Park, OH, USA, 1999. [Google Scholar]
- Akers, W.W.; Deans, H.A.; Crosser, O.K. Condensation Heat Transfer within Horizontal Tubes. Chem. Eng. Prog. 1959, 55, 171–176. [Google Scholar]
- Akersm, W.W.; Rosson, H.F. Condensation inside a horizontal tube. Chem. Eng. Prog. Symp. Ser. 1960, 56, 145. [Google Scholar]
- Cavallini, A.; Del Col, D.; Doretti, L.; Matkovic, M.; Rosseto, L.; Zilio, C. Condensation heat transfer and pressure gradient inside multiple minichannels. Heat Transf. Eng. 2005, 26, 45–55. [Google Scholar] [CrossRef]
- Adams, T.M.; Dowling, M.F.; Abdel-Khalik, S.I.; Jeter, S.M. Applicability of traditional turbulent single phase forced convention correlations to non-circular microchannels. J. Heat Mass Transf. 1999, 42, 4411–4415. [Google Scholar] [CrossRef]
- Abdulstaar, M.A.; Mhaede, M.; Wagner, L. Corrosion behaviour of Al 1050 severely deformed by rotary swaging. Mater. Des. 2014, 57, 325–329. [Google Scholar] [CrossRef]
- Chen, G.; Chen, Q.; Wang, B.; Du, Z. Microstructure evolution and tensile mechanical properties of thixoformed high performance. Met. Mater. Int. 2015, 21, 897–906. [Google Scholar] [CrossRef]
- Davoodi, A.; Pan, J.; Leygraf, C.; Norgren, S. In situ investigation of localized corrosion of aluminum alloys in chloride solution using integrated EC-AFM/SECM techniques. Electrochem. Solid-State Lett. 2005, 8, B21–B24. [Google Scholar] [CrossRef]
- Park, J.O.; Paik, C.H.; Huang, Y.H.; Alkire, R.C. Influence of the Fe-Rich intermetallic inc1usions on pit initiation on aluminium alloys in aerated NaCl. J. Electrochem. Soc. 1999, 146, 517–523. [Google Scholar] [CrossRef]
- Rynders, R.M.; Paik, C.H.; Ke, R.; Alkire, R.C. Use of in situ atomic force microscopy to image corrosion at inclusions. J. Electrochem. Soc. 1994, 141, 1439–1445. [Google Scholar] [CrossRef]
- Campestrini, P.; Westing, E.P.M.; Rooijen, H.W.; Wit, J.H.W. Relation between microstructural aspects of AA2024 and its corrosion behaviour investigated using AFM scanning potential technique. Corros. Sci. 2000, 42, 1853–1861. [Google Scholar] [CrossRef]
- Ilevbare, G.O.; Schneider, O.; Kelly, R.G.; Scully, J.R. In situ laser scanning microscopy of AA 2024-T3 corrosion metrology: I. localised corrosion of particles. J. Electrochem. Soc. 2004, 151, B453–B464. [Google Scholar] [CrossRef]
- Birbilis, N.; Cavanaugh, M.K.; Buchheit, R.G. Electrochemical behavior and localized corrosion associated with Al7Cu2Fe particles in aluminum alloy 7075-T651. Corros. Sci. 2006, 48, 4202–4215. [Google Scholar] [CrossRef]
- Davoodi, A.; Pan, J.; Leygraf, C.; Norgren, S. The role of intermetallic particles in localized corrosion of an aluminum alloy studies by SKPFM and integrated AFM/SECM. J. Electrochem. Soc. 2008, 155, C211–C218. [Google Scholar] [CrossRef]
- Lacroix, L.; Ressier, L.; Blanc, C.; Mankowski, G. Combination of AFM, SKPFM, and SIMS to study the corrosion behavior of S-phase particles in AA2024-T351. J. Elecrochem. Soc. 2008, 155, C131–C137. [Google Scholar] [CrossRef] [Green Version]
- Bong, A.; Taylor, R.J.; Muster, T.H.; Goodman, N.; McCulloch, C.; Ryan, C.; Rout, B.; Jamieson, D.; Hughes, A.E. Stable pit formation on AA2024-T3 in a NaCl environment. Corros. Sci. 2010, 52, 90–103. [Google Scholar]
- Yin, L.; Jin, Y.; Leygraf, C.; Birbilis, N.; Pan, J. Numerical simulation of micro-galvanic corrosion in Al alloys: Effect of geometric factors. J. Electrochem. Soc. 2017, 164, C75–C84. [Google Scholar] [CrossRef]
- Shabestari, S.G. The effect of iron and manganese on the formation of intermetallic compounds in aluminum-silicon alloy. Mater. Sci. Eng. A 2004, 383, 289–298. [Google Scholar] [CrossRef]
- Chen, C.; Wang, J.; Shu, D.; Li, P.; Xue, J.; Sun, B. A novel method to remove iron impurity from aluminium. Mater. Trans. 2011, 52, 1629–1633. [Google Scholar] [CrossRef]
- Taghaddos, E.; Hejazi, M.M.; Taghiabadi, R.; Shabestari, S.G. Effect of iron-intermetallics on the fluidity of 413 aluminum alloy. J. Alloys Compd. 2009, 468, 539–545. [Google Scholar] [CrossRef]
- Kim, P.; Hayashi, C.; Nakashima, K.; Yamada, Y.; Tachikawa, K.; Mitsugashira, T. Some characteristics of highly purified aluminium. Phys. Status Solidi 2002, 189, 149–158. [Google Scholar] [CrossRef]
- Samuel, F.H.; Samuel, A.M.; Doty, H.W. Factors controlling the type and morphology of Cu-containing phases in 319 Al alloy. AFS Trans. 1996, 104, 893–901. [Google Scholar]
- Flores, A.; Sukiennik, M.; Castillejos, A.H.; Acosta, F.A.; Escobedo, J.C. A kinetic study on the nucleation and growth of the Al8FeMnSi2 intermetallic compound for aluminum scrap purification. Intermetallics 1998, 6, 217–227. [Google Scholar] [CrossRef]
- Cao, X.; Campbell, J. The solidification characteristics of Fe-rich intermetallics in Al-11.5Si-0.4Mg Cast alloys. Met. Mater. Trans. 2004, 35, 1425–1435. [Google Scholar] [CrossRef]
- Davignon, G.; Serneels, A.; Verlinden, B.; Delaey, L. An isothermal section at 550 °C in the Al-rich corner of the Al-Fe-Mn-Si system. Metall. Trans. A 1996, 27, 3357–3361. [Google Scholar] [CrossRef]
- Moraes, H.L.; Oliveira, J.R.; Espinosa, D.C.R.; Tenorio, J.A.S. Removal of iron from molten recycled aluminum through intermediate phase filtration. Mater. Trans. 2006, 47, 1731–1736. [Google Scholar] [CrossRef]
- Hosseinifar, M.; Malakhov, D.V. Effect of Ce and La on microstructure and properties of a 6xxx series type aluminum alloy. J. Mater. Sci. 2008, 43, 7157–7164. [Google Scholar] [CrossRef]
- Shabestrai, S.G.; Mahmudi, M.; Emamy, M.; Campbell, J. Effect of Mn and Sr on intermetallics in Fe-rich eutectic Al-Si alloy. Int. J. Cast Met. Res. 2002, 15, 17–24. [Google Scholar] [CrossRef]
- Gao, J.W.; Shu, D.; Wang, J.; Sun, B.D. Effects of Na2Ba4O7 on the elimination of iron from aluminum melt. Scr. Mater. 2007, 57, 197–200. [Google Scholar] [CrossRef]
- Hashimoto, E.; Ueda, Y. Zone refining of high-purity aluminium. Mater. Trans. 1994, 35, 262–265. [Google Scholar] [CrossRef]
- Crossley, F.A.; Mondolfo, L.F. Mechanism of grain refinement in aluminum alloys. JOM 1951, 131, 1143–1148. [Google Scholar] [CrossRef]
- Wang, F.; Qiu, D.; Liu, Z.-L.; Taylor, J.A.; Easton, M.A.; Zhang, M.-X. The grain refinement mechanism of cast aluminium by zirconium. Acta Mater. 2013, 61, 5636–5645. [Google Scholar] [CrossRef]
- Standard Practice for Modified Salt Spray (Fog) Testing, ASTM G85; ASTM International: West Conshohocken, PA, USA, 2011.
- Adey, R.A.; Niku, S.M. Computer modelling of galvanic corrosion. ASTM Spec. Tech. Publ. 1998, 978, 96–117. [Google Scholar]
- Birbilis, N.; Buchheit, R.G. Electrochemical characteristics of intermetallic phases in aluminum alloys. J. Electrochem. Soc. 2005, 152, B140–B151. [Google Scholar] [CrossRef]
- Jones, D.A. Principle and Prevention of Corrosion, 2nd ed.; Prentice Hall: Upper Saddle River, NJ, USA, 1995; pp. 187–190. [Google Scholar]
- Ahamad, I.; Prasad, R.; Quraishi, M.A. Thermodynamic, electrochemical and quantum chemical investigation of some Schiff bases as corrosion inhibitors for mild steel in hydrochloric acid solutions. Corros. Sci. 2010, 52, 933–942. [Google Scholar] [CrossRef]
- Keddam, M.; Kuntz, C.; Takenouti, H.; Schustert, D.; Zuili, D. Exfoliation corrosion of aluminium alloys examined by electrode impedance. Electrochim. Acta 1997, 42, 87–97. [Google Scholar] [CrossRef]
- Kim, K.H.; Lee, S.H.; Nam, N.D.; Kim, J.G. Effect of cobalt on the corrosion resistance of low alloy steel in sulphuric acid solution. Corros. Sci. 2011, 53, 3576–3587. [Google Scholar] [CrossRef]
- Lopez, D.A.; Simison, S.N.; Sanchez, S.R. The influence of steel microstructure on CO2 corrosion. EIS studies on the inhibition efficiency of benzimidazole. Electrochim. Acta 2003, 48, 845–854. [Google Scholar] [CrossRef]
- Bentiss, F.; Lebrini, M.; Vezin, H.; Chai, F.; Traisnel, M.; Lagrene, M. Enhanced corrosion resistance of carbon steel in normal sulphuric acid medium by some macrocyclic polyether compounds containing a 1,3,4-thiadizole moiety: AC impedance and computational studies. Corros. Sci. 2009, 51, 2165–2173. [Google Scholar] [CrossRef]
- Hsu, C.H.; Mansfeld, F. Technical note: Concerning the conversion of the constant phase element parameter Y0 into a capacitance. Corrosion 2001, 57, 747–748. [Google Scholar] [CrossRef]
- Tsivoulas, D.; Robson, J.D. Heterogeneous Zr solute segregation and Al3Zr dispersoid distributions in Al-Cu-Li alloys. Acta Mater. 2015, 93, 73–86. [Google Scholar] [CrossRef]
- Tsivoulas, D.; Robson, J.D.; Sigli, C.; Prangnell, P.B. Interaction between zirconium and manganese dispersoid-forming elements on their combined addition in Al-Cu-Li alloys. Acta Mater. 2012, 60, 5245–5259. [Google Scholar] [CrossRef]
- Jia, Z.; Hu, G.; Forbod, B.; Solberg, J.K. Effect of homogenization and alloying elements on recrystallization resistance of Al-Zr-Mn alloys. Mater. Sci. Eng. A 2007, 444, 284–290. [Google Scholar] [CrossRef]
- Knipling, K.E.; Karnesky, R.A.; Lee, C.P.; Dunand, D.C.; Seidman, D.N. Precipitation evolution in Al-0.1Sc, Al-0.1Zr and Al-0.1Sc-0.1Zr (at.%) alloys during isochronal aging. Acta Mater. 2010, 58, 5184–5195. [Google Scholar] [CrossRef]


| Materials | Fe | Cu | Si | Zr | Al |
|---|---|---|---|---|---|
| A1070 | 0.1104 | 0.0046 | 0.1519 | - | Rem. |
| U1070 | 0.1087 | 0.0037 | 0.1498 | 0.1991 | Rem. |
| pH | Acetic Acid | NaCl |
|---|---|---|
| 2.9 | 20 mg/L | 4.2 wt % |
| Boundary | Corrosion Potential (mVSCE) | Corrosion Current Density (A/cm2) | Tafel Slope (V/Decade) |
|---|---|---|---|
| Al matrix | −823 | 3.9 × 10⁻⁶ | 0.1 |
| Al3Fe | −539 | 2.1 × 10⁻⁶ | −0.7 |
| Al3Zr | −776 | 2.5 × 10⁻⁶ | −0.7 |
| Simulation Case | Model | Diameter of IMP (mm) | Area of IMPs (mm2) | Type of IMPs |
|---|---|---|---|---|
| 1 | Coarse IMPs (large area) | 0.12 | 0.0678 | Al3Fe |
| 2 | Fine IMPs (large area) | 0.02 | 0.0678 | Al3Fe |
| 3 | 0.02 | 0.0678 | Al3Zr | |
| 4 | Fine IMPs (small area) | 0.02 | 0.0339 | Al3Fe |
| Specimen | βa (V/Decade) | βc (V/Decade) | icorr (μA/cm2) | Ecorr (VSCE) |
|---|---|---|---|---|
| A1070 | 0.072 ± 0.005 | 0.123 ± 0.01 | 98.6 ± 2.5 | −0.845 ± 0.05 |
| U1070 | 0.089 ± 0.003 | 0.137 ± 0.01 | 31.5 ± 1.9 | −0.911 ± 0.09 |
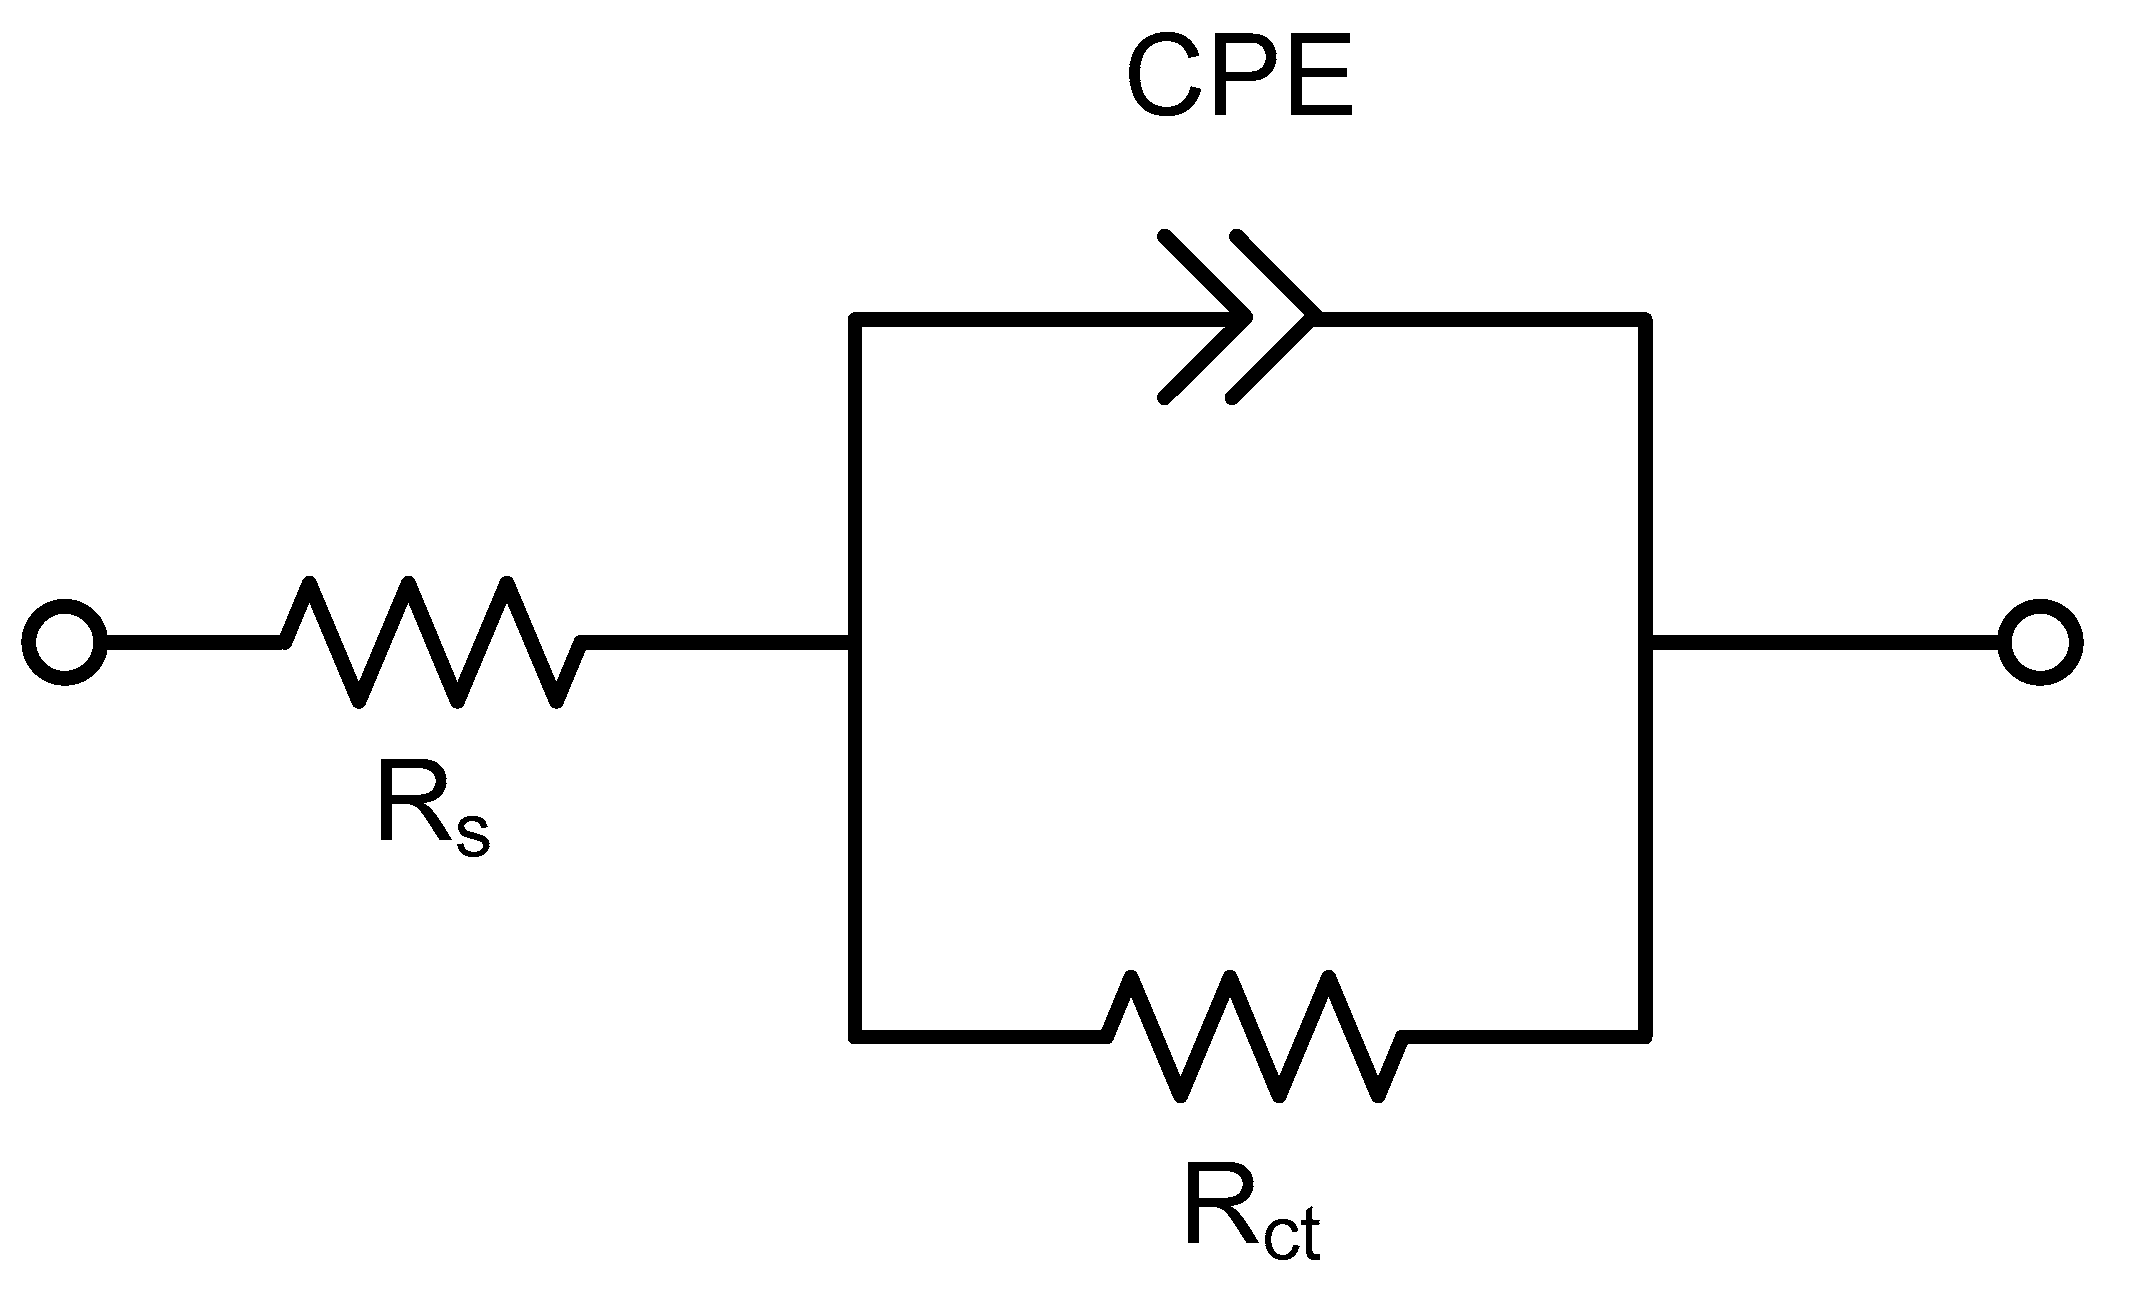
| Specimen | Rs (Ω × cm2) | Rct (Ω × cm2) | n | Cdl (μF/cm2) |
|---|---|---|---|---|
| A1070 | 4.77 ± 0.5 | 357 ± 11 | 0.98 ± 0.02 | 81.5 ± 5 |
| U1070 | 1.98 ± 0.3 | 683 ± 35 | 0.95 ± 0.03 | 116.4 ± 9 |
© 2018 by the authors. Licensee MDPI, Basel, Switzerland. This article is an open access article distributed under the terms and conditions of the Creative Commons Attribution (CC BY) license (http://creativecommons.org/licenses/by/4.0/).
Share and Cite
Kim, Y.-S.; Park, J.G.; An, B.-S.; Lee, Y.H.; Yang, C.-W.; Kim, J.-G. Investigation of Zirconium Effect on the Corrosion Resistance of Aluminum Alloy Using Electrochemical Methods and Numerical Simulation in an Acidified Synthetic Sea Salt Solution. Materials 2018, 11, 1982. https://doi.org/10.3390/ma11101982
Kim Y-S, Park JG, An B-S, Lee YH, Yang C-W, Kim J-G. Investigation of Zirconium Effect on the Corrosion Resistance of Aluminum Alloy Using Electrochemical Methods and Numerical Simulation in an Acidified Synthetic Sea Salt Solution. Materials. 2018; 11(10):1982. https://doi.org/10.3390/ma11101982
Chicago/Turabian StyleKim, Yong-Sang, Jong Gil Park, Byeong-Seon An, Young Hee Lee, Cheol-Woong Yang, and Jung-Gu Kim. 2018. "Investigation of Zirconium Effect on the Corrosion Resistance of Aluminum Alloy Using Electrochemical Methods and Numerical Simulation in an Acidified Synthetic Sea Salt Solution" Materials 11, no. 10: 1982. https://doi.org/10.3390/ma11101982