Modeling of Microsegregation and Homogenization of 6xxx Al-Alloys Including Precipitation and Strengthening During Homogenization Cooling


Abstract
:
1. Introduction
2. Materials and Experimental Procedures
3. Modeling Approaches
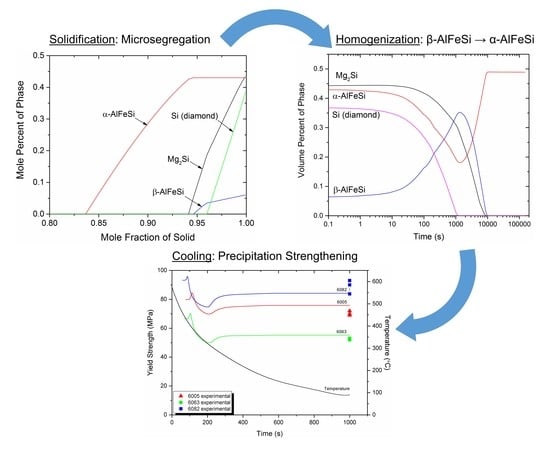
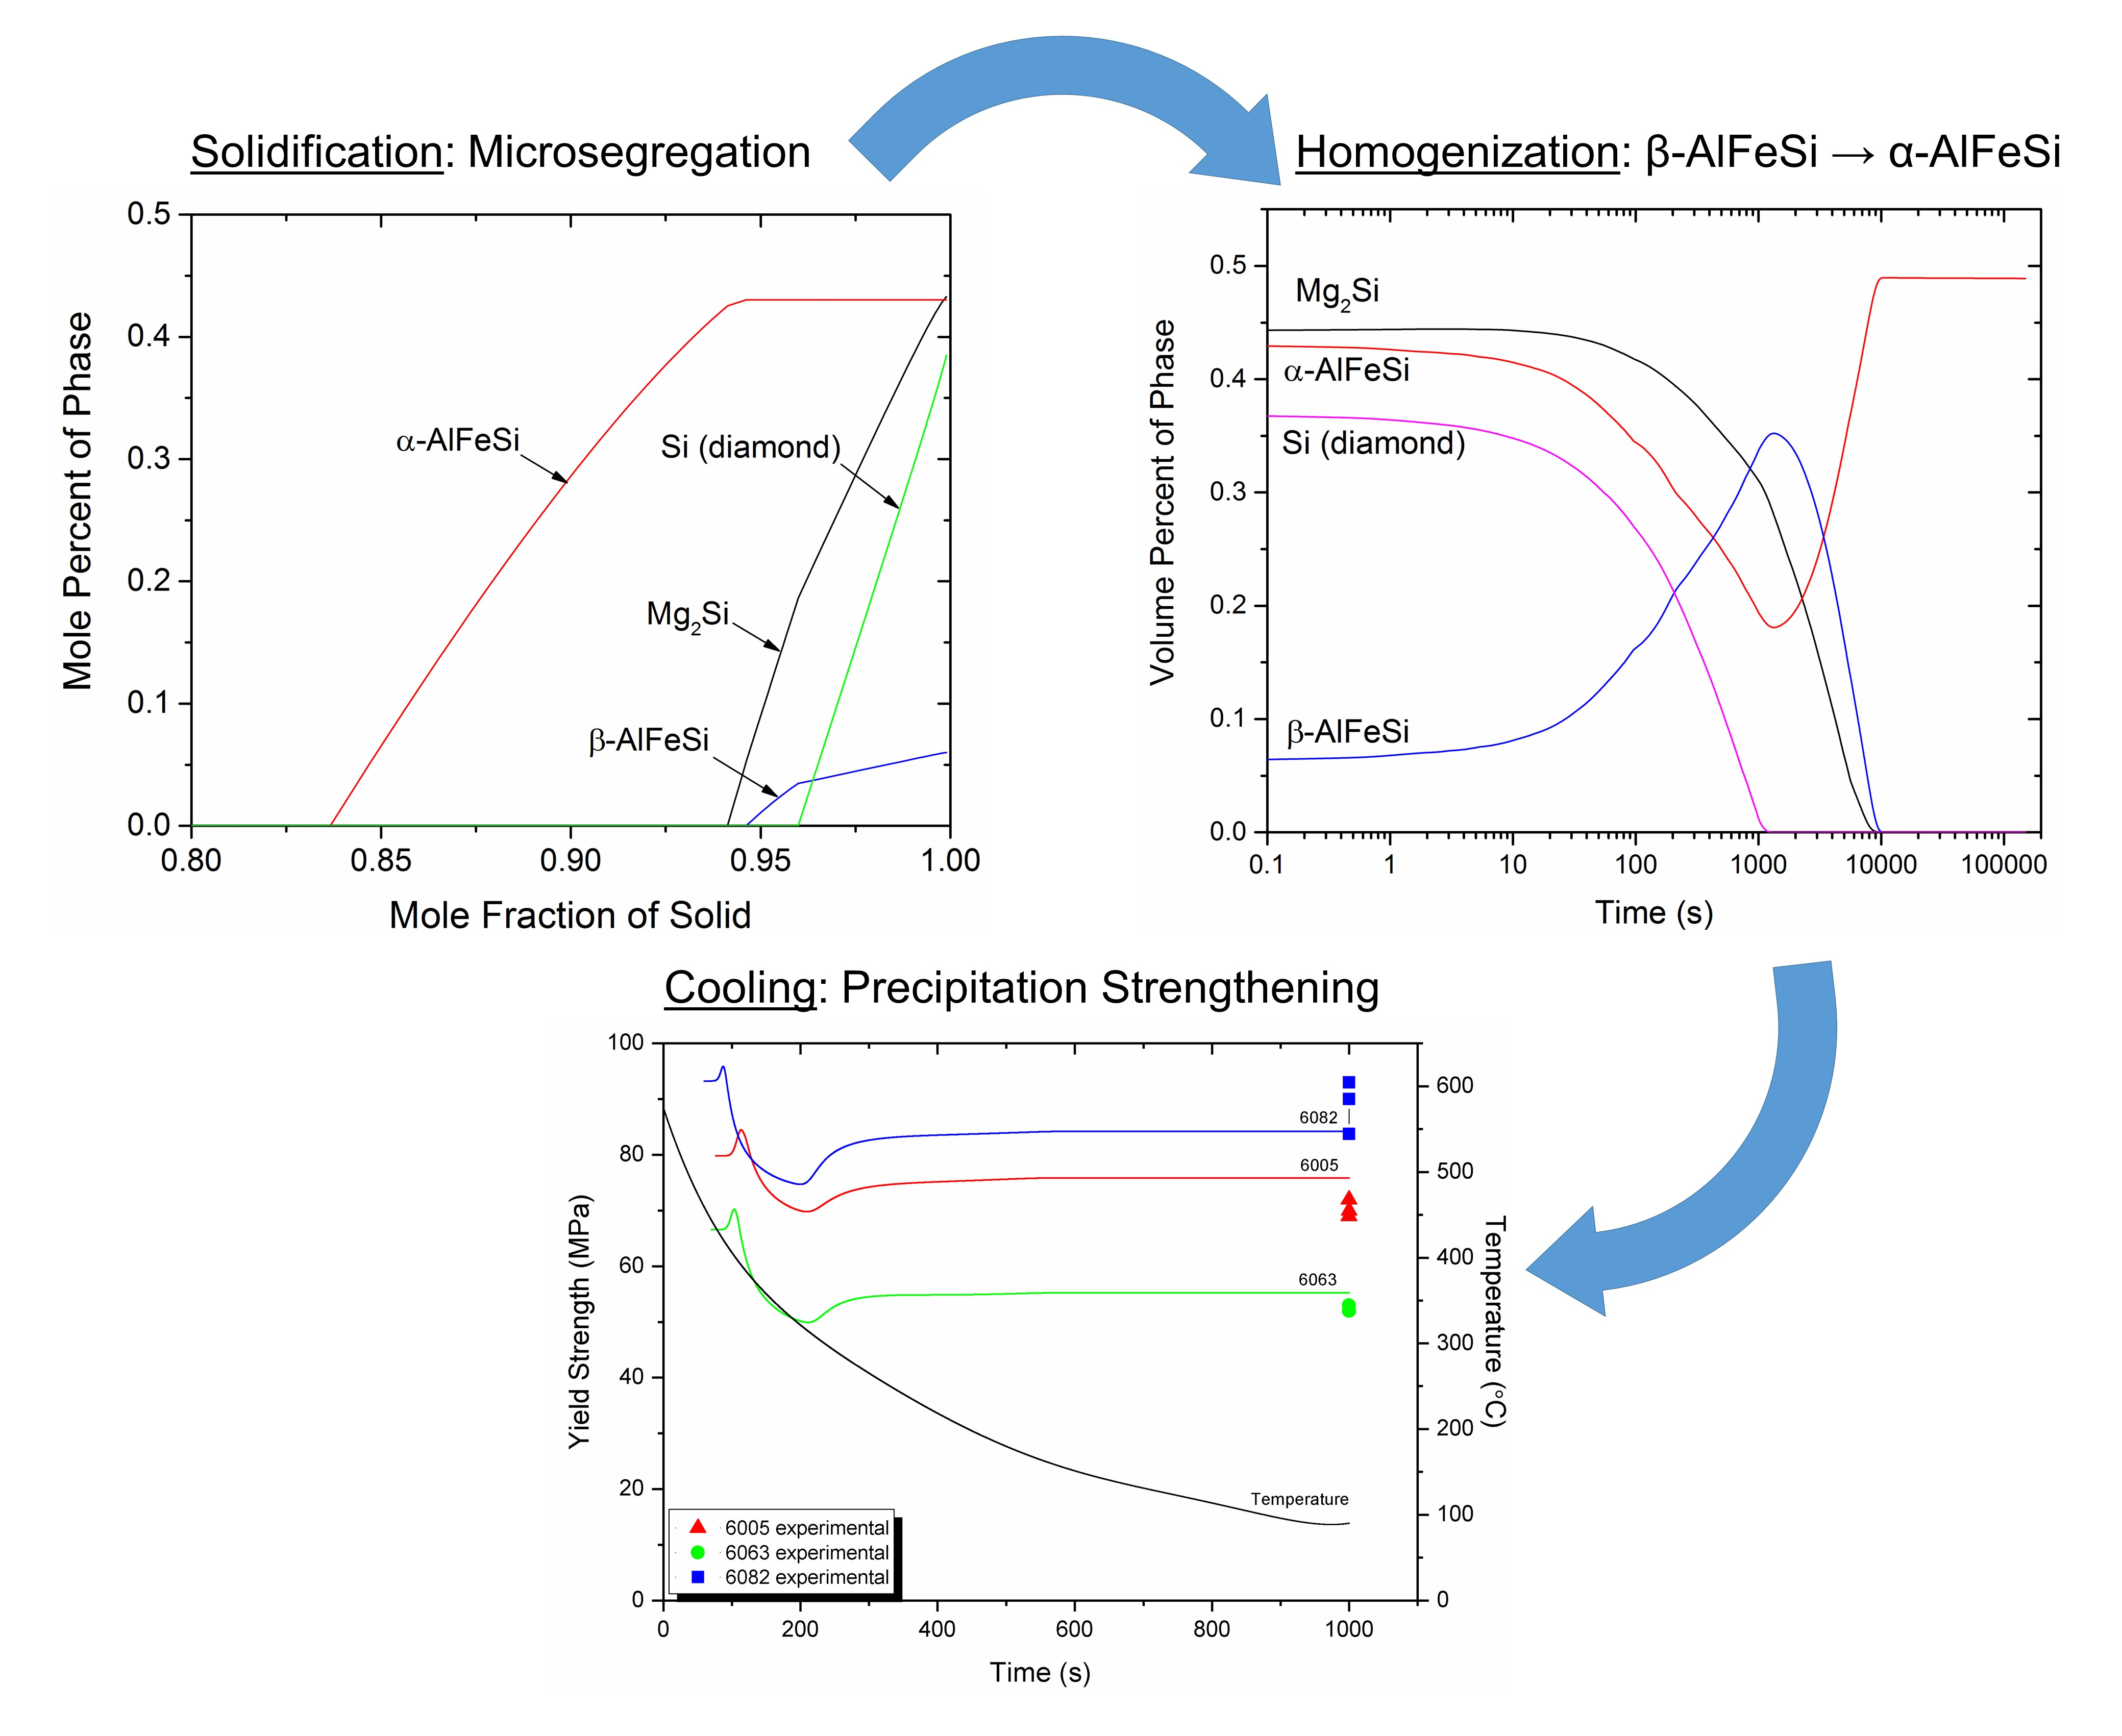
3.1. General Description
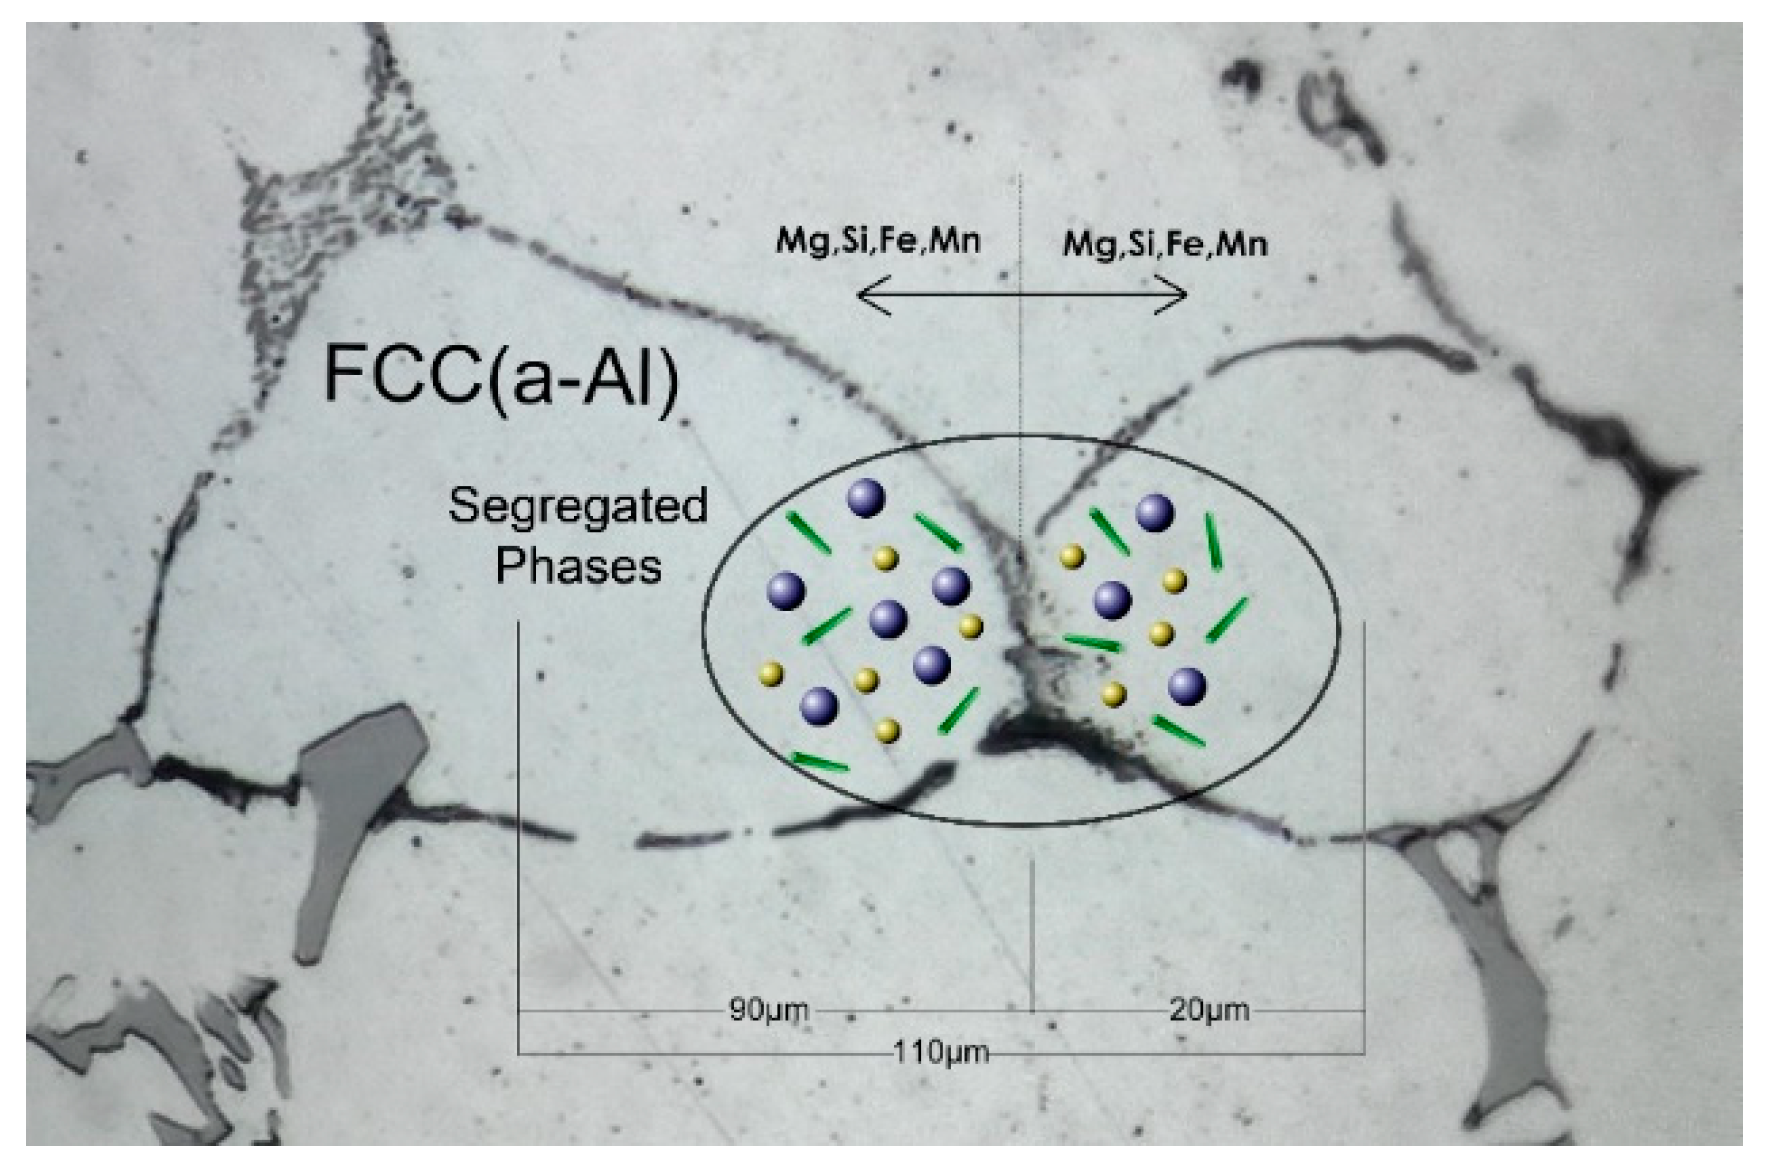
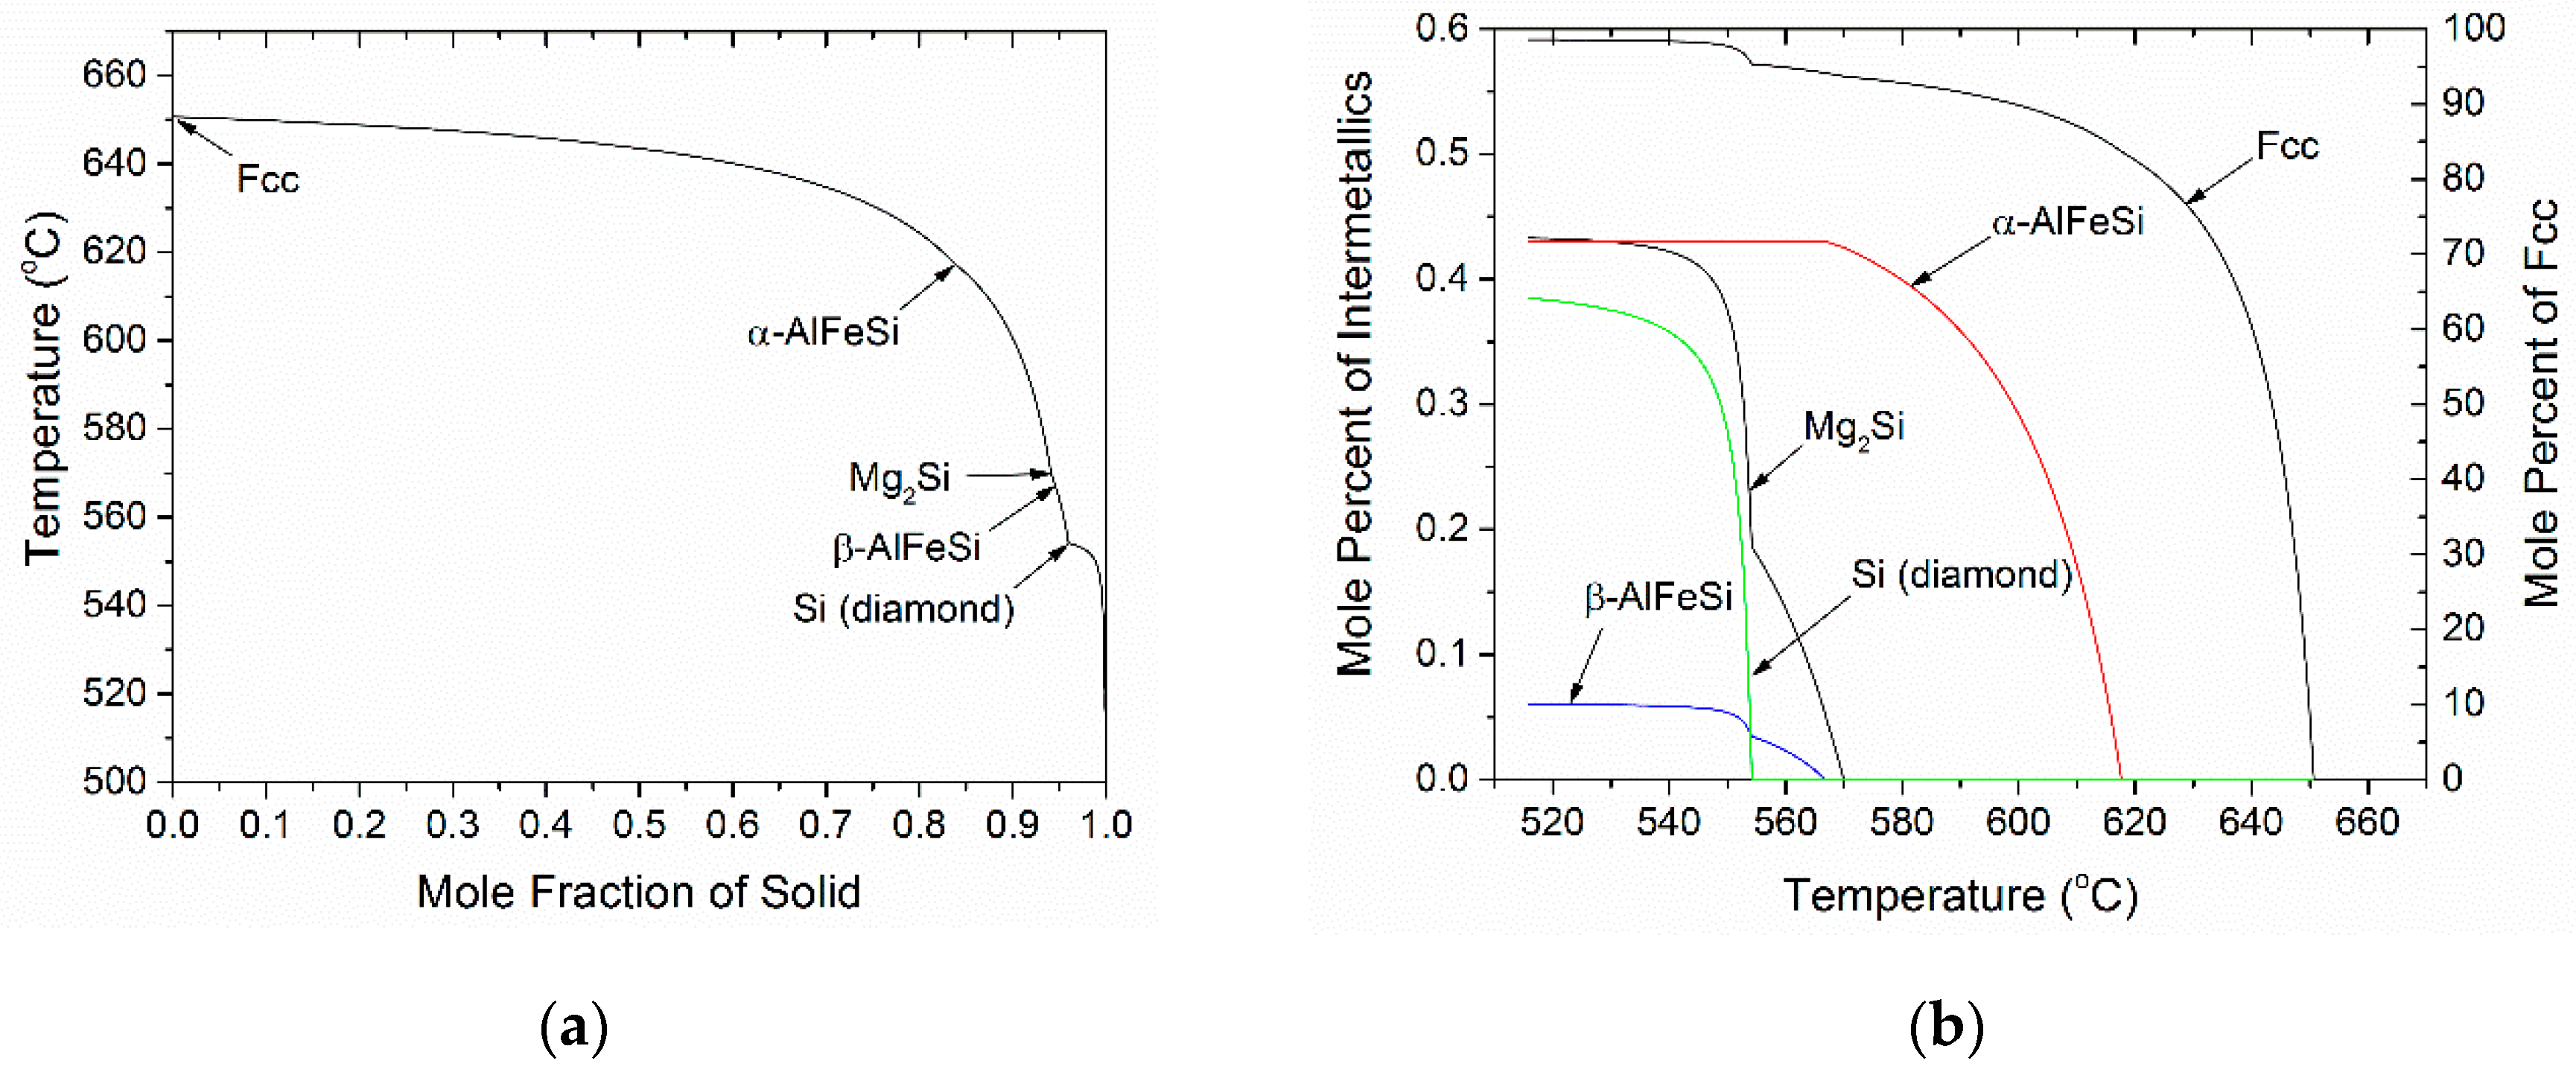
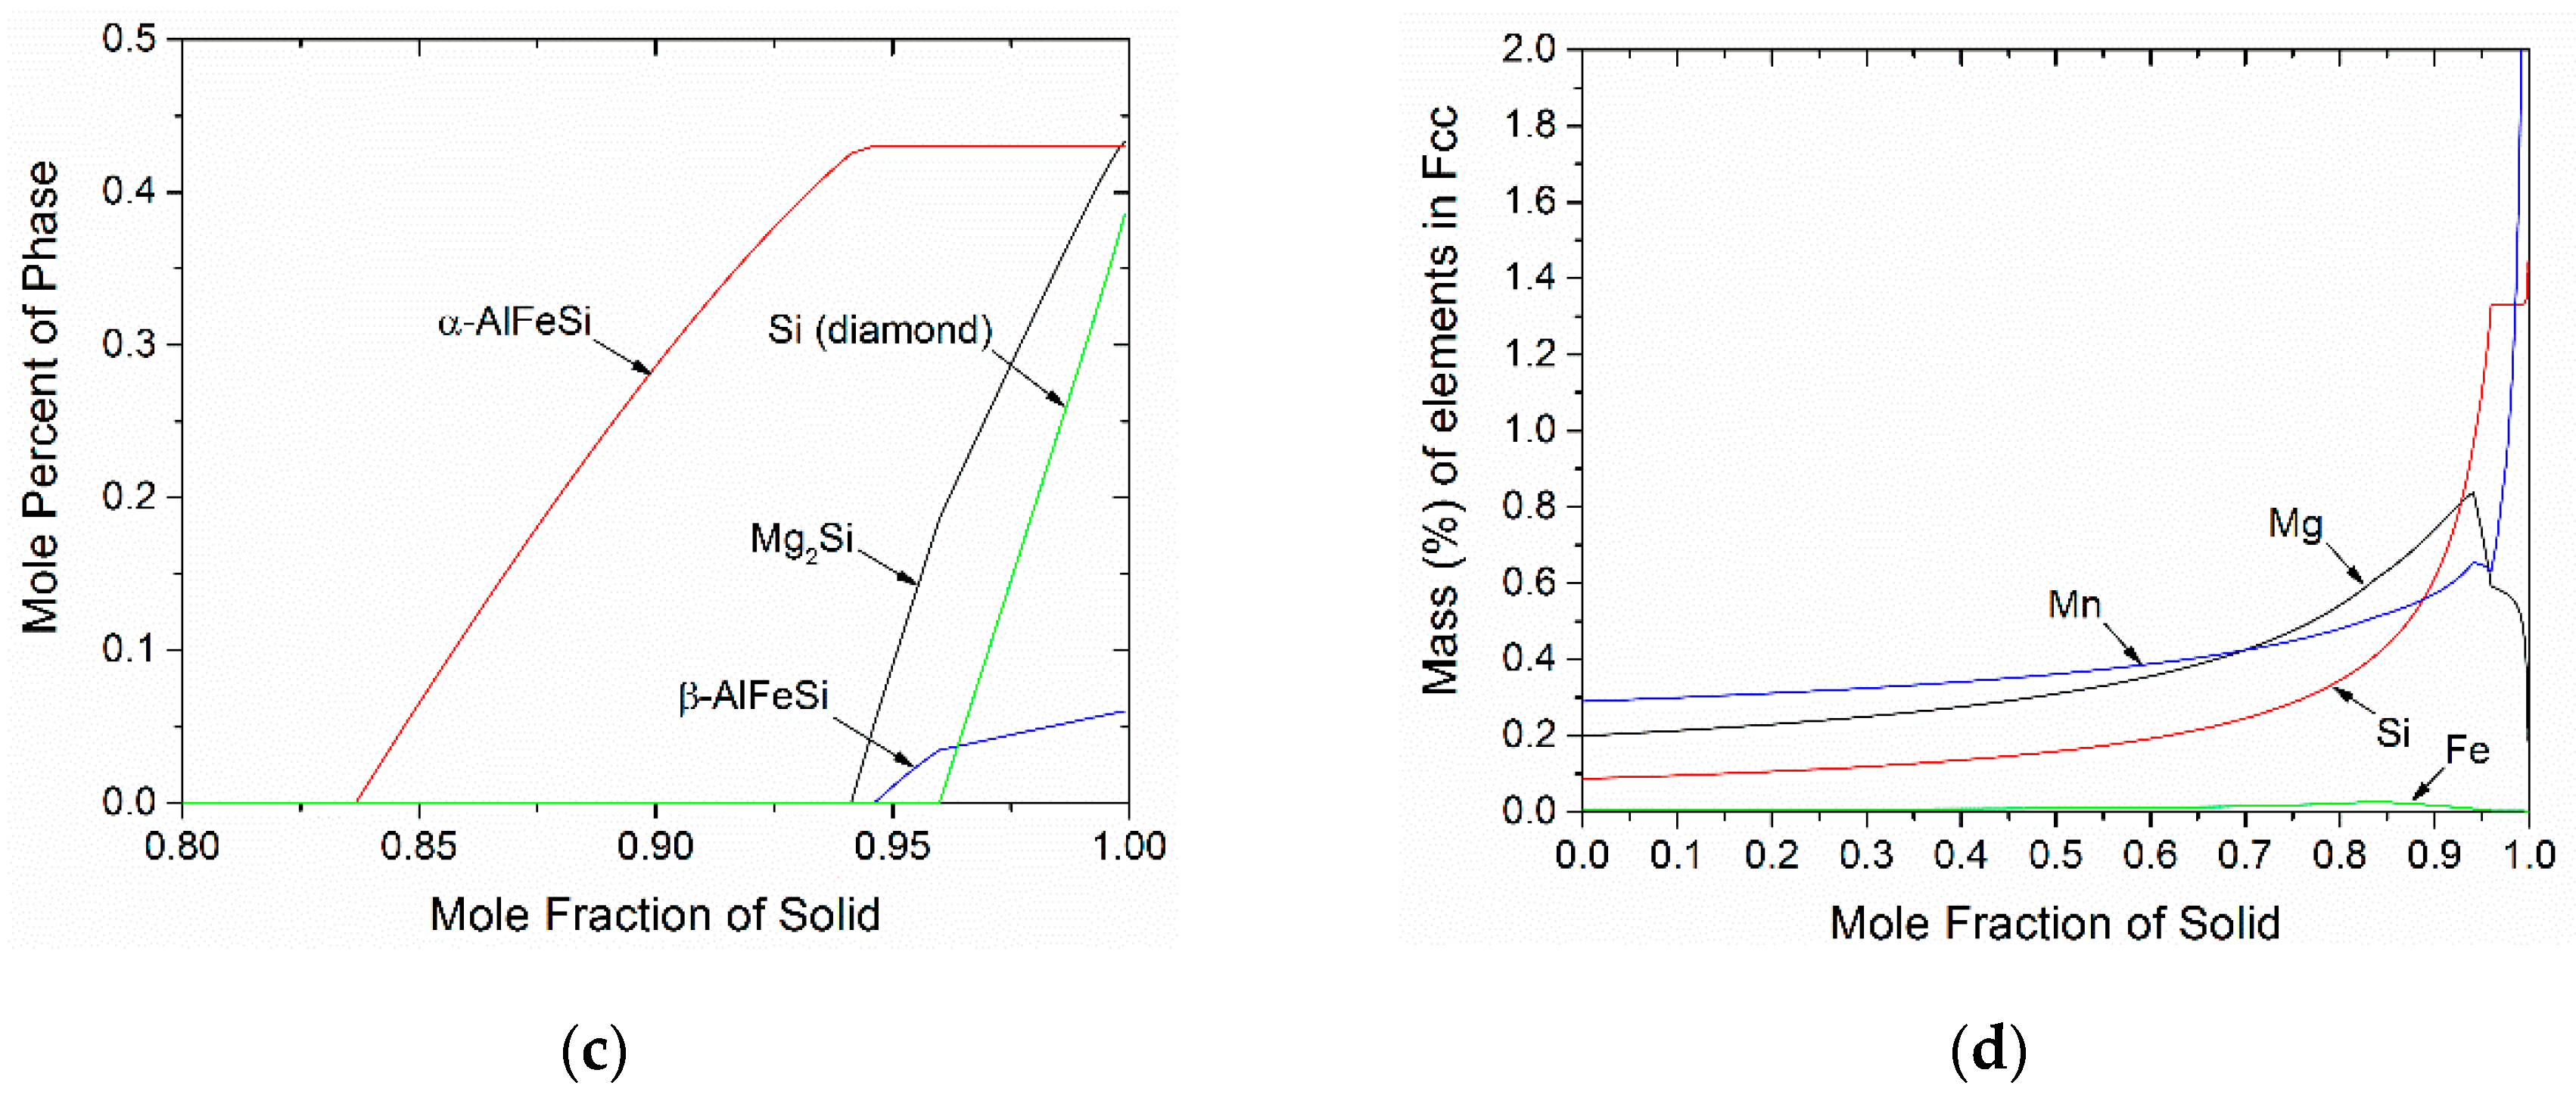
3.2. Microsegragation During Solidification
3.3. Homogenization (Holding)
3.4. Homogenization Cooling
- The diffusion coefficients were considered constant with respect to element concentration.
- Precipitation was controlled by the diffusion of Mg, as it is the dominant component of Mg2Si.
- The dilution in the matrix was considered infinite.
- Mg2Si particles were considered spherical and with stoichiometric composition.
- There was no interaction of the diffusion fields around the particles.
- The cooling rate was slow enough, so that transient diffusion effects were minimal and thus quasi-steady state conditions could be assumed.
4. Results
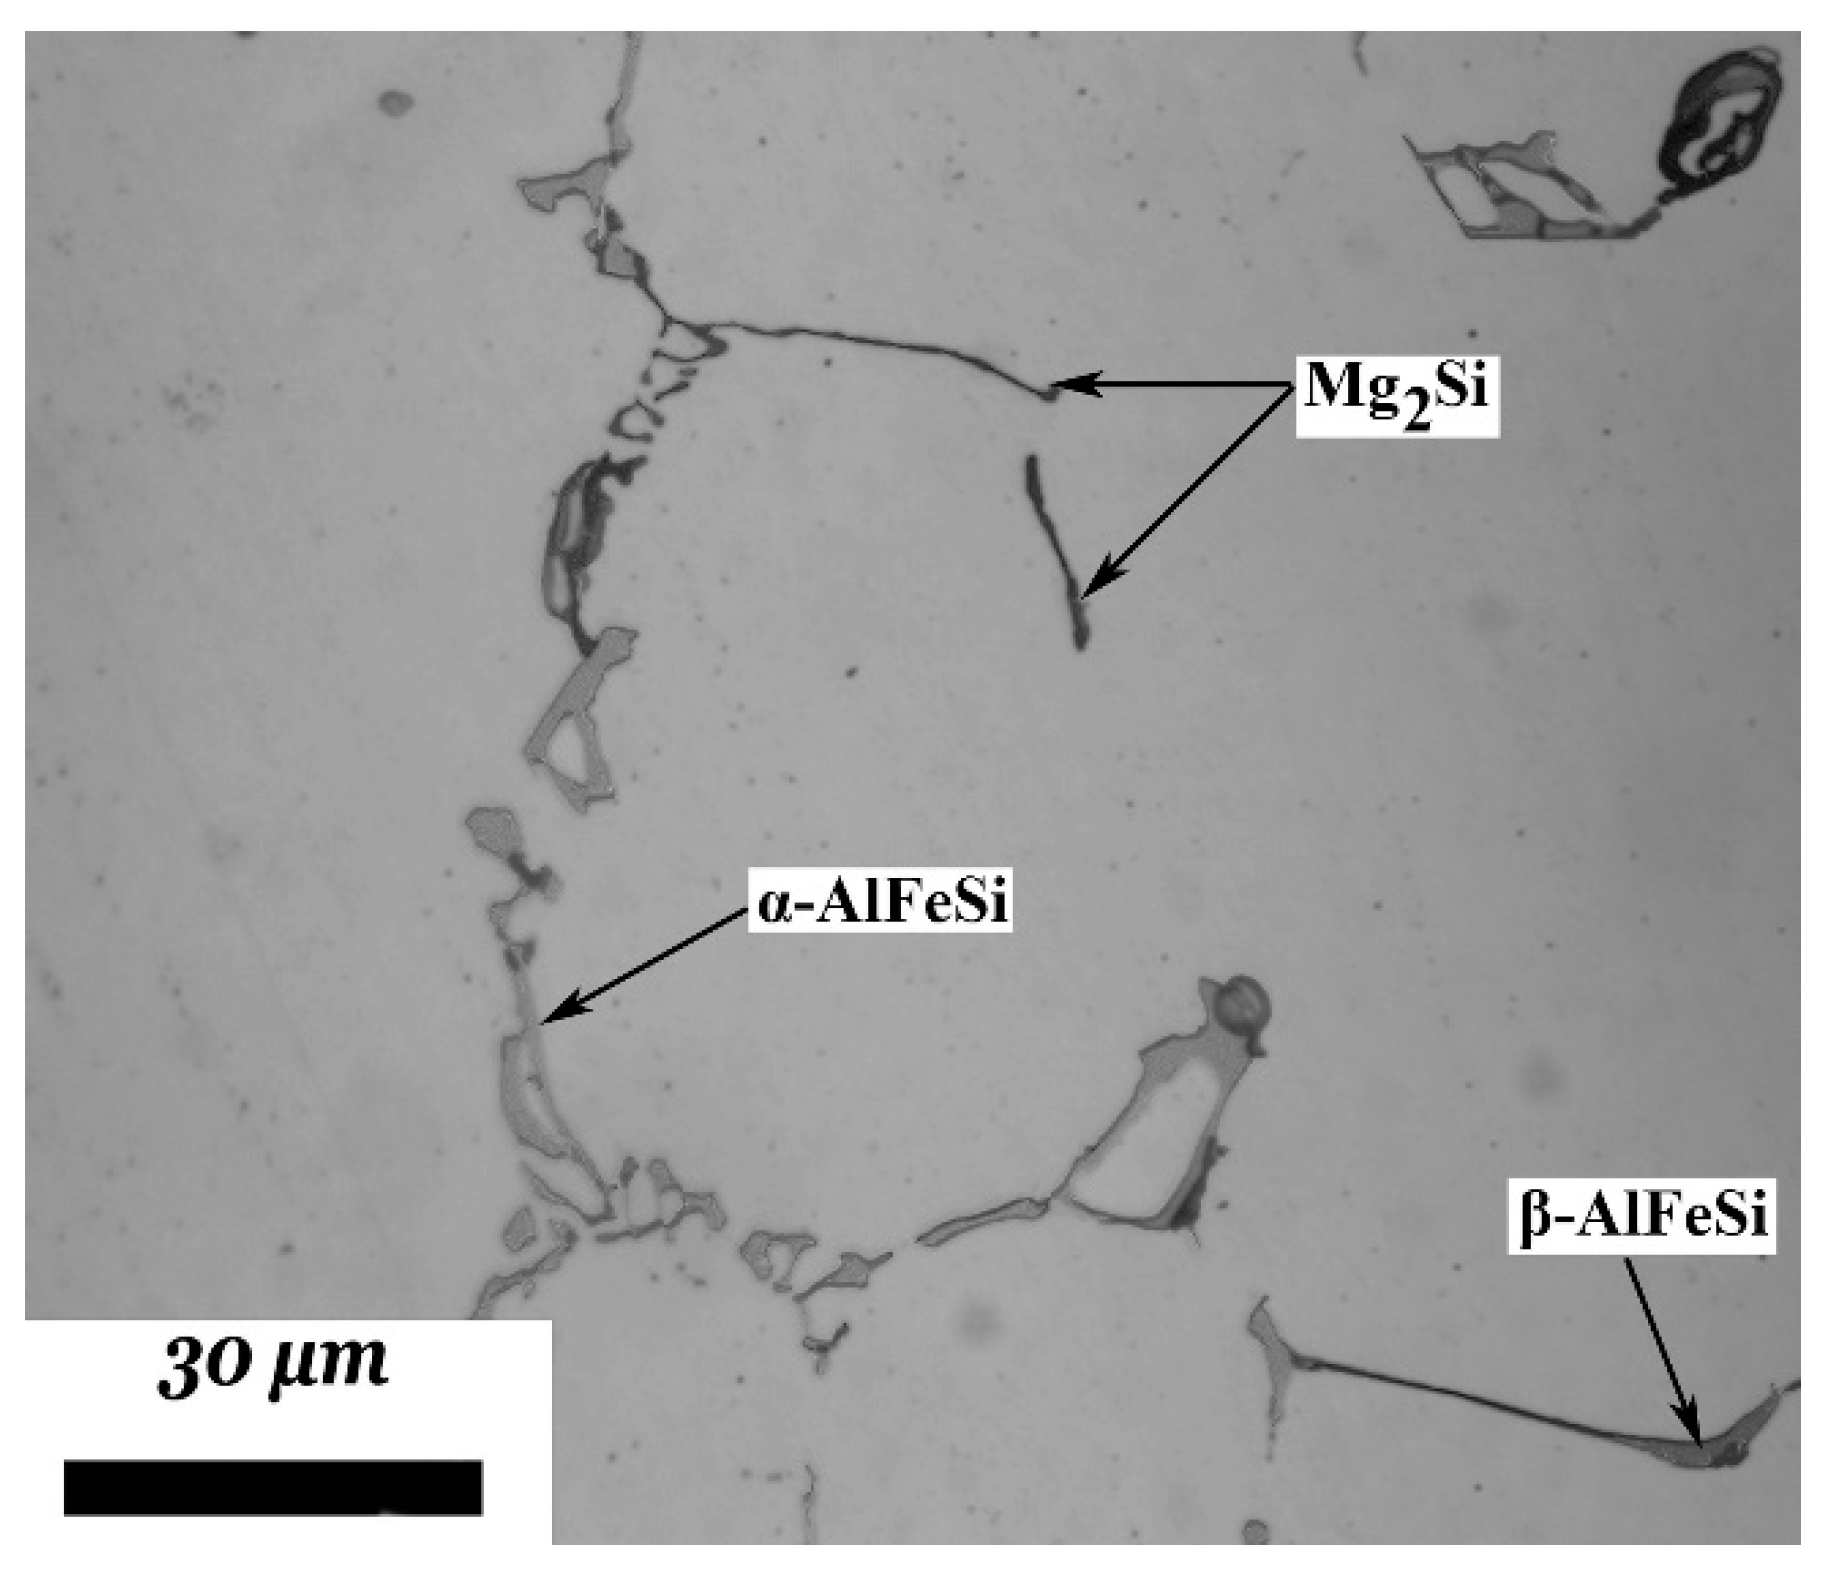
4.1. Microsegregation of As-Cast Alloy
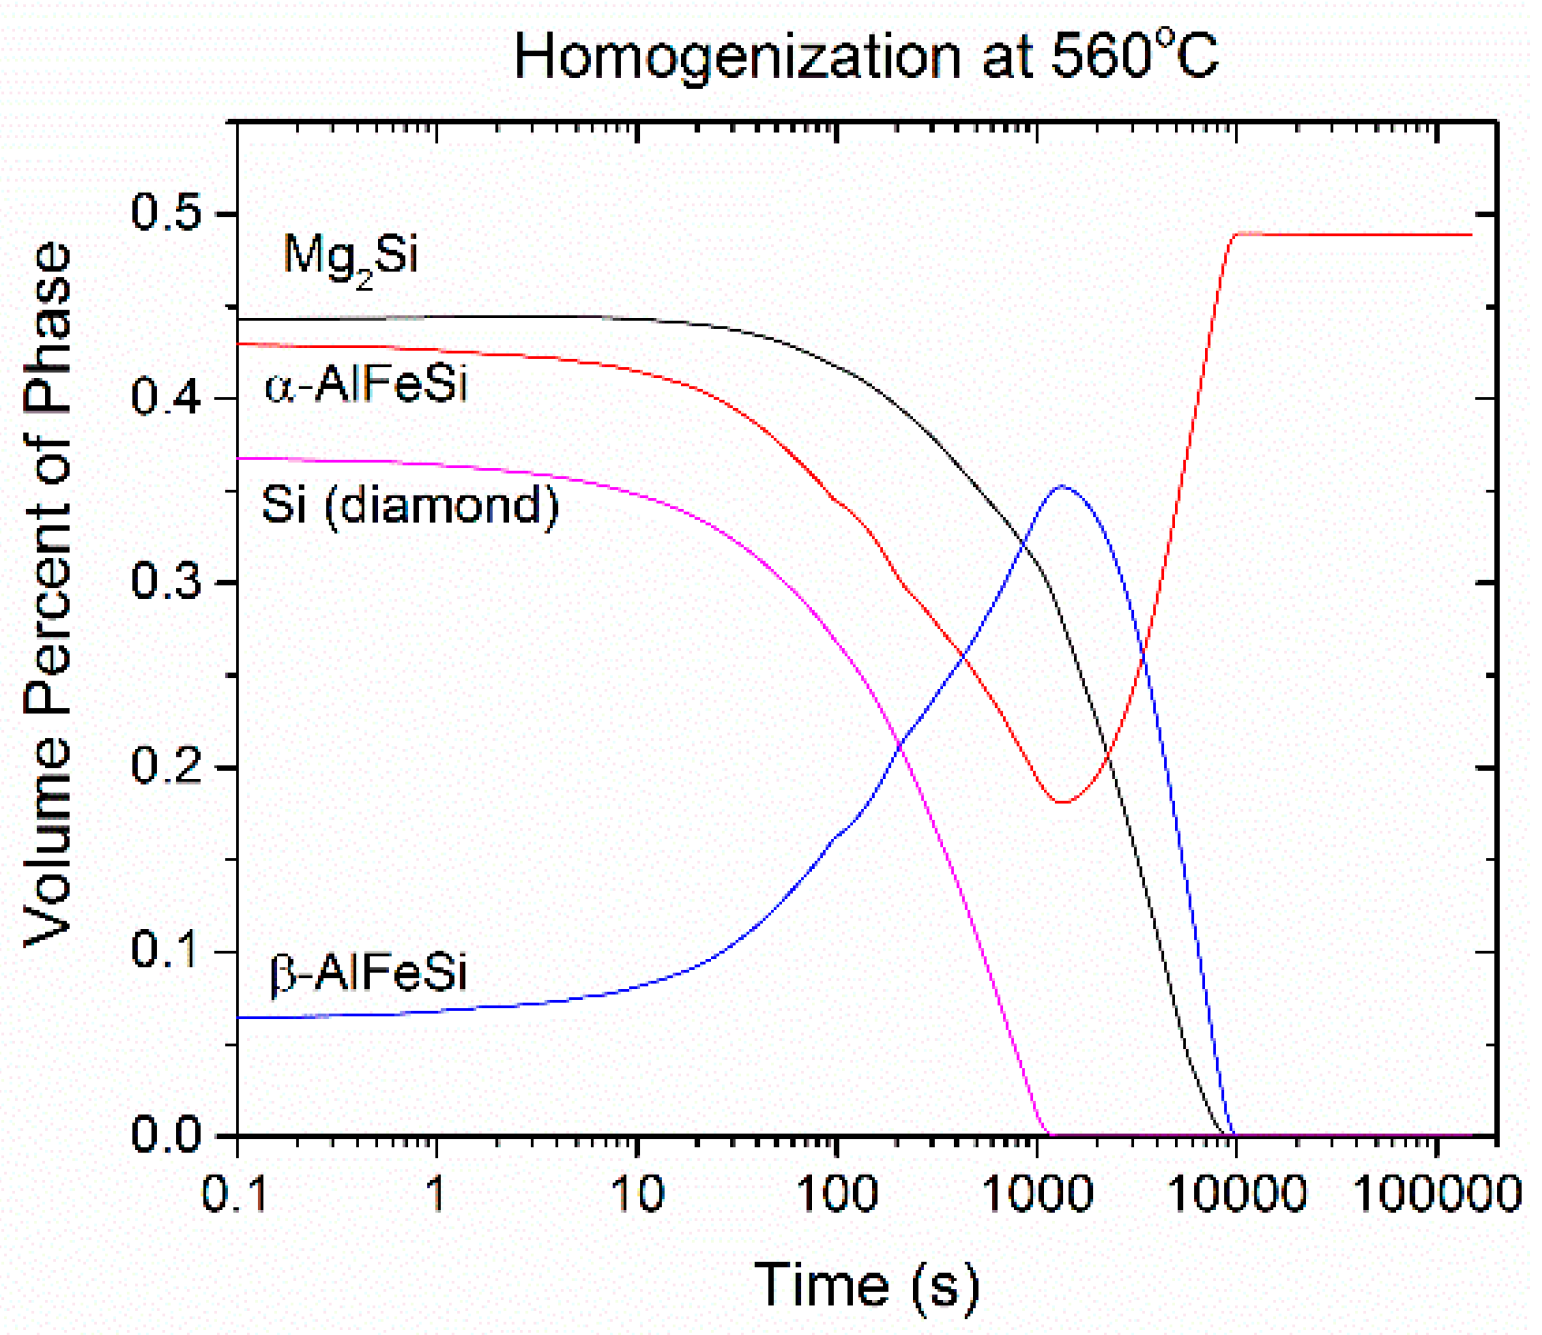
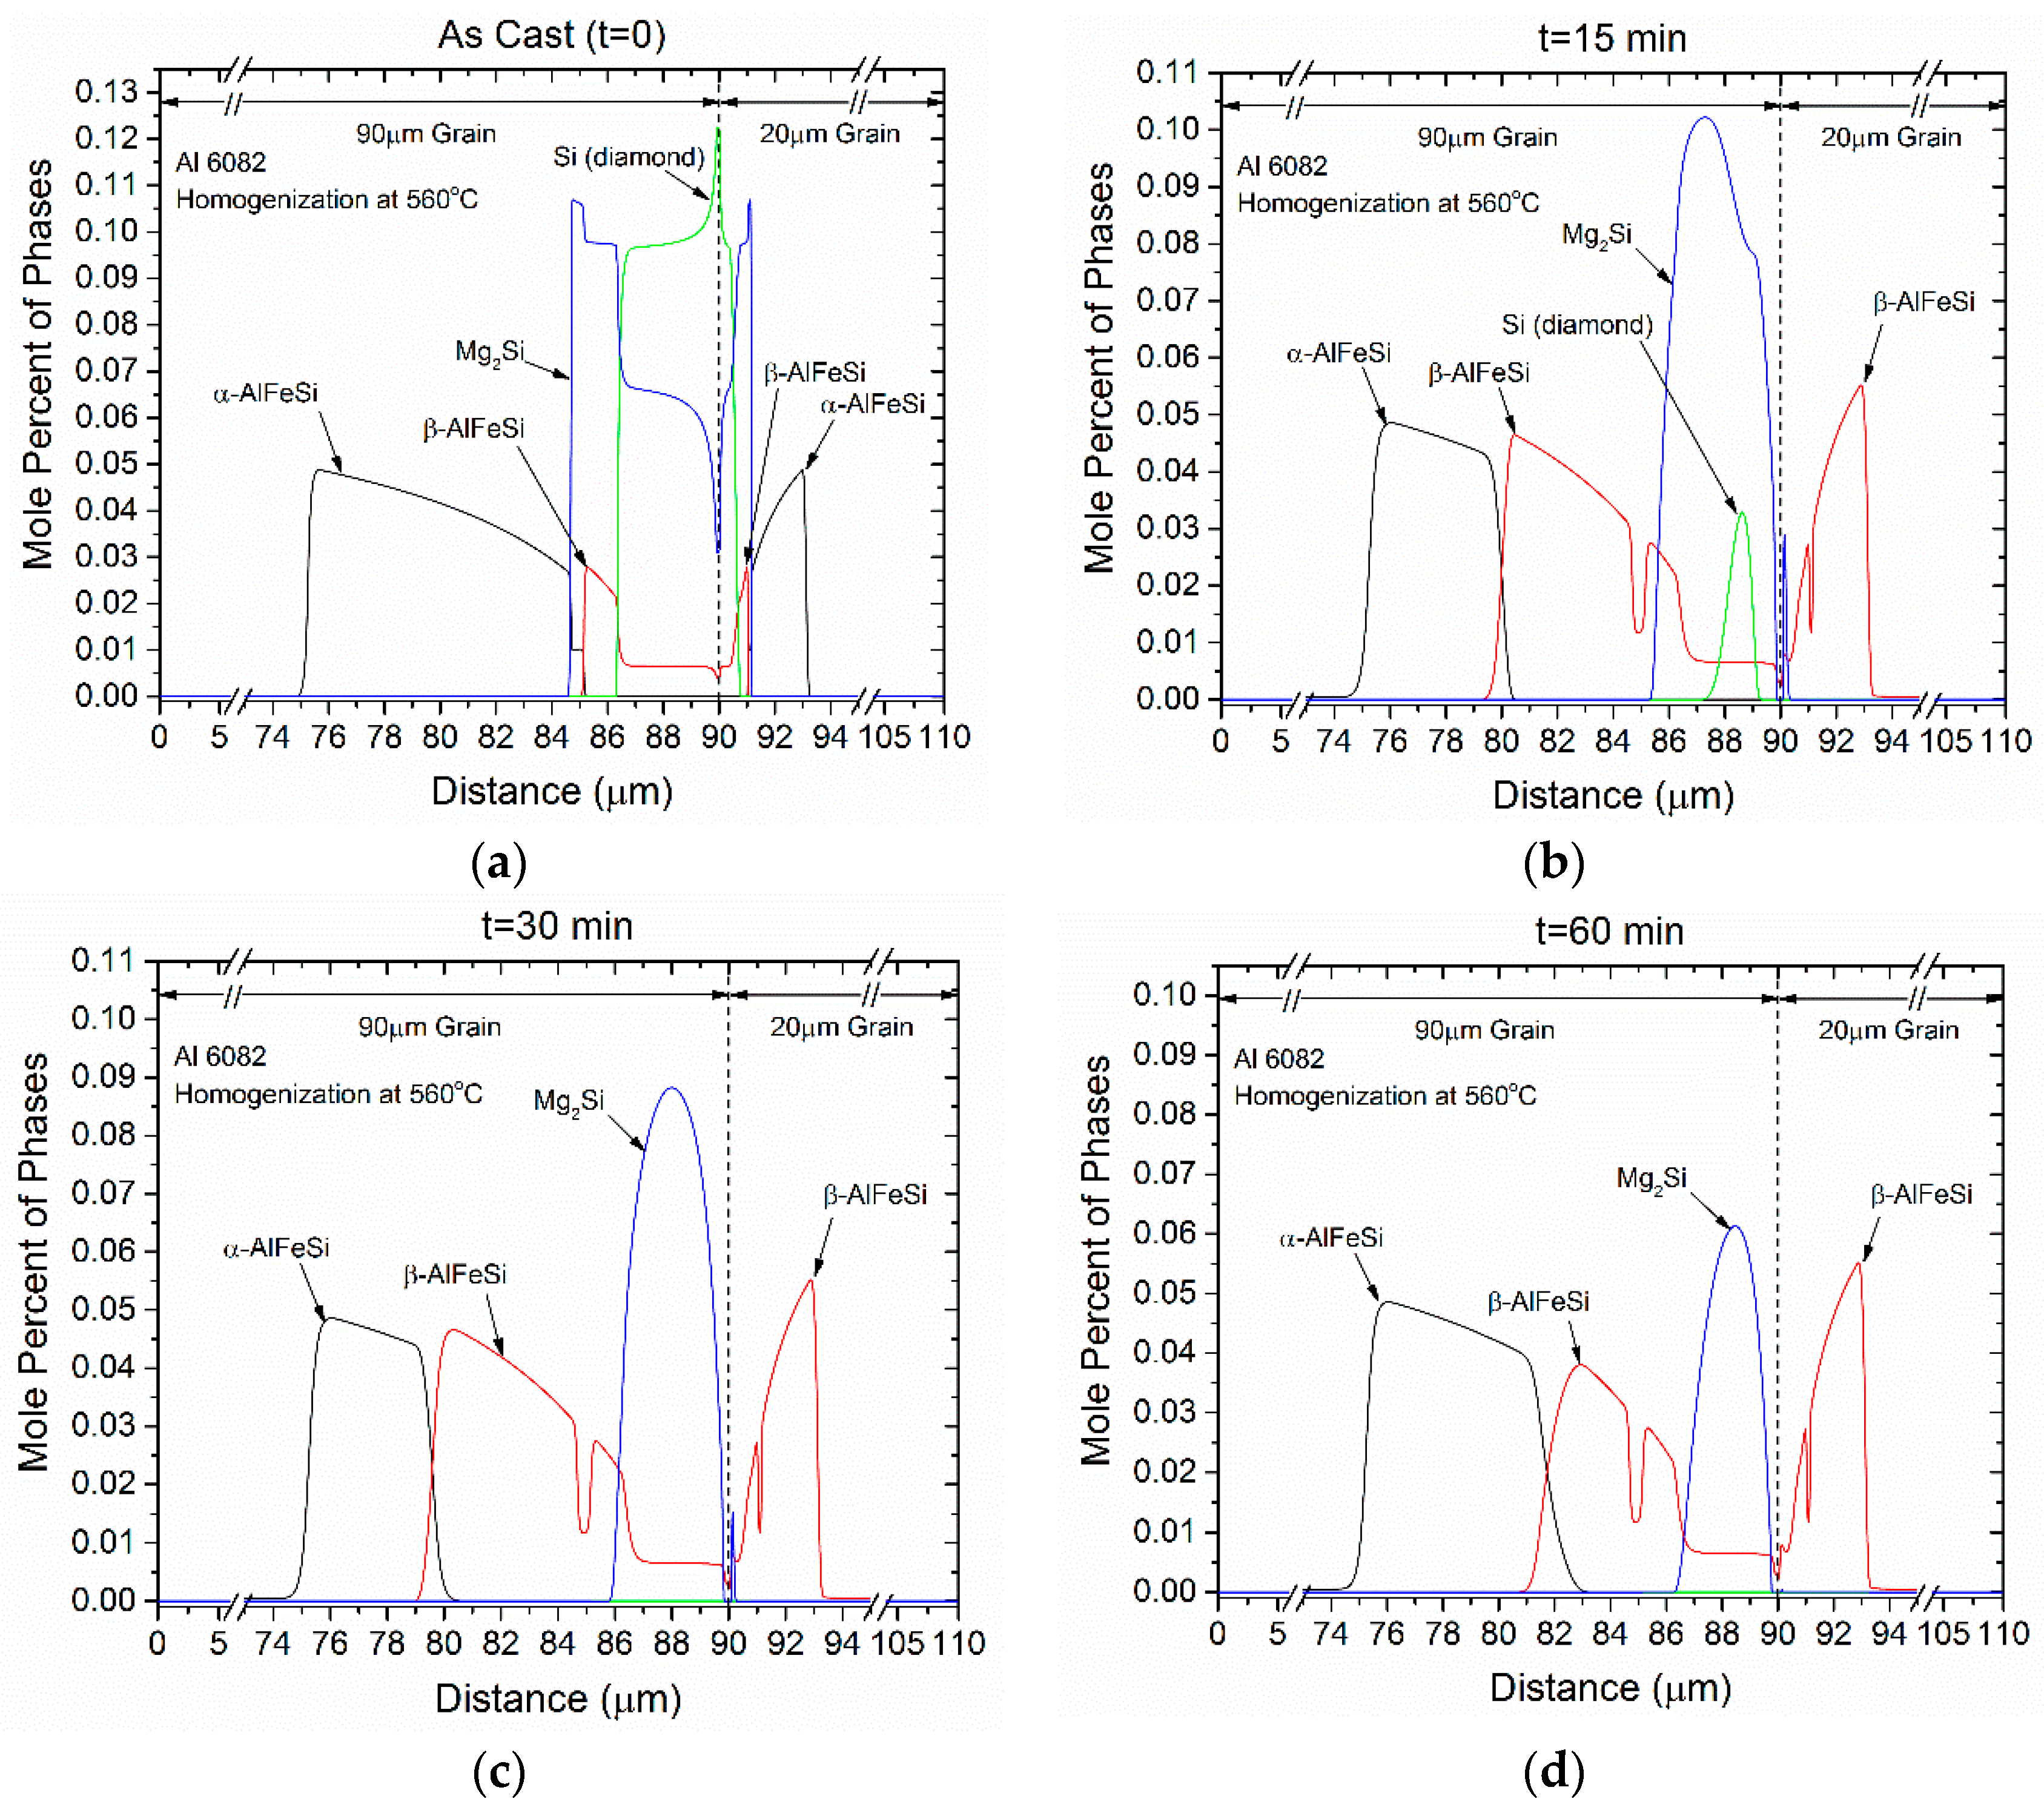
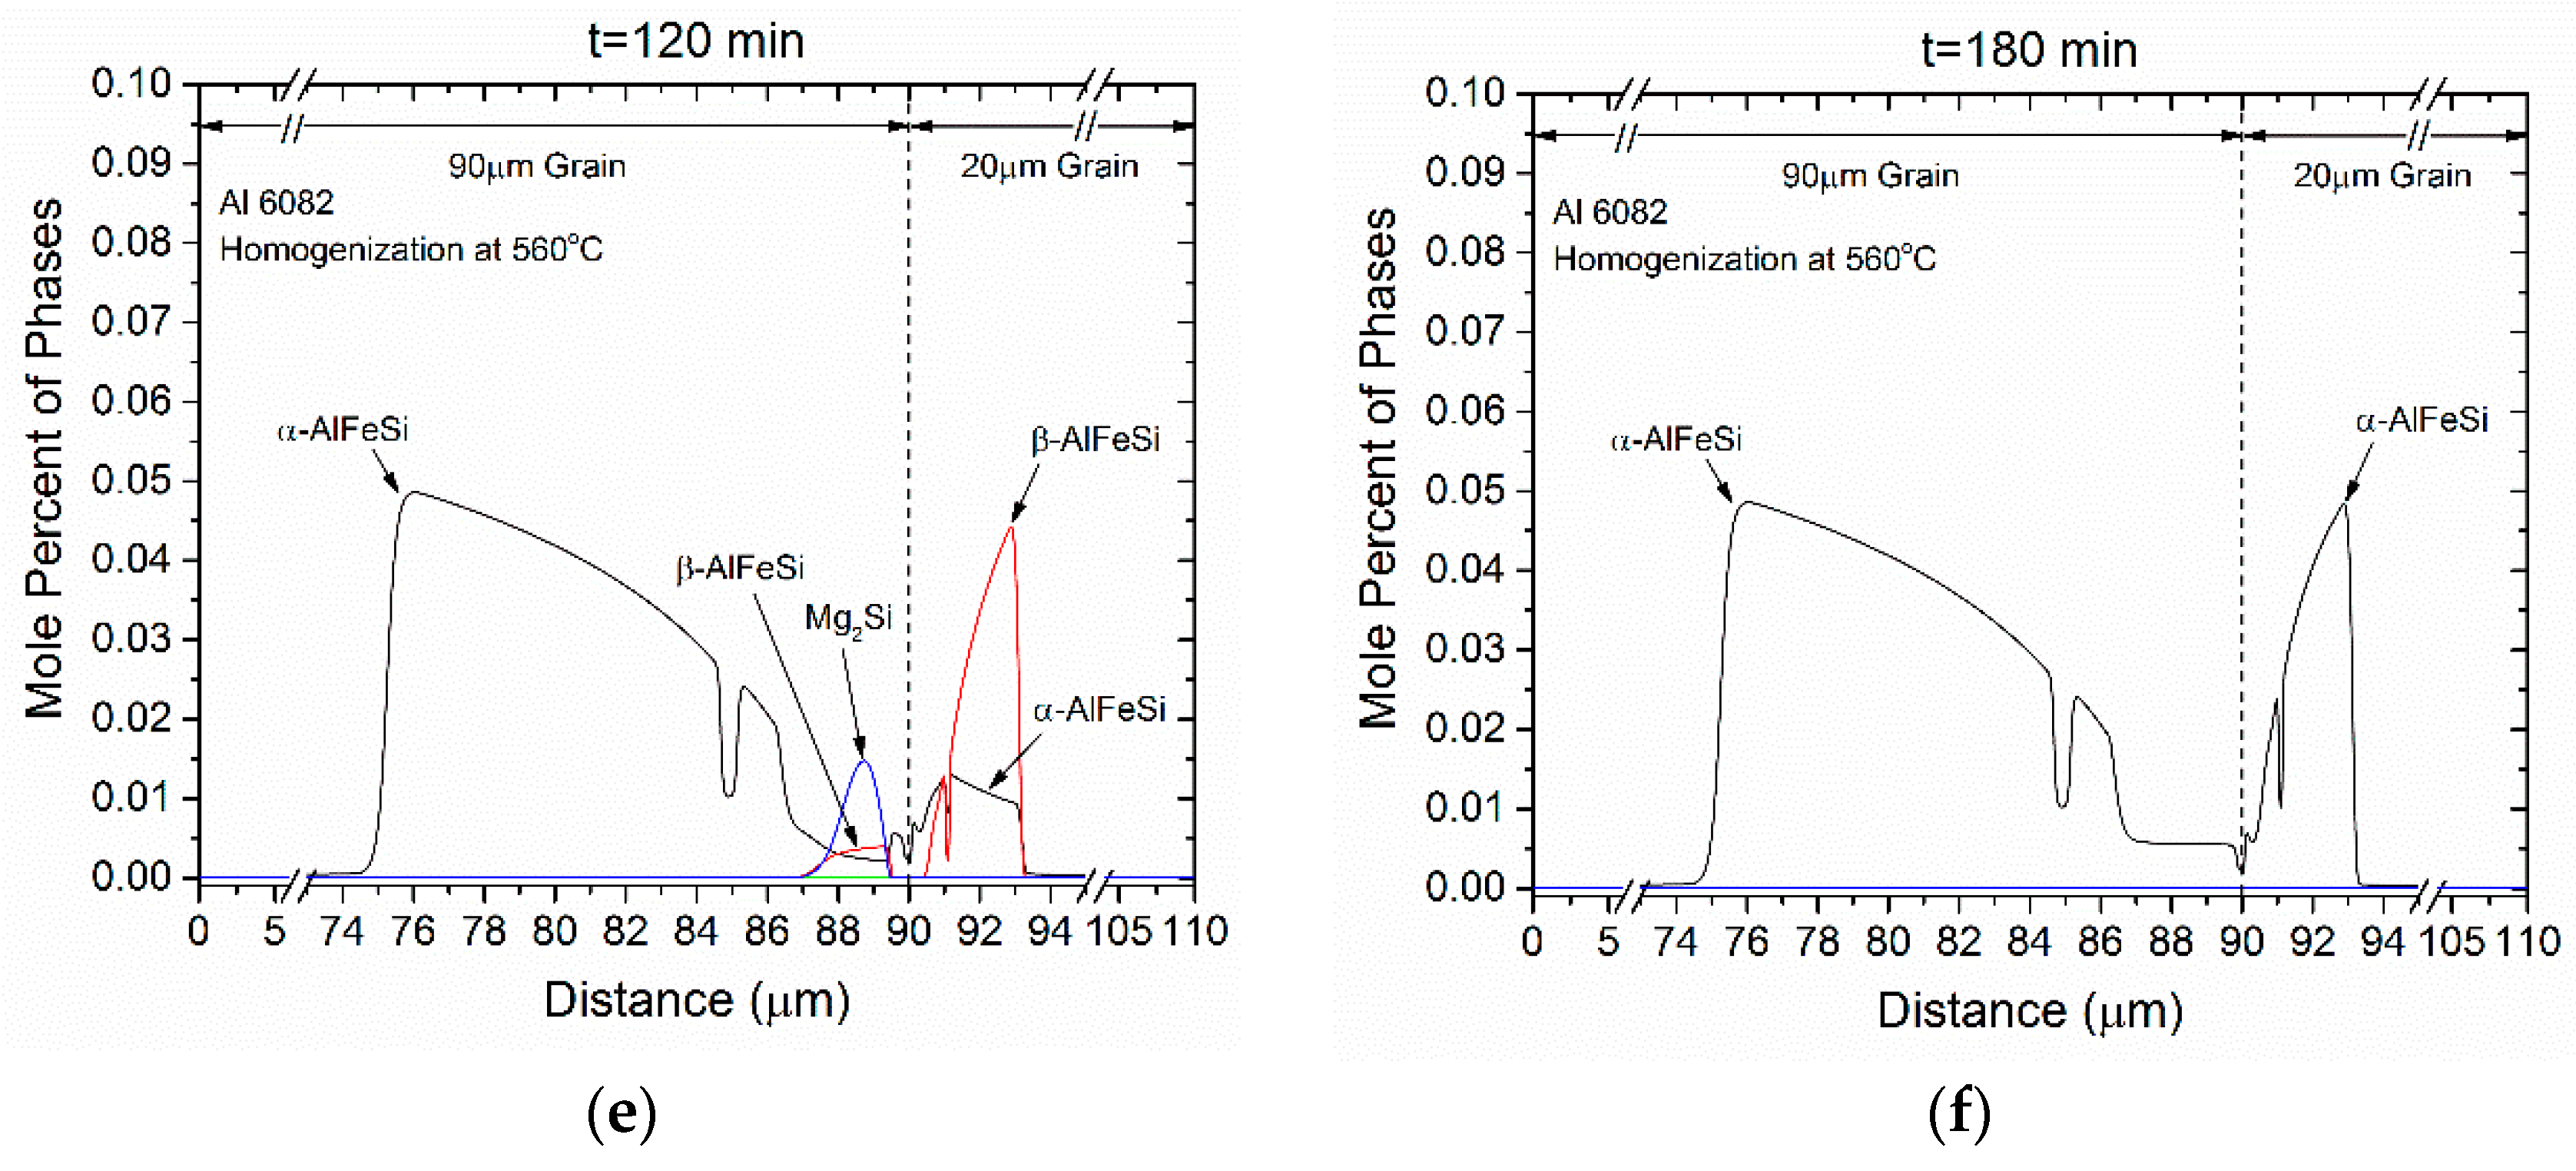
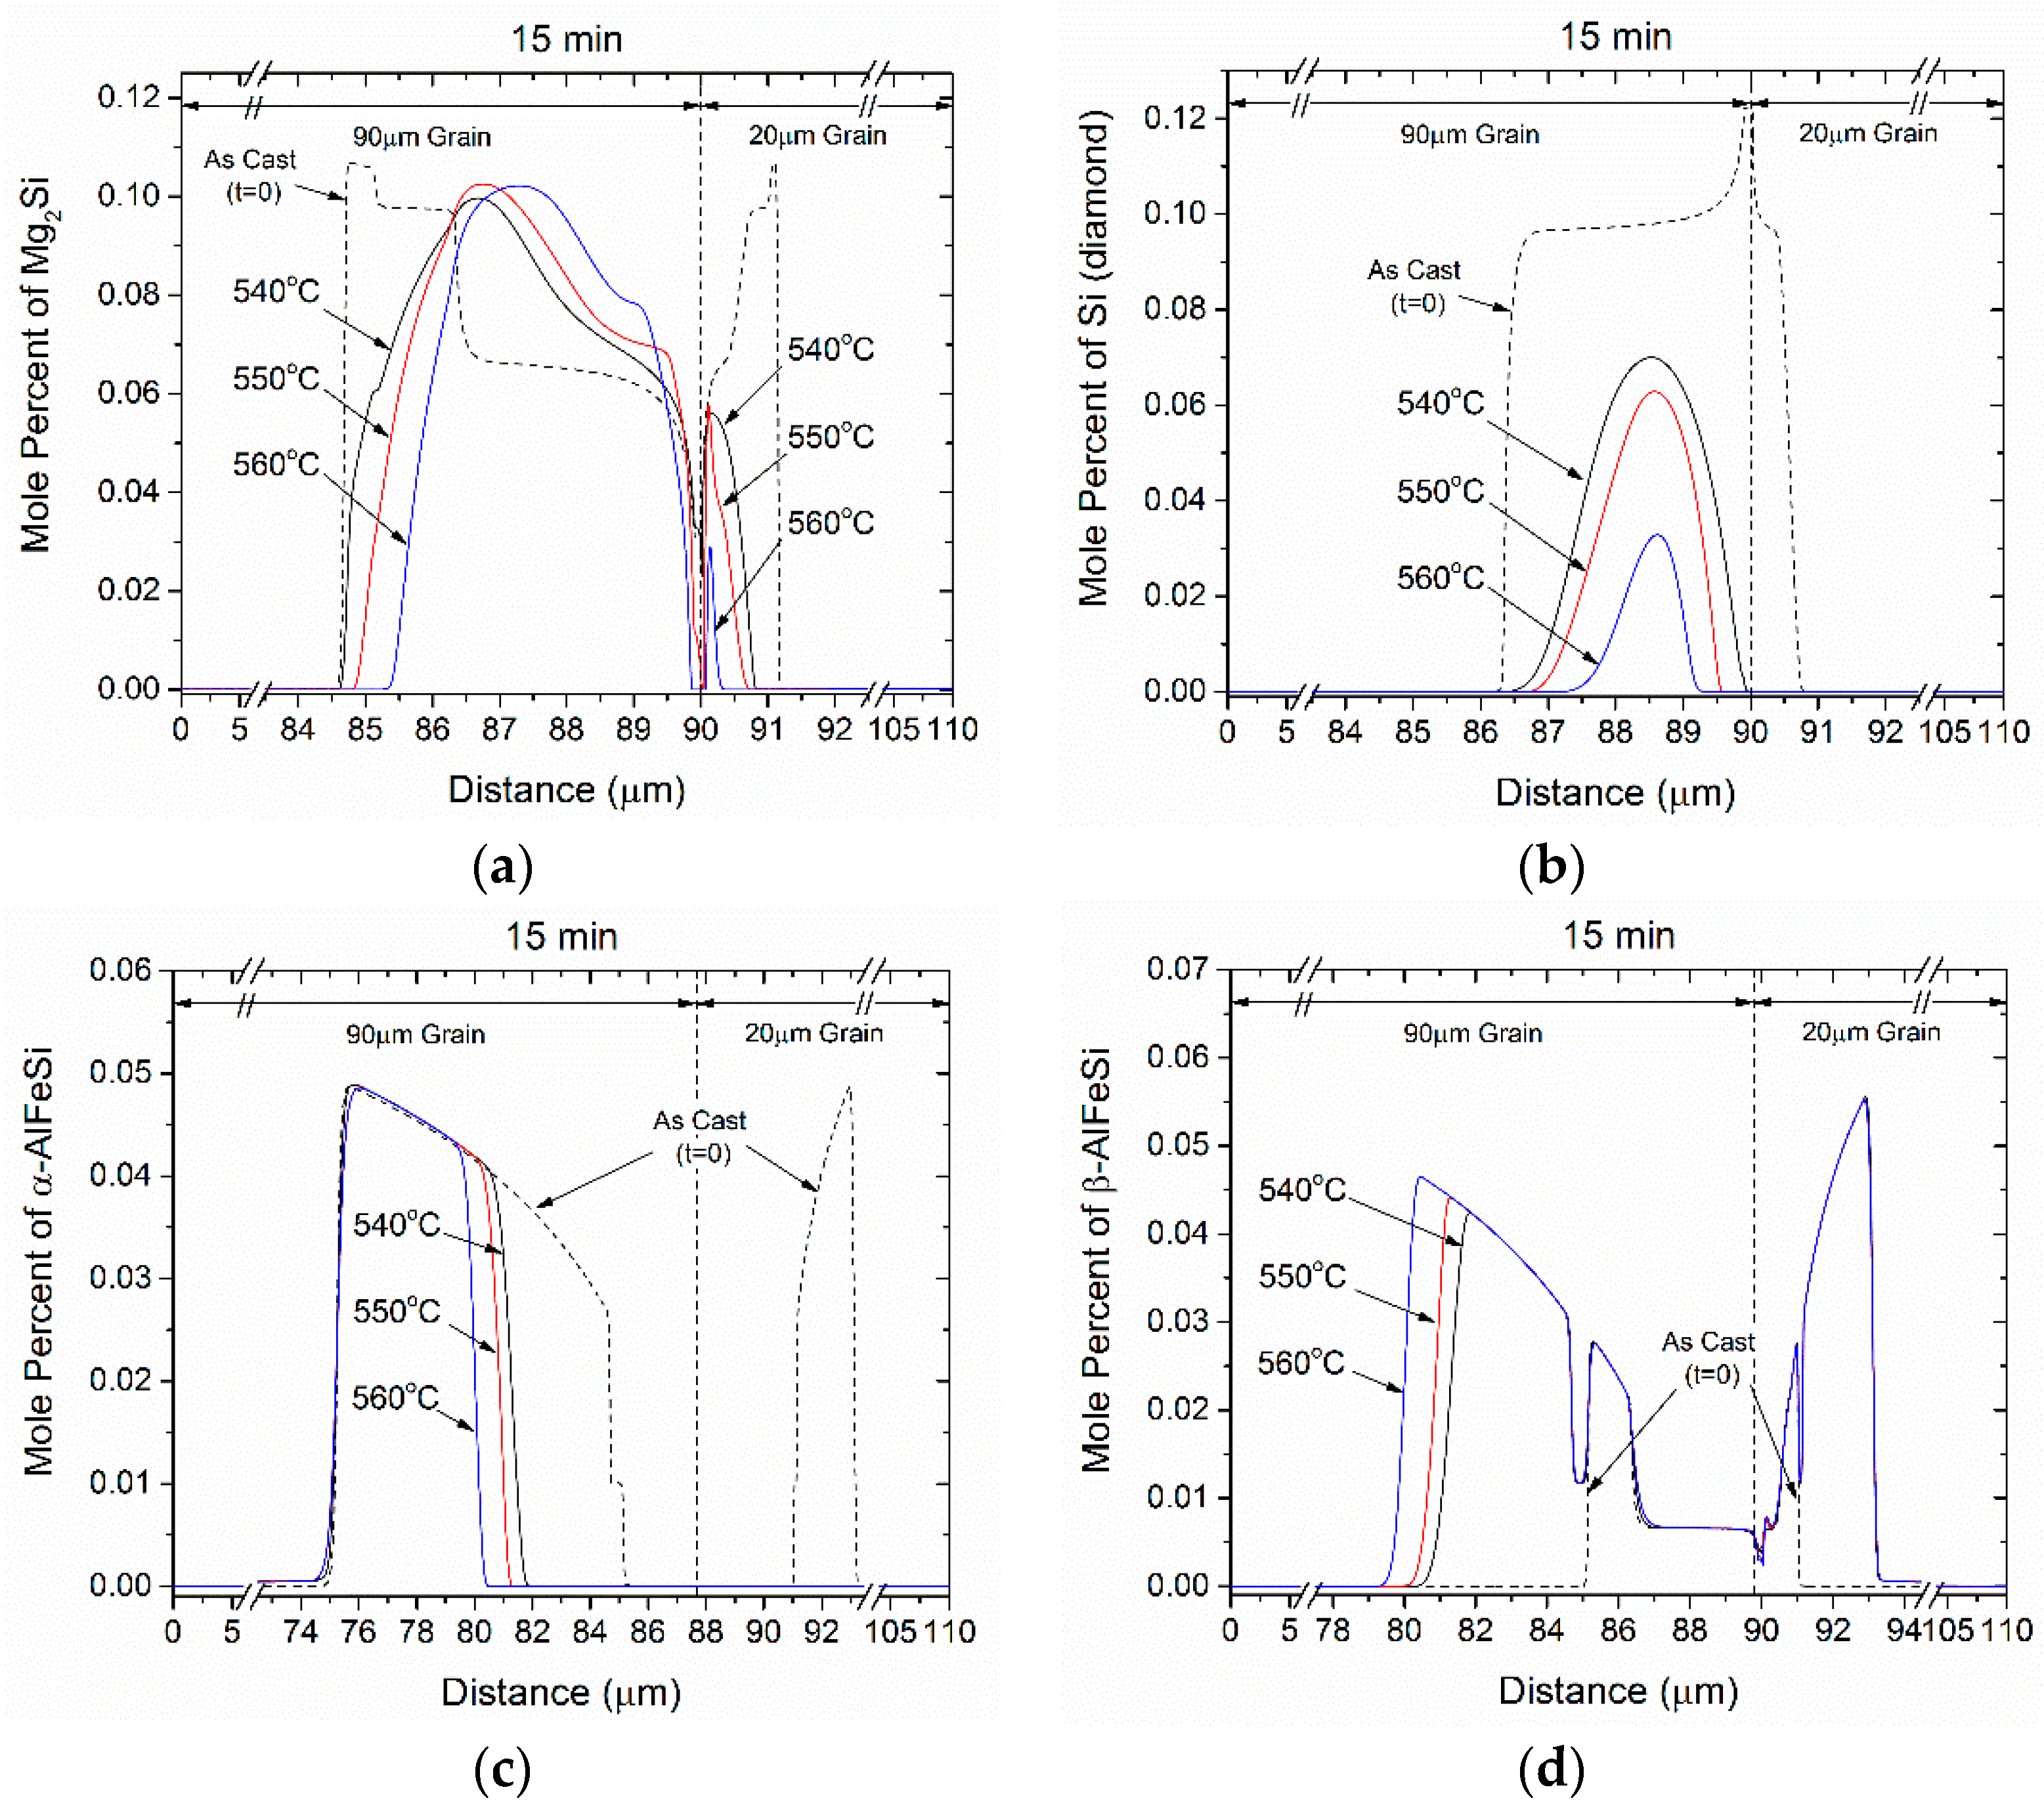
4.2. Homogenization Holding
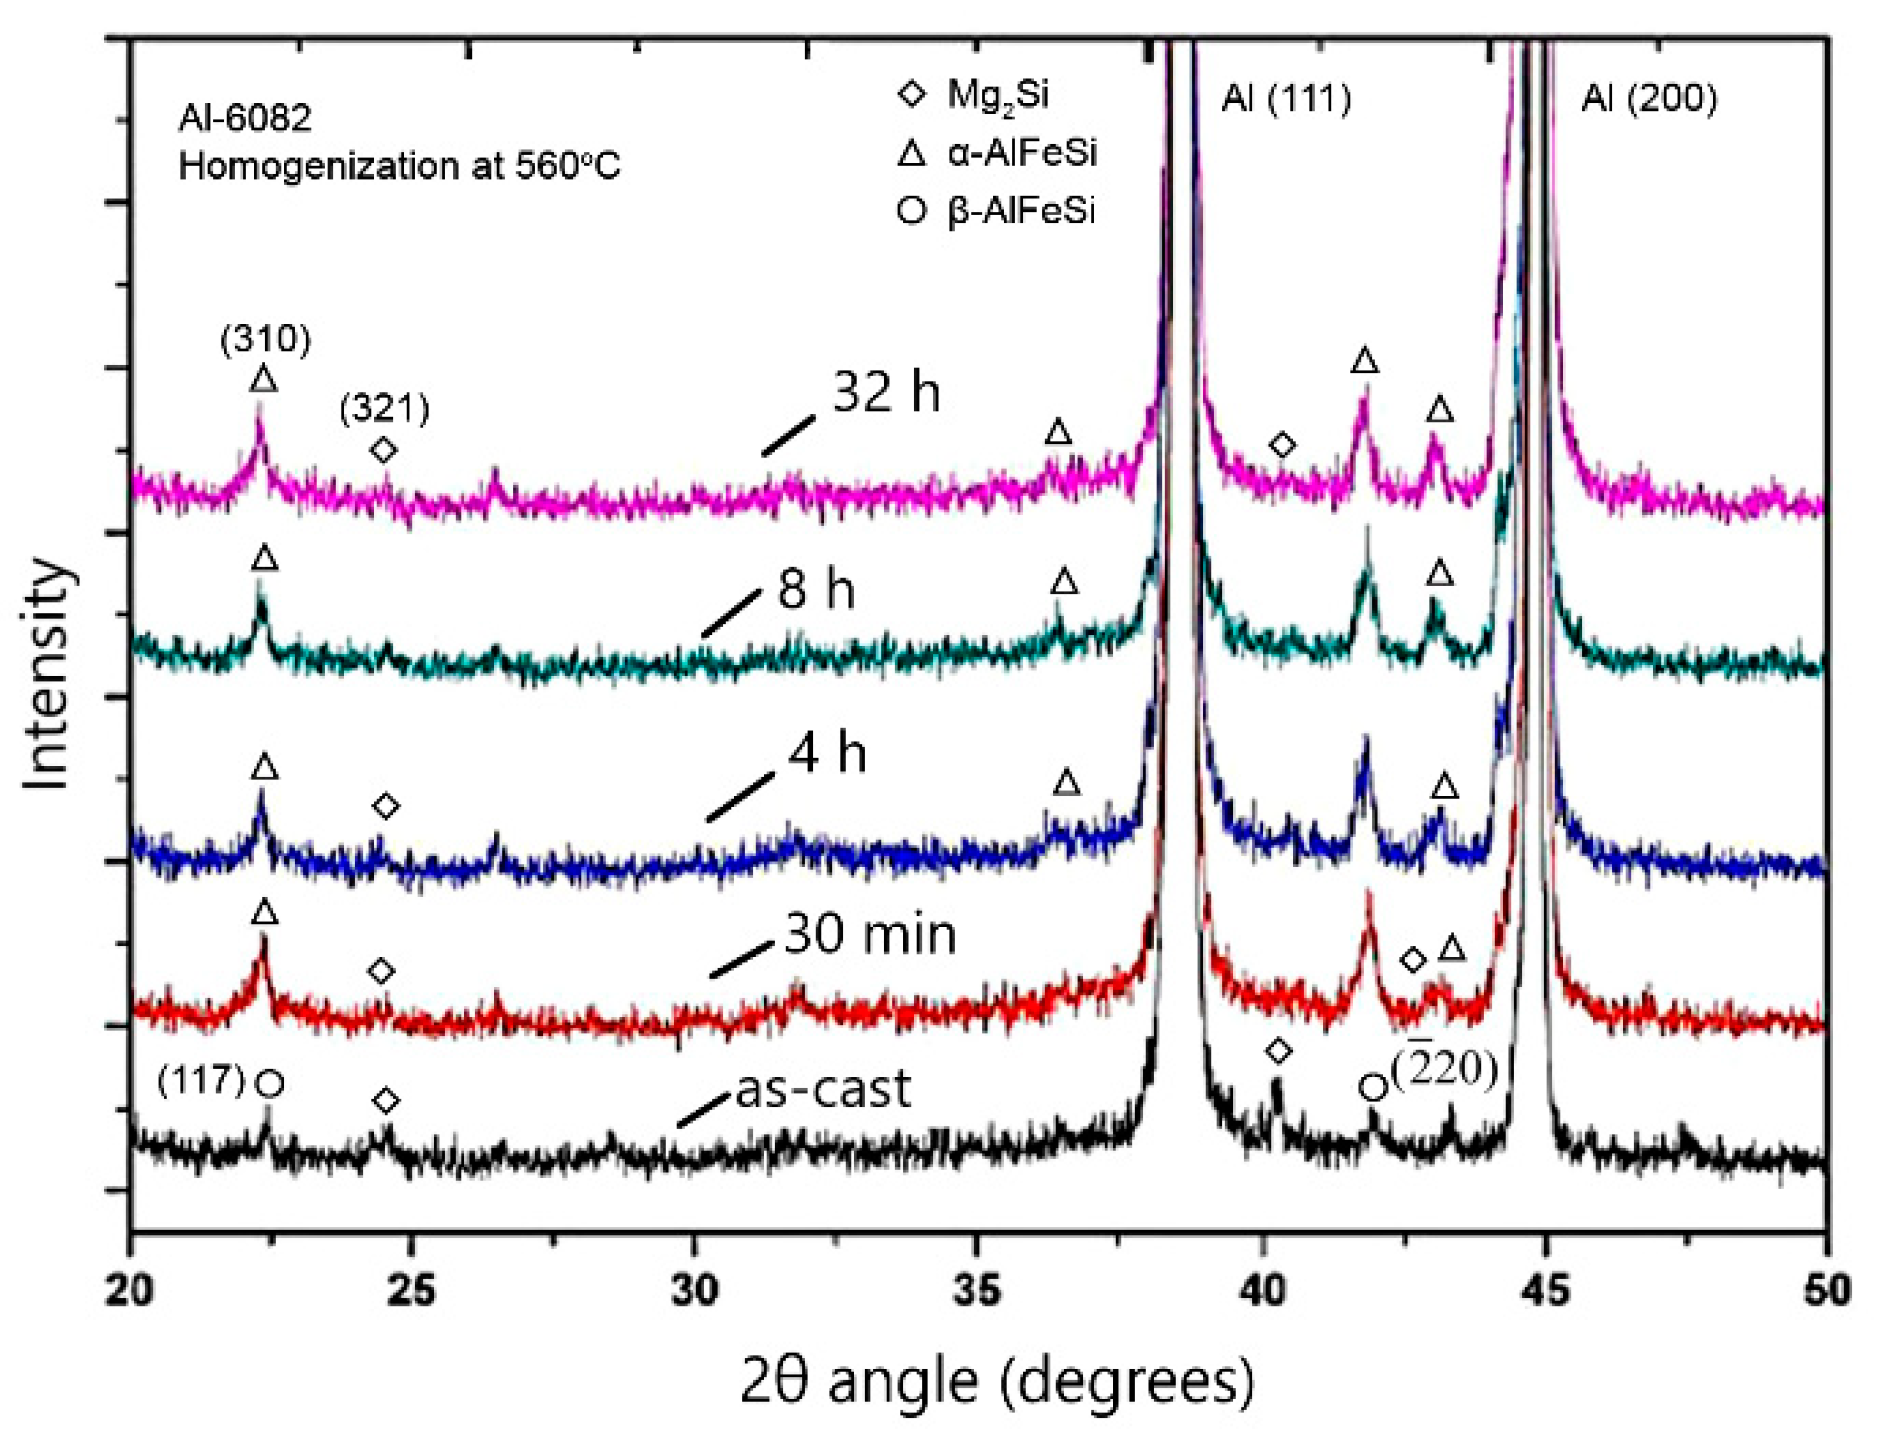
- Si (diamond) rapidly dissolves, as it is consumed by Mg2Si that grows in the same location near the grain boundary. Simultaneously Mg2Si gradually dissolves from the grain interior to the boundary as Si and Mg migrate to the grain center. The excess Si released from the dissolution of the Si (diamond) phase, causes β-AlFeSi to grow against α-AlFeSi at the early stages of homogenization. After the complete dissolution of Si (diamond), the transformation reverses, as α-AlFeSi gradually consumes β-AlFeSi completely.
- The profiles of α-AlFeSi and β-AlFeSi exhibit an exact spatial correspondence. Where there is a drop in the fraction of β-AlFeSi, there is a rise in the fraction of α-AlFeSi and vice versa, at the same location.
- The phase fraction profiles are steeper, and the transformation is faster in the smaller grain. Yet the kinetics of β-AlFeSi→α-AlFeSi transformation in the small grain were severely hindered since α-AlFeSi was completely consumed during the early stages. A nucleation event is required to regrow α-AlFeSi, effectively reducing the rate of the transformation.
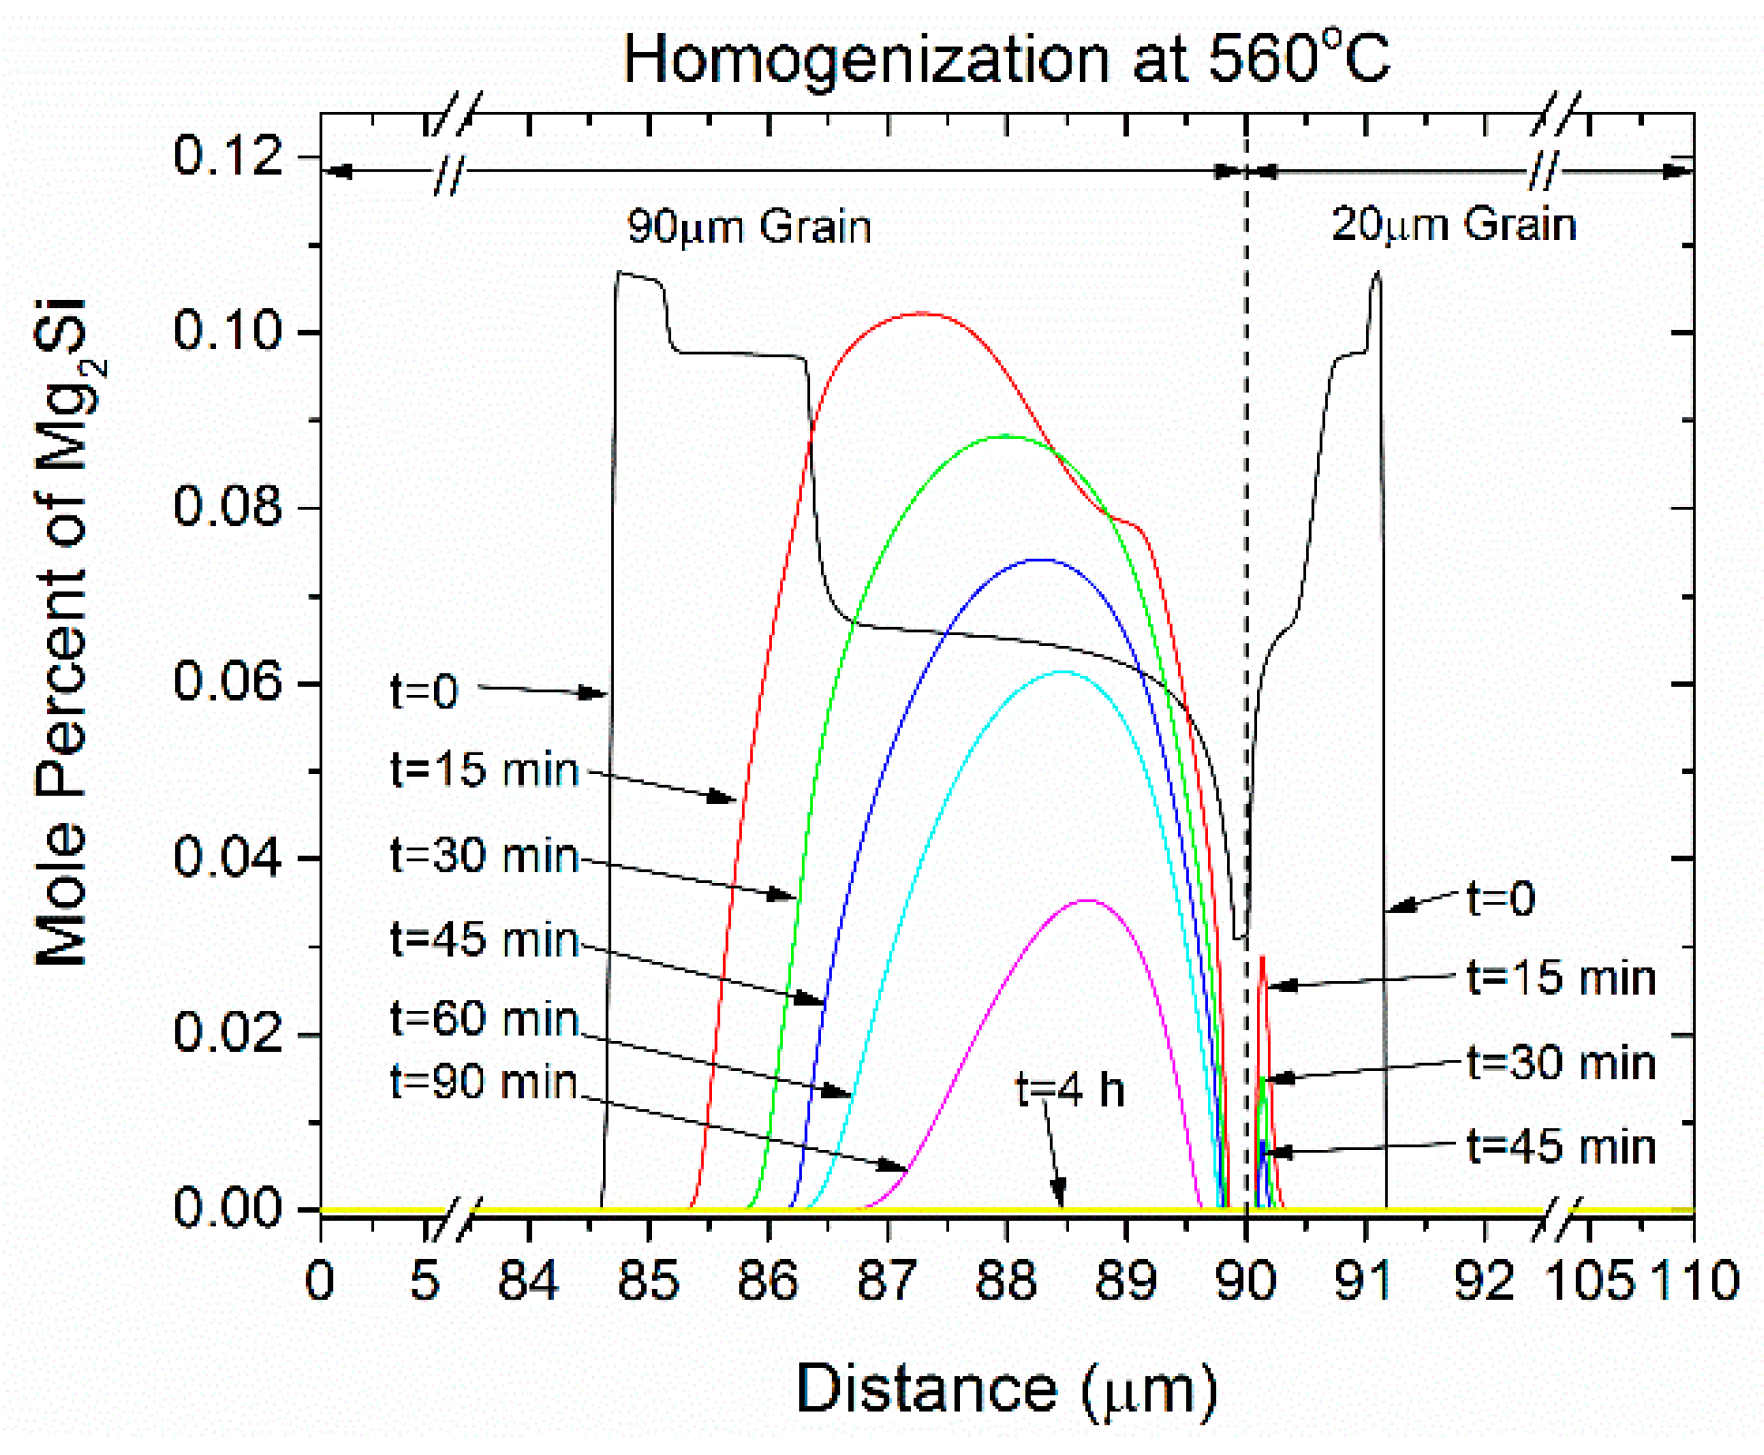
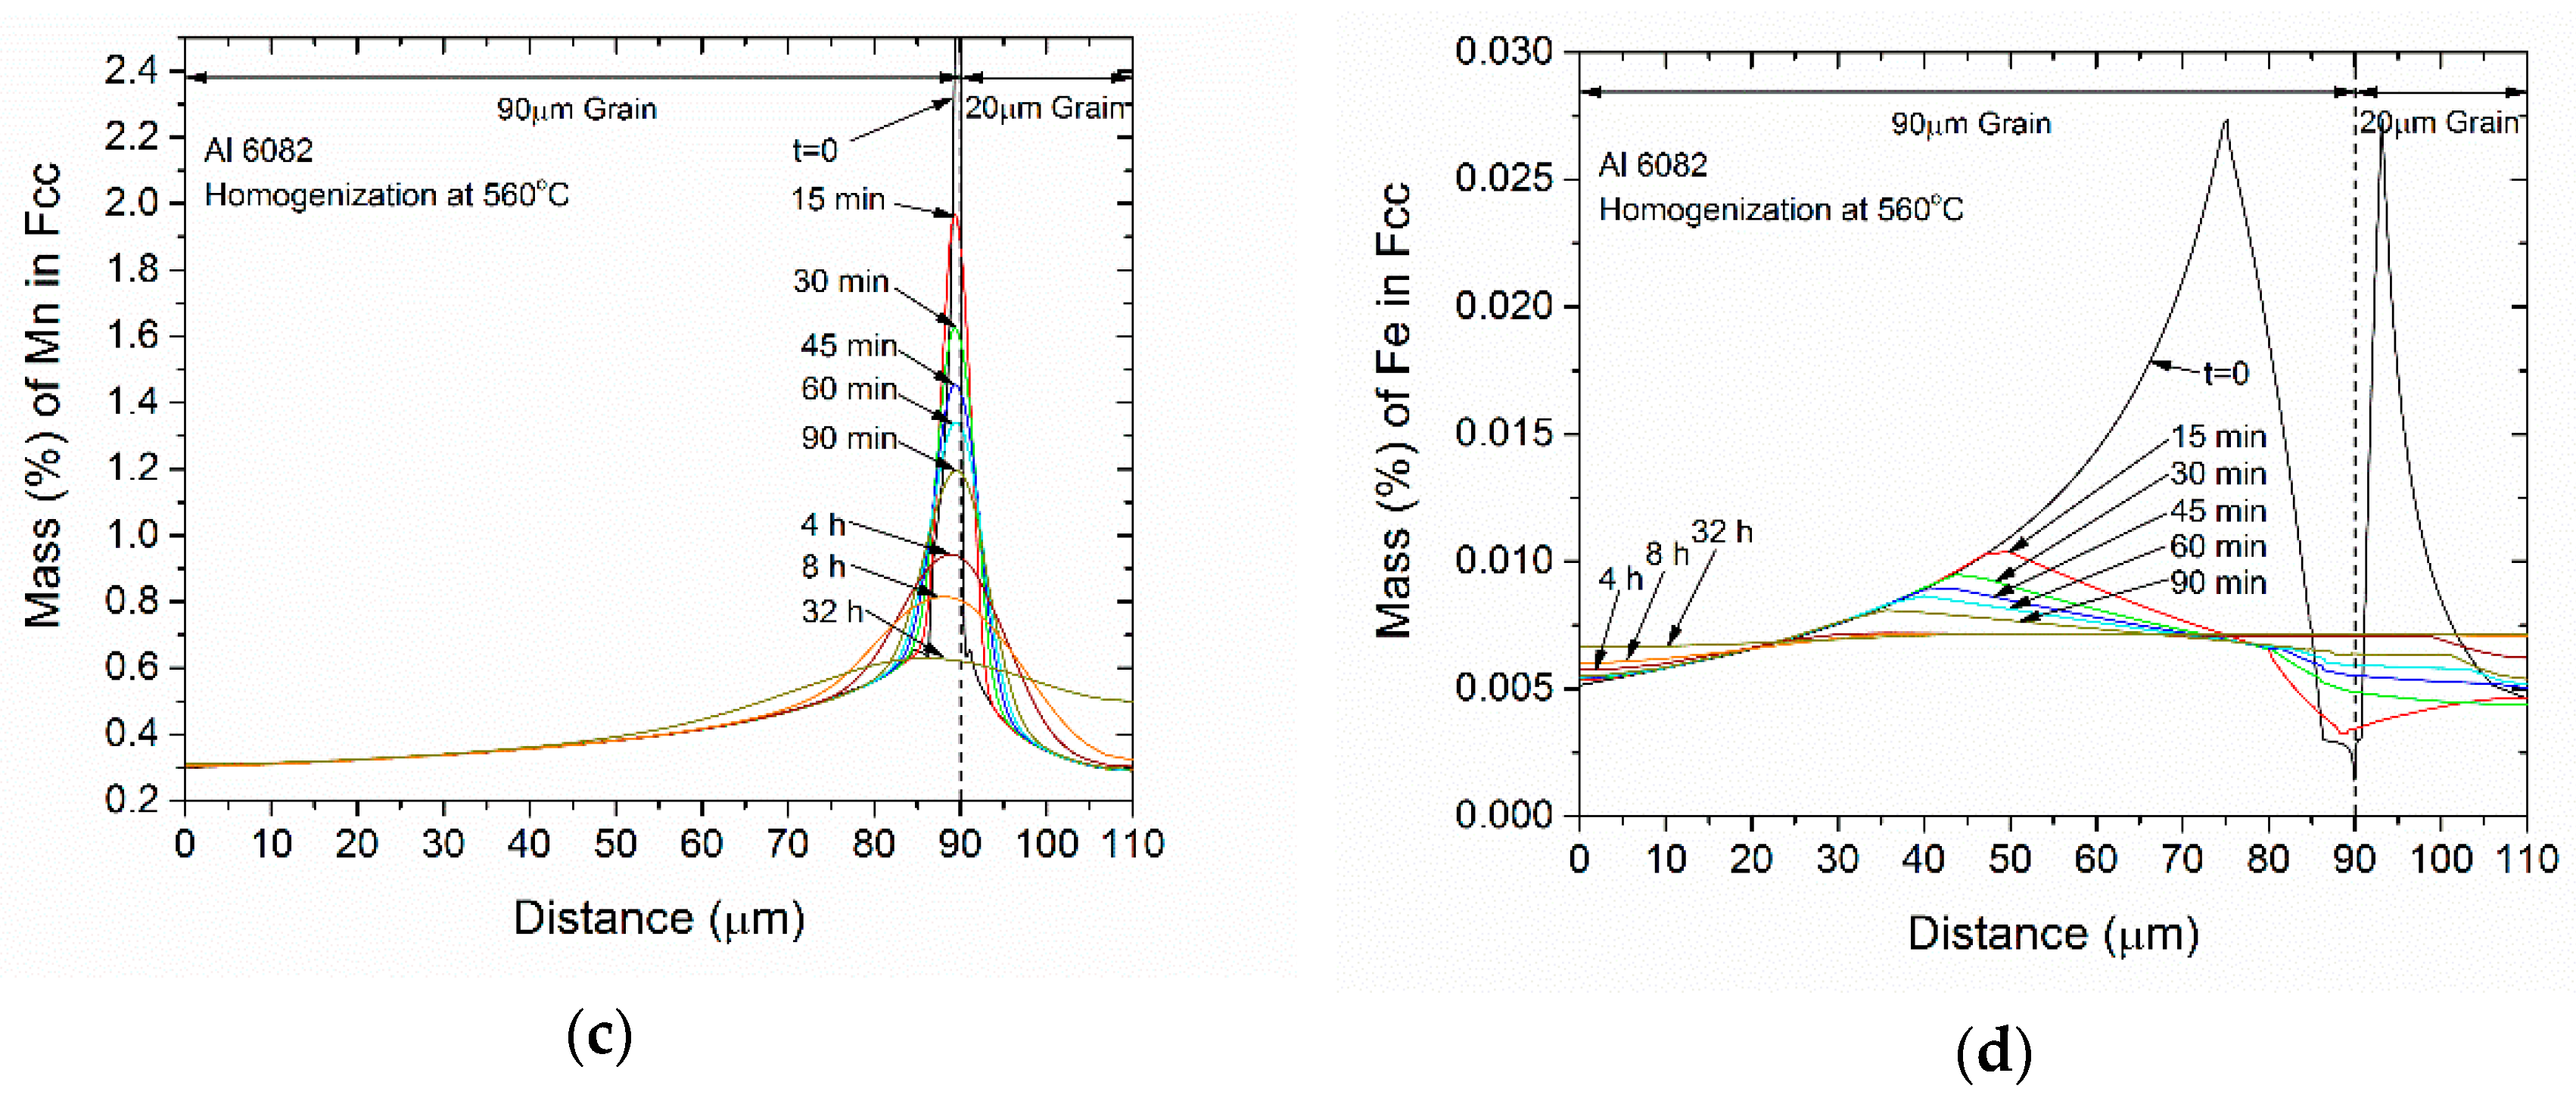
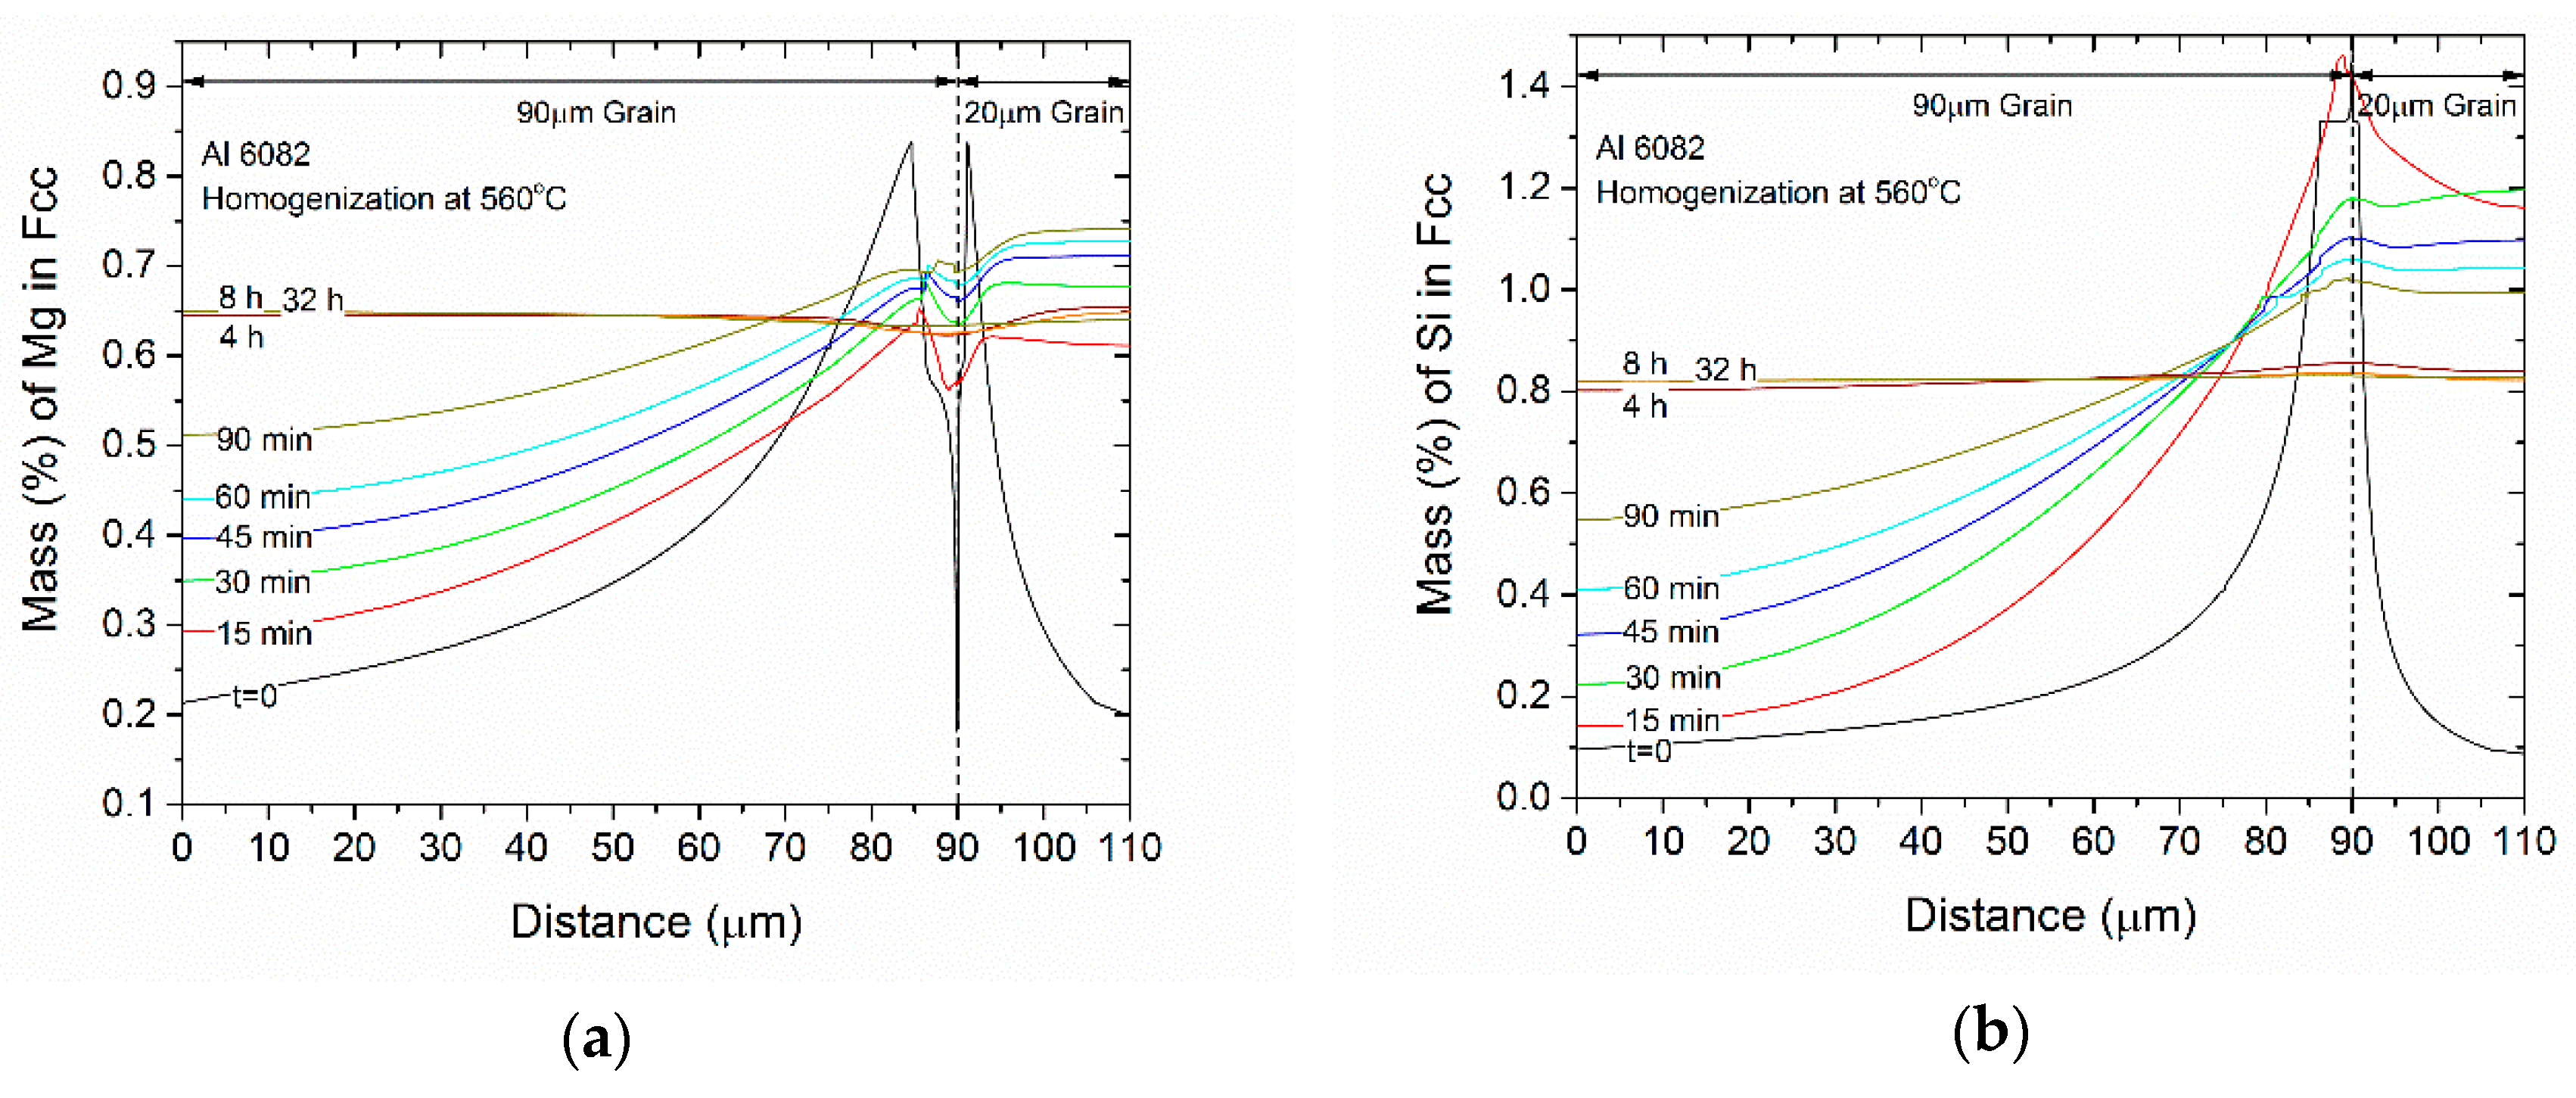
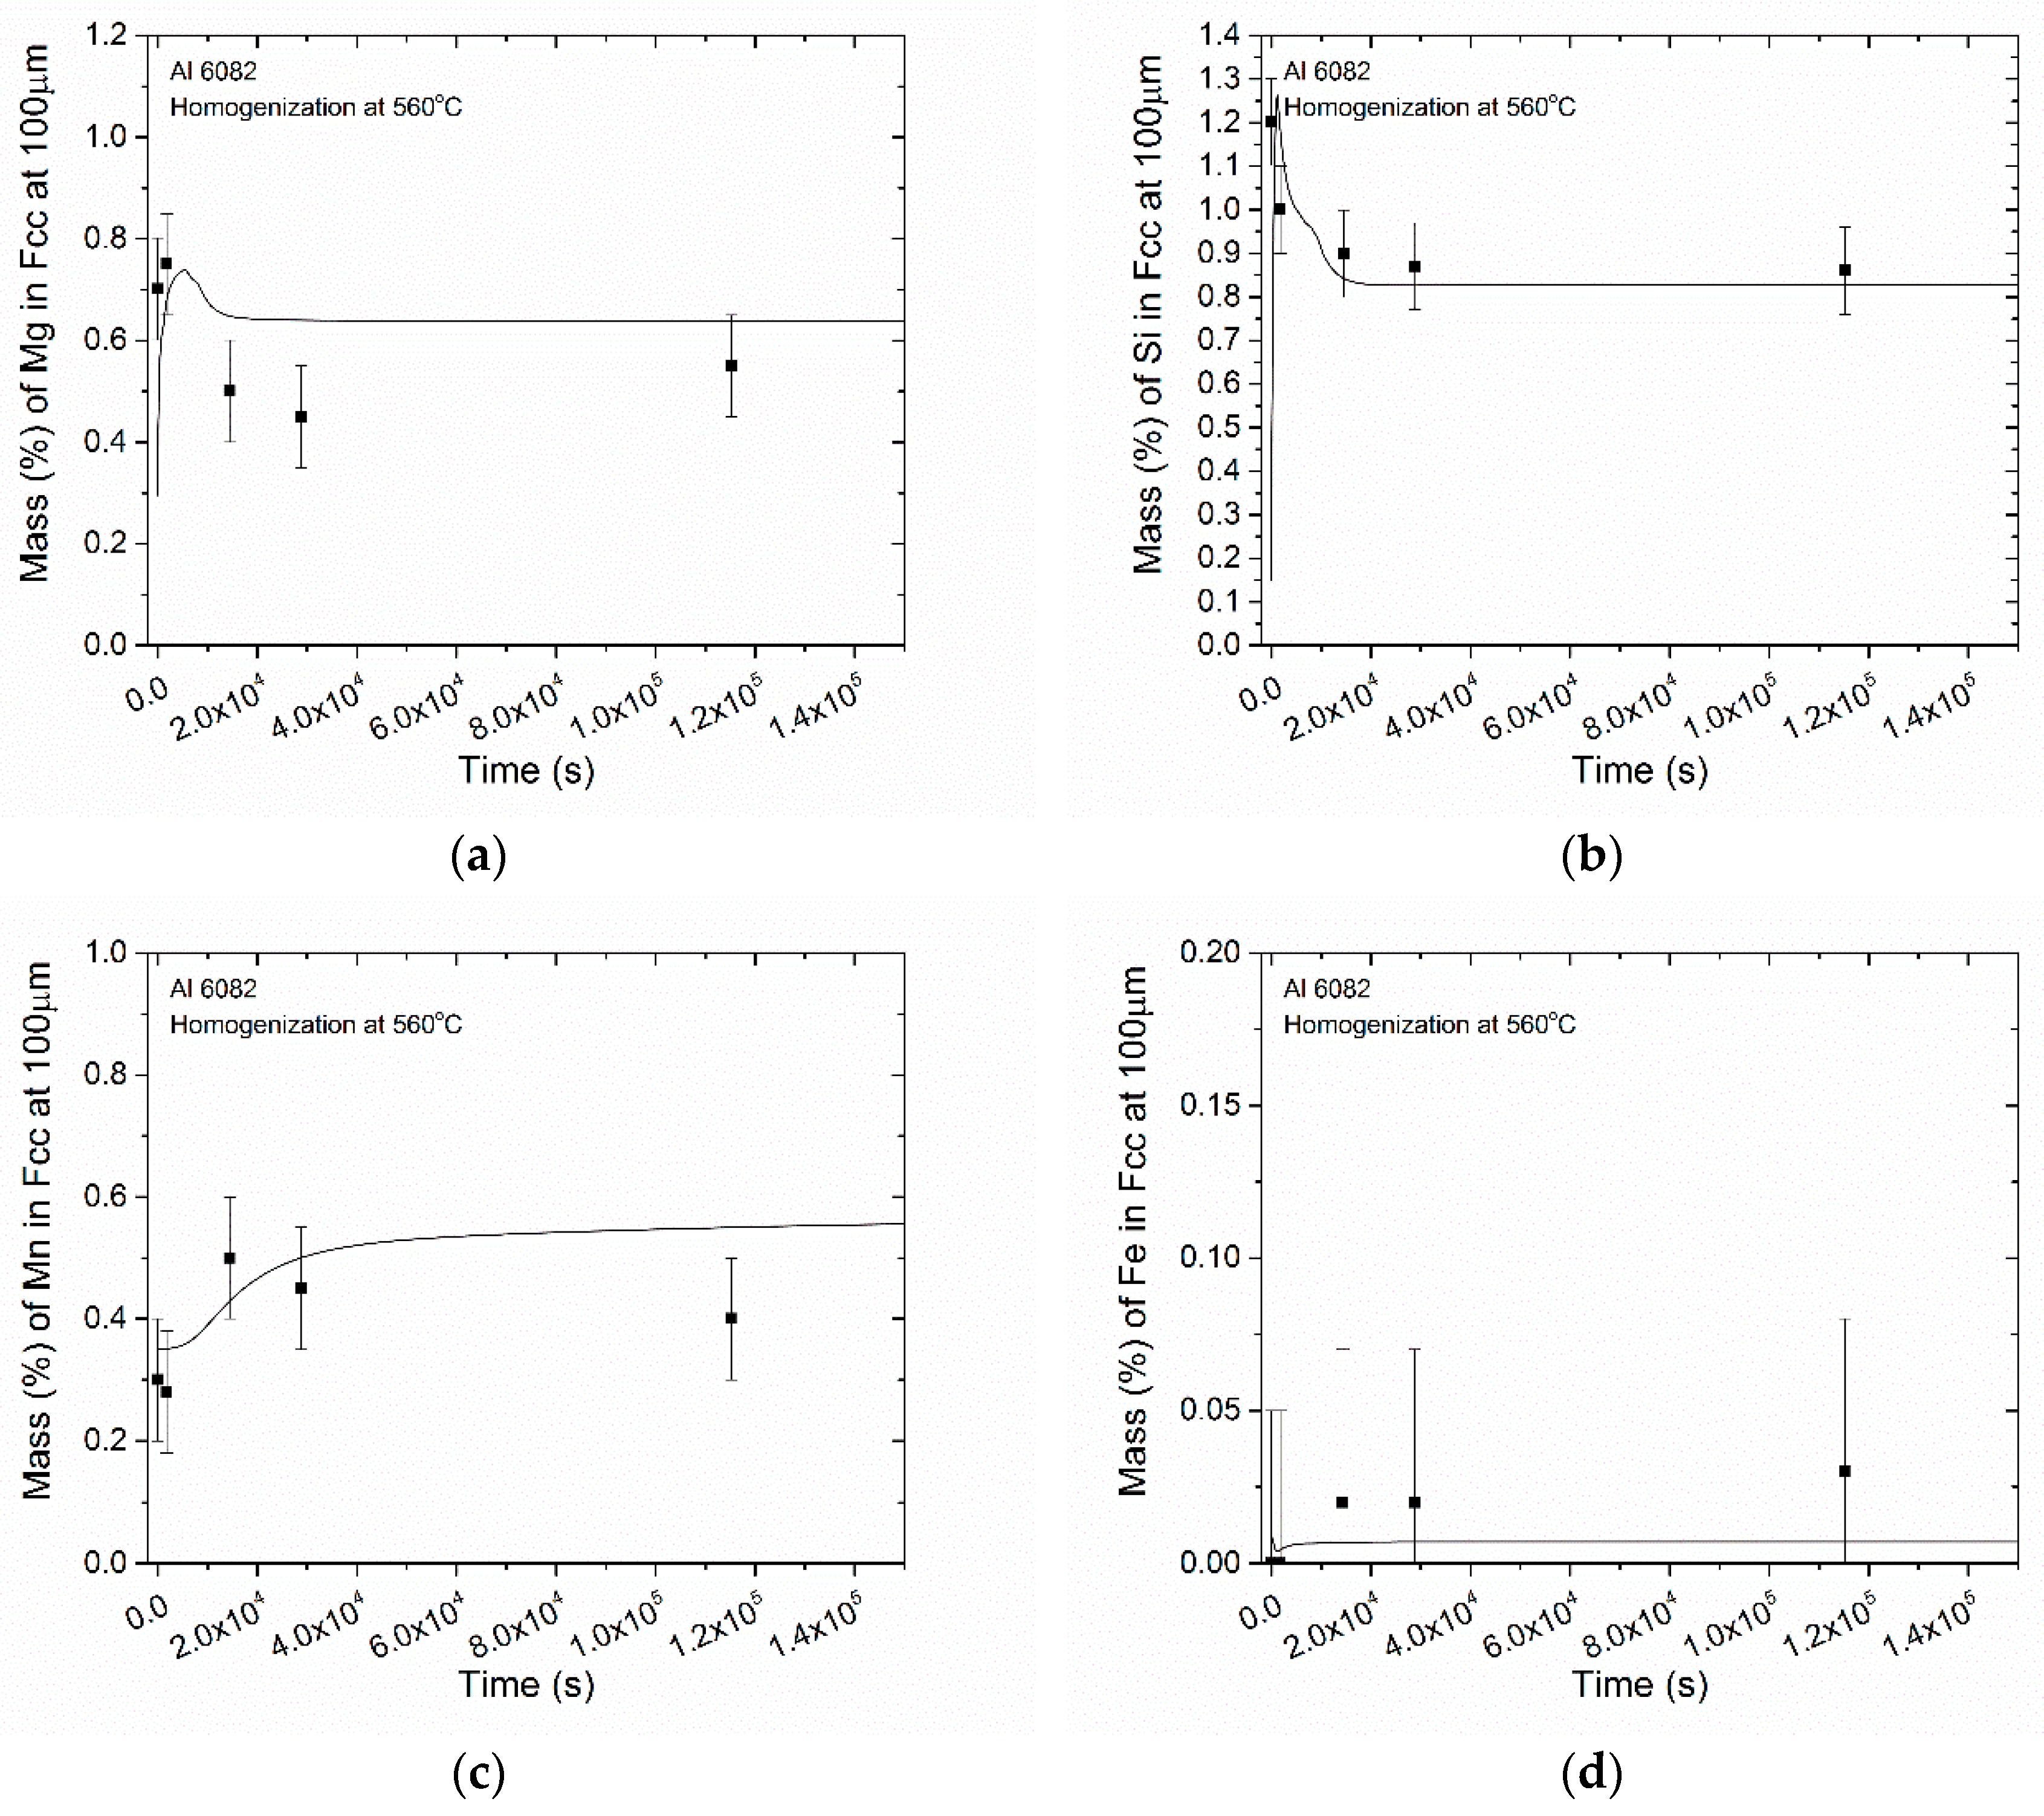
- The concentration profiles for Mg, Si and Mn become more uniform with homogenization time. The profile for Fe in FCC change mostly due to its absorption from the formation of α-AlFeSi and β-AlFeSi since the diffusivity of Fe in Al is very low.
- The average concentration of Mg and Si in the matrix interior (away from the boundary) increases with homogenization time, especially in the smaller grain.
- The profiles homogenize faster in the smaller grain due to a shorter diffusion distance.
- The compositional fluctuations close to the boundary are due to the dissolution of Mg2Si, Si (diamond) and the β-AlFeSi→α-AlFeSi transformation. These fluctuations decay with homogenization time.
- The spatial evolution of the concentration profiles is consistent with the spatial evolution of the phase fractions.
4.3. Homogenization Cooling
5. Conclusions
- A Dual-Grain Model (DGM) has been developed to describe the effect of grain size inhomogeneity during homogenization of 6082 Al alloy. The transformation of β-AlFeSi to α-AlFeSi proceeds in two steps. First, the reverse transformation takes place as β-AlFeSi grows against α-AlFeSi due to the excess Si released from the dissolution of the Si (diamond) phase. The forward transformation of β to α-AlFeSi commences once dissolution of the Si (diamond) phase is completed.
- During the transformation, the fractions of α-AlFeSi and β-AlFeSi exhibit an exact spatial and temporal correspondence. The DGM model predictions are in good agreement with experimental data.
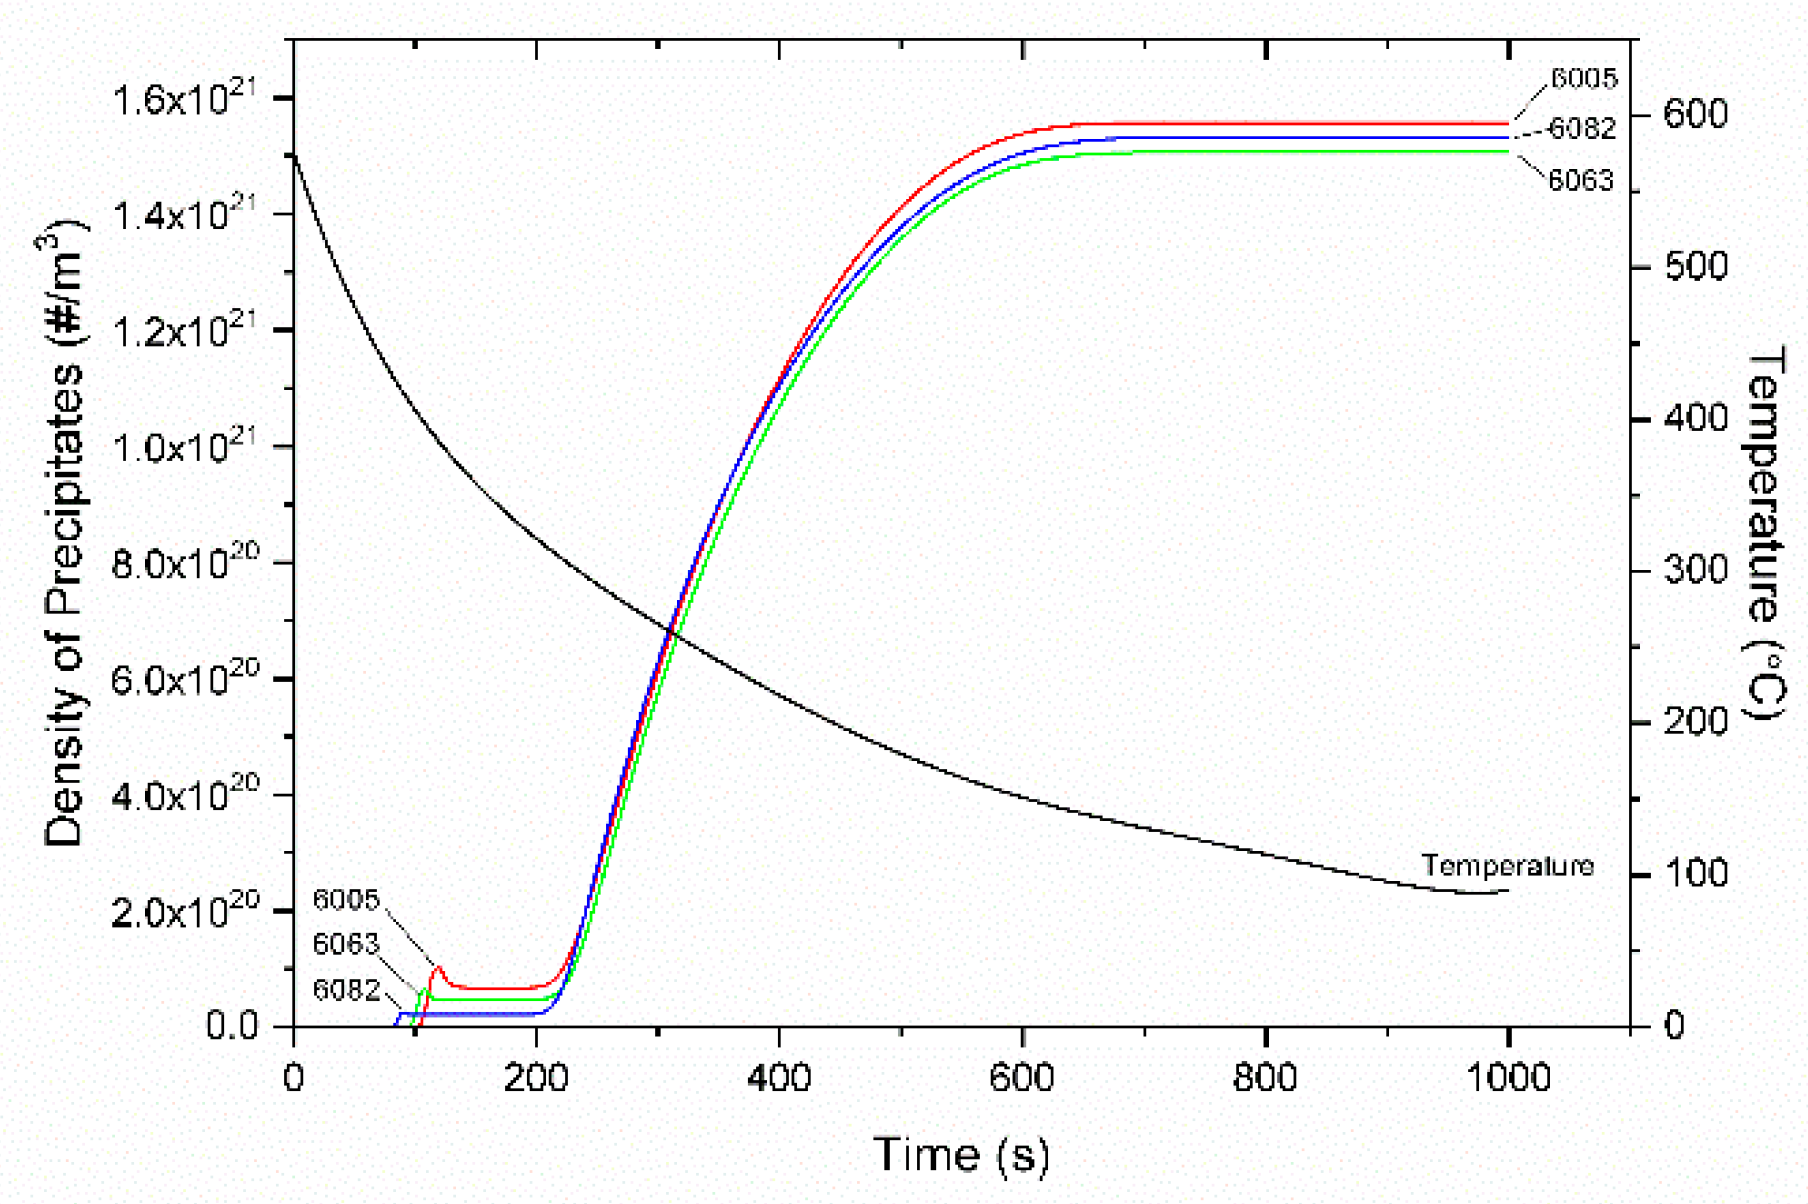
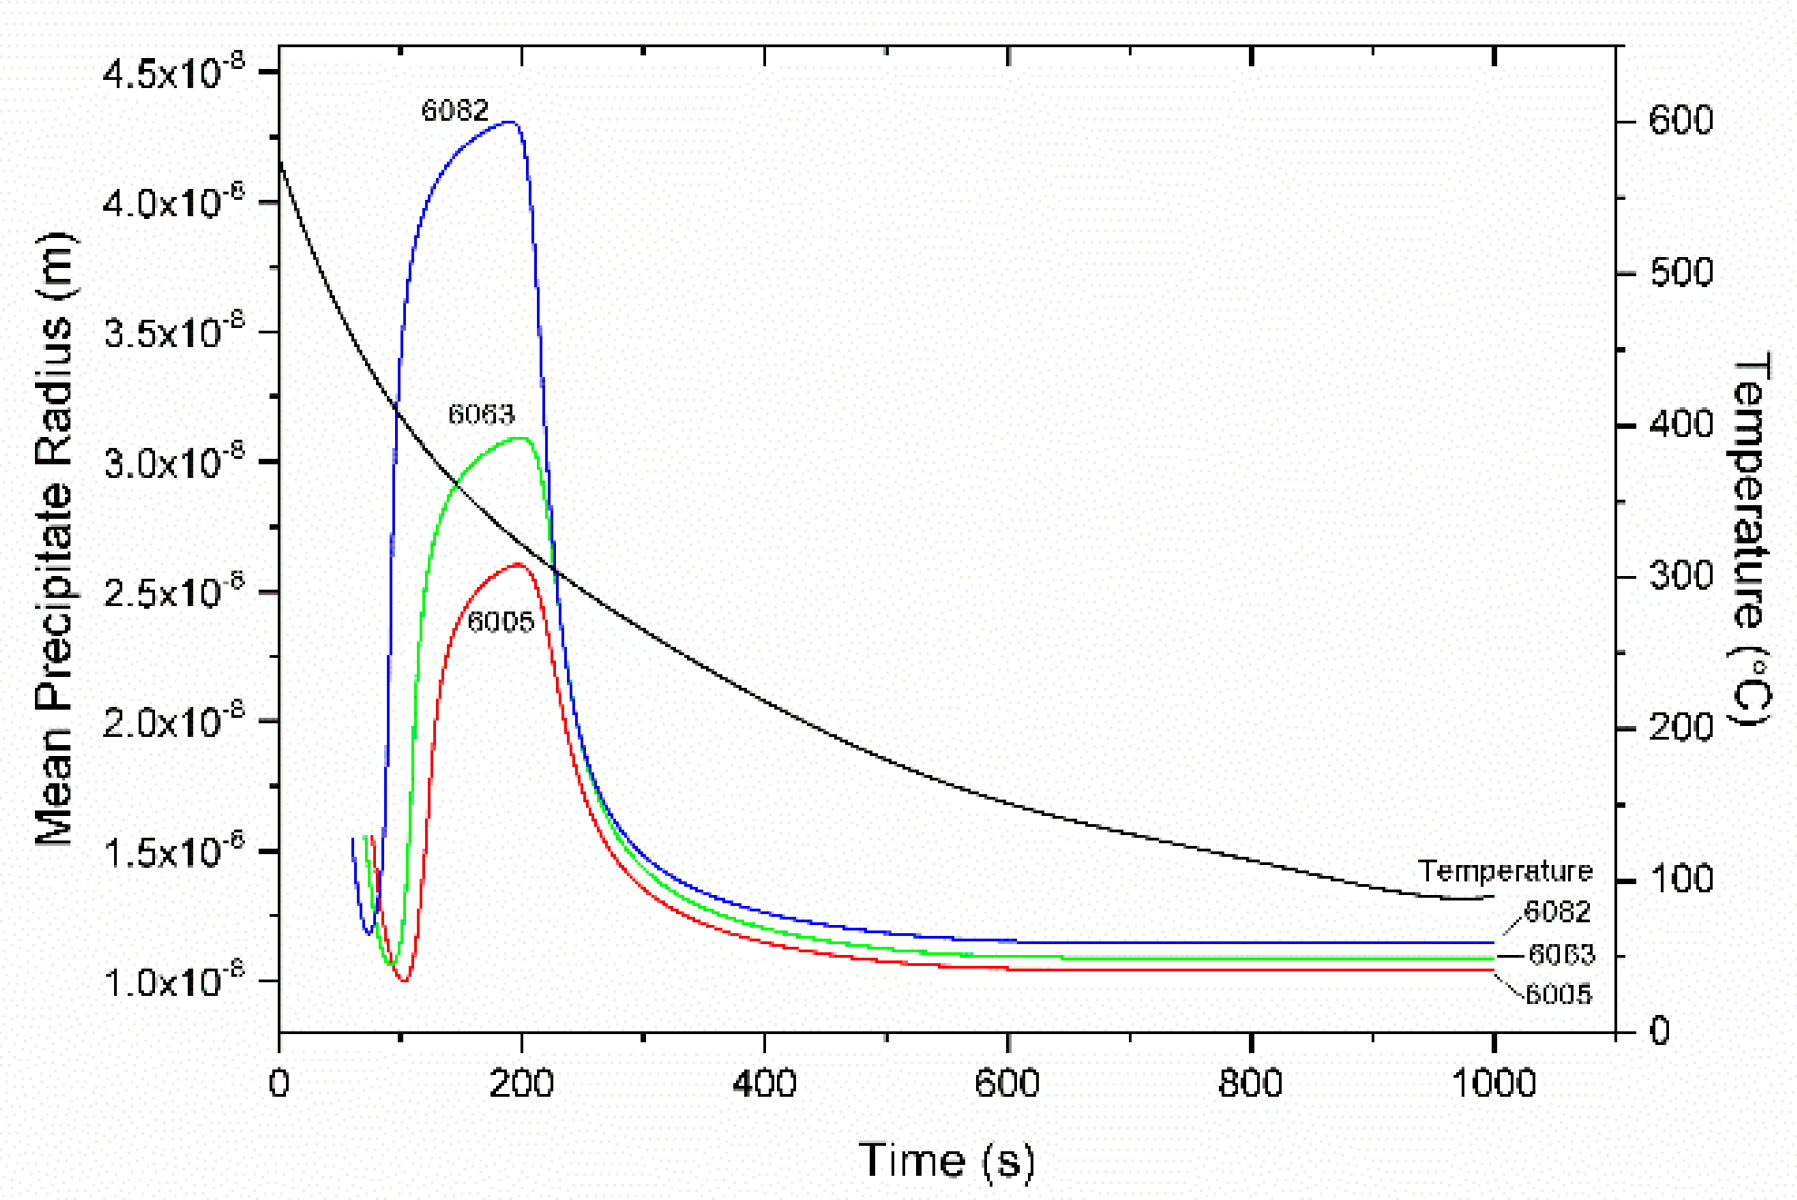
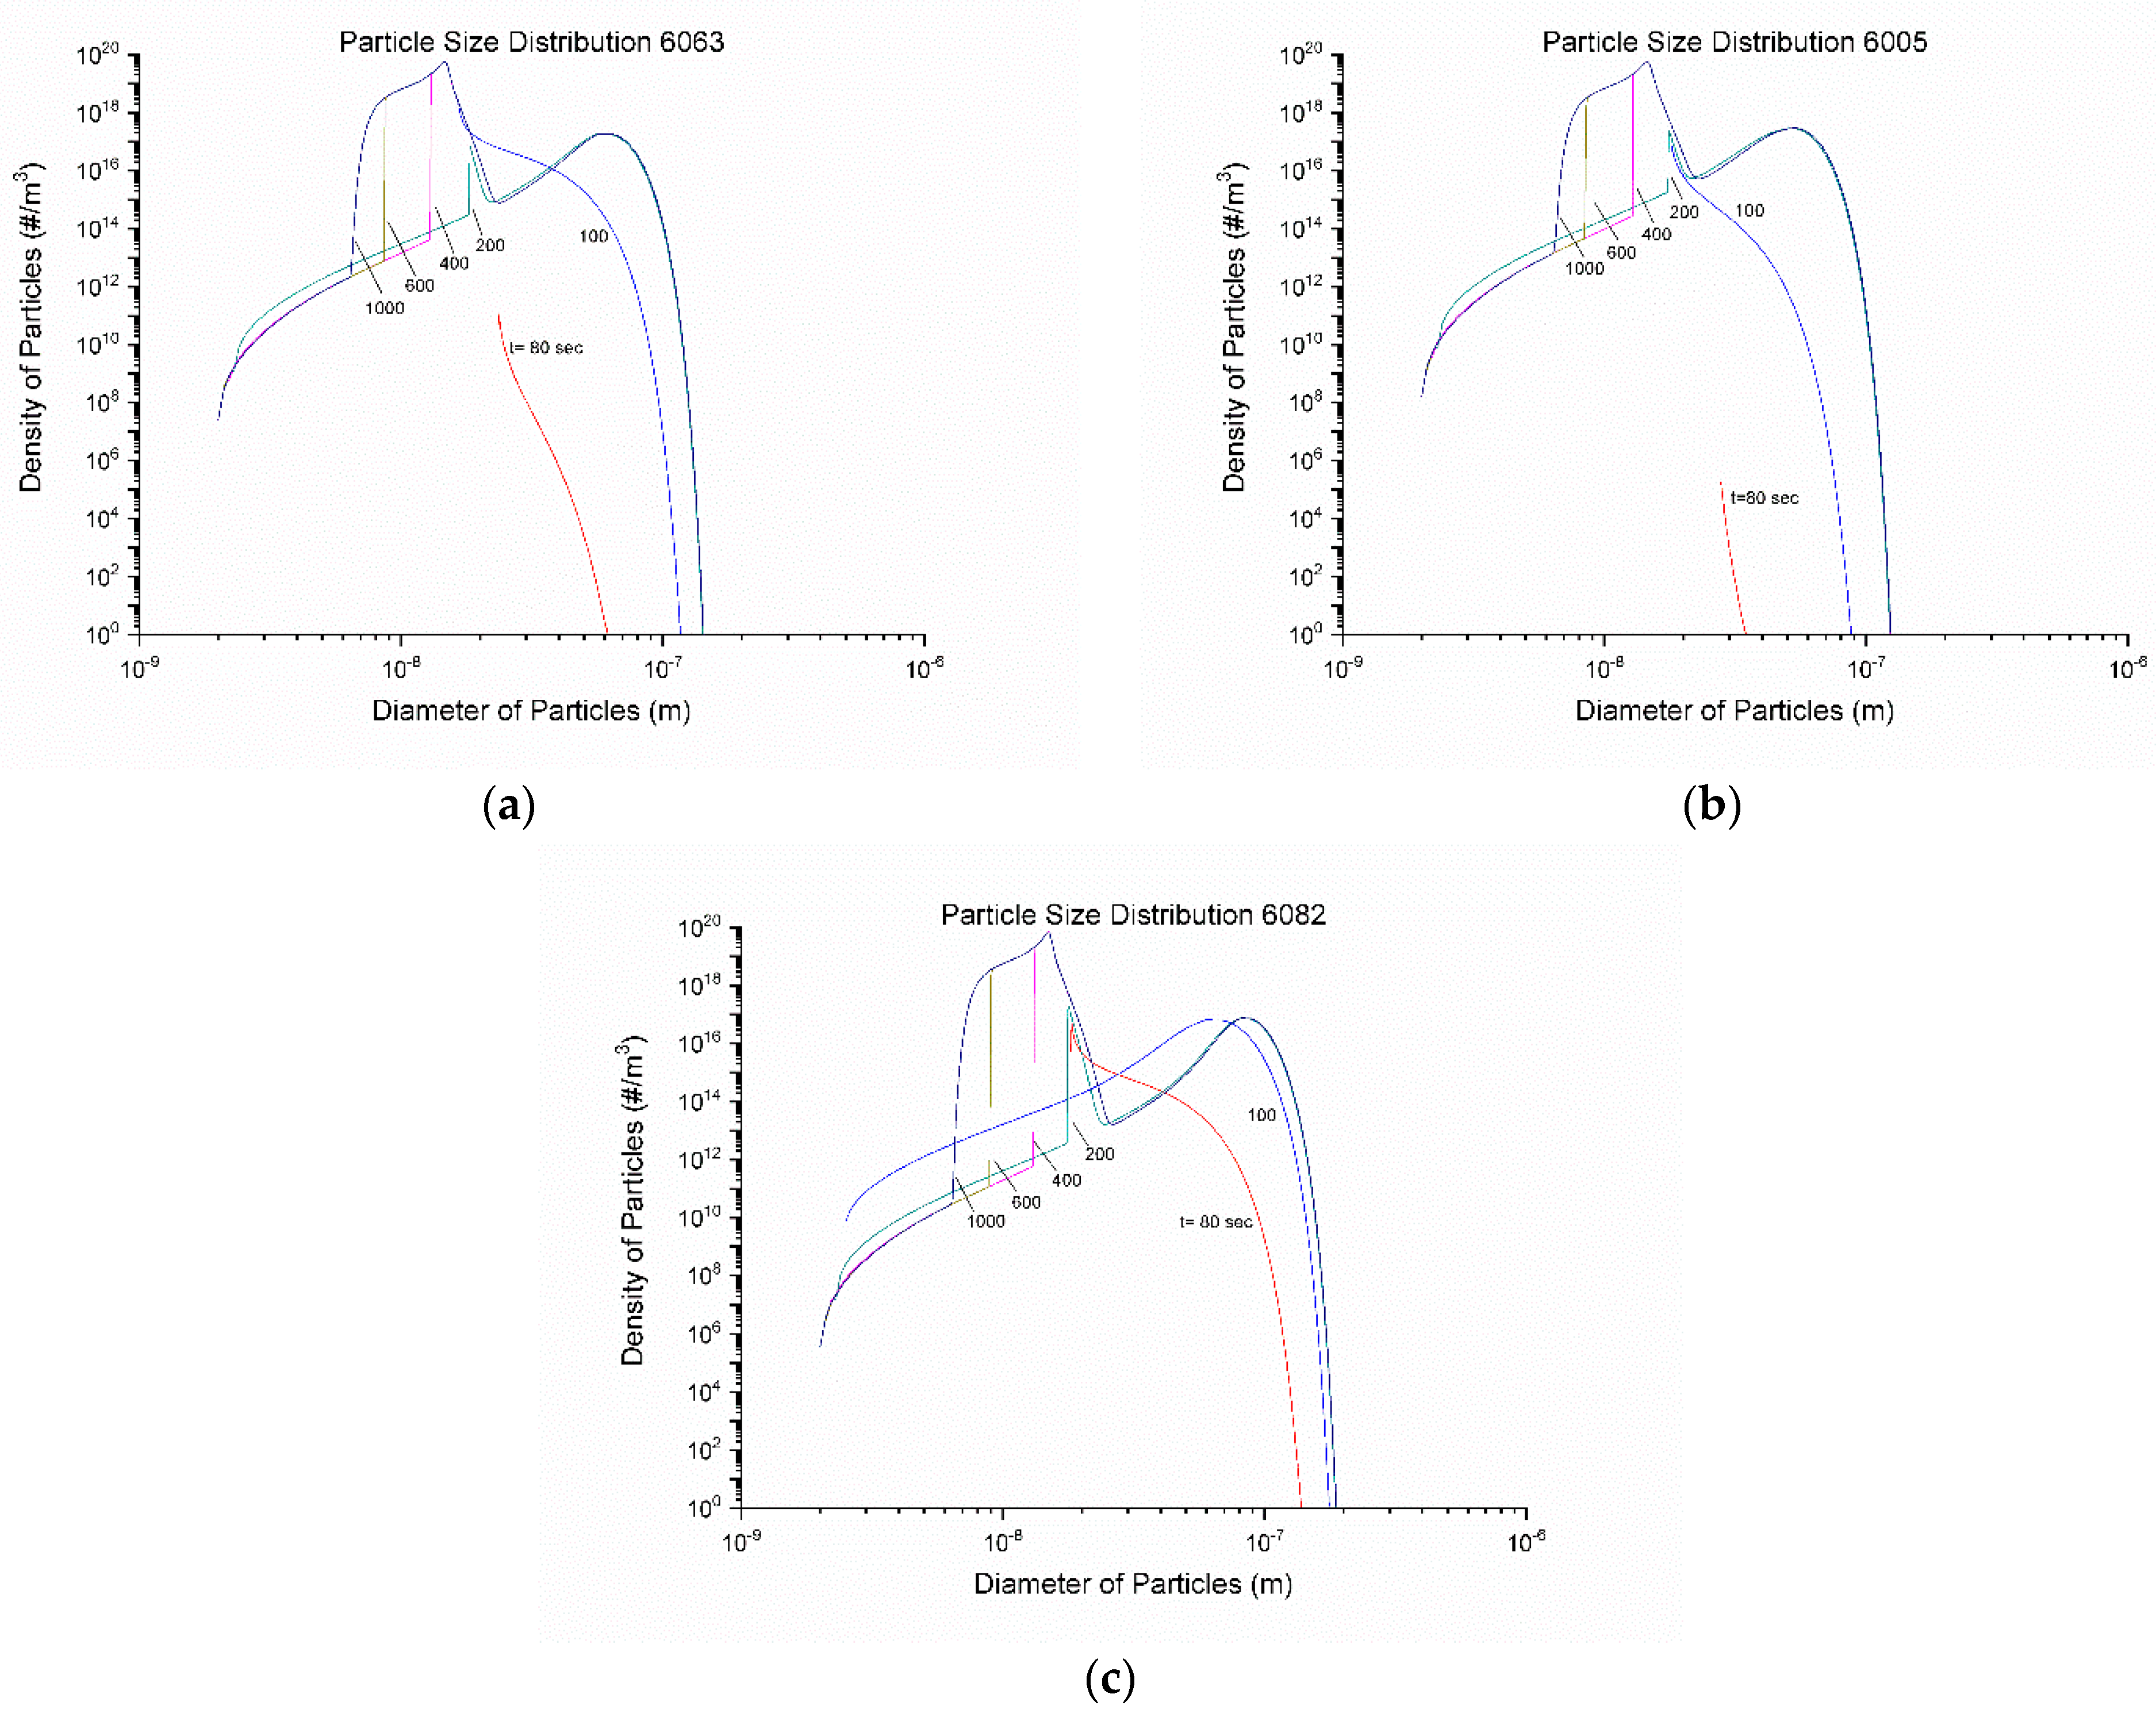
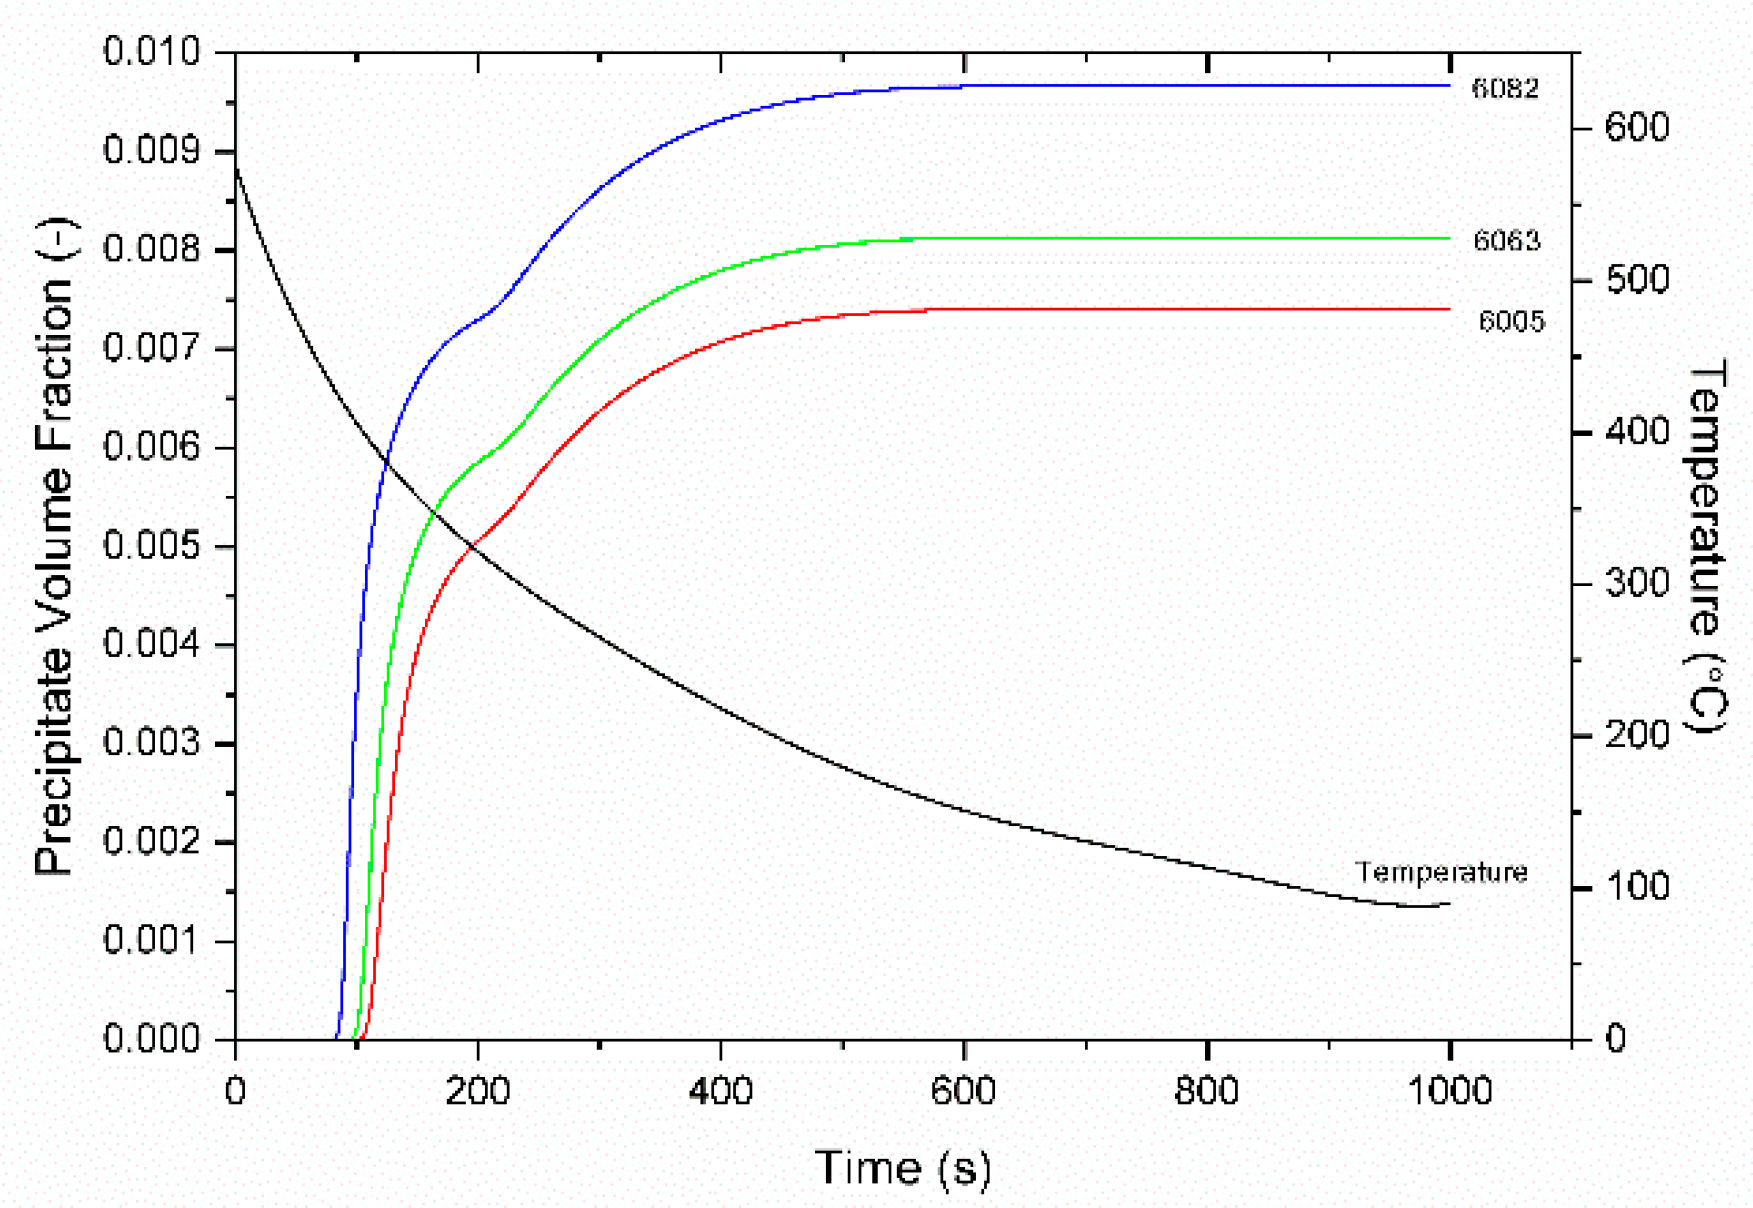
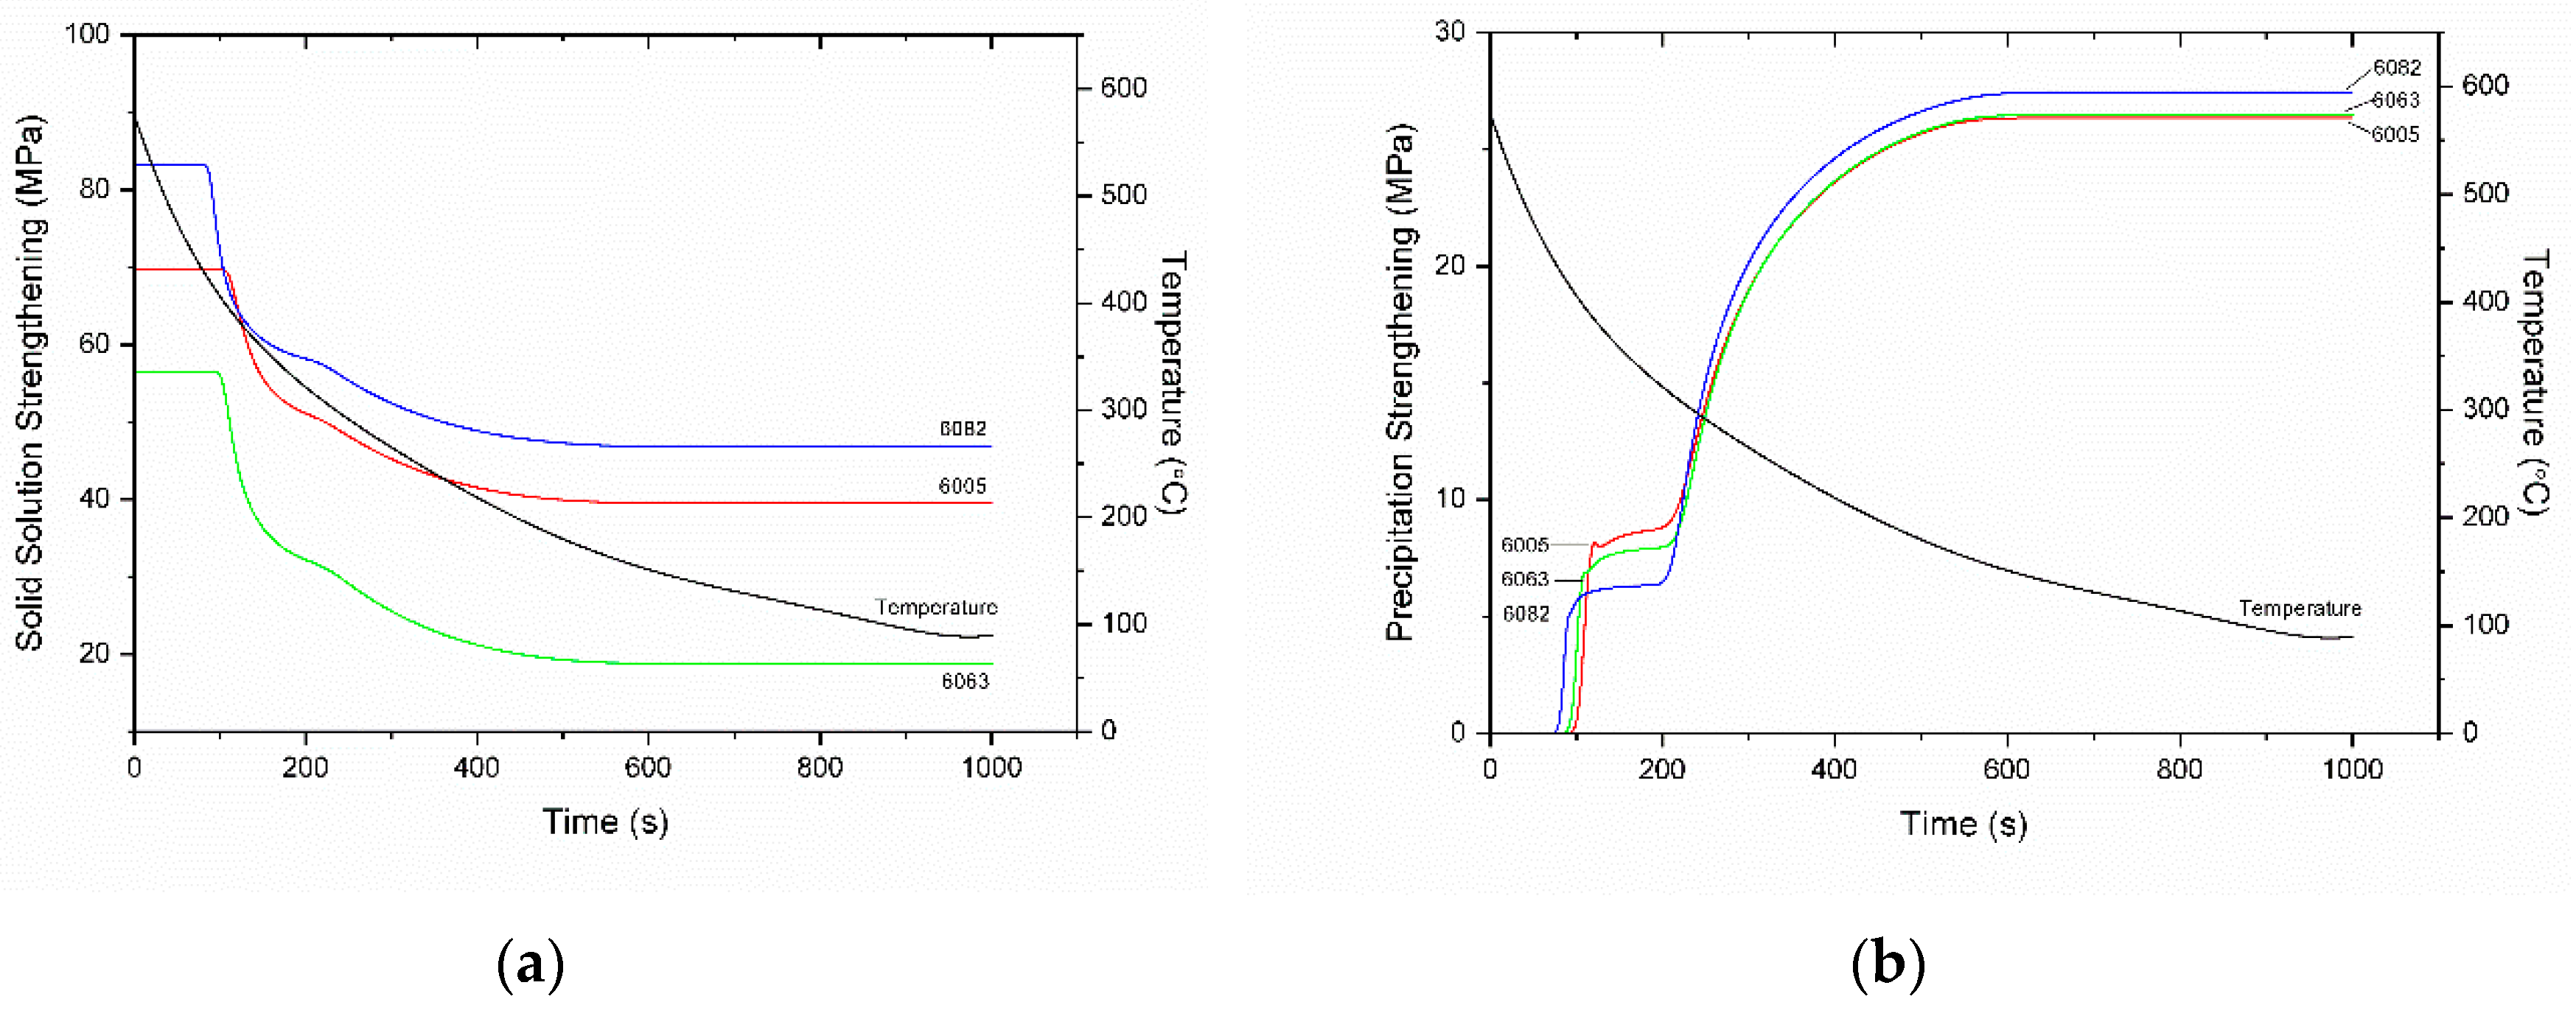
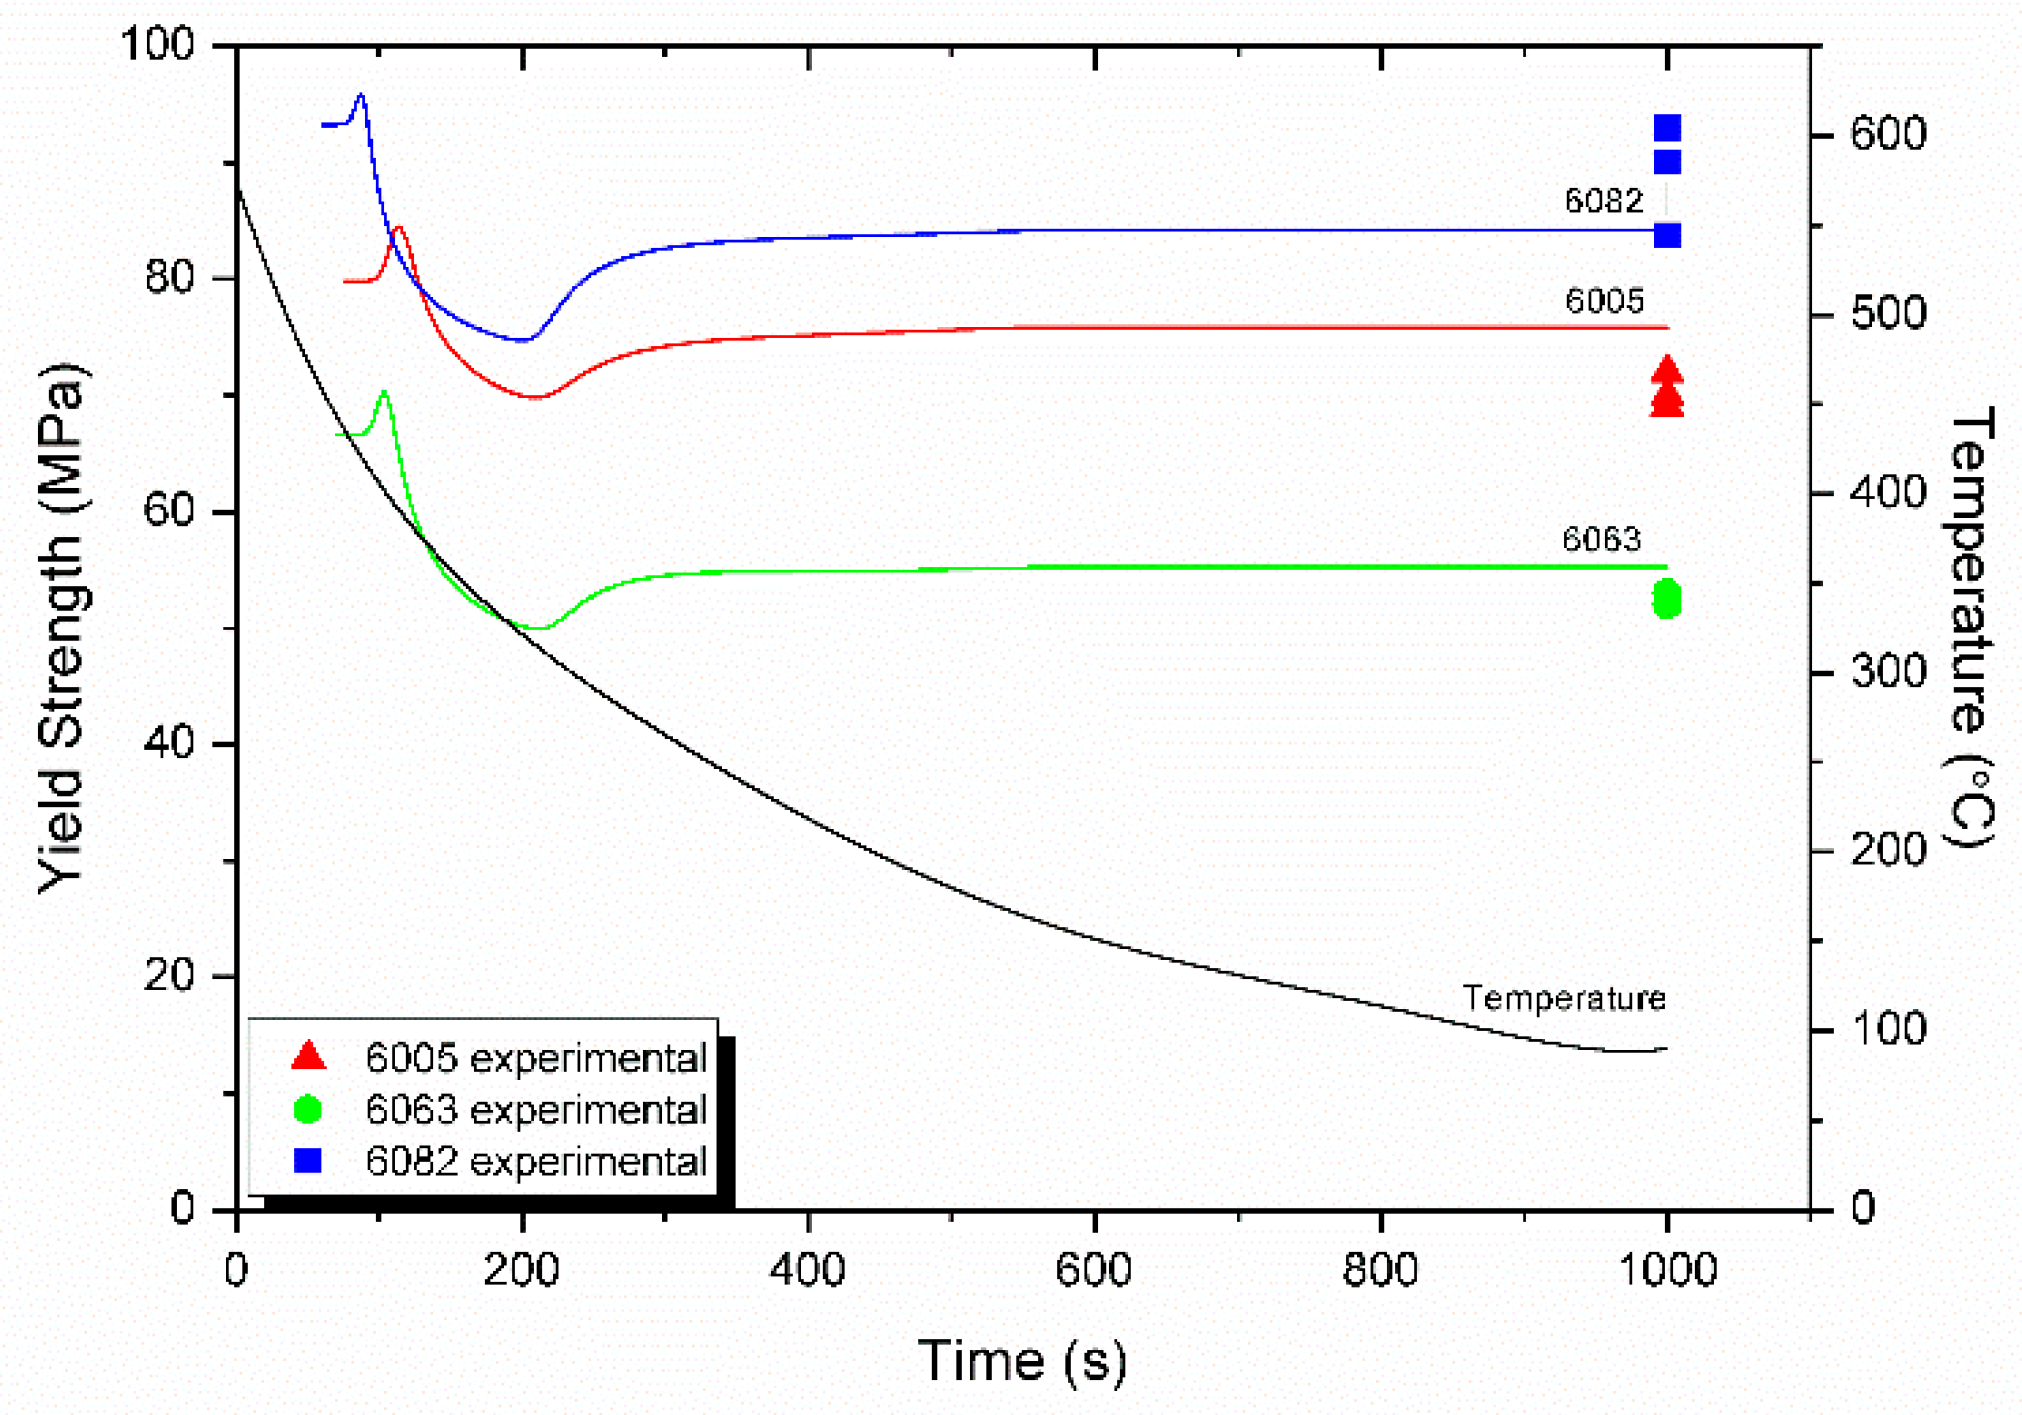
- The KWN precipitation model was applied to the binary Al-Mg2Si system in 6005, 6063, and 6082 Al alloys. The model indicated the development of a bimodal particle size distribution during homogenization cooling, arising from corresponding nucleation events. The associated strengthening arises from contributions due to solid solution and precipitation strengthening and is in good agreement with experimental results.
- The proposed modeling approach is a valuable tool for the prediction of microstructure evolution during the homogenization of extrudable 6xxx aluminum alloys, including the often-neglected part of homogenization cooling.
Author Contributions
Funding
Acknowledgments
Conflicts of Interest
References
- Liu, Y.L.; Kang, S.B. The solidification process of Al-Mg-Si alloys. J. Mater. Sci. 1997, 32, 1443–1447. [Google Scholar] [CrossRef]
- Wang, Q.G.; Davidson, C.J. Solidification and precipitation behavior of Al-Si-Mg casting alloys. J. Mater. Sci. 2001, 36, 739–750. [Google Scholar] [CrossRef]
- Saha, P.K. Aluminum Extrusion Technology; ASM International: Metals Park, OH, USA, 2000; ISBN 978-0-87170-644-7. [Google Scholar]
- Mukhopadhyay, P. Alloy designation, processing and use of AA6xxx series aluminum alloys. Intern. Sch. Res. Net. Metall. 2012, 2012, 1–15. [Google Scholar]
- Dons, A.L. The Alstruc homogenization model for industrial aluminum alloys. J. Light Metals 2001, 1, 133–149. [Google Scholar] [CrossRef]
- Birol, Y. The effect of homogenization practice on the microstructure of AA6063 billets. J. Mater. Proc. Technol. 2004, 148, 250–258. [Google Scholar] [CrossRef]
- Cai, M.; Robson, J.D.; Lorimer, G.W.; Parson, N.C. Simulation of the Casting and Homogenization of two 6xxx Series Alloys. Mater. Sci. Forum. 2002, 396, 209–214. [Google Scholar] [CrossRef]
- Usta, M.; Glicksman, M.E.; Wright, R.N. The effect of Heat Treatment on Mg2Si Coarsening in Aluminum 6105 Alloy. Metall. Mater. Trans. A 2004, 35A, 435–438. [Google Scholar] [CrossRef]
- Van der Langkruis, J. The effect of thermal treatments on the extrusion behavior of AlMgSi alloys. Ph.D. Thesis, Technical University of Delft, Delft, The Netherlands, 2000. [Google Scholar]
- Kumar, S.; Grant, P.S.; O’Reilly, K.A.Q. Evolution of Fe-bearing intermetallics during DC casting and homogenization of an Al-Mg-Si Al alloy. Metal. Mater. Trans. A 2016, 47A, 3000–3014. [Google Scholar] [CrossRef]
- Tanihata, H.; Sugawara, T.; Matsuda, K.; Ikeno, S. Effect of casting and homogenization treatment conditions on the formation of Al-Fe-Si intermetallic compounds in 6063 Al-Mg-Si alloys. J. Mater. Sci. 1999, 34, 1205–1210. [Google Scholar] [CrossRef]
- Griger, A.; Stefaniay, V. Equilibrium and non-equilibrium intermetallic phases in Al-Fe and Al-Fe-Si alloys. J. Mater. Sci. 1996, 31, 6645–6652. [Google Scholar] [CrossRef]
- Onurlu, S.; Tekin, A. Effect of heat treatment on the insoluble intermetallic phases present in an AA6063 alloy. J. Mater. Sci. 1994, 29, 1652–1655. [Google Scholar] [CrossRef]
- Sarafoglou, P.I.; Aristeidakis, J.S.; Tzini, M.I.T.; Haidemenopoulos, G.N. Metallographic index based quantification of the homogenization state in extrudable aluminum alloys. Metals 2016, 6, 121. [Google Scholar] [CrossRef]
- Oesterreicher, J.A.; Kumar, M.; Schiffl, A.; Schwarz, S.; Bourret, G.R. Secondary precipitation during homogenization of Al-Mg-Si alloys: Influence of high temperature flow stress. Mater. Sci. Eng. A 2017, 687, 175–180. [Google Scholar] [CrossRef]
- Zajac, S.; Bengtsson, B.; Jonsson, C. Influence of cooling after homogenization and reheating to extrusion on extrudability and final properties of AA6063 and 6082 alloys. Mater. Sci. Forum 2002, 396, 399–404. [Google Scholar] [CrossRef]
- Mrowka-Nowotnik, G.; Sieniawski, J. Influence of heat treatment on the microstructure and mechanical properties of 6005 and 6082 aluminum alloys. J. Mater. Proc. Technol. 2005, 162, 367–372. [Google Scholar] [CrossRef]
- Reiso, O. The effect of microstructure on the extrudability of some aluminum alloys. Ph.D. Thesis, Norwegian Institute of Technology, Trondheim, Norway, 1992. [Google Scholar]
- Birol, Y. Effect of cooling rate on precipitation during homogenization cooling in an excess silicon AlMgSi alloy. Mater. Charact. 2012, 73, 37–42. [Google Scholar] [CrossRef]
- Birol, Y. Precipitation during homogenization cooling in AlMgSi alloys. Trans. Nonferrous Met. Soc. China 2013, 23, 1875–1881. [Google Scholar] [CrossRef]
- Birol, Y. Homogenization of direct chill cast AlSi1MgMn billets. Int. J. Mater. Res. 2014, 105, 75–82. [Google Scholar] [CrossRef]
- Haidemenopoulos, G.N.; Sarafoglou, P.I. Extrudable Al-Si-Mg Alloys: Simulation of microsegregation and homogenization. In Encyclopedia of Aluminum and its Alloys; Totten, G.E., Tiryakioglou, M., Kessler, O., Eds.; CRC Press: New York, NY, USA, 2018; ISBN 9781466510807. [Google Scholar]
- Sarafoglou, P.I.; Haidemenopoulos, G.N. Phase fraction mapping in the as-cast microstructure of extrudable 6xxx aluminum alloys. Int. J. Mater. Res. 2014, 105, 1202–1209. [Google Scholar] [CrossRef]
- Cui, S.; Mishra, R.; Jung, I.H. Thermodynamic analysis of 6xxx series Al alloys: phase fraction diagrams. J. Min. Metall. Sect. B-Metall. 2018, 54, 119–131. [Google Scholar] [CrossRef]
- Du, Q.; Poole, W.J.; Wells, M.A.; Parson, N.C. Microstructure evolution during homogenization of Al-Mn-Fe-Si alloys: Modeling and experimental results. Acta Mater. 2013, 61, 4961–4973. [Google Scholar] [CrossRef]
- Du, Q.; Poole, W.J.; Wells, M.A. A mathematical model coupled to CALPHAD to predict precipitation kinetics for multicomponent aluminum alloys. Acta Mater. 2012, 60, 3830–3839. [Google Scholar] [CrossRef]
- Du, Q.; Jacot, A. A two-dimensional microsegregation model for the description of microstructure formation during solidification of multicomponent alloys: Formulation and behavior of the model. Acta Mater. 2005, 53, 3479–3493. [Google Scholar] [CrossRef]
- Kuijpers, N.C.W. A model of the β-AlFeSi to α-Al(FeMn)Si transformation in Al-Mg-Si alloys. Mat. Trans. 2003, 44, 1448–1456. [Google Scholar] [CrossRef]
- Kuijpers, N.C.W. The dependence of the β-AlFeSi to α-Al(FeMn)Si transformation kinetics in Al-Mg-Si alloys on the alloying elements. Mater. Sci. Eng. A 2005, 394, 9–19. [Google Scholar] [CrossRef]
- Haidemenopoulos, G.N.; Kamoutsi, H.; Zervaki, A.D. Simulation of the transformation of iron intermetallics during homogenization of 6xxx series extrudable aluminum alloys. J. Mater. Proc. Technol. 2012, 212, 2255–2260. [Google Scholar] [CrossRef]
- Liu, C.L.; Du, Q.; Parson, N.C.; Poole, W.J. The interaction between Mn and Fe on the precipitation of Mn/Fe dispersoids in Al-Mg-Si-Mn-Fe alloys. Scripta Mater. 2018, 152, 59–63. [Google Scholar] [CrossRef]
- Du, Q.; Jia, L.; Tang, K.; Holmedal, B. Modeling and experimental validation of mocrostructure evolution during the cooling stage of homogenization heat treatment of Al-Mg-Si alloys. Materialia 2018, in press. [Google Scholar] [CrossRef]
- Priya, P.; Johnson, D.R.; Krane, M.J.M. Numerical study of microstructural evolution during homogenization of Al-Si-Mg-Fe-Mn alloys. Metall. Mater. Trans. A 2016, 47, 4625–4639. [Google Scholar] [CrossRef]
- Standard Test Method for Determining Volume Fraction by Systematic Manual Point Count; ASTM E562; ASTM International: West Conshohocken, PA, USA, 2003.
- Standard Test Methods for Tension Testing of Metallic Materials; ASTM E8/E8M-16a; ASTM International: West Conshohocken, PA, USA, 2016.
- Andersson, J.O.; Helander, T.; Höglund, L.; Shi, P.; Sundman, B. Thermo_Calc and DICTRA computational tools for materials science. Calphad 2002, 26, 273–312. [Google Scholar] [CrossRef]
- Lukas, H.; Fries, S.G.; Sundman, B. Computational thermodynamics, the Calphad method; Cambridge University Press: Cambridge, UK, 2007; ISBN 9780521868112. [Google Scholar]
- Shi, R.; Luo, A.A. Applications of CALPHAD modeling and databases in advanced lightweight metallic materials. Calphad 2018, 62, 1–17. [Google Scholar] [CrossRef]
- Chen, H.L.; Chen, Q.; Engstrom, A. Development and applications of the TCAL aluminum alloy database. Calphad 2018, 62, 154–171. [Google Scholar] [CrossRef]
- Wu, M.; Ludwig, A. Using a Three-Phase Deterministic Model for the Columnar-to-Equiaxed Transition. Metall. Mater. Trans. A 2007, 38A, 1465–1475. [Google Scholar] [CrossRef]
- Wu, M.; Li, J.; Ludwig, A.; Kharicha, A. Modeling diffusion-governed solidification of ternary alloys-Part 1: Coupling solidification kinetics with thermodynamics. Comput. Mater. Sci. 2013, 79, 830–840. [Google Scholar] [CrossRef] [PubMed]
- Wagner, R.; Kampmann, R. Homogeneous second phase precipitation. In Materials Science and Technology, Vol. 5, Phase Transformations in Materials; Cahn, R.W., Haasen, P., Kramer, E.J., Eds.; VCH: Weinhein, Germany, 1991; p. 21. ISBN 3527268189. [Google Scholar]
- Kampmann, R.; Eckerlebe, H.; Wagner, R. Precipitation Kinetics in Metastable Solid Solutions-Theoretical Considerations and Application to Cu-Ti Alloys. Mater. Res. Soc. Symp. Proc. MRS 2000, 57, 525–542. [Google Scholar] [CrossRef]
- Myhr, O.R.; Grong, O. Modelling of non-isothermal transformations in alloys containing a particle distribution. Acta Mater. 2000, 48, 1605–1615. [Google Scholar] [CrossRef]
- Myhr, O.R.; Grong, O.; Fjaer, H.G.; Marioara, C.D. Modelling of the microstructure and strength evolution in Al-Mg-Si alloys during multistage thermal processing. Acta Mater. 2004, 52, 4997–5008. [Google Scholar] [CrossRef]
- Simar, A.; Brechet, Y.; de Meester, B.; Denquin, A.; Pardoen, T. Sequential modeling of local precipitation, strength and strain hardening in friction stir welds of an aluminum alloy 6005A-T6. Acta Mater. 2007, 55, 6133–6143. [Google Scholar] [CrossRef] [Green Version]
- Sun, Y.; Thomson, D.R.; Trumble, K.P.; Priya, P.; Krane, M.J.M. Effect of Mg2Si phase on extrusion of AA6005 aluminum alloy. In Light Metals 2014; Grandfield, J., Ed.; Springer International Publishing: New York, NY, USA, 2014; pp. 429–433. ISBN 9781118889084. [Google Scholar]
- Samaras, S. Effect of initial microstructure on the performance of 6xxx aluminum alloy laser welds: A computational study. J. Mat. Eng. Perform. 2016, 25, 1729–1740. [Google Scholar] [CrossRef]
- Russell, K.C. Nucleation in solids: The induction and steady-state effects. Adv. Colloid Intrerf. Sci. 1980, 13, 205–318. [Google Scholar] [CrossRef]
- Cinkilic, E.; Sun, W.; Klaner, D.; Luo, A. Use of Calphad modeling in controlling the microstructure of cast aluminum alloys. Am. Foundry Soc. Trans. 2015, 123, 57–61. [Google Scholar]
- Grong, O. Metallurgical Modeling of Welding, 2nd ed.; The Institute of Materials: London, UK, 1997; ISBN 1861250363. [Google Scholar]
- Van de Langkruis, J.; Kool, W.H.; Van der Zwaag, S. Modification of a thermomechanical model to predict constitutive behavior of Al-Mg-Si alloys. J. Mat. Eng. Perform. 2006, 15, 632–639. [Google Scholar] [CrossRef]
- Myhr, O.R.; Grong, O.; Andersen, S.J. Modeling of the age hardening behavior of Al-Mg-Si alloys. Acta Mater. 2001, 49, 65–75. [Google Scholar] [CrossRef]


| Al-Alloy | Mg | Si | Fe | Mn |
|---|---|---|---|---|
| 6063 | 0.5346 | 0.4194 | 0.1895 | 0.0311 |
| 6005 | 0.4896 | 0.686 | 0.1552 | 0.2227 |
| 6082 | 0.63 | 0.9 | 0.2 | 0.45 |
| Process | Phenomena Modeled | Relevant Models |
|---|---|---|
| Casting/Solidification | Microsegregation of elements and phases | Scheil-Gulliver |
| Homogenization (holding) | Dissolution of Mg2Si Transformation of β-AlFeSi to α-Al(FeMn)Si | Multicomponent, multiphase diffusion—Dual Grain Model (DGM) |
| Homogenization (cooling) | Precipitation of Mg2Si Precipitation Strengthening | Kampmann-Wagner Numerical (KWN) precipitation model—Strength model |
| Phase Fractions | Calculated (%) | Measured (%) |
| β-AlFeSi + α-AlFeSi | 0.587 | 0.607 |
| Mg2Si | 0.313 | 0.365 |
| Quaternary Eutectic | 0.411 | 0.41 |
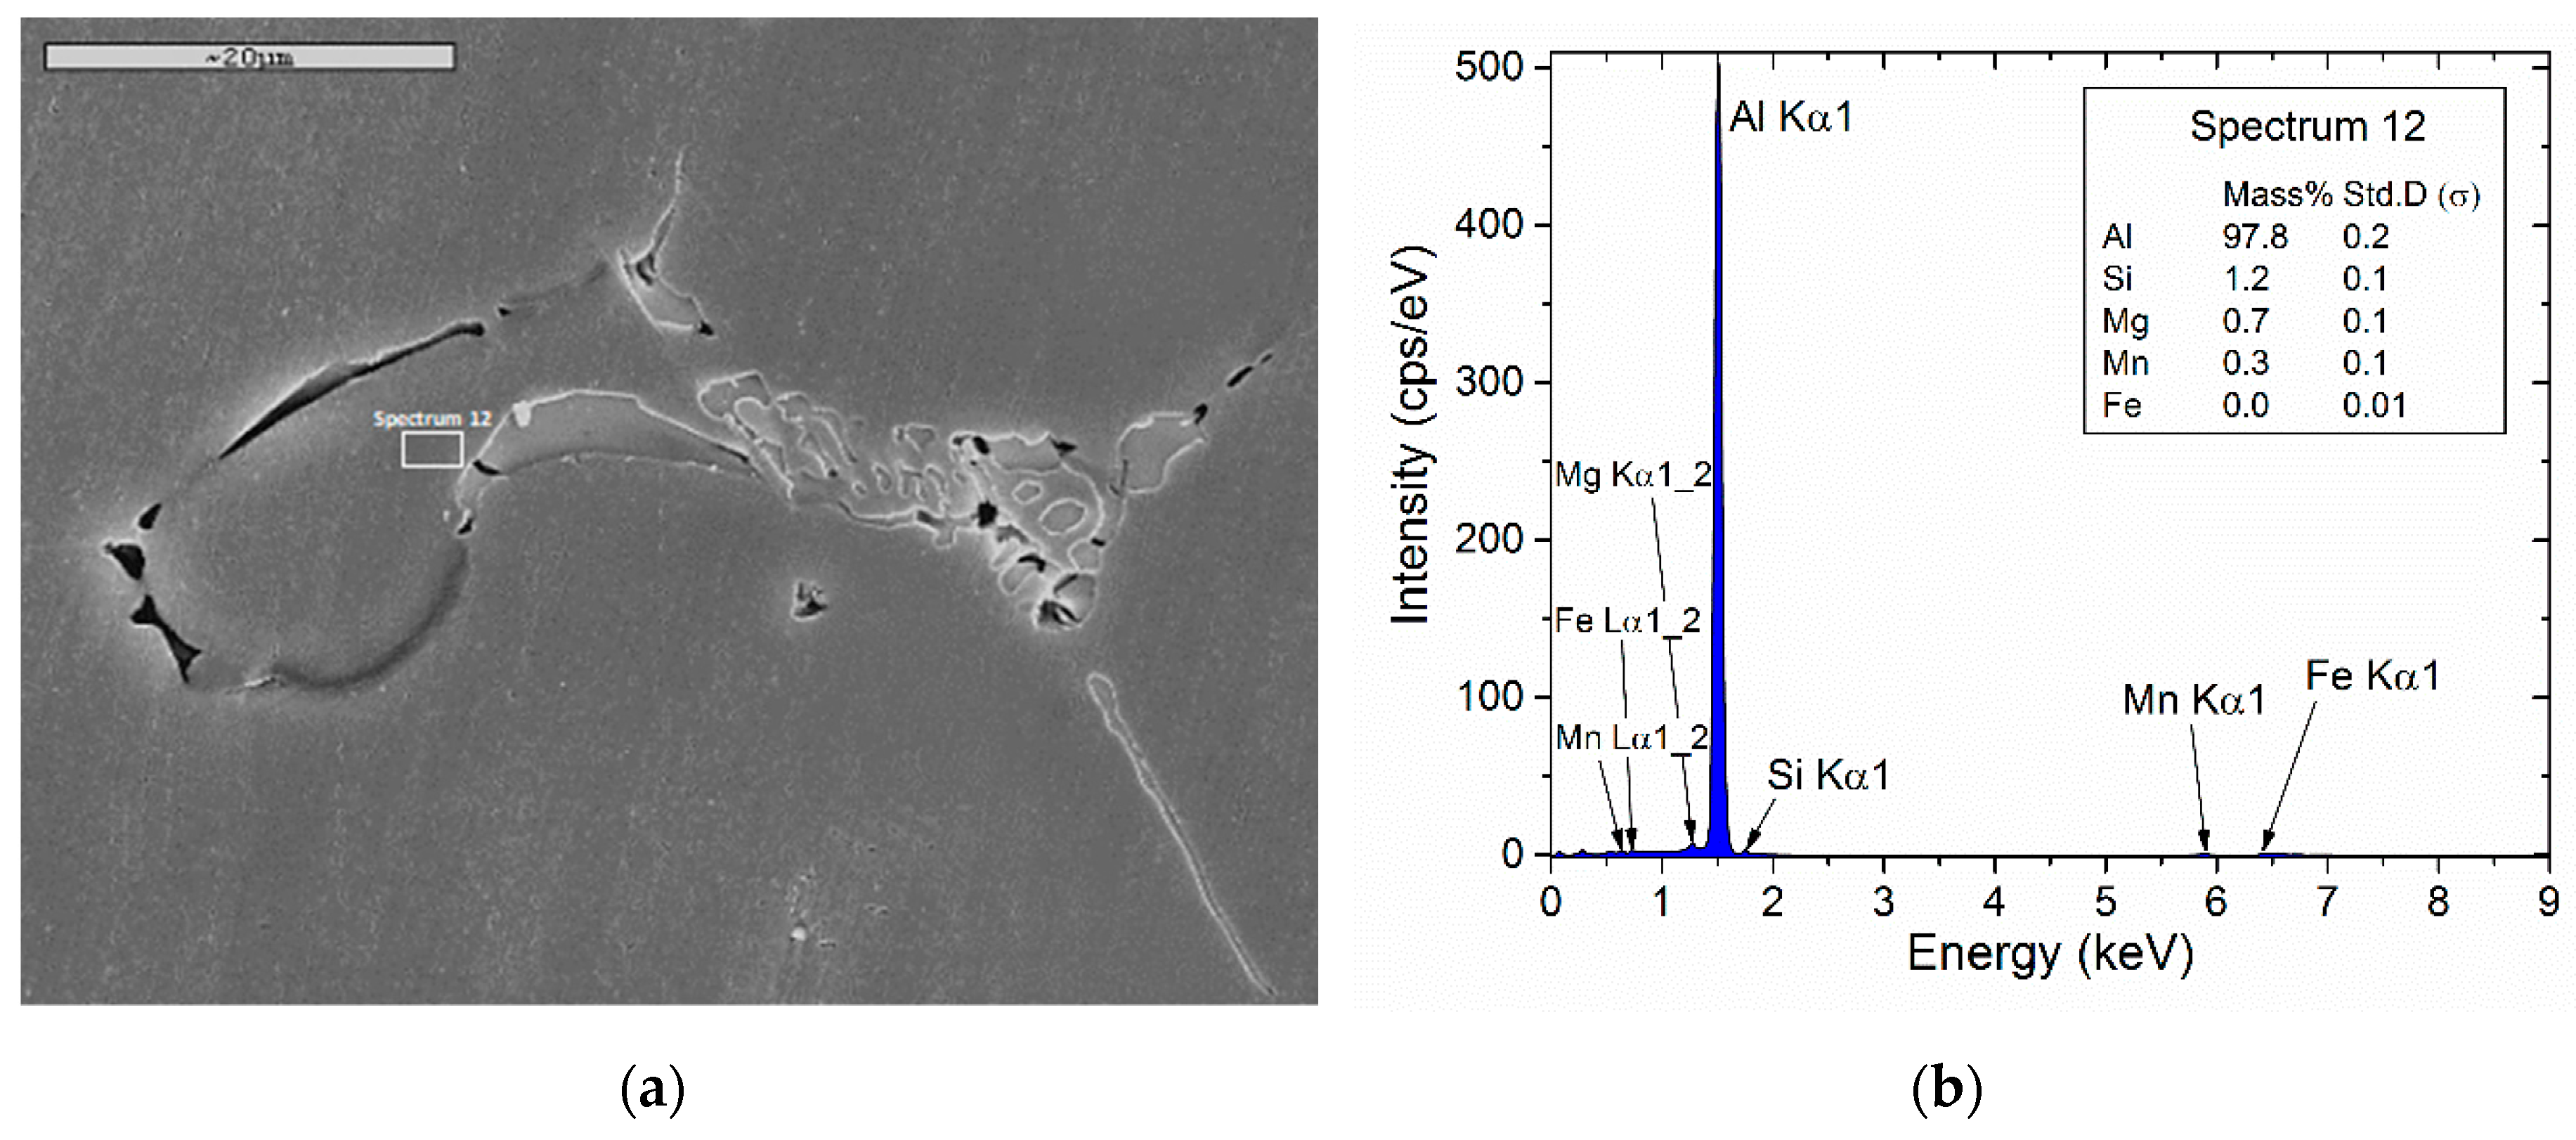
| Matrix Composition Close to Boundary | Calculated (mass%) (at 0.92 Fraction of Solid) | Measured (mass%) |
| Si | 1.33 | 1.2 (σ = 0.1) |
| Mg | 0.6 | 0.7 (σ = 0.1) |
| Mn | 0.63 | 0.3 (σ = 0.1) |
| Fe | 0.003 | 0 (σ = 0.01) |
| Al | 97.4 | 97.8 (σ = 0.2) |
| Parameter | Symbol | Value | Source |
|---|---|---|---|
| Concentration of Mg in Mg2Si | (wt%) | 63.4 | Stoichiometry |
| Pre-exponential term for diffusion of Mg | (m2/s) | 2.2 × 10⁻⁴ | [44] |
| Activation energy for diffusion of Mg | (J/mol) | 130,000 | [44] |
| Nucleus/matrix interfacial energy (Mg2Si) | (J/m2) | 0.5 | [51] |
| Molar volume Mg2Si | (m3/mol) | 3.95 × 10⁻⁵ | [51] |
| Total bulk nucleation site density | (#/m3) | 1019–1020 | Adjustable parameter |
| Dimensionless term in activation energy for nucleation | 4 × 10⁻¹⁹ | [42] | |
| Transition radius for precipitation strengthening | (m) | 5 × 10⁻⁹ | [52] |
| Constant contribution to yield strength | (MPa) | 10 | [52] |
| Parameter for solid solution strengthening of Si | 66.3 | [53] | |
| Parameter for solid solution strengthening of Mg | 29 | [53] | |
| Parameter for precipitation hardening | 4 × 10⁻⁶ | [42] |
| Alloy | Specimen | σyield (ΜPa) | σyield Mean (MPa) | εfracture (%) |
|---|---|---|---|---|
| 6005 | 1st | 72 | 70.33 | 27.7 |
| 2nd | 69 | 25 | ||
| 3rd | 70 | 26.3 | ||
| 6063 | 1st | 52 | 52.33 | 33.3 |
| 2nd | 53 | 30.5 | ||
| 3rd | 52 | 30.5 | ||
| 6082 | 1st | 83.75 | 88.91 | 16.6 |
| 2nd | 90 | 15.2 | ||
| 3rd | 93 | 16.6 |
© 2019 by the authors. Licensee MDPI, Basel, Switzerland. This article is an open access article distributed under the terms and conditions of the Creative Commons Attribution (CC BY) license (http://creativecommons.org/licenses/by/4.0/).
Share and Cite
Sarafoglou, P.I.; Serafeim, A.; Fanikos, I.A.; Aristeidakis, J.S.; Haidemenopoulos, G.N. Modeling of Microsegregation and Homogenization of 6xxx Al-Alloys Including Precipitation and Strengthening During Homogenization Cooling. Materials 2019, 12, 1421. https://doi.org/10.3390/ma12091421
Sarafoglou PI, Serafeim A, Fanikos IA, Aristeidakis JS, Haidemenopoulos GN. Modeling of Microsegregation and Homogenization of 6xxx Al-Alloys Including Precipitation and Strengthening During Homogenization Cooling. Materials. 2019; 12(9):1421. https://doi.org/10.3390/ma12091421
Chicago/Turabian StyleSarafoglou, Panagiota I., Alexandros Serafeim, Ioannis A. Fanikos, John S. Aristeidakis, and Gregory N. Haidemenopoulos. 2019. "Modeling of Microsegregation and Homogenization of 6xxx Al-Alloys Including Precipitation and Strengthening During Homogenization Cooling" Materials 12, no. 9: 1421. https://doi.org/10.3390/ma12091421