Fullerene Aggregation in Thin Films of Polymer Blends for Solar Cell Applications


1
Department of Engineering and Physics, Karlstad University, SE-651 88 Karlstad, Sweden
2
Department of Engineering and Chemical Sciences, Karlstad University, SE-651 88 Karlstad, Sweden
*
Author to whom correspondence should be addressed.
Materials 2018, 11(11), 2068; https://doi.org/10.3390/ma11112068
Submission received: 30 September 2018
/
Revised: 18 October 2018
/
Accepted: 21 October 2018
/
Published: 23 October 2018
(This article belongs to the Special Issue From Macromolecules to Materials for Optoelectronic Devices)
Abstract
:We report on the effects of the film morphology on the fluorescence spectra for a thin film including a quinoxaline-based co-polymer (TQ1) and a fullerene derivative ([6,6]-phenyl-C71-butyric acid methyl ester—PC70BM). The ratio between the polymer and the fullerene derivative, as well as the processing solvent, were varied. Besides the main emission peak at 700 nm in the fluorescence spectra of thin films of this phase-separated blend, a broad emission band is observed with a maximum at 520–550 nm. The intensity of this emission band decreases with an increasing degree of mixing in the film and becomes most prominent in thicker films, films with high PC70BM content, and films that were spin-coated from solvents with lower PC70BM solubility. We assign this emission band to aggregated PC70BM.
1. Introduction
The interest in polymer based solar cells has grown rapidly during the last two decades. This technology shows several advantages, all related to its easy manufacturing by solution-based processes, compared to other solar energy harvesting technologies. Today single junction polymer solar cells of binary blends have reached a record efficiency of about 14% [1,2] and tandem cells even higher, above 17% [3].
The photoactive layer consists of a blend of an electron-donating polymer and an acceptor molecule. One of the most studied classes of acceptor molecules is fullerene derivatives, such as [6,6]-phenyl-C61-butyric acid methyl ester (PC60BM) or [6,6]-phenyl-C71-butyric acid methyl ester (PC70BM), but more recently non-fullerene acceptor molecules or polymers have increased in popularity. The donor and acceptor material are typically processed together from a chlorinated and/or aromatic solvent into a thin liquid film. The morphology of the donor/acceptor active layer is formed during deposition when the solvent evaporates and can later be altered through post-production treatments [4,5]. The morphology will affect the charge transfer from the donor to the acceptor, as well as the charge transport to the electrodes, and is consequently a crucial factor determining the solar cell performance [6,7,8,9].
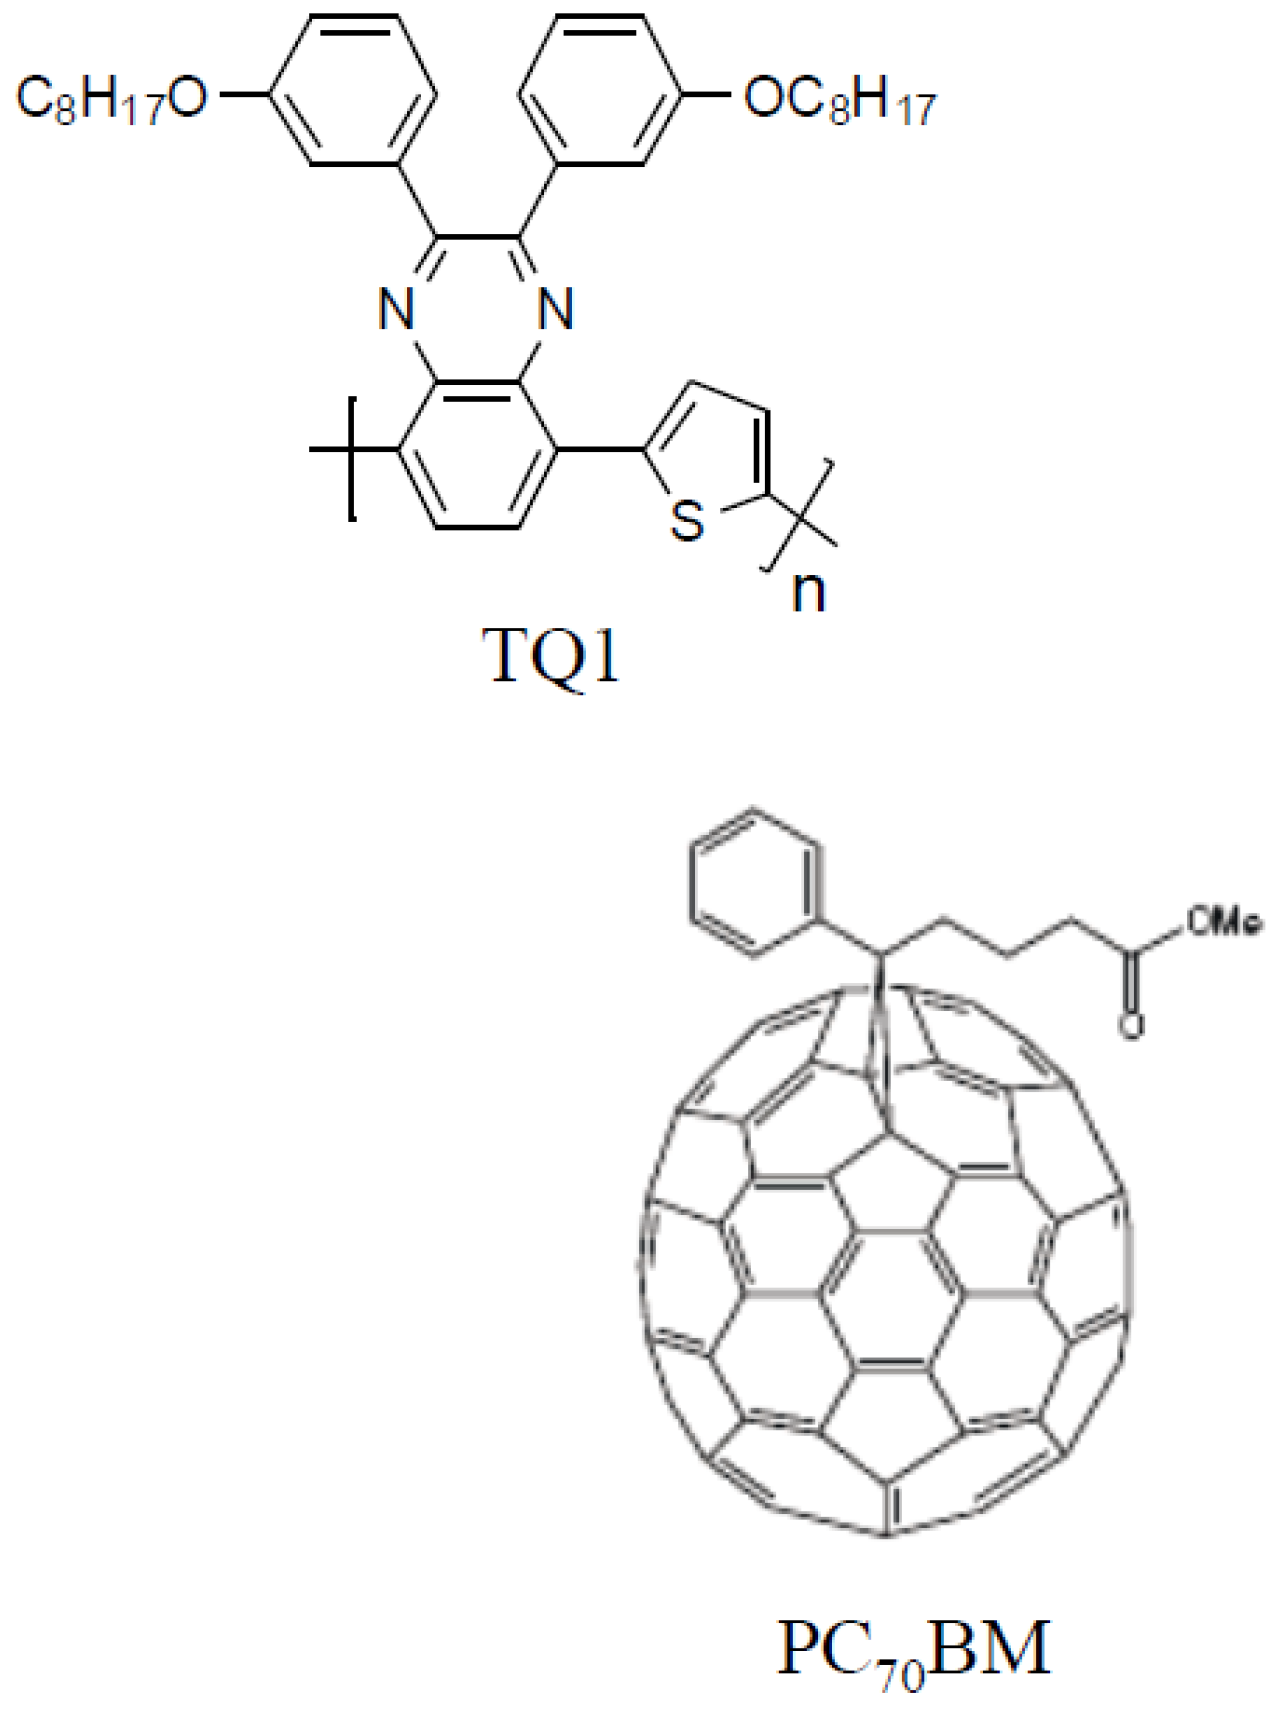
When a polymer/fullerene blend phase separates, polymer-rich and fullerene-rich domains are formed. The degree of phase separation will depend on several factors, e.g., the solubility of the two materials in the solvent [10,11], their mutual miscibility [12,13], and the rate of drying [14,15]. The interaction between the fullerene derivative and the conjugated polymer, as for instance expressed by the Flory–Huggins interaction parameters, plays a significant role in the phase separation [12]. By varying the solvent used for deposition, the solubility and the drying kinetics are affected simultaneously, and the change in morphology is complicated to predict [10,16,17,18,19]. Microscopy techniques, such as atomic force microscopy (AFM), are very suitable to study domain structures of 50 nm up to several micrometres in diameter. For systems where liquid–liquid phase separation prevails, coarser domain structures will be achieved if the drying time is prolonged by e.g., slower spin-coating speeds [14,15] or solvent annealing. Blends of a quinoxaline-based donor polymer (TQ1) [20] and PC70BM (Figure 1) [10,21,22], have been shown to be a material combination that yields solar cell efficiencies up to 7% [23].
In order to access information about the structures on the molecular scale, it is of importance to combine microscopy techniques with others, e.g., fluorescence spectroscopy. Here, we report on the aggregation of PC70BM, as studied by fluorescence spectroscopy. Fluorescence spectroscopy has successfully been used for the characterisation of these [21,22] or other [24,25] blends previously. The optical properties are correlated with the phase separated domain structure as imaged by AFM.
2. Materials and Methods
PC70BM (purity 99%) was purchased from Solenne, Groningen, The Netherlands. TQ1 was prepared according to previously published procedures [20]. TQ1 had a number-average molecular weight of Mn ≈ 34,000 (polydispersity index ≈ 2.7) as measured with size exclusion chromatography with a polystyrene standard. Chlorobenzene (CB) and chloroform (CF) (analytical grade) were purchased from Merck (Kenilworth, NJ, USA), ortho-dichlorobenzene (oDCB) (analytical grade) was purchased from Sigma-Aldrich (St. Louis, MO, USA). All solvents were used as received.
2.1. Solubility Measurements
Saturated solutions of PC70BM were prepared in the three solvents. After equilibration, the solutions were thoroughly centrifuged and an aliquot of known volume of the supernatant was withdrawn. The saturation concentrations were estimated by gravimetric analysis of the dry content after complete solvent evaporation.
2.2. Thin Film Preparation
Thin films were spin-coated from CF (12.5 mg/mL), CB (20 mg/mL), or oDCB (25 mg/mL) solutions. Concentrations in brackets are the total material concentration in solution in which the ratio between TQ1 and PC70BM was altered. Solutions were gently heated prior to spin-coating, approximately 50 °C for CF and 60 °C for CB and oDCB. The spin-speed and concentrations were chosen to yield thin blend films of similar thickness [10]. The film thickness was approximately 90 nm (±10 nm), as measured by AFM, if nothing else is stated. The films were allowed to dry in ambient air. For fluorescence spectroscopy and AFM, silicon wafers were used as substrates, cleaned using the standard RCA method [26,27,28] without the final HF-etching step, so that a clean and hydrophilic surface is achieved.
2.3. Steady-State Fluorescence Measurements
Steady-state fluorescence spectra were collected on a SPEX FL3-11 TAU fluorimeter, purchased from Gammadata (Uppsala, Sweden). Measurements were performed on thin films in front-face mode at a 22° angle relative to the incident excitation light in order to prevent reflected excitation light. The excitation wavelength was 380 nm. All samples were kept in the dark prior to the measurements and the spectra were recorded at room temperature and in ambient air.
2.4. Atomic Force Microscopy (AFM)
Images were collected in tapping mode with a Nanoscope IIIA Multimode AFM (Bruker, Billerica, MA, USA) using a TESPA-V2 n-doped silicon cantilever.
3. Results and Discussion
3.1. Solubility of PC70BM
3.2. Fluorescence Measurements
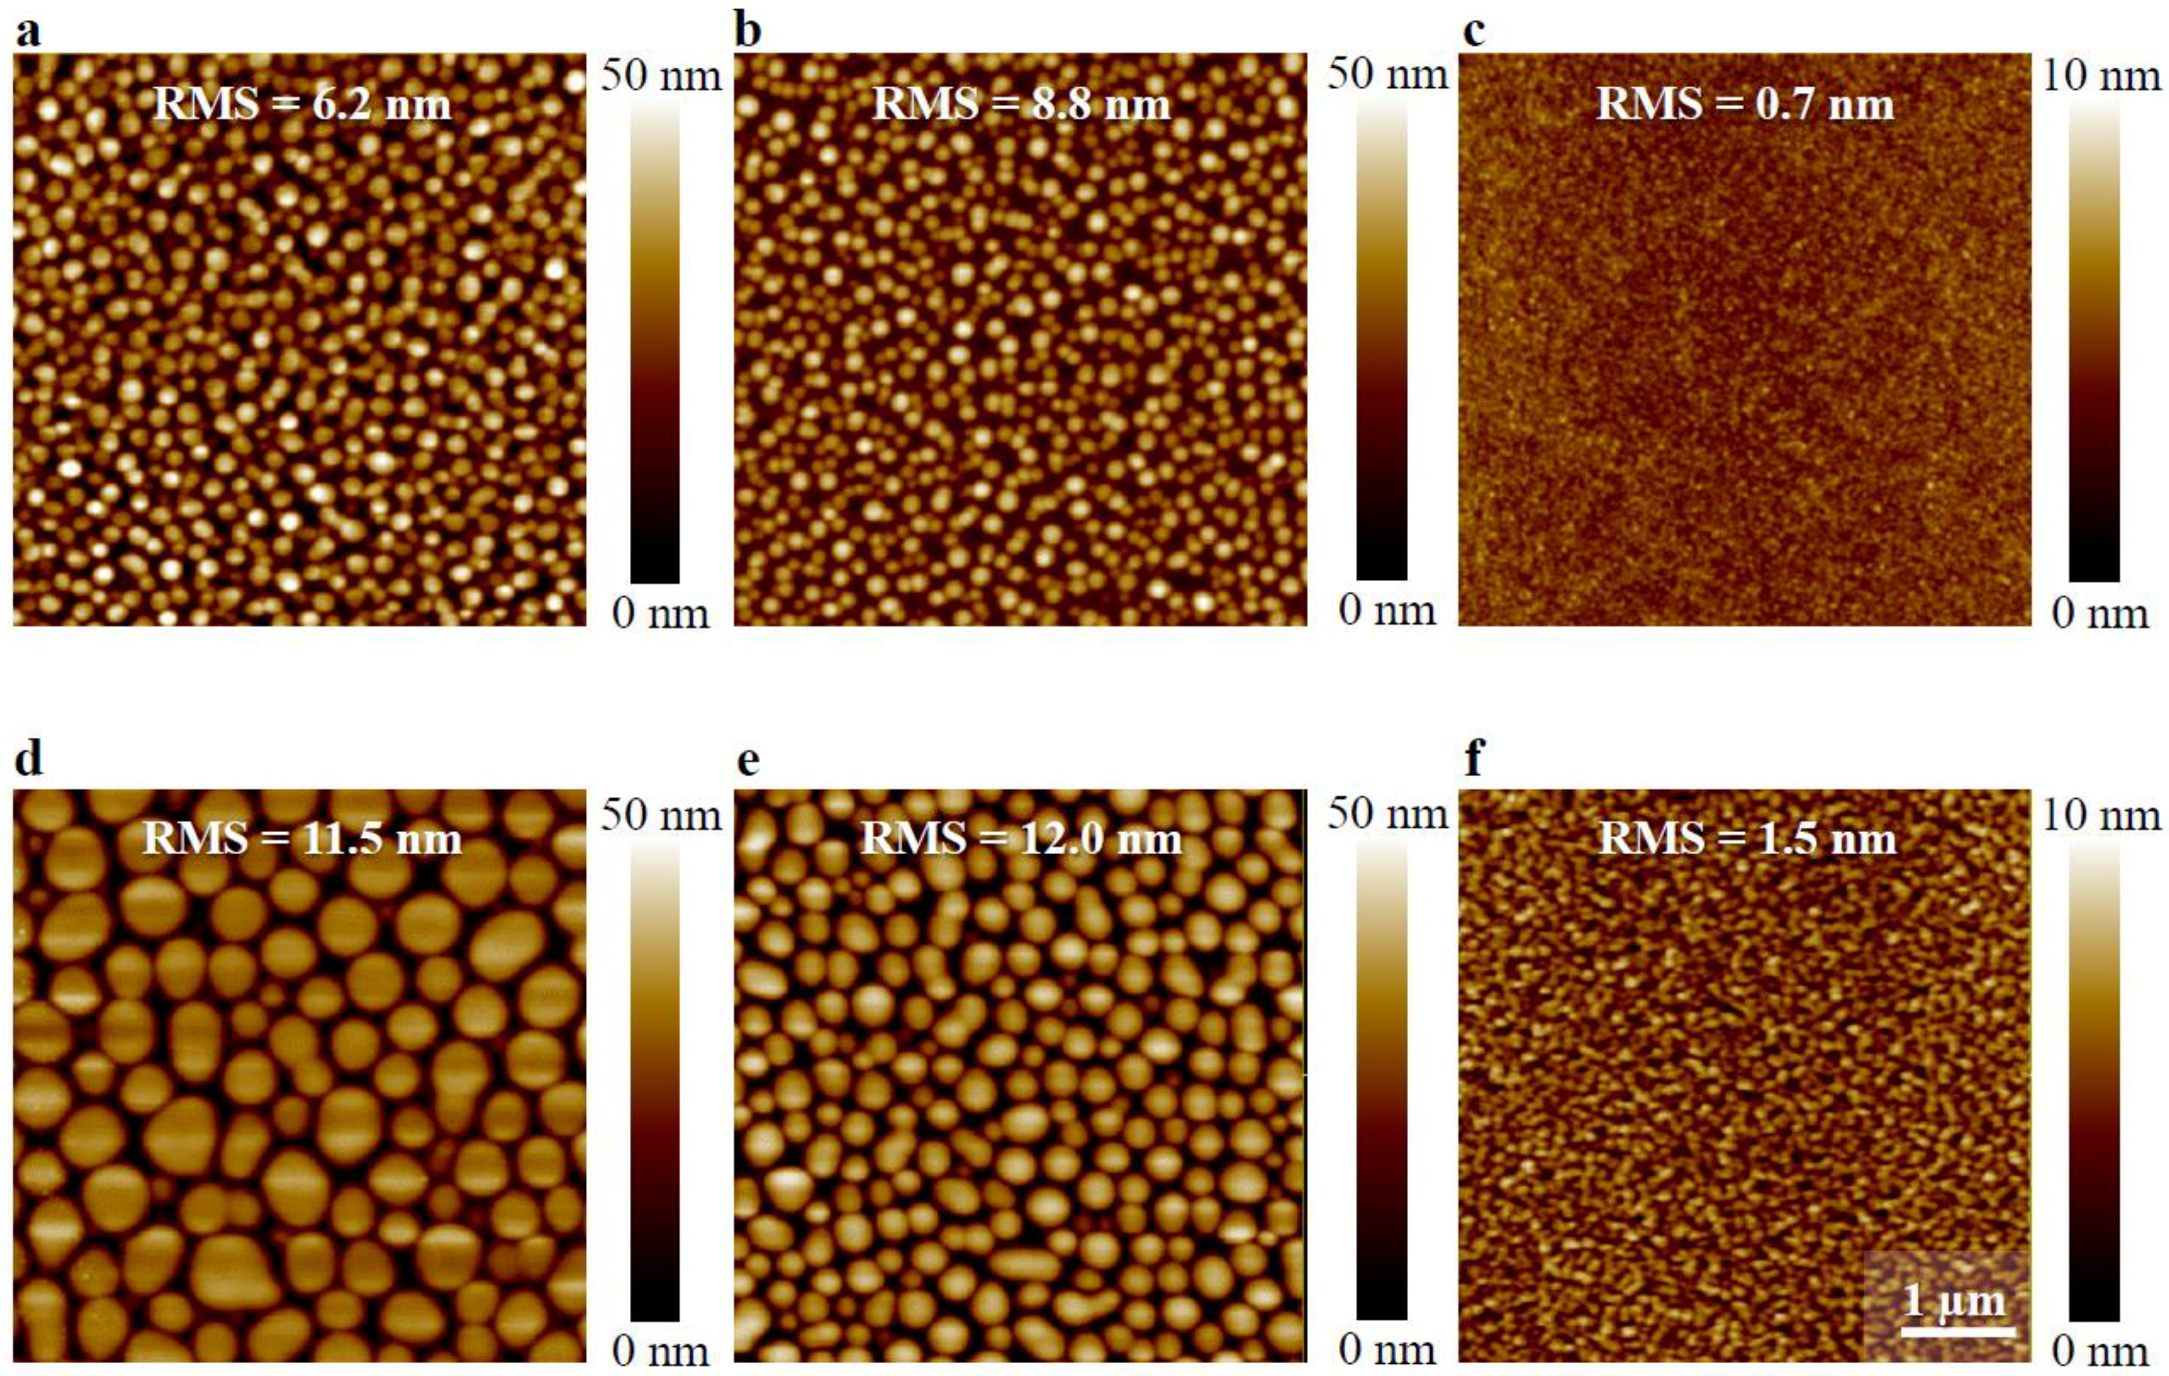
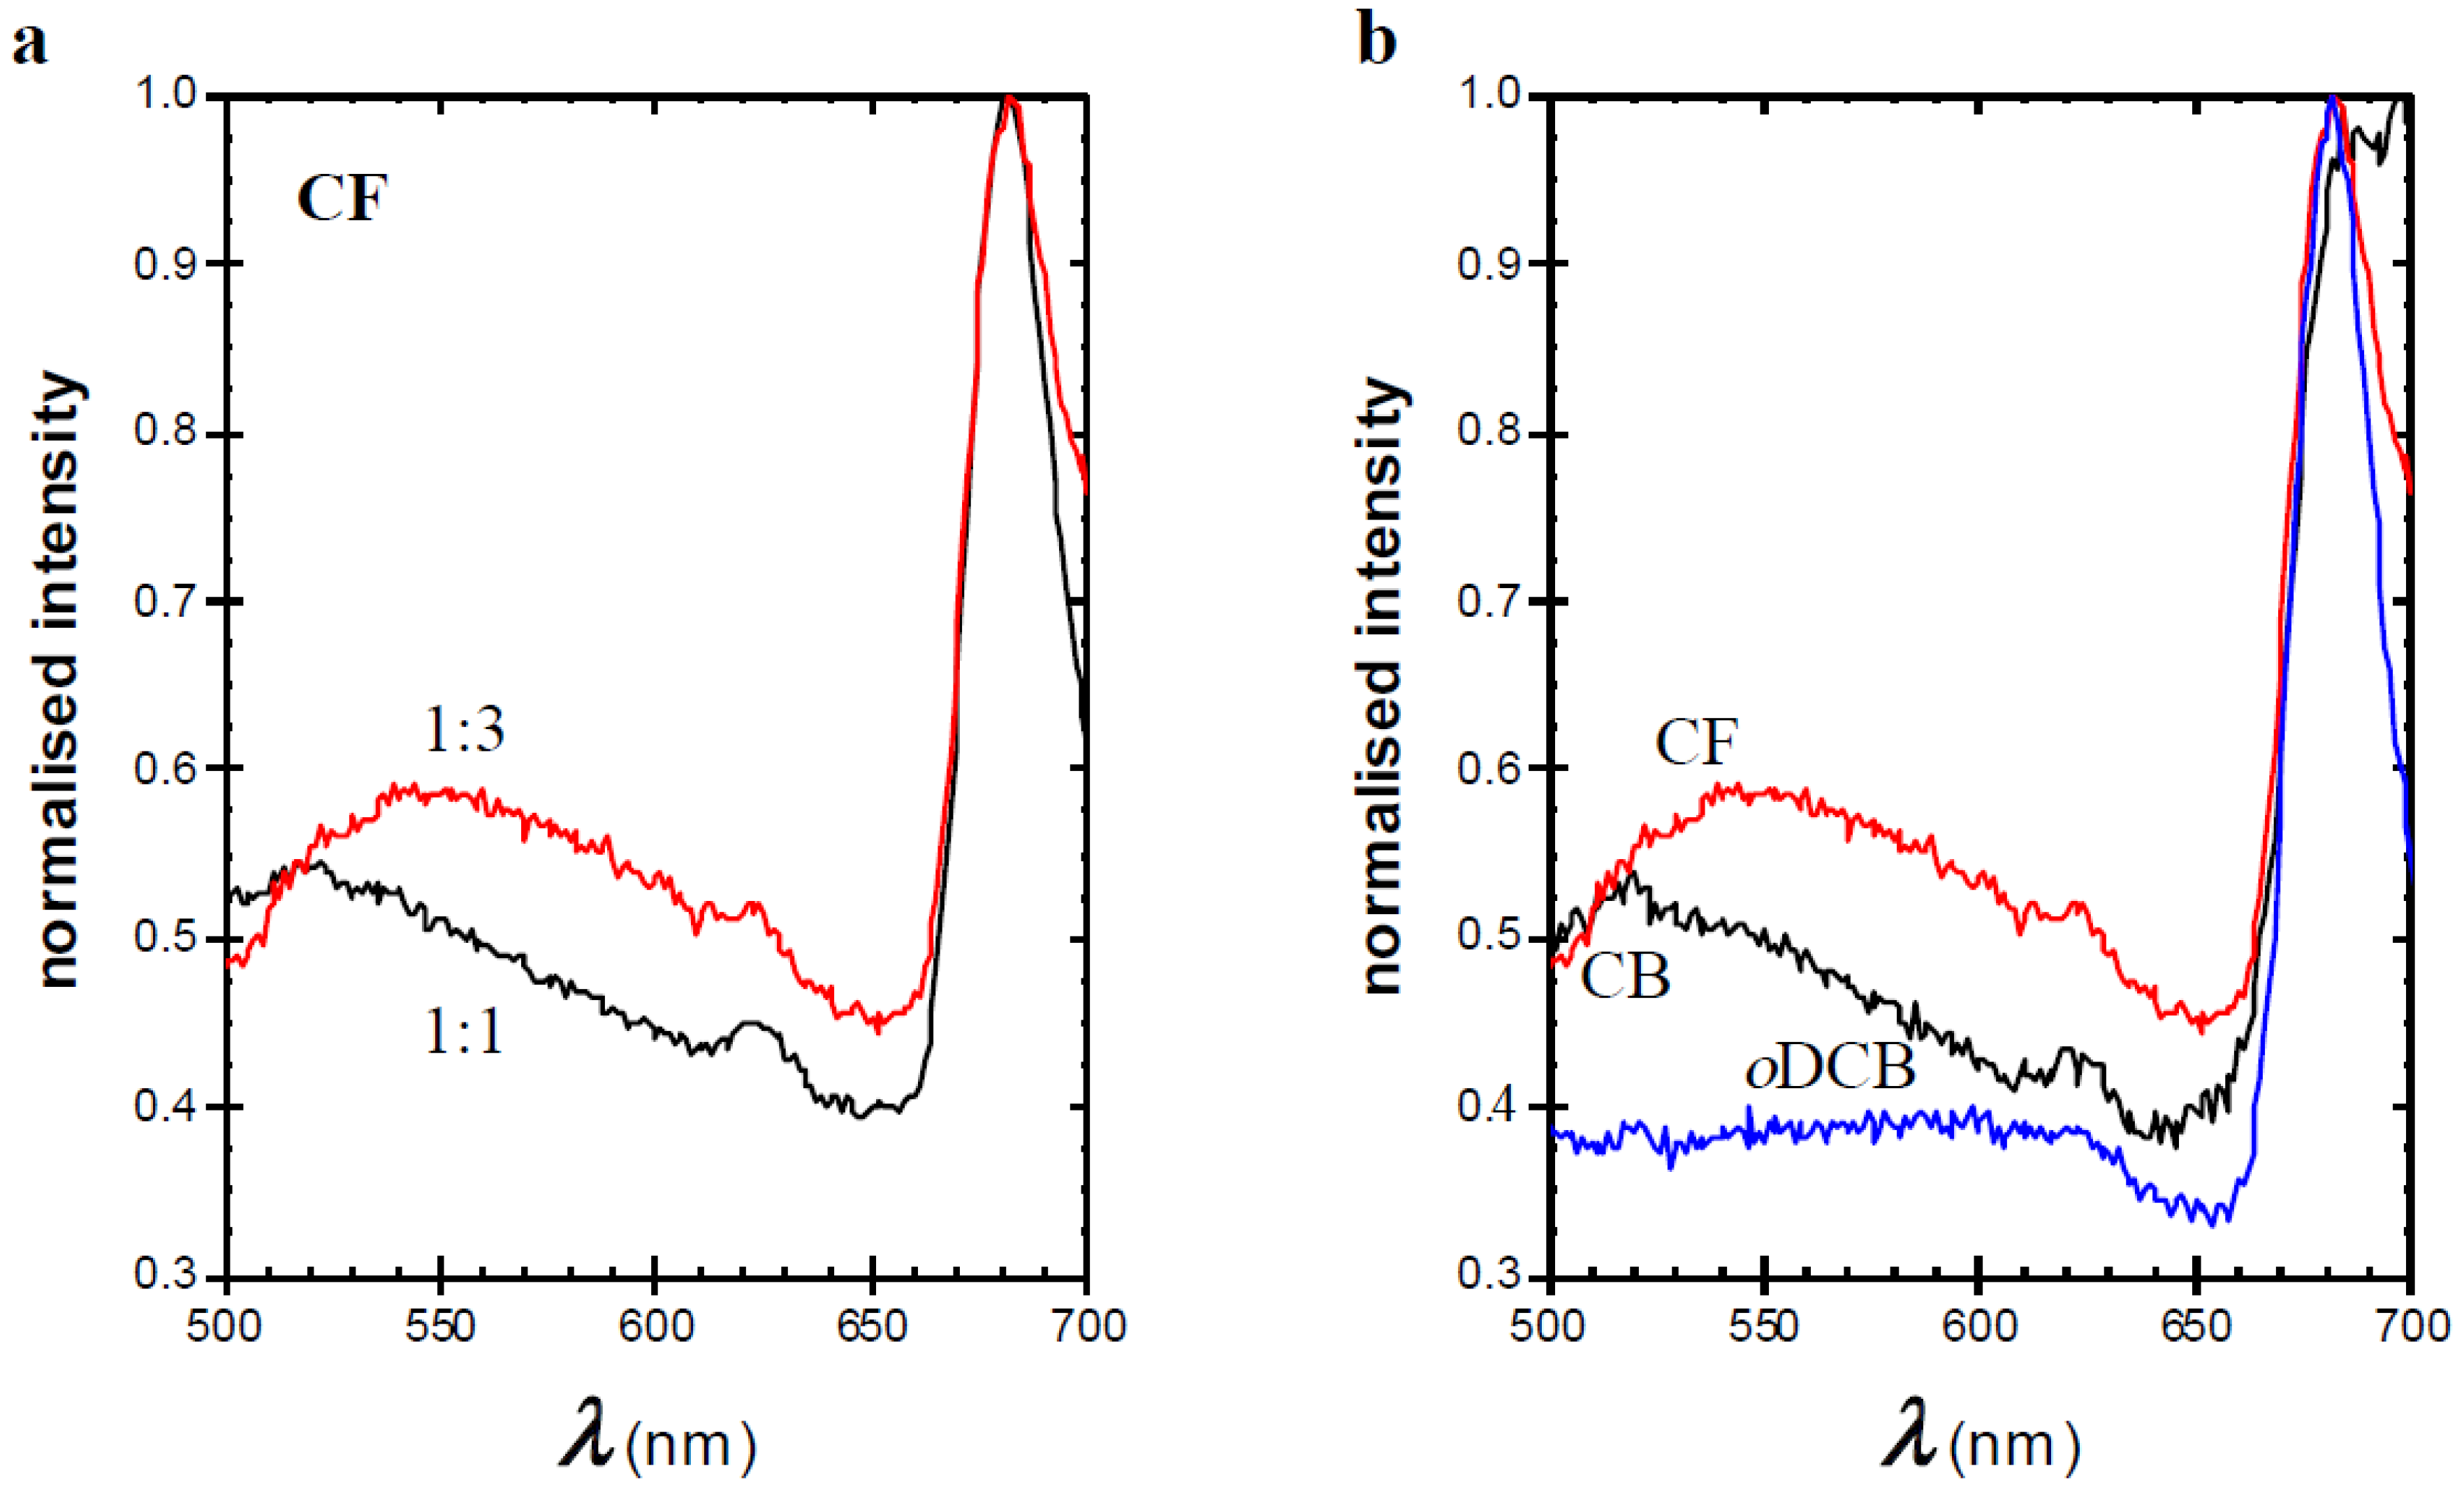
To study the relationship between morphology and optical properties, both the solvent for deposition and the ratio between TQ1 and PC70BM were altered. It has been shown earlier that the phase separated domains become larger when the fraction of PC70BM is increased in the blend [31] and that the domain size depends on the choice of solvent for films with equal thickness [10]. Hansson et al. have shown that the composition of the phase separated domains is rich in PC70BM and, by AFM imaging, that the domains are larger when CF is used as solvent than when oDCB is the solvent [10]. The AFM images shown in Figure 2 show that the phase-separated, PC70BM-rich domains become larger when a worse solvent for the fullerene derivative is used, in line with the earlier findings. This is more pronounced for the 1:3 blend than for the 1:1 blend in the series of decreasing PC70BM solubility, i.e., oDCB, CB, and CF. Emission spectra, shown in Figure 3, obtained upon excitation at 380 nm of the blend films show that apart from the main TQ1 emission peak at 700 nm [21,22], a very broad emission band with a maximum between 520 nm and 550 nm. For pure TQ1 in solution, this emission band is absent when TQ1 is dissolved in CF, CB or oDCB [22], which is also found for pure TQ1 films (spectrum not shown). The only emission in the visible region from TQ1 dissolved in those solvents is found around 650–700 nm, slightly blue-shifted in comparison with the emission from TQ1 films [21,22]. For TQ1:PC70BM blend films, we have shown that when the PC70BM-rich domains grow, the intensity of the emission band between 500 nm and 550 nm increases [22].
A similar trend in the emission peak as in the previous studies is observed if the amount of PC70BM was increased (Figure 3a) or if a worse solvent for PC70BM (CF) is used (Figure 3b). Further, the maximum of the 500–550 nm emission band shifts to longer wavelengths, i.e., from approximately 520 nm to 550 nm, shown in Figure 3. Cook et al. showed that films of pure PC60BM give rise to a broad emission band at approximately 500 nm, which is absent when the fullerene derivative is well distributed in a polystyrene matrix (1:7 fullerene/polystyrene) [31]. They assign this emission to the occurrence of aggregated PC60BM. In addition, Jamieson et al. observed this peak in films of blends with a high fullerene content in a semi-conducting polymer matrix relevant for solar cell applications [32]. The emission peak observed in the present PC70BM-based blends seems to be similar to the one reported for PC60BM. This series of results indicates that the 520–550 nm emission band in strongly phase-separated TQ1:PC70BM is likely to emanate from aggregated PC70BM, and that samples with larger domains include a larger portion of aggregated PC70BM. The nature of these aggregates is not clear from these results. Earlier literature suggests that nanocrystals of fullerenes can be formed upon spin-coating [33]. The shift from 520 nm to 550 nm in emission maximum is most likely due to a gradual development of the aggregates from a less organised cluster of PC70BM molecules (in films coated from CB and in films with a 1:1 ratio) to more compact aggregates in films with a 1:3 ratio or in films prepared from CF. For the present results, we cannot draw conclusions about the location of the PC70BM aggregates, even though it is safe to assume that they are formed inside the PC70BM-rich domains.
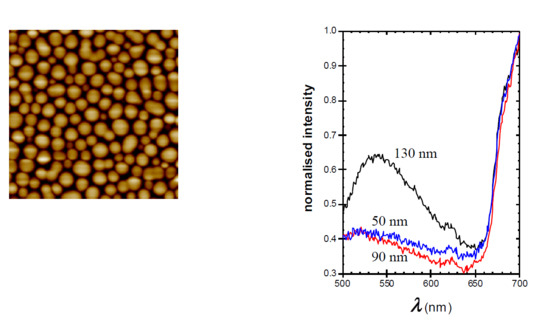
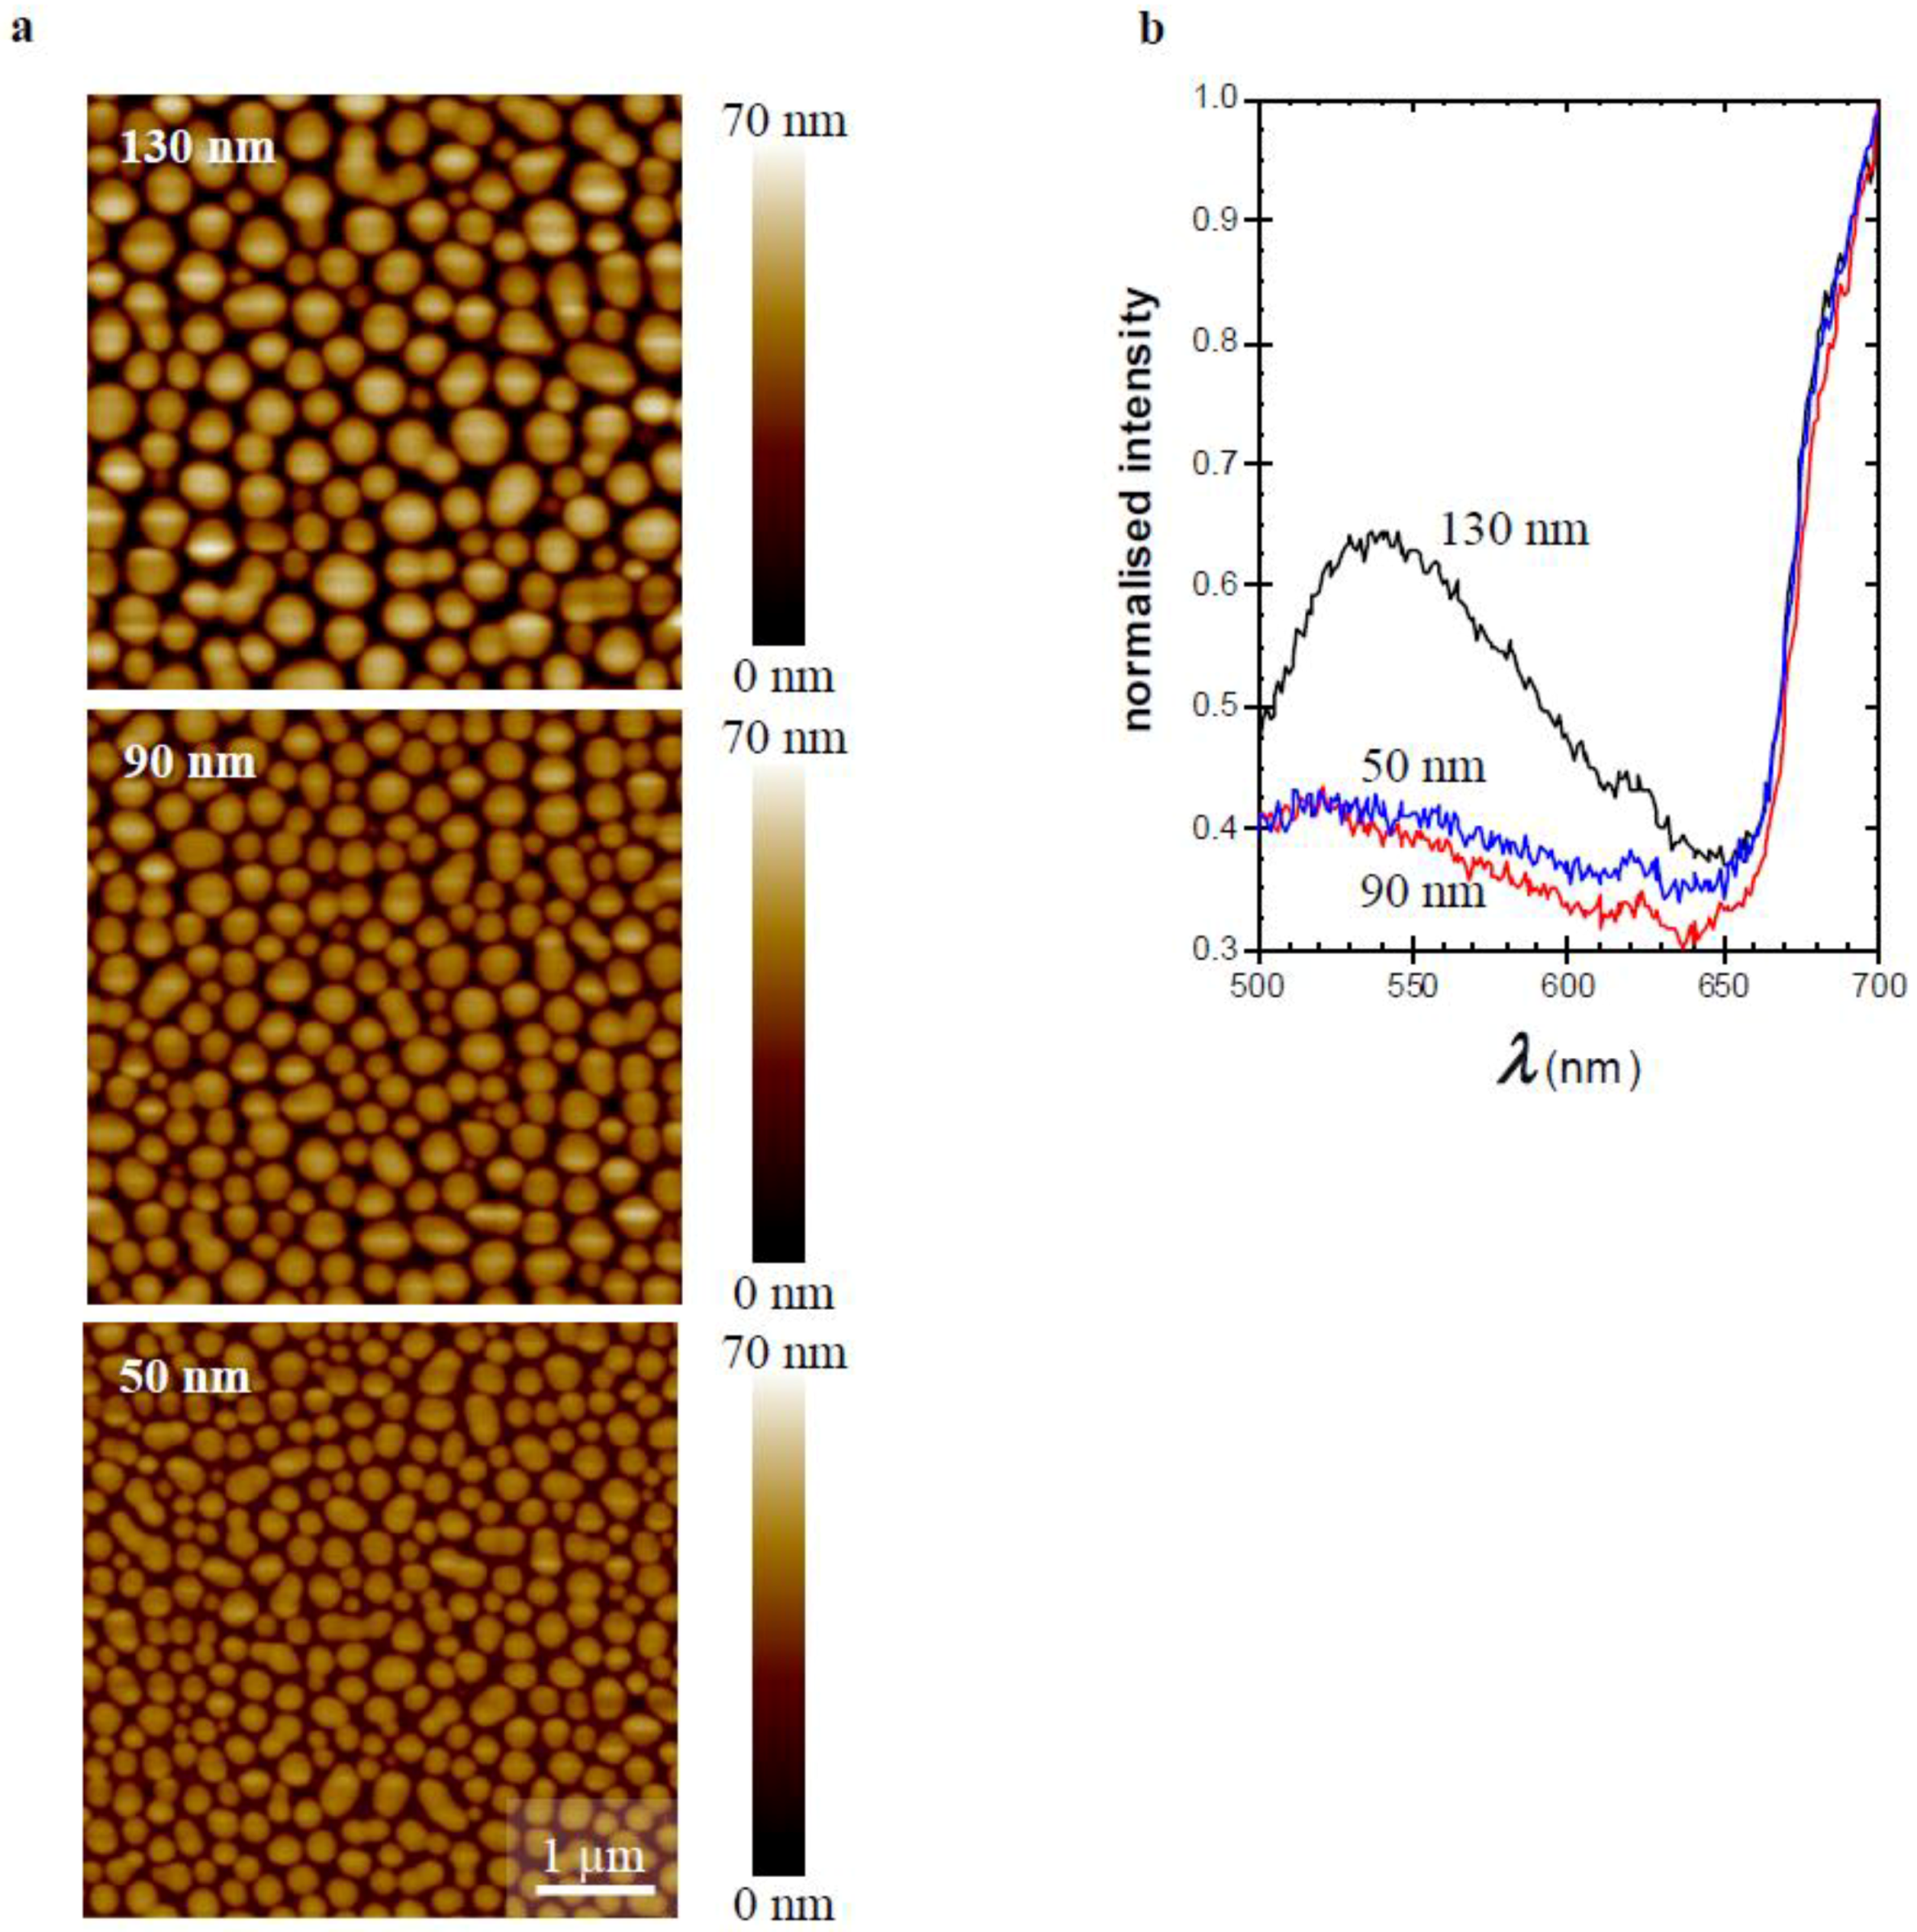
To further underpin this interpretation, films of the 1:3 TQ1:PC70BM blend with different thicknesses (50–130 nm) were prepared [15] by changing the spin-coating speed (Figure 4). Thicker films, resulting from slower spin-coating, demonstrated larger PC70BM-rich domains as shown in the AFM images (Figure 4a). The corresponding emission spectra (Figure 4b) show that when the film thickness is increased from 90 nm to 130 nm, the intensity of the emission band increases and the emission maximum shifts from 520 nm to about 540 nm. Decreasing the film thickness from 90 nm to 50 nm does not have a significant effect on the emission band. This confirms that the domains have to reach a certain size before the aggregate emission becomes detectable. These results follow the trends presented by Bäcke et al., where they analysed thermally-induced aggregation of PC60BM by transmission electron tomography in blend films of TQ1:PC60BM. They showed that the PC60BM crystals grow in size and that the PC60BM rich domains start to develop in the upper part of the blend film, yielding crystals in this upper part [34].
4. Conclusions
In this study we have investigated the relationship between the detailed emission spectra analysis of TQ1:PC70BM blends and the morphology of these blends. Solvents with lower PC70BM dissolution capacity as well as an increased PC70BM concentration yield larger phase-separated domains. In these larger domains, PC70BM aggregates are likely to be formed, resulting in a broad and rather weak emission between 520 nm and 550 nm upon excitation at 380 nm. For better PC70BM solvents and at lower PC70BM concentrations, the fullerene derivative stays well-mixed with the polymer and no emission between 500 nm and 550 nm is detected. Further investigation by, e.g., high-resolution microscopy techniques is needed to determine the sizes and locations of these aggregates.
As aggregation of the components in the active layer of an organic solar cell is one of the major degradation paths, leading to a large drop in device efficiency, there is a need to detect and quantify this phenomenon. The methods used to measure aggregation in thin blend films are often both time-consuming and expensive. We have shown that fluorescence spectroscopy offers an easy and fast tool for this purpose, in comparison with other methods. More experimental work has to be done in order to further develop this method.
Author Contributions
Experimental work and measurements, C.L.; all authors share the responsibility of all other parts of this communication.
Funding
J.v.S. acknowledges the funding from the Swedish National Space Agency under contracts 148/16 and 185/17. E.M. acknowledges the Göran Gustafsson Foundation for Research in Natural Sciences and Medicine. J.v.S. and E.M. acknowledge the funding from the Knut and Alice Wallenberg foundation under contract 2016.0059.
Acknowledgments
The authors acknowledge Ergang Wang (Chalmers University of Technology, Gothenburg, Sweden) for providing TQ1. Rickard Hansson, Leif Ericsson, and Mikael Andersén (Karlstad University) are acknowledged for valuable discussions and technical support. In addition, Bo Albinsson (Chalmers University of Technology) is acknowledged for making his SPEX fluorimeter available for troubleshooting.
Conflicts of Interest
The authors declare no conflict of interest.
References
- Zhao, W.; Li, S.; Yao, H.; Zhang, S.; Zhang, Y.; Yang, B.; Hou, J. Molecular Optimization Enables over 13% Efficience in Organic Solar Cells. J. Am. Chem. Soc. 2017, 139, 7148–7151. [Google Scholar] [CrossRef] [PubMed]
- Li, S.; Ye, L.; Zhao, W.; Yan, H.; Yang, B.; Liu, D.; Li, W.; Ade, H.; Hou, J. A Wide Bandgap Polymer with a Deep Highest Occupied Molecular Orbital Level Enables 14.2% Efficiency in Polymer Solar Cells. J. Am. Chem. Soc. 2018, 140, 7159–7167. [Google Scholar] [CrossRef] [PubMed]
- Meng, L.; Zhang, Y.; Wan, X.; Li, C.; Zhang, X.; Wang, Y.; Ke, X.; Xiao, Z.; Ding, L.; Xia, R.; et al. Organic and solution-processed tandem solar cells with 17.3% efficiency. Science 2018, 361, 1094–1098. [Google Scholar] [CrossRef] [PubMed]
- Ma, W.; Yang, C.; Gong, X.; Lee, K.; Heeger, A.J. Thermally Stable, Efficient Polymer Solar Cells with Nanoscale Control of the Interpenetrating Network Morphology. Adv. Funct. Mater. 2005, 15, 1617–1622. [Google Scholar] [CrossRef]
- Bergqvist, J.; Lindqvist, C.; Bäcke, O.; Ma, Z.; Tang, Z.; Tress, W.; Gustafsson, S.; Wang, E.; Olsson, E.; Andersson, M.R.; et al. Sub-glass transition annealing enhances polymer solar cell performance. J. Mater. Chem. A 2014, 2, 6046–6152. [Google Scholar] [CrossRef]
- Morvillo, P.; Bobeico, E.; Esposito, S.; Diana, R. Effect of the active layer thickness on the device performance of polymer solar cells having [60]PCBM and [70]PCBM as electron acceptor. Energy Procedia 2012, 31, 69–73. [Google Scholar] [CrossRef]
- Bruno, A.; Villani, F.; Grimaldi, I.A.; Loffredo, F.; Morvillo, P.; Diana, R.; Haque, S.; Minarini, C. Morphological and spectroscopic characterizations of inkjet-printed poly(3-hexylthiophene-2,5-diyl): Phenyl-C61-butyric acid methyl ester blends for organic solar cell applications. Thin Solid Films 2014, 560, 14–19. [Google Scholar] [CrossRef]
- Morvillo, P.; Ricciardi, R.; Nenna, G.; Bobeico, E.; Diana, R.; Minarini, C. Elucidating the origin of the improved current output in inverted polymer solar cells. Sol. Energy Mater. Sol. Cells 2016, 152, 51–58. [Google Scholar] [CrossRef]
- Lee, H.; Park, C.; Sin, D.H.; Park, J.H.; Cho, K. Recent Advances in Morphology Optimization for Organic Photovoltaics. Adv. Mater. 2018, 30, 1800453. [Google Scholar] [CrossRef] [PubMed]
- Hansson, R.; Ericsson, L.K.E.; Holmes, N.P.; Rysz, J.; Opitz, A.; Campoy-Quiles, M.; Wang, E.; Barr, M.G.; Kilcoyne, A.L.D.; Zhou, X.; et al. Vertical and lateral morphology effects on solar cell performance for a thiophene–quinoxaline copolymer:PC70BM blend. J. Mater. Chem. A 2015, 3, 6970–6979. [Google Scholar] [CrossRef]
- Voigt, M.; Chappell, J.; Rowson, T.; Cadby, A.; Geoghegan, M.; Jones, R.A.L.; Lidzey, D.G. The interplay between the optical and electronic properties of light-emitting-diode applicable conjugated polymer blends and their phase-separated morphology. Org. Electron. 2005, 6, 35–45. [Google Scholar] [CrossRef]
- Nilsson, S.; Bernasik, A.; Budkowski, A.; Moons, E. Morphology and Phase Segregation of Spin-Casted Films of Polyfluorene/PCBM Blends. Macromolecules 2007, 40, 8291–8301. [Google Scholar] [CrossRef]
- Ma, Z.; Wang, E.; Vandewal, K.; Andersson, M.R.; Zhang, F. Enhance performance of organic solar cells based on an isoindigo-based copolymer by balancing absorption and miscibility of electron acceptor. Appl. Phys. Lett. 2011, 99, 143302. [Google Scholar] [CrossRef] [Green Version]
- Kouijzer, S.; Michels, J.J.; van den Berg, M.; Gevaerts, V.S.; Turbiez, M.; Wienk, M.M.; Janssen, R.A.J. Predicting Morphologies of Solution Processed Polymer:Fullerene Blends. J. Am. Chem. Soc. 2013, 135, 12057–12067. [Google Scholar] [CrossRef] [PubMed]
- van Franeker, J.J.; Westhoff, D.; Turbiez, M.; Wienk, M.M.; Schmidt, V.; Janssen, R.A.J. Controlling the Dominant Length Scale of Liquid–Liquid Phase Separation in Spin-coated Organic Semiconductor Films. Adv. Funct. Mater. 2015, 25, 855–863. [Google Scholar] [CrossRef]
- Shaheen, S.E.; Brabec, C.J.; Sariciftci, N.S.; Padinger, F.; Fromherz, T.; Hummelen, J.C. 2.5% efficient organic plastic solar cells. Appl. Phys. Lett. 2001, 78, 841–843. [Google Scholar] [CrossRef] [Green Version]
- Rispens, M.T.; Meetsma, A.; Rittberger, R.; Brabec, C.J.; Sariciftci, N.S.; Hummelen, J.C. Influence of the solvent on the crystal structure of PCBM and the efficiency of MDMO-PPV:PCBM ‘plastic’ solar cells. Chem. Commun. 2003, 2116–2118. [Google Scholar] [CrossRef]
- Martens, T.; D’Haen, J.; Munters, T.; Beelen, Z.; Goris, L.; Manca, J.; D’Olieslaeger, M.; Vanderzande, D.; De Schepper, L.; Andriessen, R. Disclosure of the nanostructure of MDMO-PPV:PCBM bulk hetero-junction organic solar cells by a combination of SPM and TEM. Synth. Met. 2003, 138, 243–247. [Google Scholar] [CrossRef]
- Yang, X.; van Duren, J.K.J.; Janssen, R.A.J.; Michels, M.A.J.; Loos, J. Morphology and Thermal Stability of the Active Layer in Poly(p-phenylenevinylene)/Methanofullerene Plastic Photovoltaic Devices. Macromolecules 2004, 37, 2151–2158. [Google Scholar] [CrossRef]
- Wang, E.; Hou, L.; Wang, Z.; Hellström, S.; Zhang, F.; Inganäs, O.; Andersson, M.R. An Easily Synthesized Blue Polymer for High-Performance Polymer Solar Cells. Adv. Mater. 2010, 22, 5240–5244. [Google Scholar] [CrossRef] [PubMed]
- van Stam, J.; Hansson, R.; Lindqvist, C.; Ericsson, L.; Moons, M. Fluorescence spectroscopy studies on polymer blend solutions and films for photovoltaics. Colloid Surf. A Physicochem. Eng. Asp. 2015, 483, 292–296. [Google Scholar] [CrossRef]
- van Stam, J.; Lindqvist, C.; Hansson, R.; Ericsson, L.; Moons, E. Fluorescence and UV/VIS absorption spectroscopy studies on polymer blend films for photovoltaics. Proc. SPIE 2015, 9549, 95490L. [Google Scholar] [CrossRef]
- Kim, Y.; Yeom, H.R.; Kim, J.Y.; Yang, C. High-efficiency polymer solar cells with a cost-effective quinoxaline polymer through nanoscale morphology control induced by practical processing additives. Energy Environ. Sci. 2013, 6, 1909–1916. [Google Scholar] [CrossRef] [Green Version]
- van Stam, J.; Van fraeyenhoven, P.; Andersén, M.; Moons, E. Comparing Morphology in Dip-Coated and Spin-Coated Polyfluorene: Fullerene Films. Proc. SPIE 2016, 9942, 99420D. [Google Scholar] [CrossRef]
- van Stam, J.; Ericsson, L.; Deribew, D.; Moons, E. Morphology in Dip-Coated Blend Films for Photovoltaics Studied by UV/VIS Absorption and Fluorescence Spectroscopy. Proc. SPIE 2018, 10687, 10687A. [Google Scholar] [CrossRef]
- Kern, W.; Puotinen, D.A. Cleaning Solutions Based on Hydrogen Peroxide for Use in Silicon Semiconductor Technology. RCA Rev. 1970, 31, 187–206. [Google Scholar]
- Kern, W. The Evolution of Silicon Wafer Cleaning Technology. J. Electochem. Soc. 1990, 137, 1887–1892. [Google Scholar] [CrossRef] [Green Version]
- Kissinger, G.; Kissinger, W. Hydrophilicity of Silicon Wafers for Direct Bonding. Phys. Stat. Sol. 1991, 123, 185–192. [Google Scholar] [CrossRef]
- Shiu, W.-Y.; Ma, K.-C. Temperature Dependence of Physical–Chemical Properties of Selected Chemicals of Environmental Interest. II. Chlorobenzenes, Polychlorinated Biphenyls, Polychlorinated Dibenzo-p-dioxins, and Dibenzofurans. J. Phys. Chem. Ref. Data 2000, 29, 387–462. [Google Scholar] [CrossRef]
- Boublik, T.; Fried, V.; Hala, E. The Vapour Pressures of Pure Substances, 2nd ed.; Elsevier: Amsterdam, The Netherlands, 1984. [Google Scholar]
- Cook, S.; Ohkita, H.; Kim, Y.; Benson-Smith, J.J.; Bradley, D.D.C.; Durrant, J.R. A photophysical study of PCBM thin films. Chem. Phys. Lett. 2007, 445, 276–280. [Google Scholar] [CrossRef]
- Jamieson, F.C.; Domingo, E.B.; McCarthy-Ward, T.; Heeney, M.; Stingelin, N.; Durrant, J.R. Fullerene crystallisation as a key driver of charge separation in polymer/fullerene bulk heterojunction solar cells. Chem. Sci. 2012, 3, 485–492. [Google Scholar] [CrossRef]
- Yang, X.; van Duren, J.K.J.; Rispens, M.T.; Hummelen, J.C.; Janssen, R.A.J.; Michels, M.A.J.; Loos, J. Crystalline Organization of a Methanofullerene as Used for Plastic Solar-Cell Applications. Adv. Mater. 2004, 16, 802–806. [Google Scholar] [CrossRef]
- Bräcke, O.; Lindqvist, C.; Diaz de Zerio Mendaza, A.; Gustafsson, S.; Wang, E.; Andersson, M.R.; Müller, C.; Olsson, E. Mapping fullerene crystallization in a photovoltaic blend: An electron tomography study. Nanoscale 2015, 7, 8451–8456. [Google Scholar] [CrossRef] [PubMed]
Figure 1.
Chemical structure of a quinoxaline-based donor polymer (TQ1) and a [6,6]-phenyl-C71-butyric acid methyl ester (PC70BM).
Figure 1.
Chemical structure of a quinoxaline-based donor polymer (TQ1) and a [6,6]-phenyl-C71-butyric acid methyl ester (PC70BM).

Figure 2.
Atomic force microscopy (AFM) micrographs (5 × 5 µm) of thin films of 1:1 TQ1:PC70BM (a–c) and 1:3 TQ1:PC70BM (d–f) spin-coated from chloroform (CF) (a,d), chlorobenzene (CB) (b,e), and ortho-dichlorobenzene (oDCB) (c,f). Scale bar indicates 1 µm. Surface roughness (RMS), as well as the corresponding height scale, is added to each image.

Figure 3.
Fluorescence emission spectra of thin films measured with excitation wavelength (λex) = 380 nm of (a) 1:1 (black) and 1:3 (red) TQ1:PC70BM spin-coated from CF (b) 1:3 TQ1:PC70BM spin-coated from CF (red), CB (black), and oDCB (blue).
Figure 3.
Fluorescence emission spectra of thin films measured with excitation wavelength (λex) = 380 nm of (a) 1:1 (black) and 1:3 (red) TQ1:PC70BM spin-coated from CF (b) 1:3 TQ1:PC70BM spin-coated from CF (red), CB (black), and oDCB (blue).

Figure 4.
(a) AFM micrographs (5 × 5 µm) of thin films of 1:3 TQ1:PC70BM spin-coated from CB with the indicated film thicknesses. A height scale is added to each image. (b) Corresponding fluorescence emission spectra for films with indicated thicknesses.
Figure 4.
(a) AFM micrographs (5 × 5 µm) of thin films of 1:3 TQ1:PC70BM spin-coated from CB with the indicated film thicknesses. A height scale is added to each image. (b) Corresponding fluorescence emission spectra for films with indicated thicknesses.

© 2018 by the authors. Licensee MDPI, Basel, Switzerland. This article is an open access article distributed under the terms and conditions of the Creative Commons Attribution (CC BY) license (http://creativecommons.org/licenses/by/4.0/).
Share and Cite
MDPI and ACS Style
Lindqvist, C.; Moons, E.; Van Stam, J. Fullerene Aggregation in Thin Films of Polymer Blends for Solar Cell Applications. Materials 2018, 11, 2068. https://doi.org/10.3390/ma11112068
AMA Style
Lindqvist C, Moons E, Van Stam J. Fullerene Aggregation in Thin Films of Polymer Blends for Solar Cell Applications. Materials. 2018; 11(11):2068. https://doi.org/10.3390/ma11112068
Chicago/Turabian StyleLindqvist, Camilla, Ellen Moons, and Jan Van Stam. 2018. "Fullerene Aggregation in Thin Films of Polymer Blends for Solar Cell Applications" Materials 11, no. 11: 2068. https://doi.org/10.3390/ma11112068
Note that from the first issue of 2016, this journal uses article numbers instead of page numbers. See further details here.