Article

Comparison of Microstructure and Properties of In-Situ TiN- and WC-Reinforced NiCrBSi Composite Coatings Prepared by Plasma Spraying

1
Tianjin Key Laboratory of Materials Laminating Fabrication and Interface Control Technology, School of Materials Science and Engineering, Hebei University of Technology, Tianjin 300130, China
2
Department of Chemistry and Materials Engineering, University of Alberta, Edmonton, AB T6G 2L5, Canada
*
Author to whom correspondence should be addressed.
Materials 2018, 11(11), 2182; https://doi.org/10.3390/ma11112182
Submission received: 15 October 2018 / Revised: 31 October 2018 / Accepted: 1 November 2018 / Published: 4 November 2018

Abstract

:
In this study, NiCrBSi-30 wt.% TiN composite (NTC) coating was produced on carbon steel via plasma spraying, with NiCrBSi-30 wt.% WC composite (NWC) coating as the comparison object. The microstructure and phase constituents of the composite coatings were characterized using scanning electron microscopy (SEM) coupled with energy dispersive spectroscopy (EDS) techniques, transmission electron microscopy (TEM) and x-ray diffraction (XRD). Atomic force microscopy (AFM) was used to measure electronic work functions. The microhardness and wear performance of coatings were also investigated. The average microhardness of the NTC and NWC coatings was 1000 HV and 850 HV, respectively. In addition, the NTC coating had a wear volume loss of 0.8118 mm3, less than 1.4772 mm3, the volume loss of the NWC coating. This was due to the presence of TiN in the form of nanograins in the composite coating and tighter binding to the matrix.

Graphical Abstract

1. Introduction

Plasma spraying technology is widely used in industrial production to prepare various protective coatings [1,2]. These coatings, attached to mechanical component surfaces, have high hardness and good abrasion and corrosion resistance, which can prevent the components from being severely worn and corroded and increase the machinery lifespan [3]. Typically, the materials used for plasma spraying are metal-based composites, which consist of a metal matrix with good toughness and reinforcing ceramic particles [4]. By integrating the toughness of the metal and the hardness of the ceramic particles, the wear resistance of composites is significantly improved. The most representative metal matrix composites are usually Ni-based or Co-based alloys containing SiC, TiC, WC, La2O3, or Cr3C2 [5,6,7,8]. Relatively speaking, Ni-based alloy powders have been widely studied and applied due to their excellent self-fluxing performance, wear resistance, and low price [9]. In addition, WC has high hardness and good wettability compared with other carbides (SiC, TiC) [10,11,12]. Therefore, most of the current research focuses on WC-strengthened Ni-based alloy coatings. Zhang et al.’s [13] research results showed that compared with NiCrBSi coating, the microhardness of NWC coating was significantly enhanced, and rolling contact fatigue performance was improved. Serresde’s [14] study also proved that the addition of WC enhanced the wear resistance of NiCrBSi coating. These studies show that adding WC to Ni-based alloys can improve the microstructure and hardness, as well as the wear resistance and rolling contact fatigue properties. However, the failure of the NWC coating is related to the intergranular cracks generated by the separation of WC/W2C and Ni-based matrix crystals. These cracks are due to the thermal stress caused by the rapid cooling and mismatch of the thermal expansion coefficient of the WC phase with the matrix phase [15]. In addition, some WC phases decarburize to form lower-hardness W2C due to overheating by thermal spraying jets, and further decarburization forms a softer W phase, resulting in lower hardness of the coating [16]. Therefore, this will restrict its potential application in the engineering field.
Except for the above-mentioned reinforcing phase particles, TiN has been widely used for the enhancement of coatings for its high hardness, wear resistance, and good corrosion resistance [17,18,19]. Previous studies prepared NiCrBSi-TiN composite coating by mechanically mixing Ni-based powders with TiN powders as raw coating materials, in which TiN was decomposed due to the high temperature. In addition, it is difficult to deposit TiN coating using TiN powders because of its high melting point (2950 K) [20]. In this experiment, the NTC coating was formed by spraying Ti and NiCrBSi powders, in which TiN-reinforced particles were formed by in situ reaction of titanium powder and nitrogen [19,20,21]. The TiN particles in the composite coating are in a fully molten state and bond well with the matrix to avoid pyrolysis during the spraying process [17,18]. This work characterized the microstructures and mechanical properties of the NTC coating, and compared it with the NWC coating.

2. Experimental Procedure

2.1. Sample Preparation

In this investigation, NiCrBSi and Ti powders as feed-stock materials for preparing NiCrBSi–TiN composite (NTC) coating were commercially available from Beijing Xing Rong Yuan Technology Corporation of China. The two kinds of powders were mixed in a ball mill for half an hour at a weight ratio of 7:3. NiCrBSi-WC/Co powder was available on the market. Figure 1 shows the morphology of the two kinds of composite powder. The size of NiCrBSi powder with spherical shape was about 45–100 μm. Its chemical composition is presented in Table 1. The Ti powder had irregular shapes, and the WC particles had a spherical shape but were rough, with particle sizes in the range of 25–45 μm, as shown in Figure 1b. AISI1045 steel (0.42–0.50% C, 0.17–0.37% Si, 0.50–0.80% Mn, ≤0.25% Cr, and the balance Fe) with a size of 10 × 10 × 12 mm3 was used as substrate, and the surface of the substrate was roughened by alumina sandblasting before spraying.
A GP-80 type plasma spraying system (Yeyuan Spraying Corp., Taixing, China) was used to deposit coatings. Argon (purity: 99.9999%) was used as primary plasma gas, while nitrogen (purity: 99.99%) was used as powder carrier gas. The thicknesses of the two composite coatings were controlled between 250 and 270 μm. A NiCrBSi bonding bottom layer was also prepared with a thickness of 50–80 μm.

2.2. Coating Characterization

Scanning electron microscopy (SEM; Hitachi S-4800/TMP, Hitach Ltd., Tokyo, Japan) was used to observe the microstructure and wear morphology, while energy dispersive spectroscopy (EDS; EDAX-AMETEK, Hitach Ltd., Tokyo, Japan) was applied to analyze the composition and distribution of the elements. The phase composition of the coating was identified by a D8 x-ray diffractometer (Bruker Scientific Technology Ltd., Karlsruhe, Germany). At room temperature, the interface morphology and electron work function (EWF) of the composite coatings were measured using a scanning Kelvin probe (SKP 5050, KP Technology Ltd., Wick, UK). The section microhardness of the coating was measured using an HMV-2T hardness tester (Shimadzu Ltd., Tokyo, Japan). The test parameters were as follows: 200 g load and 15 s dwell time.

2.3. Tribological Tests

At room temperature, tribological tests were performed with an SFT-2M tribometer (Zhongke Kaihua Technology Development Corp., Lanzhou, China). To ensure the reliability of the results, five specimens were tested for every test result, and the wear volume loss was averaged. Prior to testing, each specimen was ground and polished. The chosen counterpart was an Si3N4 ball with a diameter of 4 mm. Tribological experiments were performed using a load of 30 N, 400 rad/min sliding speed, rotation radius 3 mm, and duration 30 min. Wear volume was evaluated by using a Nano Indenter XP type mechanical performance microprobe (MTS Systems Corp., Eden Prairie, MN, USA) connected to a computer to measure the wear trace profile. Wear morphology was observed using scanning electron microscopy.

3. Results and Discussion

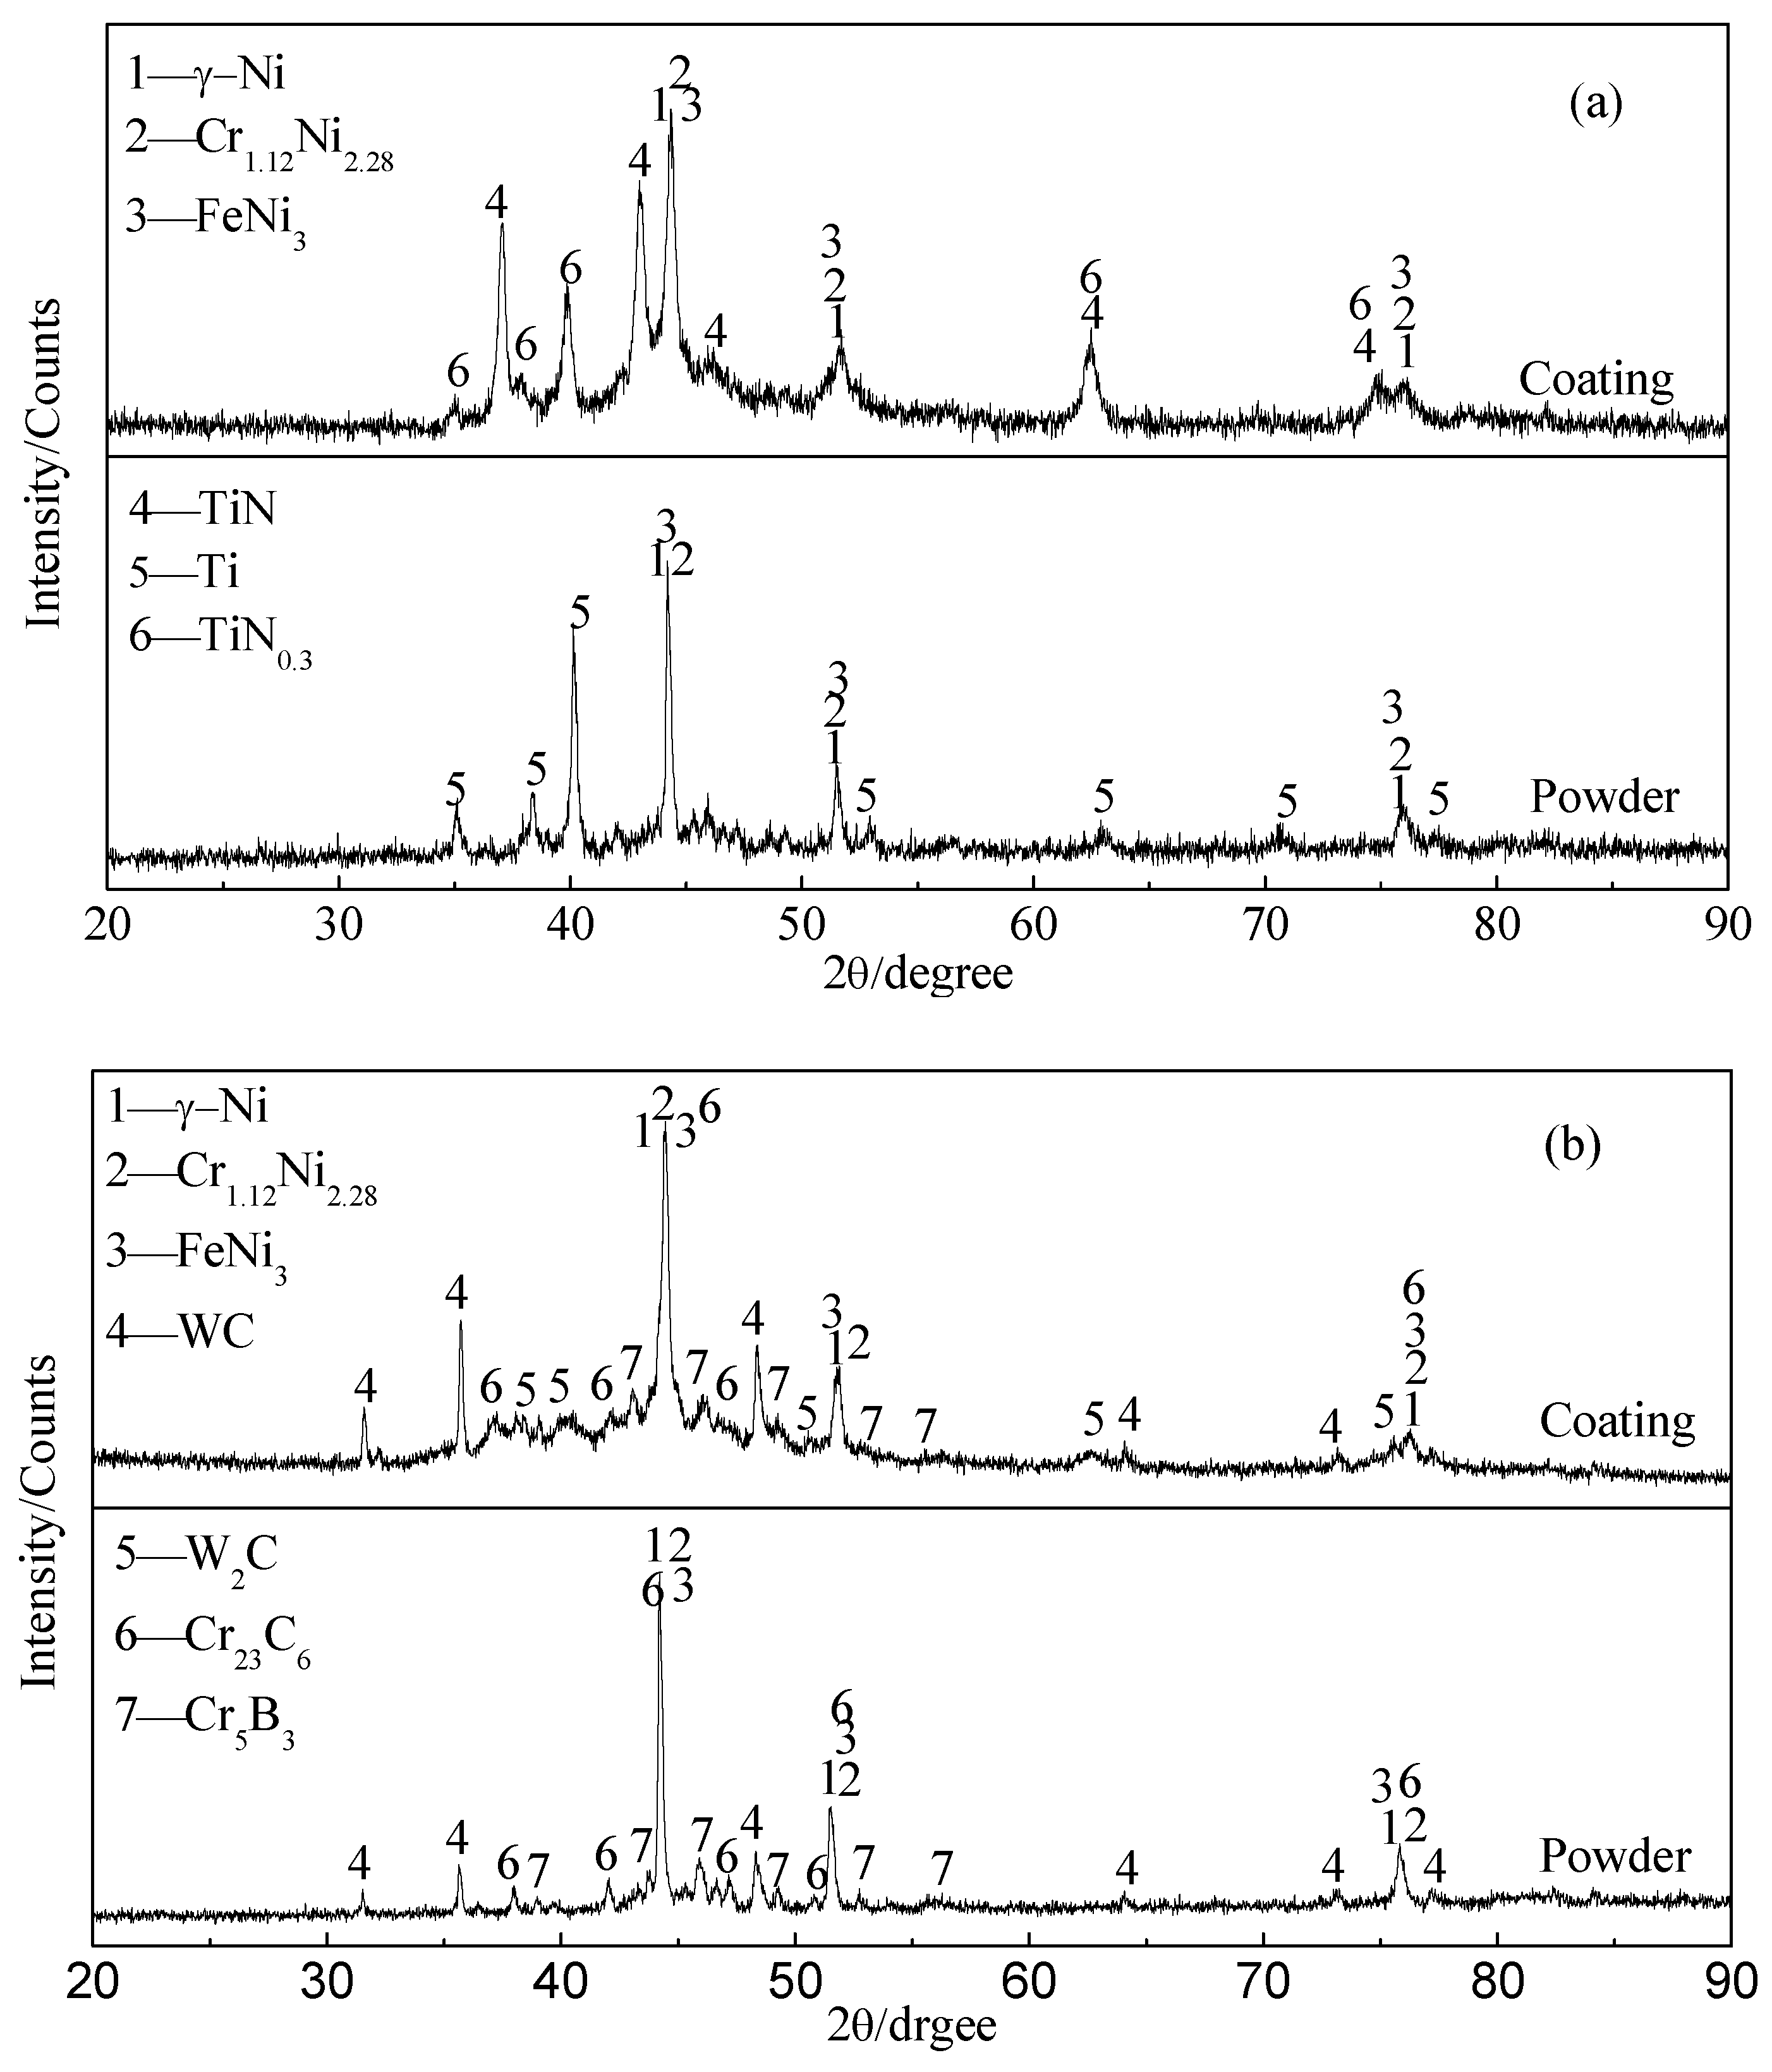
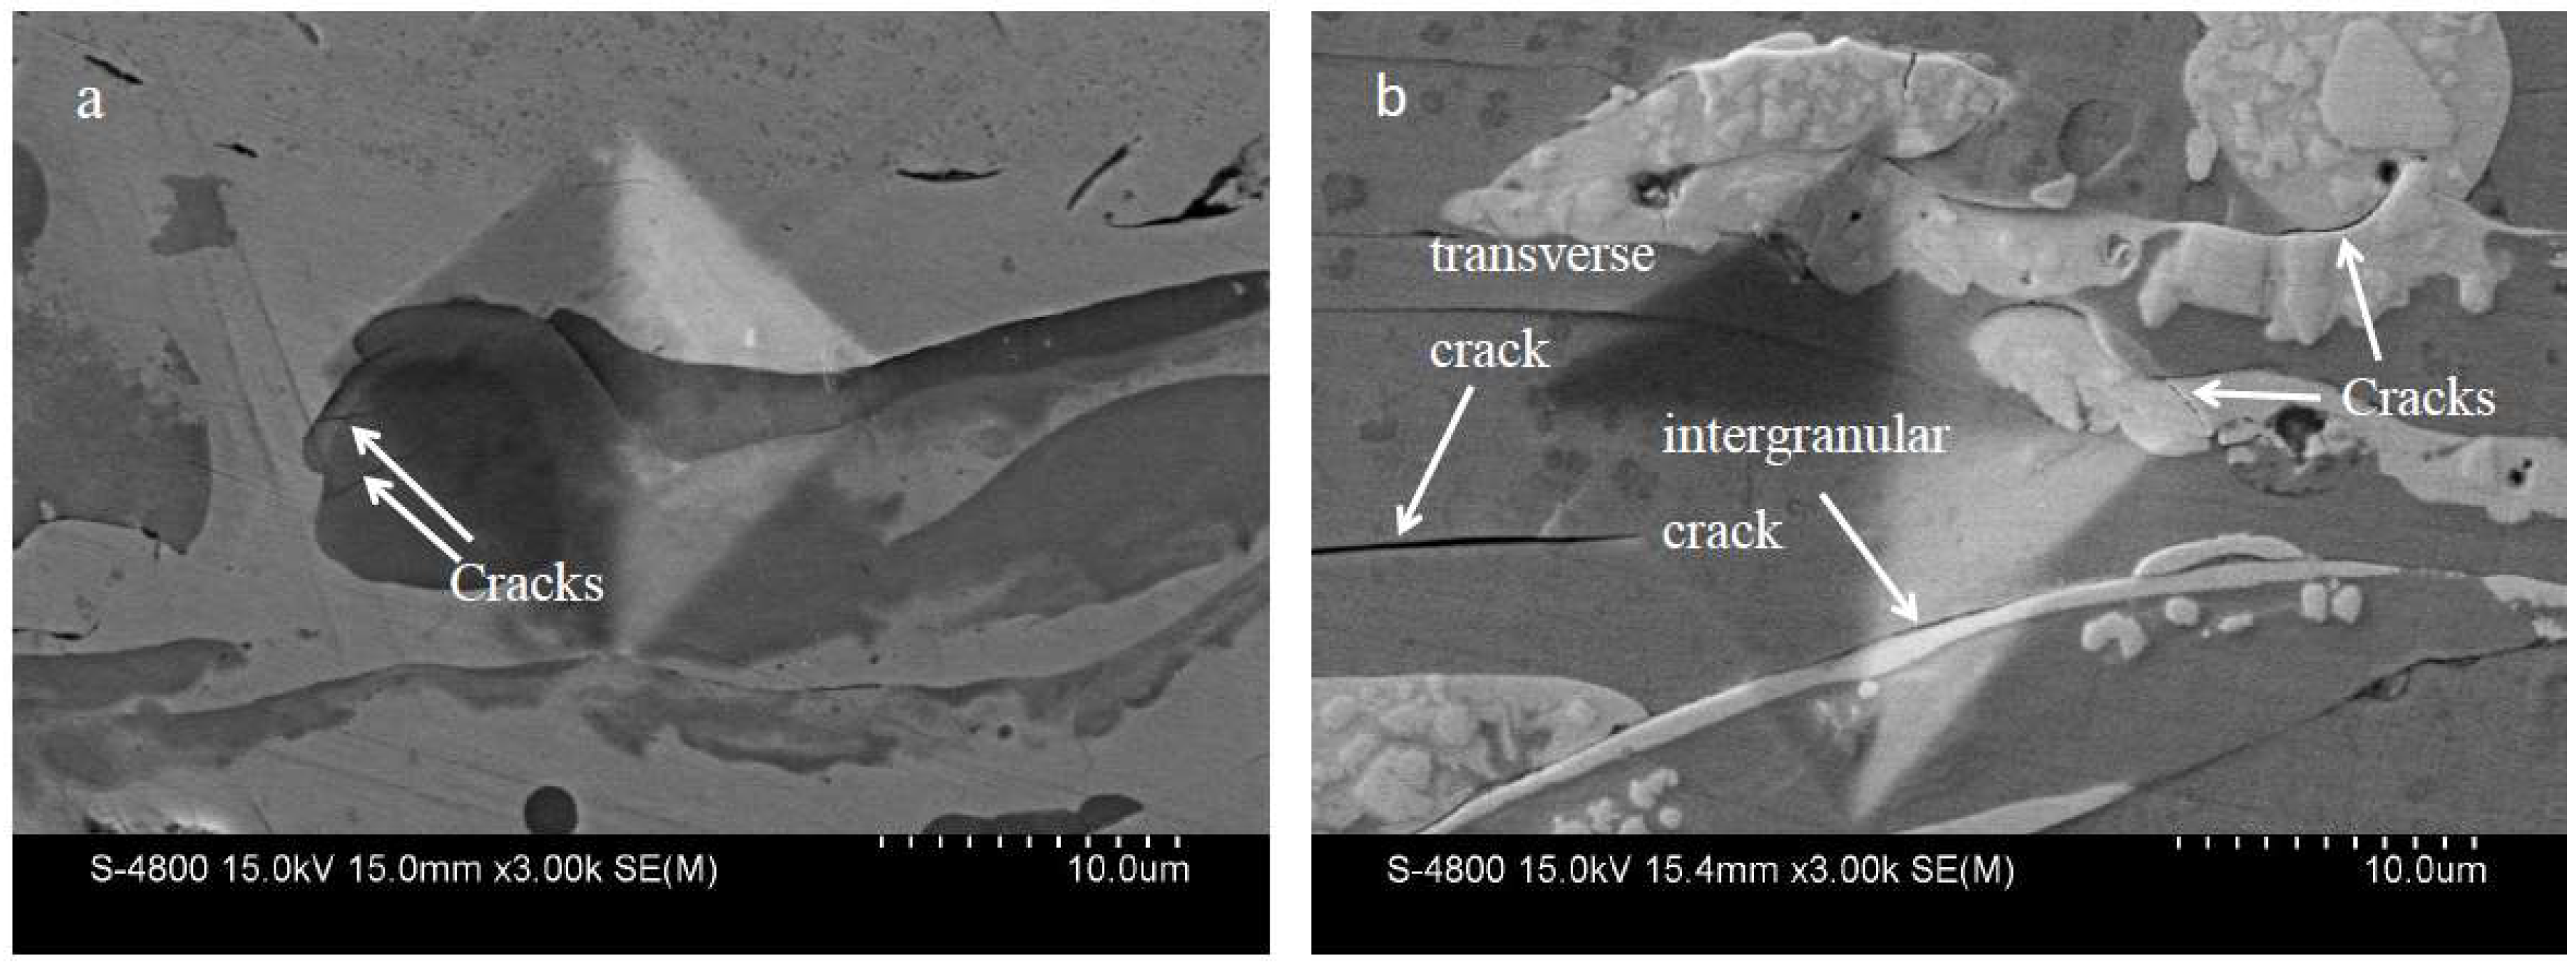
3.1. Microstructure Analysis

The x-ray diffraction patterns of starting NiCrBSi–Ti mixed powder (Figure 1a) and NiCrBSi–TiN composite (NTC) coating are shown in Figure 2a. The NTC coating was composed of γ-Ni (PDF# 65-0380), FeNi3 (PDF# 38-0419), Cr1.12Ni2.88 (PDF# 65-5559), TiN (PDF# 38-1420), and TiN0.3 (PDF# 41-1352). Among these phases, TiN and TiN0.3 appearing in coatings should be attributed to the in situ reaction between Ti powders and N2 in air and plasma gas [19,20]. Figure 2b shows the x-ray diffraction patterns of plasma spraying NiCrBSi–WC composite (NWC) coating and NiCrBSi–WC/Co mixed powder. Compared with powders, new peaks of W2C (peak 5, PDF# 65-3896) were observed in the NWC coating and some peaks of WC (PDF# 65-4539) disappeared. The WC decomposition temperature was about 1250 °C [12]. During plasma spraying, WC was decomposed into softer W2C due to the high temperature [16,22].
The cross-sectional structures of the NTC coating produced by plasma spraying are shown in Figure 3a,b. The NTC coating had the typical lamellar structure due to sprayed particles fully melting and flattening during plasma spraying [23]. The NTC coating displayed good bonding state, and no large cracks were observed. However, some small pores and irregular pits were observed. In addition, the deep-gray region (marked B) scattered throughout the light-gray region (marked A). Based on XRD (Figure 2a) and EDS (Table 2) analysis, the light-gray region was NiCrBSi alloy and the deep-gray region was composed of TiN and TiN0.3. The interface bonding state between the TiN and Ni-rich phase was very good and no cracks were observed. This is due to the fact that TiN is in a fully molten state during spraying and freezes together with NiCrBSi alloy powders, which is in molten state, too, promoting bonding with NiCrBSi alloy substrates [24]. This will also increase the strength of the coating while increasing the wear resistance.
Figure 3c,d shows the structure of NWC coating. Based on XRD (Figure 2b) and EDS (Table 2) analysis, the light-gray region (marked C in Figure 3d) shows the γ-Ni, FeNi3, and Cr1.12Ni2.88, while the white region (marked D in Figure 3d) shows the WC and W2C phases. The WC and W2C phases were evenly distributed in the NiCrBSi alloy matrix. There were lots of small pores and some cracks in the NWC coating. Transverse cracks were mainly distributed in the interface between the WC/W2C and Ni-rich phase; some cracks existed in the matrix areas. Figure 3d is an enlarged view of Figure 3c, in which the cracks between the WC/W2C phase and the Ni-rich phase can clearly be observed. The causes of crack formation are as follows: On the one hand, residual stress appeared due to rapid solidification and a thermal expansion mismatch between WC/W2C and Ni-rich phases. The thermal stress generated transverse interlaminar cracks [25]. On the other hand, WC has a high melting point and exhibits an unmelted or semimelted state in the coating, such that the bond between the WC/W2C and Ni-rich phase is reduced, resulting in crack formation. [26]. When the coating was stressed, WC was easily detached from the matrix, which influenced the mechanical properties of the coating.
Figure 4 shows SEM images of indentation morphology on cross-sections of two kinds of composite coatings. The indentation profile was clear and no big cracks that extended around were present in either coating. However, two fine cracks in the TiN phase were observed in the NTC coating and the WC/W2C phase also broke. This is because the TiN and WC/W2C were hard phases with poor toughness. Compared with the complete bonding of the TiN phase and the Ni-rich phase in the NTC coating, there was a significant crack between the WC/W2C and Ni-rich phases in the NWC coating. It was easily found that the bonding state of the Ti-rich phase and the Ni-rich phase was stronger than that of the WC/W2C and Ni-rich phases. The dimensions of indentation in Figure 4b are bigger than those in Figure 4a, showing that NTC coating had higher hardness than NWC coating.
The EWF test was also used to survey the NTC and NWC coatings. A higher work function usually corresponds to a stronger atomic bond, stronger interfacial bond, higher hardness, and resistance to wear [27,28]. The EWF and morphology maps are shown in Figure 5. The height difference of the TiN/TiN0.3 and Ni-rich phase was 340 nm in the NTC coating, and of the WC/W2C and Ni-rich phase was 240 nm in the NWC coating (Figure 5a,b). The height difference was due to the difference in grind resistance between the hard particles and the matrix phase. The matrix was the Ni-rich phase, and height differences can fully illustrate that the grind resistance of TiN in the NTC coating and WC in the NWC coating was different. According to experimental measurements, the TiN phase in this kind of composite coating has higher grind resistance than the WC/W2C phase. This is in excellent agreement with the wear test results. In addition, the NTC coating domain possesses higher EWF than the NWC coating (Figure 5e). This suggests that the NTC coating possesses higher hardness, stronger resistance to wear, and stronger atomic bond than the NWC coating [27,28]. This is likely due to TiN/TiN0.3 being formed by in situ reaction with high hardness and good combination with the matrix.
Figure 6 shows the TEM (Hitach Ltd., Tokyo, Japan) morphologies of the NTC coating. Figure 6a shows the interface between the Ti-rich phase and Ni-rich phase, and Figure 6b,c, respectively, show the EDS spectrum of the Ti-rich and Ni-rich areas in Figure 6a. The Ti-rich area and Ni-rich area were the TiN phase and Ni solid solution phase, respectively. The TiN phase and nickel-based solid solutions were tightly bonded together, and the Ti-rich phase was composed of elongated columnar grains with a diameter of about 100 nm. The completely melted Ti powder reacted in situ with nitrogen, and the resulting TiN/TiN0.3 nucleated and grew in the rich-Ni matrix during the spraying process. Therefore, the TiN/TiN0.3 was composed of nanosized crystal grains, which was explained in detail in our previous work [24,29]. However, WC particles exhibited a semimelted or unmelted state in the composite coating due to their high melting point, so that the WC retained its original micron-scale morphology.

3.2. Microhardness

Figure 7 shows the microhardness of the NTC and NWC coating cross-sections. The NTC coating had microhardness exceeding 1000 HV, while the NWC coating had microhardness of around 850 HV. Because the hardness of WC is higher than that of TiN, the hardness of the NWC coating should, theoretically, be higher than that of the NTC coating. As a matter of fact, the microhardness of the NTC coating was approximately 100 HV higher than that of the NWC coating. This is because WC decomposed to lower-hardness W2C during the spraying process, and the WC phase did not bond tightly with the matrix. The in situ reaction of TiN tightly binding with the matrix resulted in an enhanced strengthening effect in the coating. Another reason the hardness of TiN in composite coating was higher was that the TiN phase had a nanograin structure.
Simply evaluating the hardness of the composite coating by average hardness does not yield reliable results. The Weibull distribution is widely used with reliability analysis and discrete data processing. In this paper, the hardness of the composite coating was analyzed with a two-parameter Weibull distribution model. Figure 8 shows the confidence limit and the Weibull distribution plots of the Vickers microhardness of two composite coatings, where R represents the correlation coefficient between the measuring point and the regression line of the NTC and NWC coatings, and m is the slope of Weibull curve and represents the dispersion degree of microhardness [30]. The confidence limits of the NTC and NWC coatings are shown by black and red dashed lines, respectively. In general, the larger the slope of the Weibull curve, the higher the correlation coefficient and the better the correlation of the microhardness data.
Under a confidence level of 0.99, the values of R for the NTC and NWC coatings were 0.93 and 0.97, respectively. The values of b were 15.46 and 12.49, respectively. The microhardness of the NTC coating had a lower degree of dispersion than the NWC coating. Since all data points are in the confidence limits, the evaluation of the microhardness is reliable. Therefore, the microhardness of the NTC coating was superior to that of the NWC coating under an indentation load of 200 g.

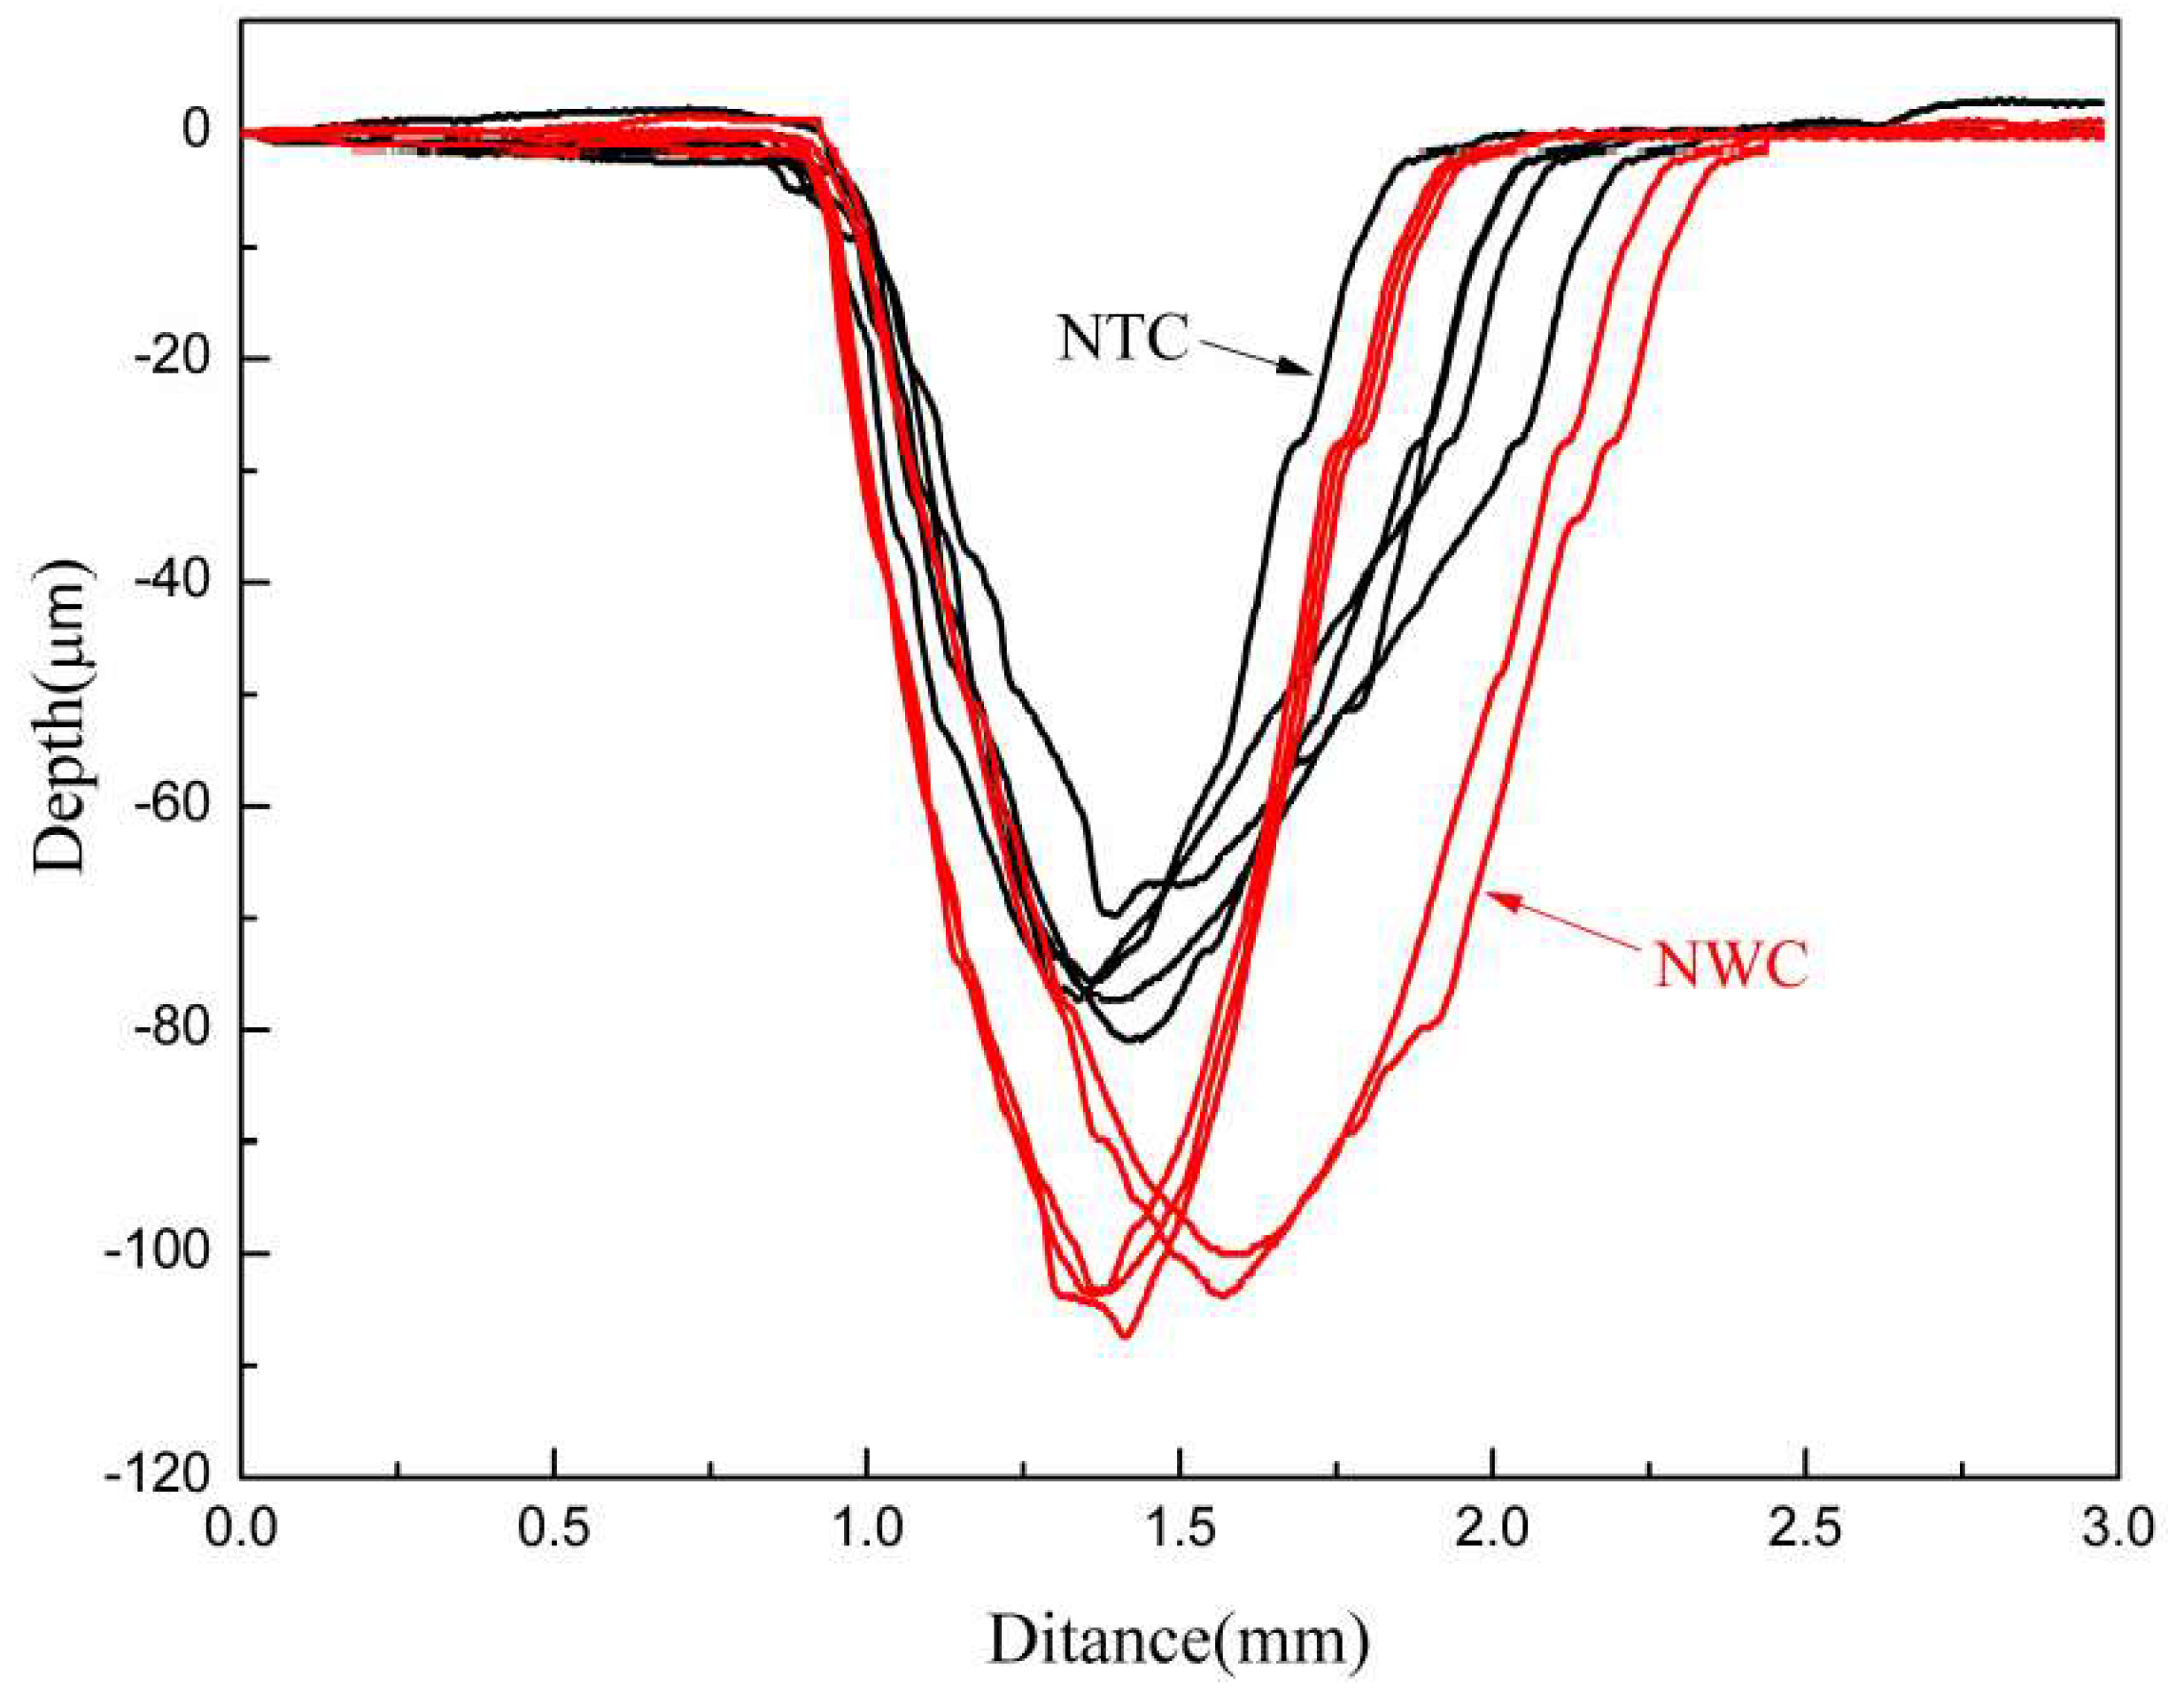
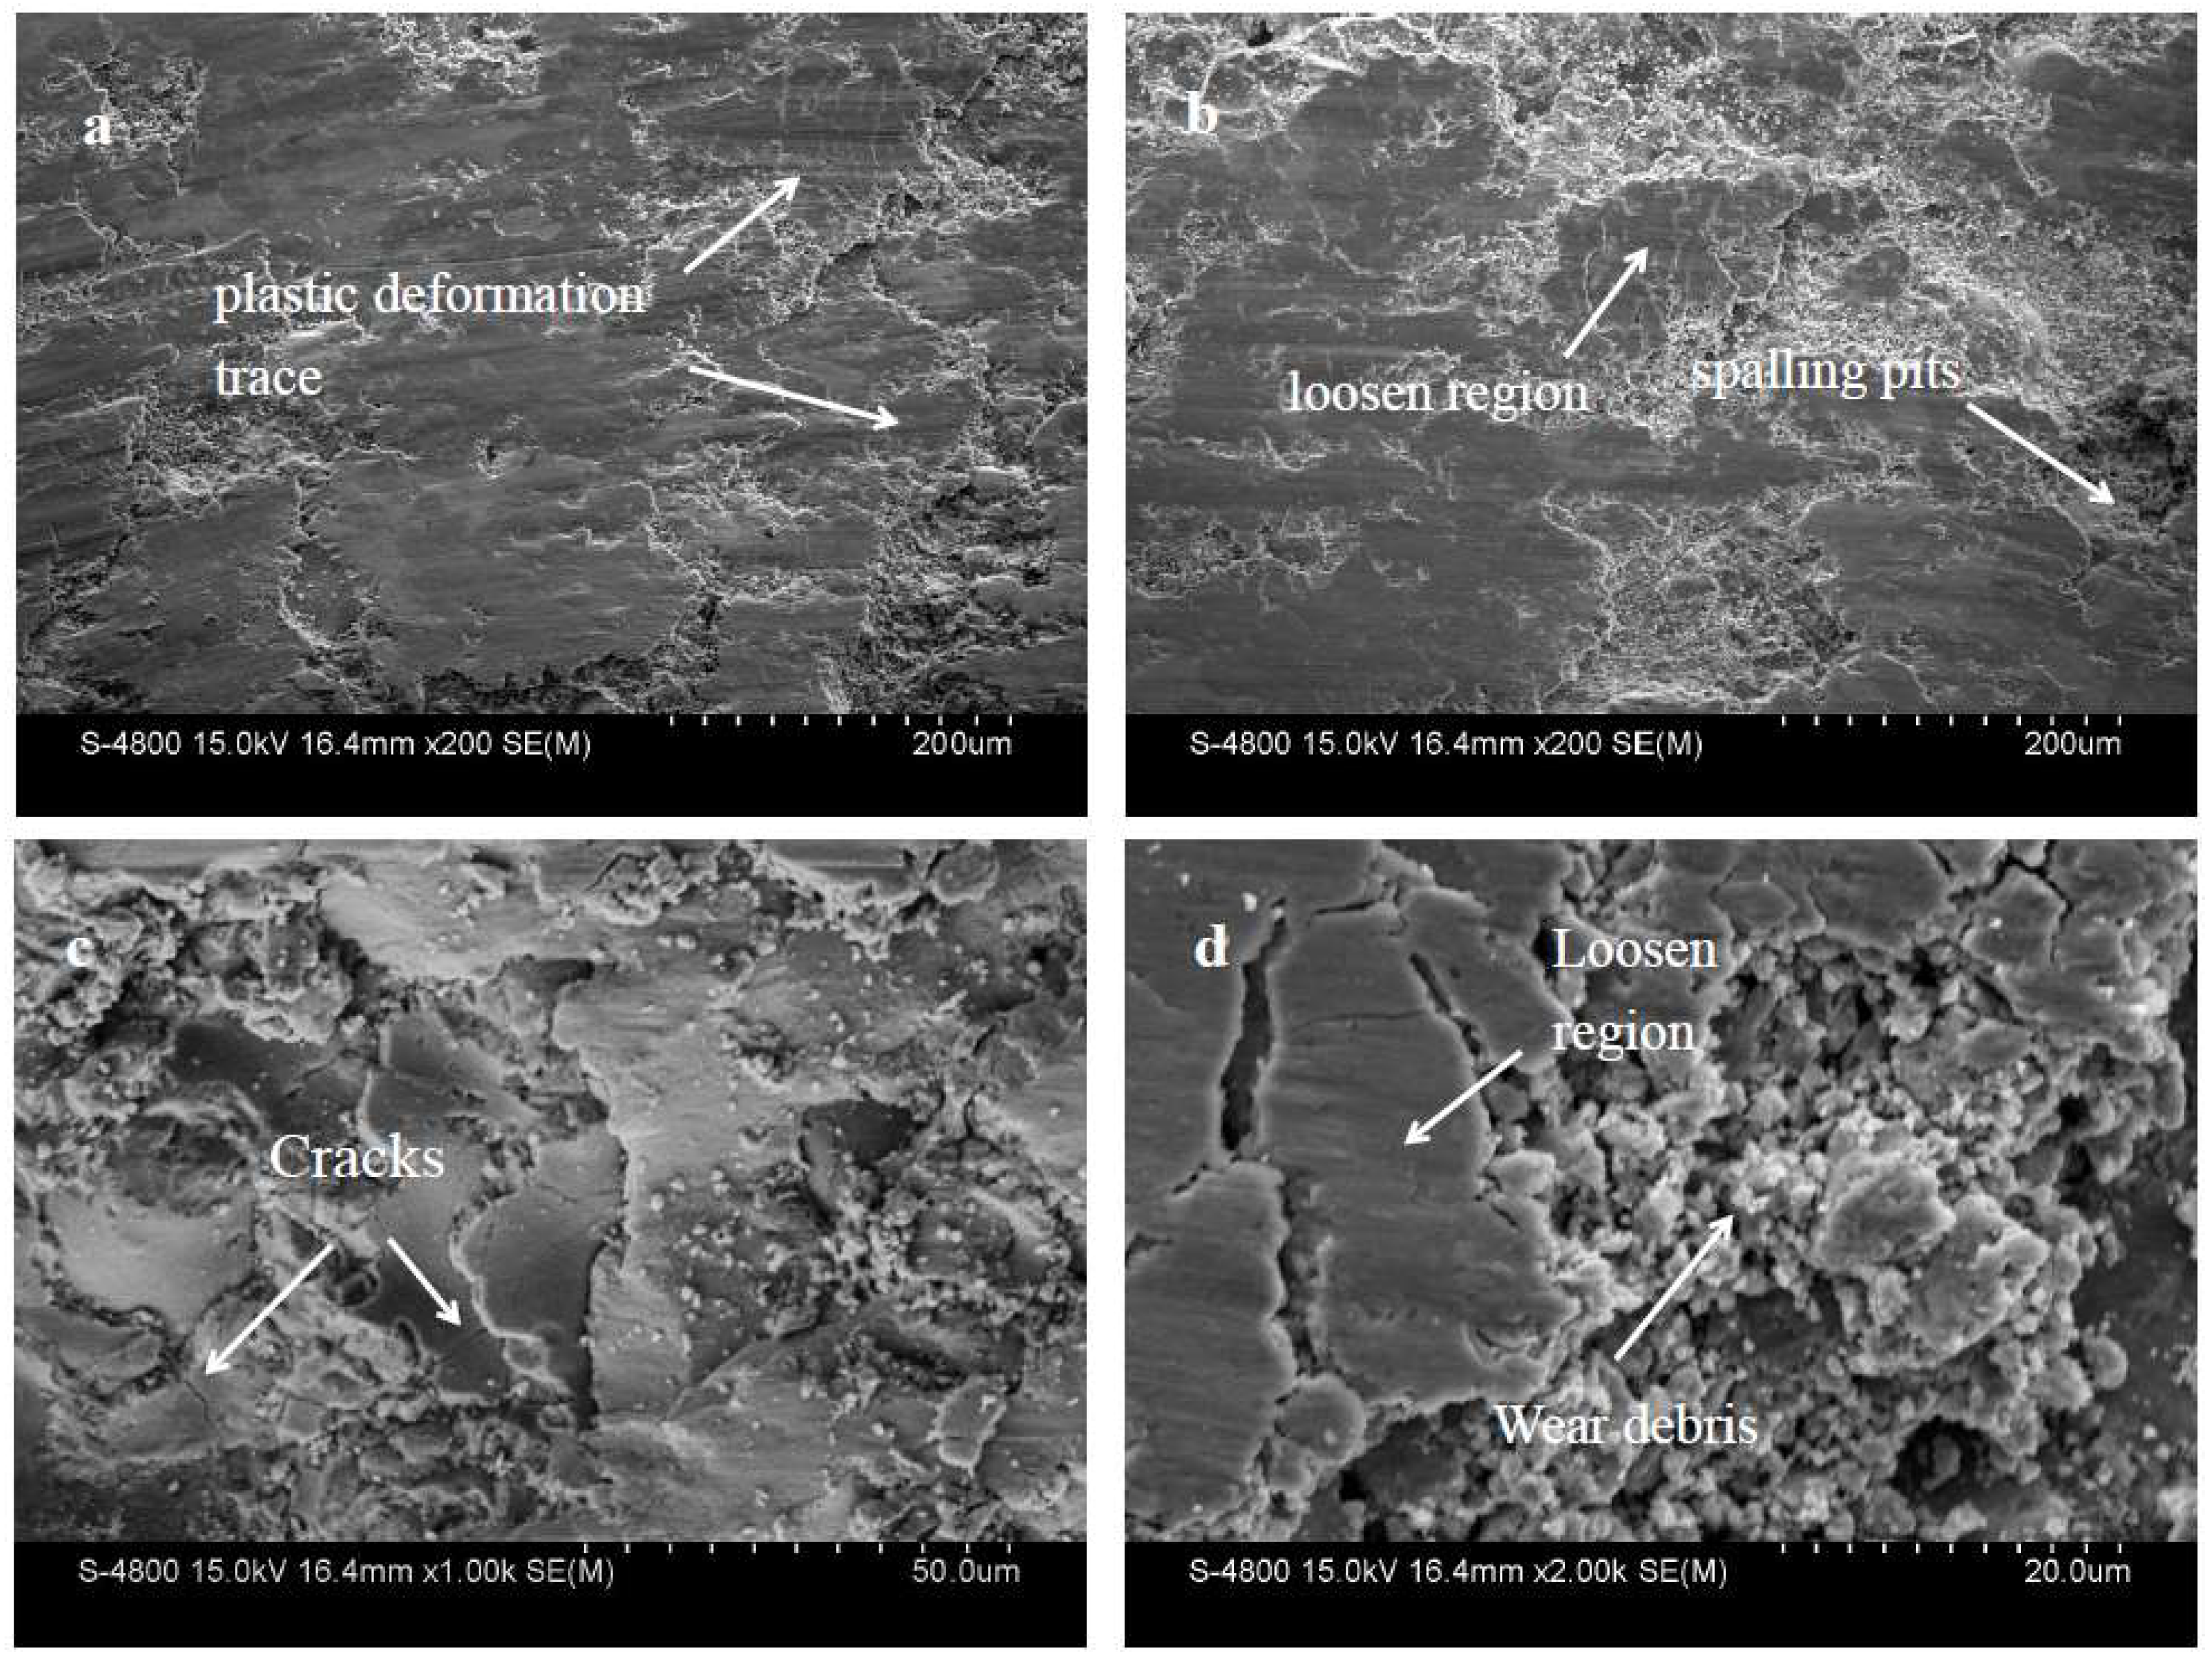
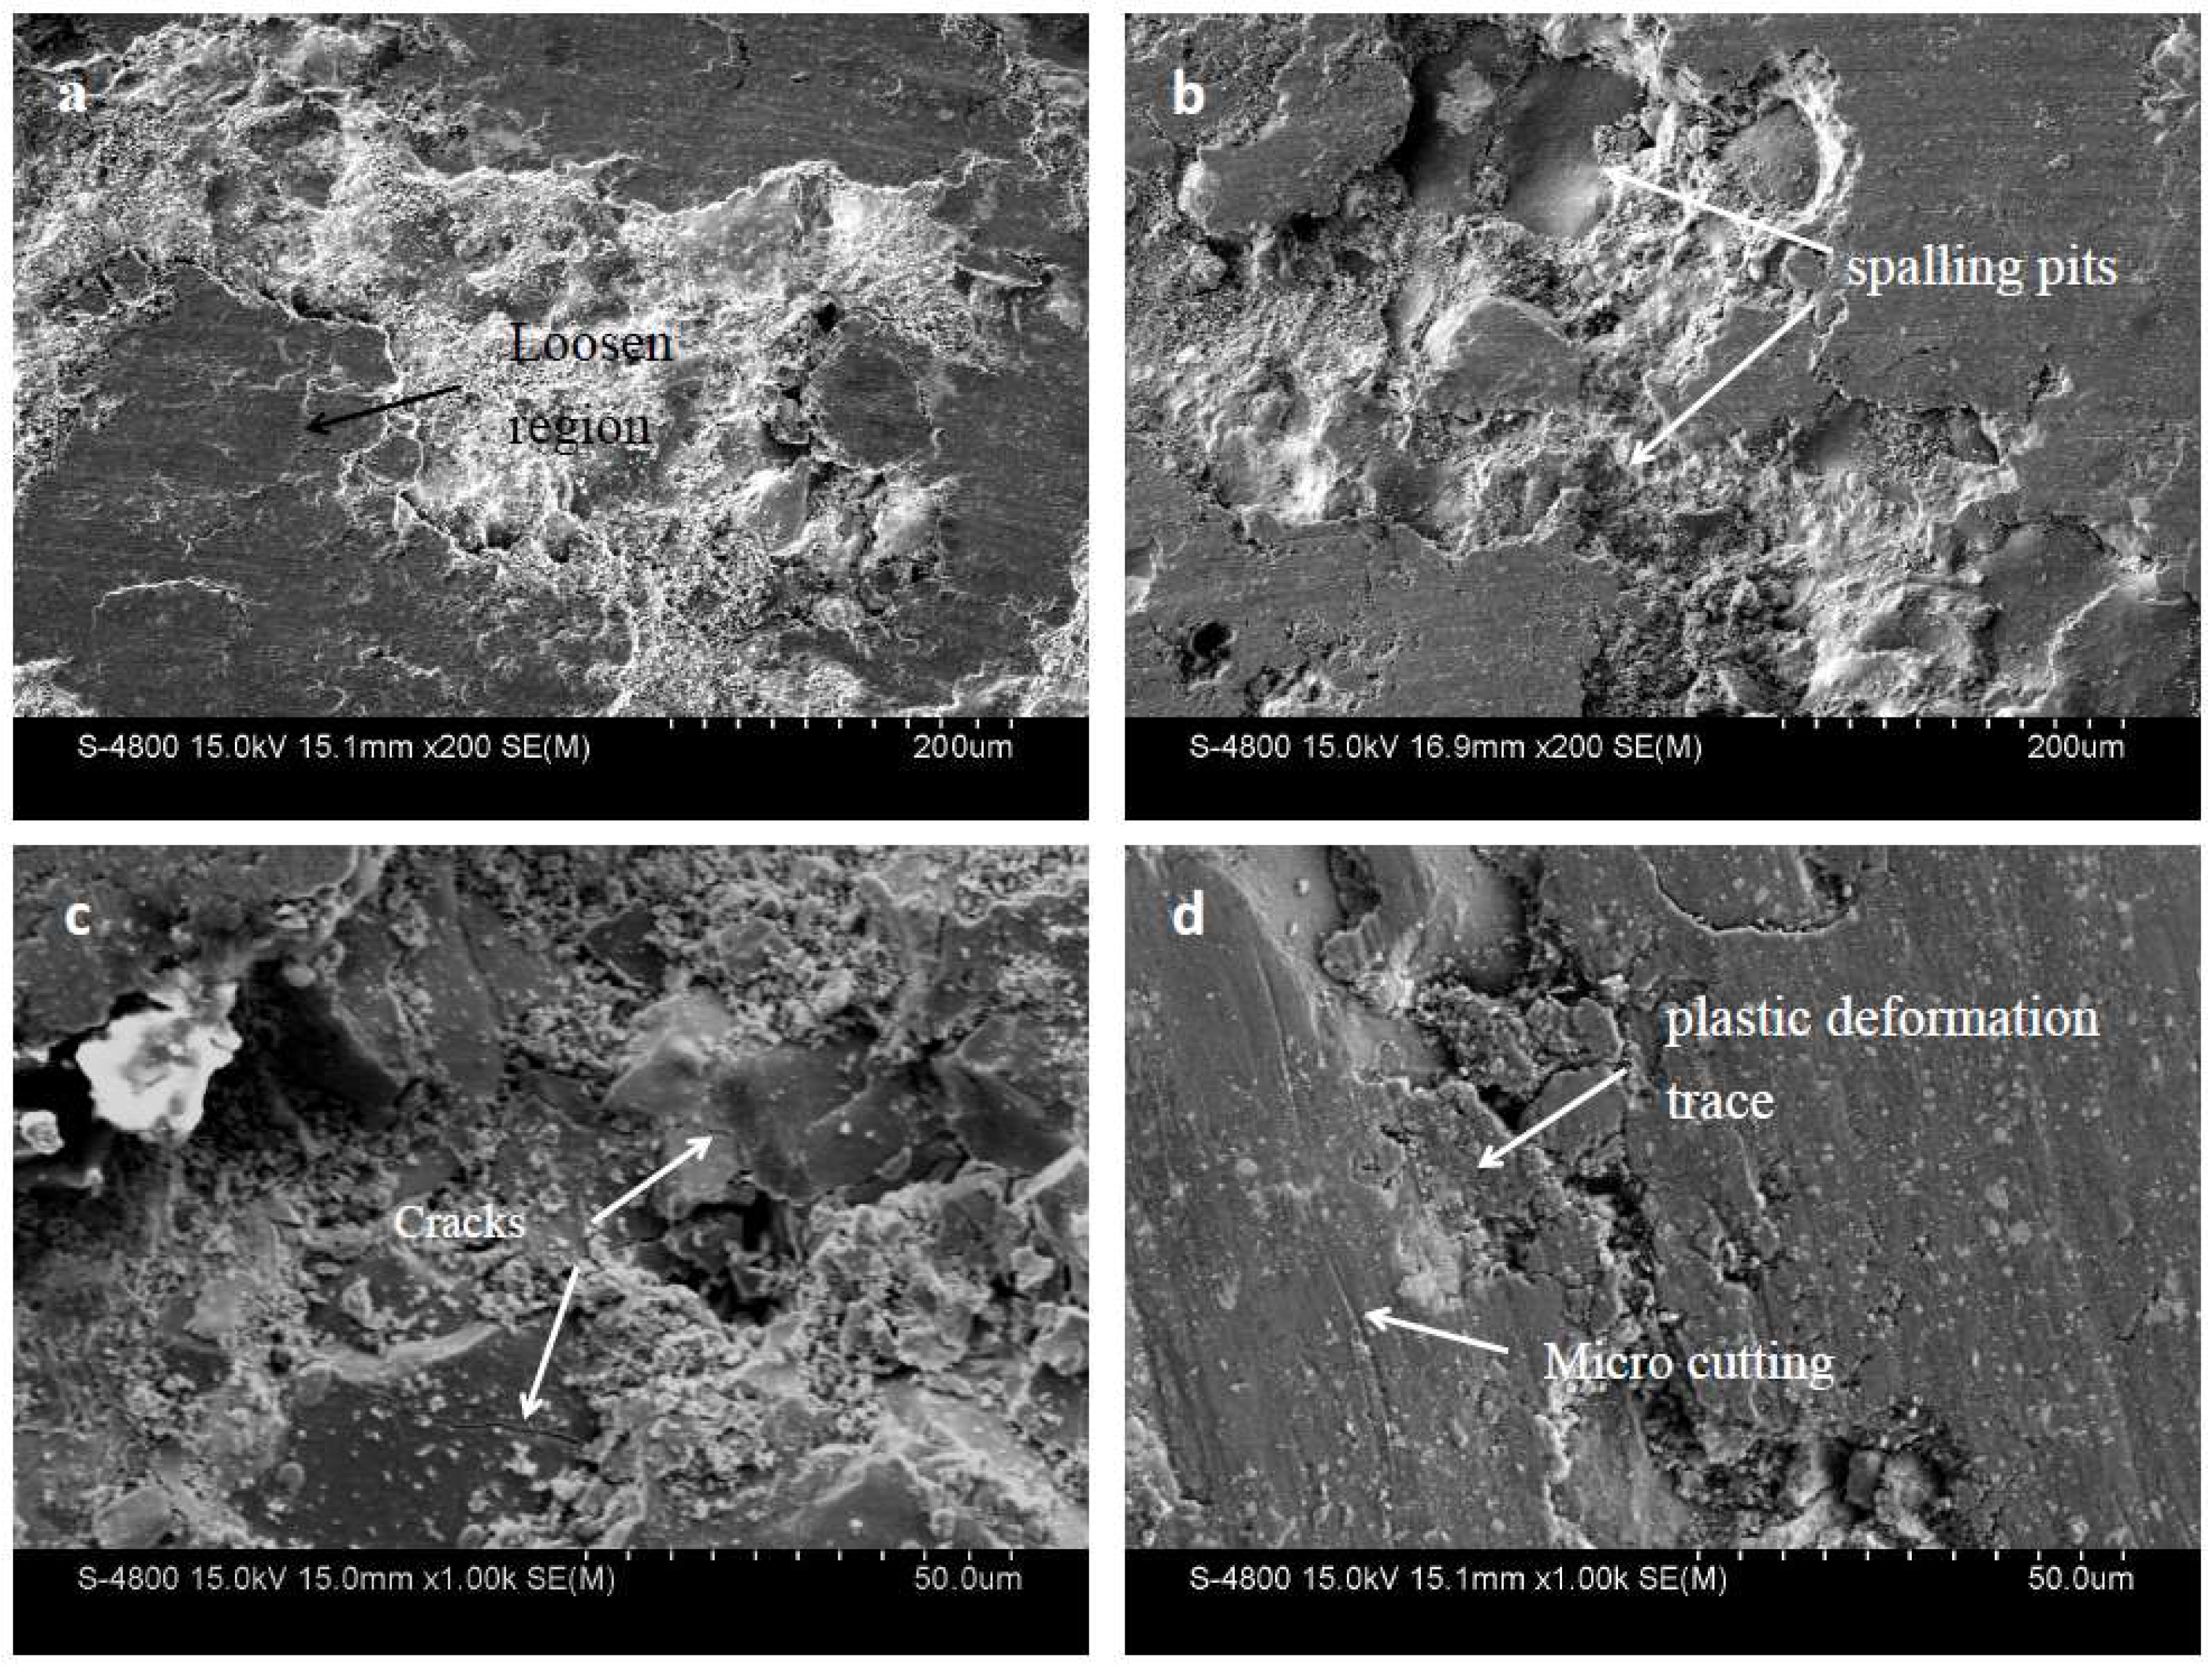
3.3. Wear Resistance

Figure 9 presents the wear profiles of the composite coating, and Table 3 lists the corresponding results. The NWC coating had a larger profile and the corresponding wear scar width and depth were larger than those of the NTC coating (Table 3). Wear volume of the NTC coating was reduced by 45% compared to the NWC coating. This suggests that the NTC coating had excellent wear resistance.
Figure 10 presents the worn morphology of the NTC coating. Some fracture chipping pits and plastic deformation traces were observed on the worn surface of the NTC coating, as shown in Figure 10a. This indicates that the main surface damage patterns of the NTC coating were microplastic deformation, material subsidence in the loosened region, microcracks, and spalling pits. The reason for these phenomena is that the softer γ-Ni phase supports the harder TiN. When the surface is locally subjected to high loading, the softer γ-Ni phase begins to plastically deform, while the harder TiN is difficult to plastically deform. Cracks start to sprout and expand. With the continuing effect of loading, the broken pieces peel off the composite coating and leave a peeling pit. There were cracks in some areas of the sample surface where γ-Ni broke from these positions and peeled off the surface. The wear mechanism of the NTC coating was mainly plastic deformation and lamellar peeling.
Figure 11 shows the worn surfaces of the NWC coating. Plastic deformation traces, loosened region, and microcutting were very obvious. The high microhardness of the WC material resulted in an increased ability of the coating to resist microcutting [31]. Therefore, microcutting trace was relatively shallow. Spalling pits can clearly be observed. Compared with the NTC coating, spalling pits of the NWC coating were bigger and deeper. If the shear force was less than the bonding force between the hard phase and the matrix metal during wear, the hard particles could protect the matrix phase from the friction of the friction pair [32]. If the shear force was greater than the bonding force between the hard phase and the matrix metal, the hard particles would peel off the matrix and participate in the wear, resulting in a greater amount of wear on the coating [33].
According to the above description, the WC/W2C phase is more likely to peel off the matrix metal than the Ti-rich phase, because the bonding strength of the TiN and Ni alloy phases is stronger than that of the WC/W2C and alloy phases. The detached WC hard particles participated in the wear process as an abrasive, which in turn exacerbated wear [34]. This also explains why the wear volume of the NTC coating will be less than that of the NWC coating.

4. Conclusions

(1) The nano-TiN phase in NiCrBSi–TiN composite (NTC) coating was obtained through in situ reaction between Ti powder and nitrogen in the process of plasma spraying. The NTC coating had typical lamellar structure due to sprayed particles fully melting and flattening during plasma spraying, and displayed good integrated condition, in close contact with the Ni-based alloy matrix. Therefore, the NTC coating had a denser structure than the NiCrBSi–WC composite (NWC) coating.
(2) The average microhardness of the NTC coating exceeded 1000 HV, while the microhardness of the NWC coating was around 850 HV. The reason is that the TiN phase in the NTC coating had nanostructure and close interface with the Ni-based alloy matrix. WC decomposed to lower hardness W2C during the spraying process, and the WC phase had micron structure.
(3) The sliding wear resistance of the NTC coating was significantly better than that of the NWC coating. The average wear loss volume was 0.8118 mm3 and 1.4772 mm3, respectively. The wear mechanism of both composite coatings included plastic deformation and lamellar peeling. The good bonding between the TiN hard phase and the NiCrBSi alloy matrix helped to increase the mechanical properties of the composite coating.

Author Contributions

collection, L.Z.; literature search, J.W.; analyses of data, L.Z., Y.Y., D.L.; original draft preparation, L.Z., X.D.; revising of the manuscript, L.Z., Y.D.

Funding

The writing of the manuscript and decision to publish the results was funded by the National Natural Science Foundation of China (grant number 51372065). The design of the study was funded by the Natural Science Foundation of Hebei Province (grant number E2015202190). The analyses of data was funded by the Key Foundation for Science and Technology Research of Universities in Hebei Province, China (grant number ZD20131018).

Conflicts of Interest

The authors declare no conflict of interest.

References

  1. Rätzer-Scheibe, H.J.; Schulz, U. The effects of heat treatment and gas atmosphere on the thermal conductivity of APS and EB-PVD PYSZ thermal barrier coatings. Surf. Coat. Technol. 2007, 201, 7880–7888. [Google Scholar] [CrossRef]
  2. Helminiak, M.A.; Yanar, N.M.; Pettit, F.S.; Taylor, T.A.; Taylor, G.H. The behavior of high-purity, low-density air plasma sprayed thermal barrier coatings. Surf. Coat. Technol. 2009, 204, 793–796. [Google Scholar] [CrossRef]
  3. Wang, Q.Y.; Zhang, Y.F.; Bai, S.L.; Liu, Z.D. Microstructures, mechanical properties and corrosion resistance of Hastelloy C22 coating produced by laser cladding. J. Alloys Compd. 2013, 553, 253–258. [Google Scholar] [CrossRef]
  4. Luo, X.; Li, J.; Li, G.J. Effect of NiCrBSi content on microstructural evolution, cracking susceptibility and wear behaviors of laser cladding WC/Ni–NiCrBSi composite coatings. J. Alloys Compd. 2015, 626, 102–111. [Google Scholar] [CrossRef]
  5. Zhou, S.F.; Dai, X.Q. Laser induction hybrid rapid cladding of WC particles reinforced NiCrBSi composite coatings. Appl. Surf. Sci. 2010, 256, 4708–4714. [Google Scholar] [CrossRef]
  6. Huang, S.; Sun, D.; Wang, W.; Xu, H. Micro-structures and properties of in situ TiC particles reinforced Ni-based composite coatings prepared by plasma spray welding. Ceram. Int. 2015, 41, 12202–12210. [Google Scholar] [CrossRef]
  7. Yin, B.; Liu, G.; Zhou, H.; Chen, J.; Yan, F. Sliding wear behavior of HVOF-sprayed Cr3C2–NiCr/CeO2 composite coatings at elevated temperature up to 800 °C. Tribol. Lett. 2010, 37, 463–475. [Google Scholar] [CrossRef]
  8. Zhang, Z.; Wang, Z.; Liang, B. Micro-structure and dry-sliding wear behavior of thermal sprayed and fused Ni-based coatings with the addition of La2O3. Tribol. Lett. 2010, 37, 141–148. [Google Scholar] [CrossRef]
  9. Dong, S.J.; Song, B.; Liao, H.L.; Coddet, C. Deposition of NiCrBSi coatings by atmospheric plasma spraying and dry-ice blasting: micro-structure and wear resistance. Surf. Coat. Technol. 2015, 268, 36–45. [Google Scholar] [CrossRef]
  10. Przybylowicz, J.; Kusinski, J. Structure of laser cladded tungsten carbide composite coatings. J. Mater. Process. Technol. 2001, 109, 154–160. [Google Scholar] [CrossRef]
  11. He, J.; Schoenung, J.M. A review on nanostructured WC–Co coatings. Surf. Coat. Technol. 2002, 157, 72–79. [Google Scholar] [CrossRef]
  12. Cho, T.Y.; Yoon, J.H.; Kim, K.S.; Song, K.O.; Joo, Y.K.; Fang, W.; Zhang, S.H.; Youn, S.J.; Chun, H.G.; Hwang, S.Y. A study on HVOF coatings of micron and nano WC–Co powders. Surf. Coat. Technol. 2008, 202, 5556–5559. [Google Scholar] [CrossRef]
  13. Zhang, Q.; Wang, H.D.; Xu, B.S.; Zhang, G.S. Characterization of microstructure and rolling contact fatigue performance of NiCrBSi/WC–Ni composite coatings prepared by plasma spraying. Surf. Coat. Technol. 2015, 261, 60–68. [Google Scholar] [CrossRef]
  14. Serres, N.; Hlawka, F.; Costil, S.; Langlade, C.; Machi, F. Microstructures and mechanical properties of metallic NiCrBSi and composite NiCrBSi–WC layers manufactured via hybrid plasma/laser process. Appl. Surf. Sci. 2011, 257, 5132–5137. [Google Scholar] [CrossRef]
  15. Sheppard, P.; Koiprasert, H. Effect of W dissolution in NiCrBSi–WC and NiBSi–WC arc sprayed coatings on wear behaviors. Wear 2014, 317, 194–200. [Google Scholar] [CrossRef]
  16. Niranatlumpong, P.; Koiprasert, H. Phase transformation of NiCrBSi–WC and NiBSi–WC arc sprayed coatings. Surf. Coat. Technol. 2011, 206, 440–445. [Google Scholar] [CrossRef]
  17. Zhou, D.L.; Yan, D.R.; He, J.N.; Li, X.Z.; Dong, Y.C.; Zhang, J.X. Reactive Plasma sprayed TiN coating and its thermal stability. J. Iron Steel Res. Int. 2007, 14, 71–75. [Google Scholar] [CrossRef]
  18. Xiao, L.; Yan, D.; He, J.; Zhu, L.; Dong, Y.; Zhang, J.; Li, X. Nanostructured TiN coating prepared by reactive plasma spraying in atmosphere. Appl. Surf. Sci. 2007, 253, 7535–7539. [Google Scholar] [CrossRef]
  19. Song, C.; Liu, M.; Deng, Z.Q.; Niu, S.P.; Deng, C.M.; Liao, H.L. A novel method for in-situ synthesized TiN coatings by plasma spray-physical vapor deposition. Mater. Lett. 2018, 217, 127–130. [Google Scholar] [CrossRef]
  20. Chen, H.; Peng, F.; Mao, H.; Shen, G.; Liermann, H.P.; Li, Z.; Shu, J. Strength and elastic moduli of TiN from radial x-ray diffraction under nonhydrostatic compression up to 45 GPa. J. Appl. Phys. 2010, 107, 113503–113505. [Google Scholar] [CrossRef]
  21. Feng, W.R.; Yan, D.R.; He, J.N.; Zhang, G.L.; Chen, G.L.; Gu, W.C.; Yang, S.Z. Microhardness and toughness of the TiN coating prepared by reactive plasma spraying. Appl. Surf. Sci. 2005, 243, 204–213. [Google Scholar] [CrossRef]
  22. Yang, J.; Miao, X.; Wang, X.; Yang, F. Influence of Mn additions on the microstructure and magnetic properties of FeNiCr/60%WC composite coatings produced by laser cladding. Int. J. Refract. Met. Hard Mater. 2014, 46, 58–64. [Google Scholar] [CrossRef]
  23. Li, G.R.; Yang, G.J.; Li, C.X.; Li, C.J. Force transmission and its effect on structural changes in plasma-sprayed lamellar ceramic coatings. J. Eur. Ceram. Soc. 2017, 37, 2877–2888. [Google Scholar] [CrossRef]
  24. Chen, J.B.; Dong, Y.C.; Wan, L.N.; Yang, Y.; Chu, Z.H.; Zhang, J.X.; He, J.; Li, D.Y. Effect of induction remelting on the microstructure and properties of in situ TiN-reinforced NiCrBSi composite coatings. Surf. Coat. Technol. 2018, 340, 159–166. [Google Scholar] [CrossRef]
  25. Herman, H. Plasma sprayed coatings. Sci. Am. 1988, 259, 112–117. [Google Scholar] [CrossRef]
  26. Ortiz, A.; García, A.; Cadenas, M.; Cuetos, J.M. WC particles distribution model in the cross-section of laser cladded NiCrBSi + WC coatings, for different wt.% WC. Surf. Coat. Technol. 2017, 324, 298–306. [Google Scholar] [CrossRef]
  27. Halas, S. 100 years of work function. Mater. Sci. 2006, 24, 951–966. [Google Scholar]
  28. Lu, H.; Hua, G.; Li, D. Dependence of the mechanical behavior of alloys on their electron work function—An alternative parameter for materials design. Appl. Phys. Lett. 2013, 103, 261902. [Google Scholar] [CrossRef]
  29. Zhao, X.B.; Yan, D.R.; Li, S.; Lu, C. The effect of heat treatment on the electrochemical corrosion behavior of reactive plasma-sprayed TiN coatings. Appl. Surf. Sci. 2011, 257, 10078–10083. [Google Scholar] [CrossRef]
  30. Yin, Z.; Tao, S.; Zhou, X.; Ding, C. Particle in-flight behavior and its influence on the microstructure and mechanical properties of plasma-sprayed Al2O3 coatings. J. Eur. Ceram. Soc. 2008, 28, 1143–1148. [Google Scholar] [CrossRef]
  31. Neupane, R.; Farhat, Z. Wear mechanisms of nitinol under reciprocating sliding contact. Wear 2014, 315, 25–30. [Google Scholar] [CrossRef]
  32. Zhou, S.; Wu, C.; Zhang, T.; Zhang, Z. Carbon nanotube- and Fep-reinforced coppermatrix composites by laser induction hybrid rapid cladding. Scr. Mater. 2014, 76, 25–28. [Google Scholar] [CrossRef]
  33. Zhou, S.F.; Lei, J.B.; Dai, X.Q.; Guo, J.B.; Gu, Z.J.; Pan, H.B. A comparative study of the structure and wear resistance of NiCrBSi/50 wt.% WC composite coatings by laser cladding and laser induction hybrid cladding. Int. J. Refract. Met. Hard Mater. 2016, 60, 17–27. [Google Scholar] [CrossRef]
  34. Fernández, M.R.; García, A.; Cuetos, J.M.; González, R.; Cadenas, M. Effect of actual WC content on the reciprocating wear of a laser cladding NiCrBSi alloy reinforced with WC. Wear 2015, 324, 80–89. [Google Scholar] [CrossRef]
Figure 1. Morphology of mixing powders: (a) NiCrBSi–Ti; (b) NiCrBSi–WC/Co.
Materials 11 02182 g001
Figure 2. XRD patterns of original powders and composite coatings: (a) NiCrBSi–TiN composite (NTC); (b) NiCrBSi–WC composite (NWC).
Materials 11 02182 g002
Figure 3. Cross-sectional morphologies of composite coating: (a,b) NTC coating; (c,d) NWC coating.
Materials 11 02182 g003
Figure 4. Cross-sectional SEM images of indentation morphology: (a) NTC coating; (b) NWC coating.
Materials 11 02182 g004
Figure 5. AFM images of the cross-sections of: (a,c) NTC coating, and (b,d) NWC coating. (e) EWF line profiles of coatings corresponding to the dashed lines in Figure 5c,d.
Materials 11 02182 g005aMaterials 11 02182 g005b
Figure 6. (a) TEM image of interfaces between TiN and γ-Ni layer; (b,c) EDS spectra.
Materials 11 02182 g006
Figure 7. Microhardness of NTC and NWC coatings.
Materials 11 02182 g007
Figure 8. Weibull distribution plot of the microhardness of NTC and NWC coatings.
Materials 11 02182 g008
Figure 9. Wear profiles of NTC and NWC coatings.
Materials 11 02182 g009
Figure 10. Wear morphology of NTC coating.
Materials 11 02182 g010
Figure 11. Wear morphology of NWC coating.
Materials 11 02182 g011
Table 1. Chemical composition of NiCrBSi powder (wt.%).
ElementNiCrBSiFeC
wt.%Bal.19.0–21.03.3–4.23.3–4.214.0–16.00.5–0.7
Table 2. EDS analysis results of different marked areas in Figure 3 (wt.%).
CoatingPointNiCrSiFeTiNWC
NTCA69.45 ± 0.7317.7 ± 1.350.83 ± 0.0511.2 ± 1.39
NTCB 63.75 ± 2.7937.35 ± 1.98
NWCC66.07 ± 1.7518.2 ± 1.563.47 ± 0.0912.22 ± 1.4
NWCD 61.62 ± 3.8738.38 ± 3.87
Table 3. Sliding wear results for the coatings.
SamplesWear Width (mm)Wear Depth (μm)Wear Volume (mm3)
NTC1.098566.880.8118
NWC1.287199.1151.4772

