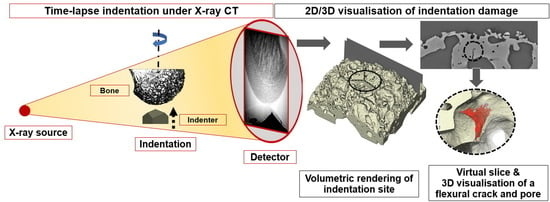
3D Imaging of Indentation Damage in Bone
by
 , , and
Tristan Lowe
1,*,†, 
Egemen Avcu
1,2,†,
Etienne Bousser
1,3,
William Sellers
4 and
Philip J. Withers
1 1
Henry Moseley X-ray Imaging Facility, Henry Royce Institute, School of Materials, The University of Manchester, Manchester M13 9PL, UK
2
Ford Otosan Ihsaniye Automotive Vocational School, Machine and Metal Technologies, Kocaeli University, 41680 Kocaeli, Turkey
3
Engineering Physics Department, Polytechnique Montréal, Montreal H3T1J4, QC, Canada
4
School of Earth and Environmental Sciences, The University of Manchester, Manchester M13 9PL, UK
*
Author to whom correspondence should be addressed.
†
These authors contributed equally to this work.
Materials 2018, 11(12), 2533; https://doi.org/10.3390/ma11122533
Submission received: 12 November 2018
/
Revised: 7 December 2018
/
Accepted: 10 December 2018
/
Published: 13 December 2018
(This article belongs to the Special Issue In-Situ X-Ray Tomographic Study of Materials)
Abstract
:Bone is a complex material comprising high stiffness, but brittle, crystalline bio-apatite combined with compliant, but tough, collagen fibres. It can accommodate significant deformation, and the bone microstructure inhibits crack propagation such that micro-cracks can be quickly repaired. Catastrophic failure (bone fracture) is a major cause of morbidity, particularly in aging populations, either through a succession of small fractures or because a traumatic event is sufficiently large to overcome the individual crack blunting/shielding mechanisms. Indentation methods provide a convenient way of characterising the mechanical properties of bone. It is important to be able to visualise the interactions between the bone microstructure and the damage events in three dimensions (3D) to better understand the nature of the damage processes that occur in bone and the relevance of indentation tests in evaluating bone resilience and strength. For the first time, time-lapse laboratory X-ray computed tomography (CT) has been used to establish a time-evolving picture of bone deformation/plasticity and cracking. The sites of both crack initiation and termination as well as the interconnectivity of cracks and pores have been visualised and identified in 2D and 3D.
1. Introduction
Bone is one of the major innovations of vertebrates, allowing a rigid endoskeleton that can both grow to a genetically controlled shape and size and also remodel dynamically in response to load. Structurally it is a composite material consisting of high stiffness, but brittle, crystalline bio-apatite combined with compliant, but tough, collagen fibres [1]. Physiologically, it accommodates growth, remodelling, repair, metabolism and sensation. The material components are arranged in a highly organised fashion with repeated and nested functional units. The structure of bone has evolved to provide the necessary rigid framework for effective locomotion as well as the protection of vital organs [2]. Typical limb bones have an overall shape reflecting the joints and muscle attachment points with an internal structure consisting of spongy trabecular bone at the epiphyses and metaphysis and forming a rigid, hollow tube of cortical bone in the shaft. Within the cortical bone lies an organised microstructure of laminated bone forming multi-layer, multi-scale tubes which allow the physiological functions of bone to occur alongside its biomechanical role. However, this microstructure varies between individual bones, evolves with age, and differs between different vertebrate species [3]. Bone is highly mass optimised, with peak strains due to normal activity that are approximately half the yield strain, providing a safety factor of about two according to strain gauge studies [4]. Unfortunately, bone fractures in humans are all too common, particularly in aging populations where falls are more frequent and bone quality is lower. Conditions that reduce bone loading, such as bed rest, spaceflight, and a reduction in physical activity associated with growing old, lead to a weakening of the bone due to remodelling that results in an increased risk of traumatic injury [5].
Indentation techniques have become some of the most widely used methods to characterise the fracture behaviour of bone tissue over the last decade [6,7,8]. These techniques allow for the determination of mechanical properties such as hardness and elastic modulus via the acquired load-displacement curves [9]. Since indentation testing can be applied at different length scales to evaluate the mechanical resistance of bone to plastic deformation [8], it has a great potential for investigating and assessing bone quality, plasticity and fracture properties [10,11]. Bone fails due to cracks that propagate through the crystalline matrix. However, the microstructure of bone is such that crack propagation is often stopped at an early stage, and these micro-cracks can be quickly repaired by the body’s internal repair processes [12]. It is only in situations where cracks can propagate through most of the shaft, either because of a succession of small injuries without sufficient time for repair (so-called fatigue fractures [13]), or because the traumatic event is sufficiently large to overcome the individual crack blunting mechanisms, that these cracks lead to catastrophic fracture [14,15]. Thus, a detailed understanding of crack propagation within bone is essential to better understand the process of bone fracture, and the risk factors associated with developmental processes, disease and activity. As such this area of biology has been intensely studied over the last few decades. The advent of high-resolution CT has allowed cracks and microcracks to be accurately visualised and quantified (e.g., [16,17]), however previous work in this area has concentrated on visualising cracks after they have formed. There has been very limited work on time-lapse imaging of loaded bone [18] to measure and track crack growth directly. As a result, considerably more work is merited, particularly with regard to indentation methods that could potentially allow in vivo assessment of bone quality. Dynamic visualisation of a crack whilst it is forming requires both high resolution to allow the crack tip to be adequately imaged, and also fast acquisition rates to allow multiple scans to be taken over many loading increments, whilst minimising time-dependent creep. It also requires specialised loading equipment to apply the load or strain without unduly obstructing the X-rays within the scanner. On the one hand, recent advances in laboratory-based micro CT imaging mean that, from a spatial resolution viewpoint, a synchrotron is no longer necessary for much of the imaging. On the other hand, for time-lapse experiments, synchrotrons significantly outperform laboratory-based systems in terms of acquisition rate and signal to noise [19,20,21]. Nevertheless, limited access to synchrotron beamtime means that if X-ray imaging is to become a useful research tool in the study of bone mechanics as a function of aging, diet, osteoporosis or repair, then it is important to consider laboratory-based X-ray CT methods.
The purpose of this study is to examine what can be achieved using state-of-the-art X-ray CT systems and customised indentation rigs in terms of visualising and tracking bone plastic deformation and crack propagation under indentation loading. This study questions whether laboratory-based systems are adequate for applications such as non-linear bone fracture modelling, bone property measurement, and the experimental identification of bone plasticity and toughening mechanisms.
2. Materials and Methods
A dried, de-fleshed mouse femur was chosen for this study (supplementary document S1): it is a suitable size to fit within the available chambers; the current rig is not humidity controlled so a wet specimen would not be suitable, and the mouse is a commonly used species for studying bone physiology and pathology [22]. The specimen was mounted on a magnetic plate using wax to ensure the head of the femur was positioned vertically for indentation of the fine trabecular region (Figure 1).
Indentation was performed using a specially designed Hysitron in-situ nanomechanical testing rig (Bruker Hysitron IntraSpect 360 indentation rig) developed in association with the Henry Moseley X-ray Imaging Facility. It was mounted in a Zeiss Xradia 520 Versa X-ray microscope system (Figure 2) to allow imaging while the indentation was taking place. The Hysitron rig uses a piezoelectric load cell design with capacitive depth sensing. It can provide a maximum force of 10 N and maximum displacement of 80 μm and will run in load- or displacement-controlled testing modes using a Performech digital controller. This allows it to capture transient events, such as fracture initiation, whilst using a wide variety of probe materials and geometries. The indentation was performed using a three-sided pyramidal (Berkovich) indenter under load-controlled indentation mode. The Zeiss Xradia 520 Versa was operated at 110 kV and 91 mA with a specimen-to-source distance of 94 mm and a specimen-to-detector distance of 43.4 mm for optimum imaging geometry to optimise the resolution of the images obtained by minimising both pixel size and focal spot blurring [23]. The whole indentation area could be viewed at 9.77× magnification corresponding to a voxel size of 0.95 µm under these settings. Each projection was collected over 120 s to minimise image noise in the projections and maximise spatial resolution, resulting in a 2D spatial resolution in the 2–3 µm range which was validated using a JIMA spatial resolution chart. The specimen was rotated over a 360° rotation range, collecting 1601 projections and giving an overall scan time of 52 h.
After image acquisition, the data sets were uploaded into the Zeiss Xradia XMReconstructor software for reconstruction of the 3D virtual slices using a filtered back projection algorithm. The reconstructed data was then analysed using the Avizo 9.2 (Thermo Fisher Scientific, Waltham, MA, USA) visualisation software to segment and image the virtual slices and 3D volume renderings. After the indentation experiment, the residual imprint location on the femoral head was investigated using an FEI Magellan scanning electron microscope (SEM), and secondary electron (SE) images of the indentation site were collected at 1 kV with a tilt angle of 45°.
3. Results and Discussions
The indentation sequence is illustrated in Figure 3a with the load and displacement curves recorded shown in Figure 4. The load was linearly incremented from 0 to a maximum of 2.5 N, since at this point the displacement sensor limit was reached and the sensor saturated, leading to a significant drop in load and a slight increase in displacement during the hold segment (Figure 4).
The load-displacement curve of the full indentation and the corresponding contact stiffness (dP/dh) during loading are illustrated in Figure 5. The fracture of the bone can be identified in the load-displacement curve through pop-in events in the loading segment, which translate to significant drops in contact stiffness accompanying local fractures (Figure 5). The residual imprint does not have the usual shape for a Berkovich indentation and seems to be slightly elongated (Figure 6). This could indicate the movement of the tip during the indentation. In addition to the sensor saturation effects, this could be one of the reasons for the drop in load and displacement drift during the test holding segment (Figure 4).
Due to the heterogeneous microstructure of bone [24], as illustrated in Figure 3b, the selection of the indentation site is essential [25] in determining the mechanical response and the inferred properties such as hardness and elastic modulus [26,27]. One other factor that needs to be considered in terms of indentation testing is the size of the indenter [28]. The inferred mechanical properties of the bone are likely to depend on the indent size due to the scale of the microstructural features such as pores and cracks within the bone structure sampled during the indentation process [29]. In the present study, the indent size is not a critical concern since the main focus of the study is to generate and visualise sub-surface crack networks to understand the crack propagation and fracturing behaviour of bone rather than to examine the mechanical properties (e.g., hardness and modulus) by implementing indentation under X-ray CT.
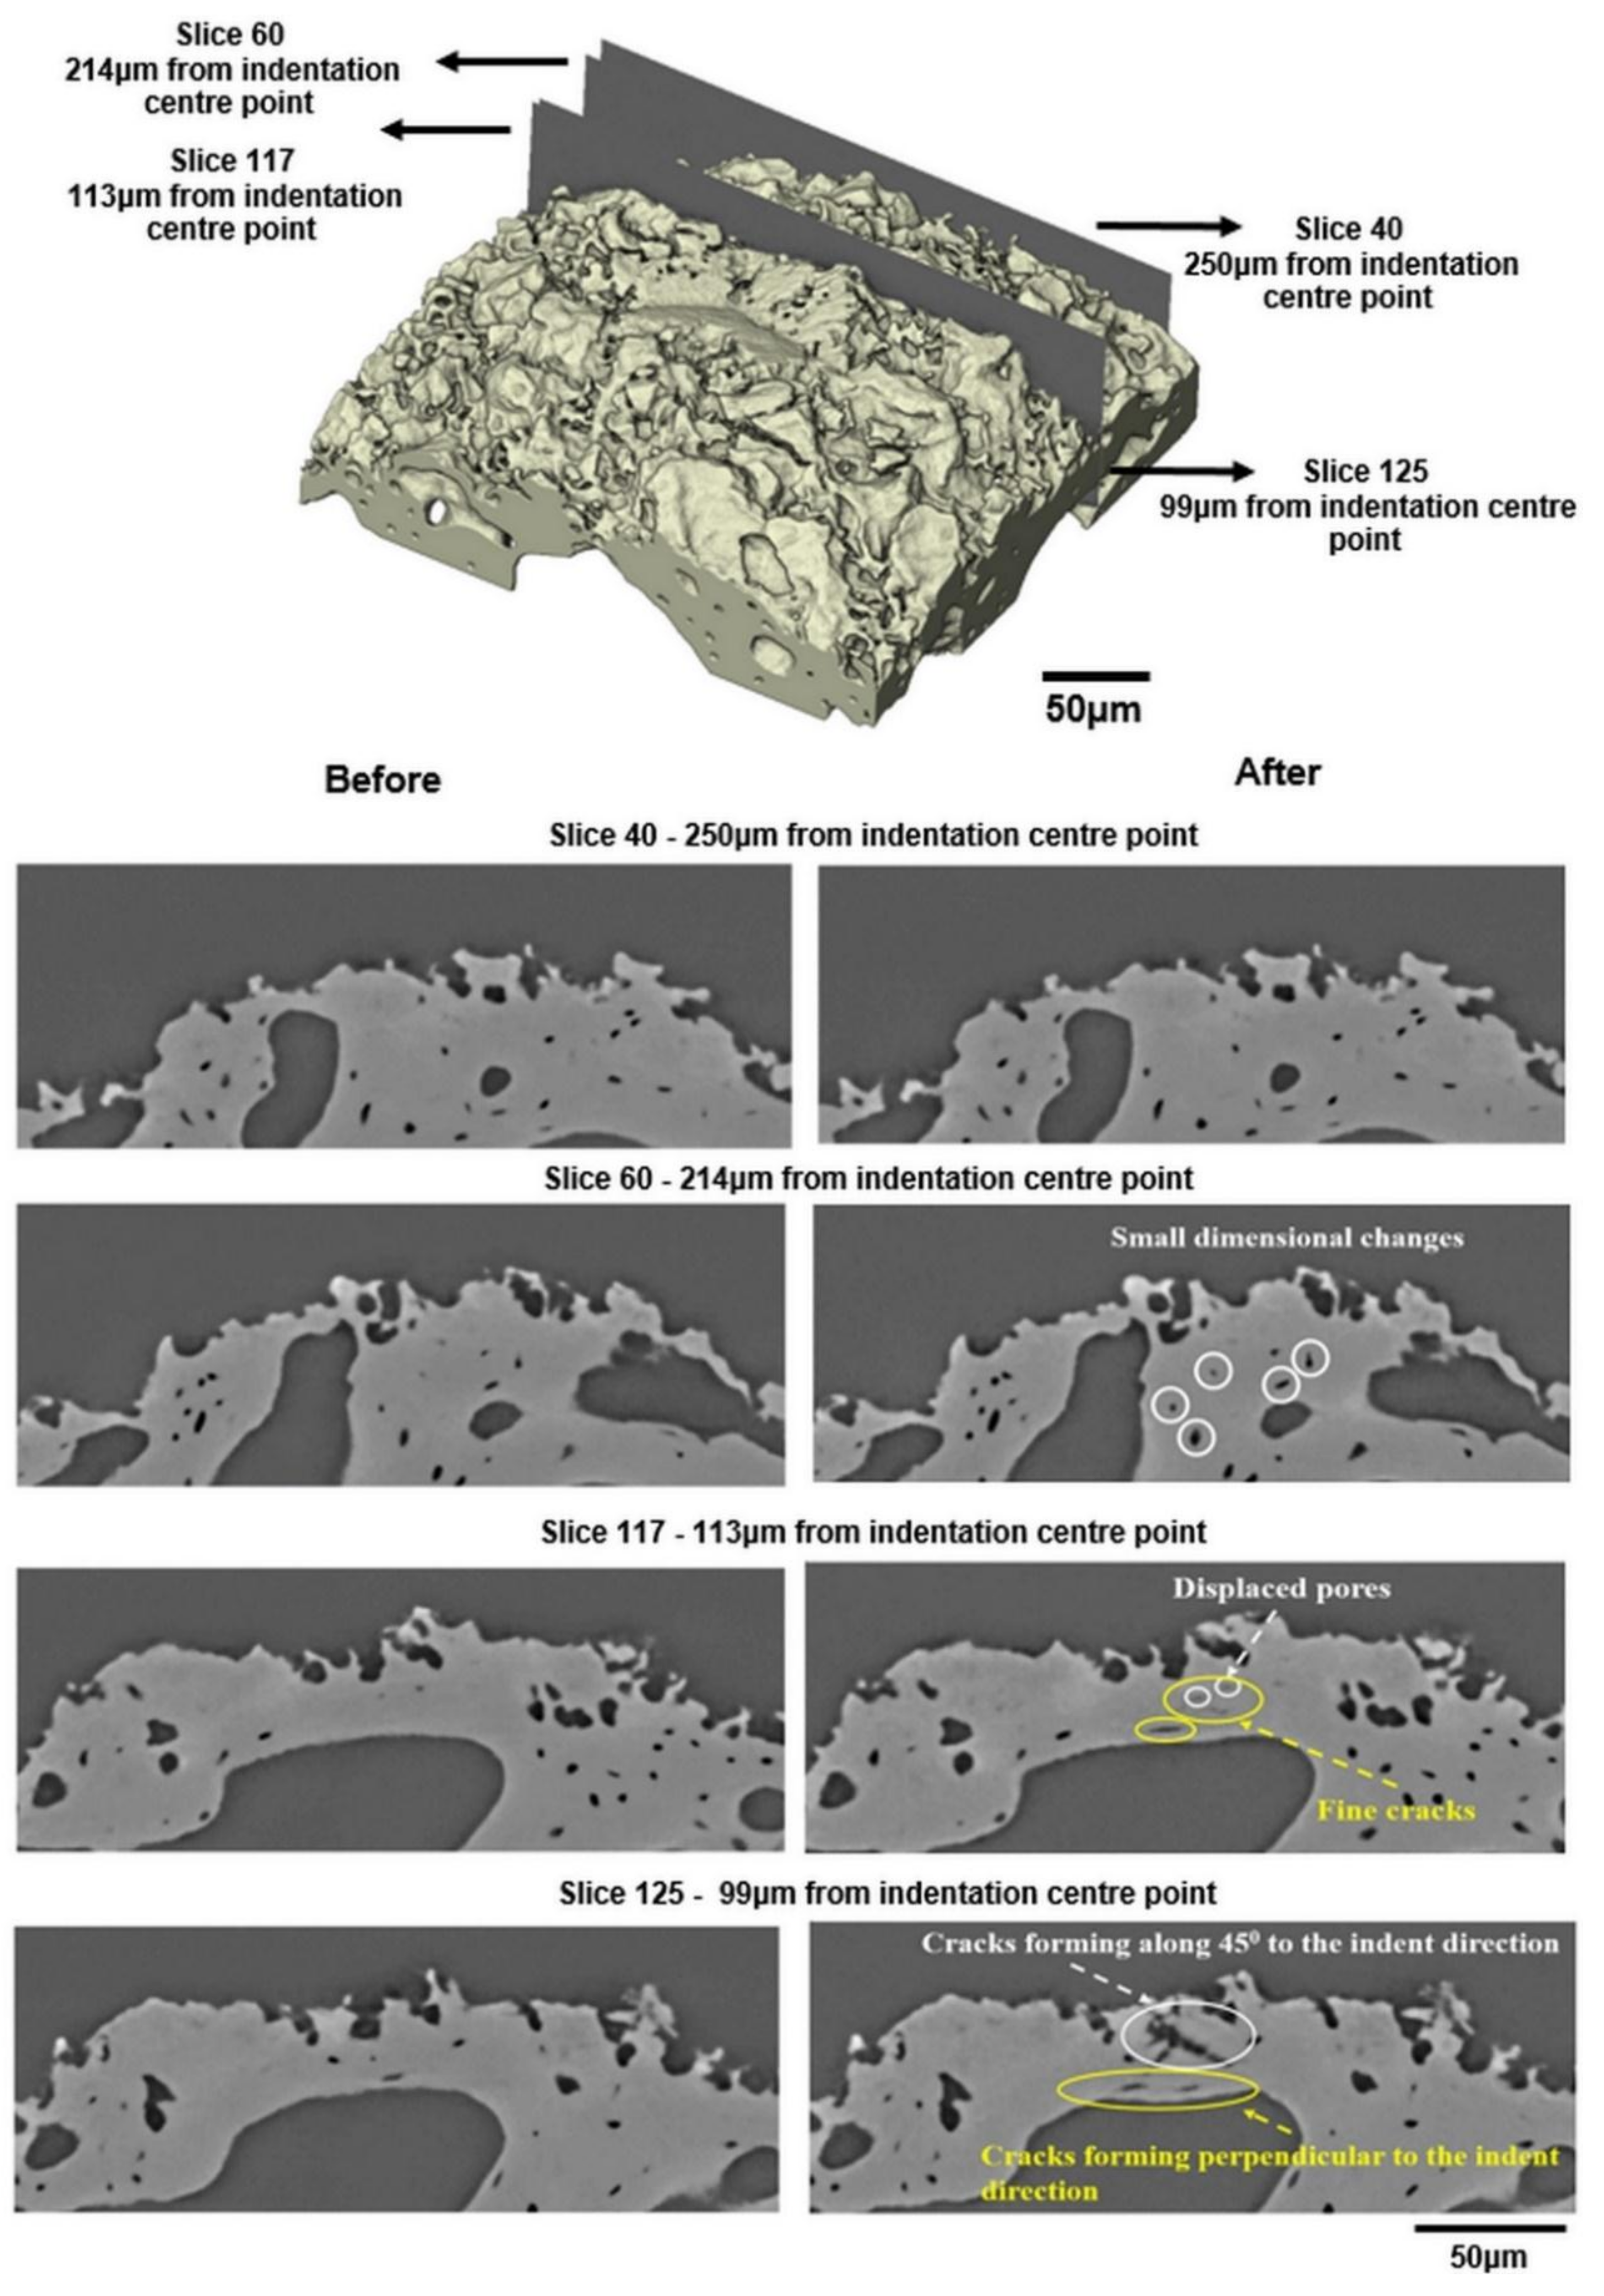
Figure 7 shows a 3D image of the indentation site and also the geometry of the contact area formed during the indentation. This indicates a material pile-up behaviour [30]. It has been reported that pile-up of material on the indentation site may occur when using a sharp Berkovich indenter [9,31,32]. However, the amount of pile-up is limited, as seen in Figure 7, since bone has a relatively low effective modulus-to-yield stress ratio in compression [32]. Although the plastically deformed indentation site and limited pile-up can be seen through the volumetric rendering of the indentation site given in Figure 7, it is not possible to identify the sub-surface damage mechanisms such as splitting, cracking and plastic deformations induced by the indentation. Therefore, individual virtual cross-sectional slices (orthoslices) at different distances have been used to identify these damage modes and to understand the fracture mechanics of bone. This is challenging due to the complex and hierarchical structure of bone [33]. Figure 8 shows the individually rendered cross sections at large distances away from the indentation site and near the indentation site. Small dimensional changes through the movement of small pores in the bone microstructure are visible at a distance of 214 µm from the indentation site (slice 60) while no visible changes can be observed at a distance of 250 µm (slice 40).
Figure 8 shows various damage mechanisms including visible plastic strain and crack initiation and propagation through the virtual cross-sectional slices near the indentation site (slices 117 and 125). Fine cracks and the displacement of pores can be identified at a distance of 113 µm (slice 117) while crack formation and growth at an angle of approximately 45° to the indentation direction can be observed nearer to the indentation site (slice 125). Crack bridging is one of the major mechanisms that inhibits crack extension in bone tissue [34] and can occur when a crack grows from the indent [27]. Here the cracks along the direction 45° to the indentation direction show some slight evidence of crack bridging (Figure 8 slice 125) which may lead to a decrease in the driving force at the crack tip through the interaction between the cracks and the microstructural features [35]. Some interactions between the propagating cracks and the pre-existing pores and micro-cracks are also visible in slices 117 and 125. Although it is clear that the pore networks in the bone structure affect the mechanical behaviour of bone [36], it is currently unknown how important these pores are in preventing crack propagation and increasing the fracture resistance by contributing to toughening mechanisms such as microcracking, crack bridging, and crack deflection [10,15,16,35]. Haversian canals have an important role in the crack propagation behaviour of human cortical bone (specifically crack deflection) [15], however, they have been reported as ‘not found’ in mouse bone, and in any case not in trabecular bone [7]. Thus, the interconnectivity of pores and cracks may have a relatively strong effect on the fracturing of mouse bone compared to human bone. In order to better understand the effects of the pre-existing pore networks on the crack propagation, the interaction of cracks with pores and fine trabecular structure is visualised and discussed in detail through 2D and 3D visualisations in the following sections.
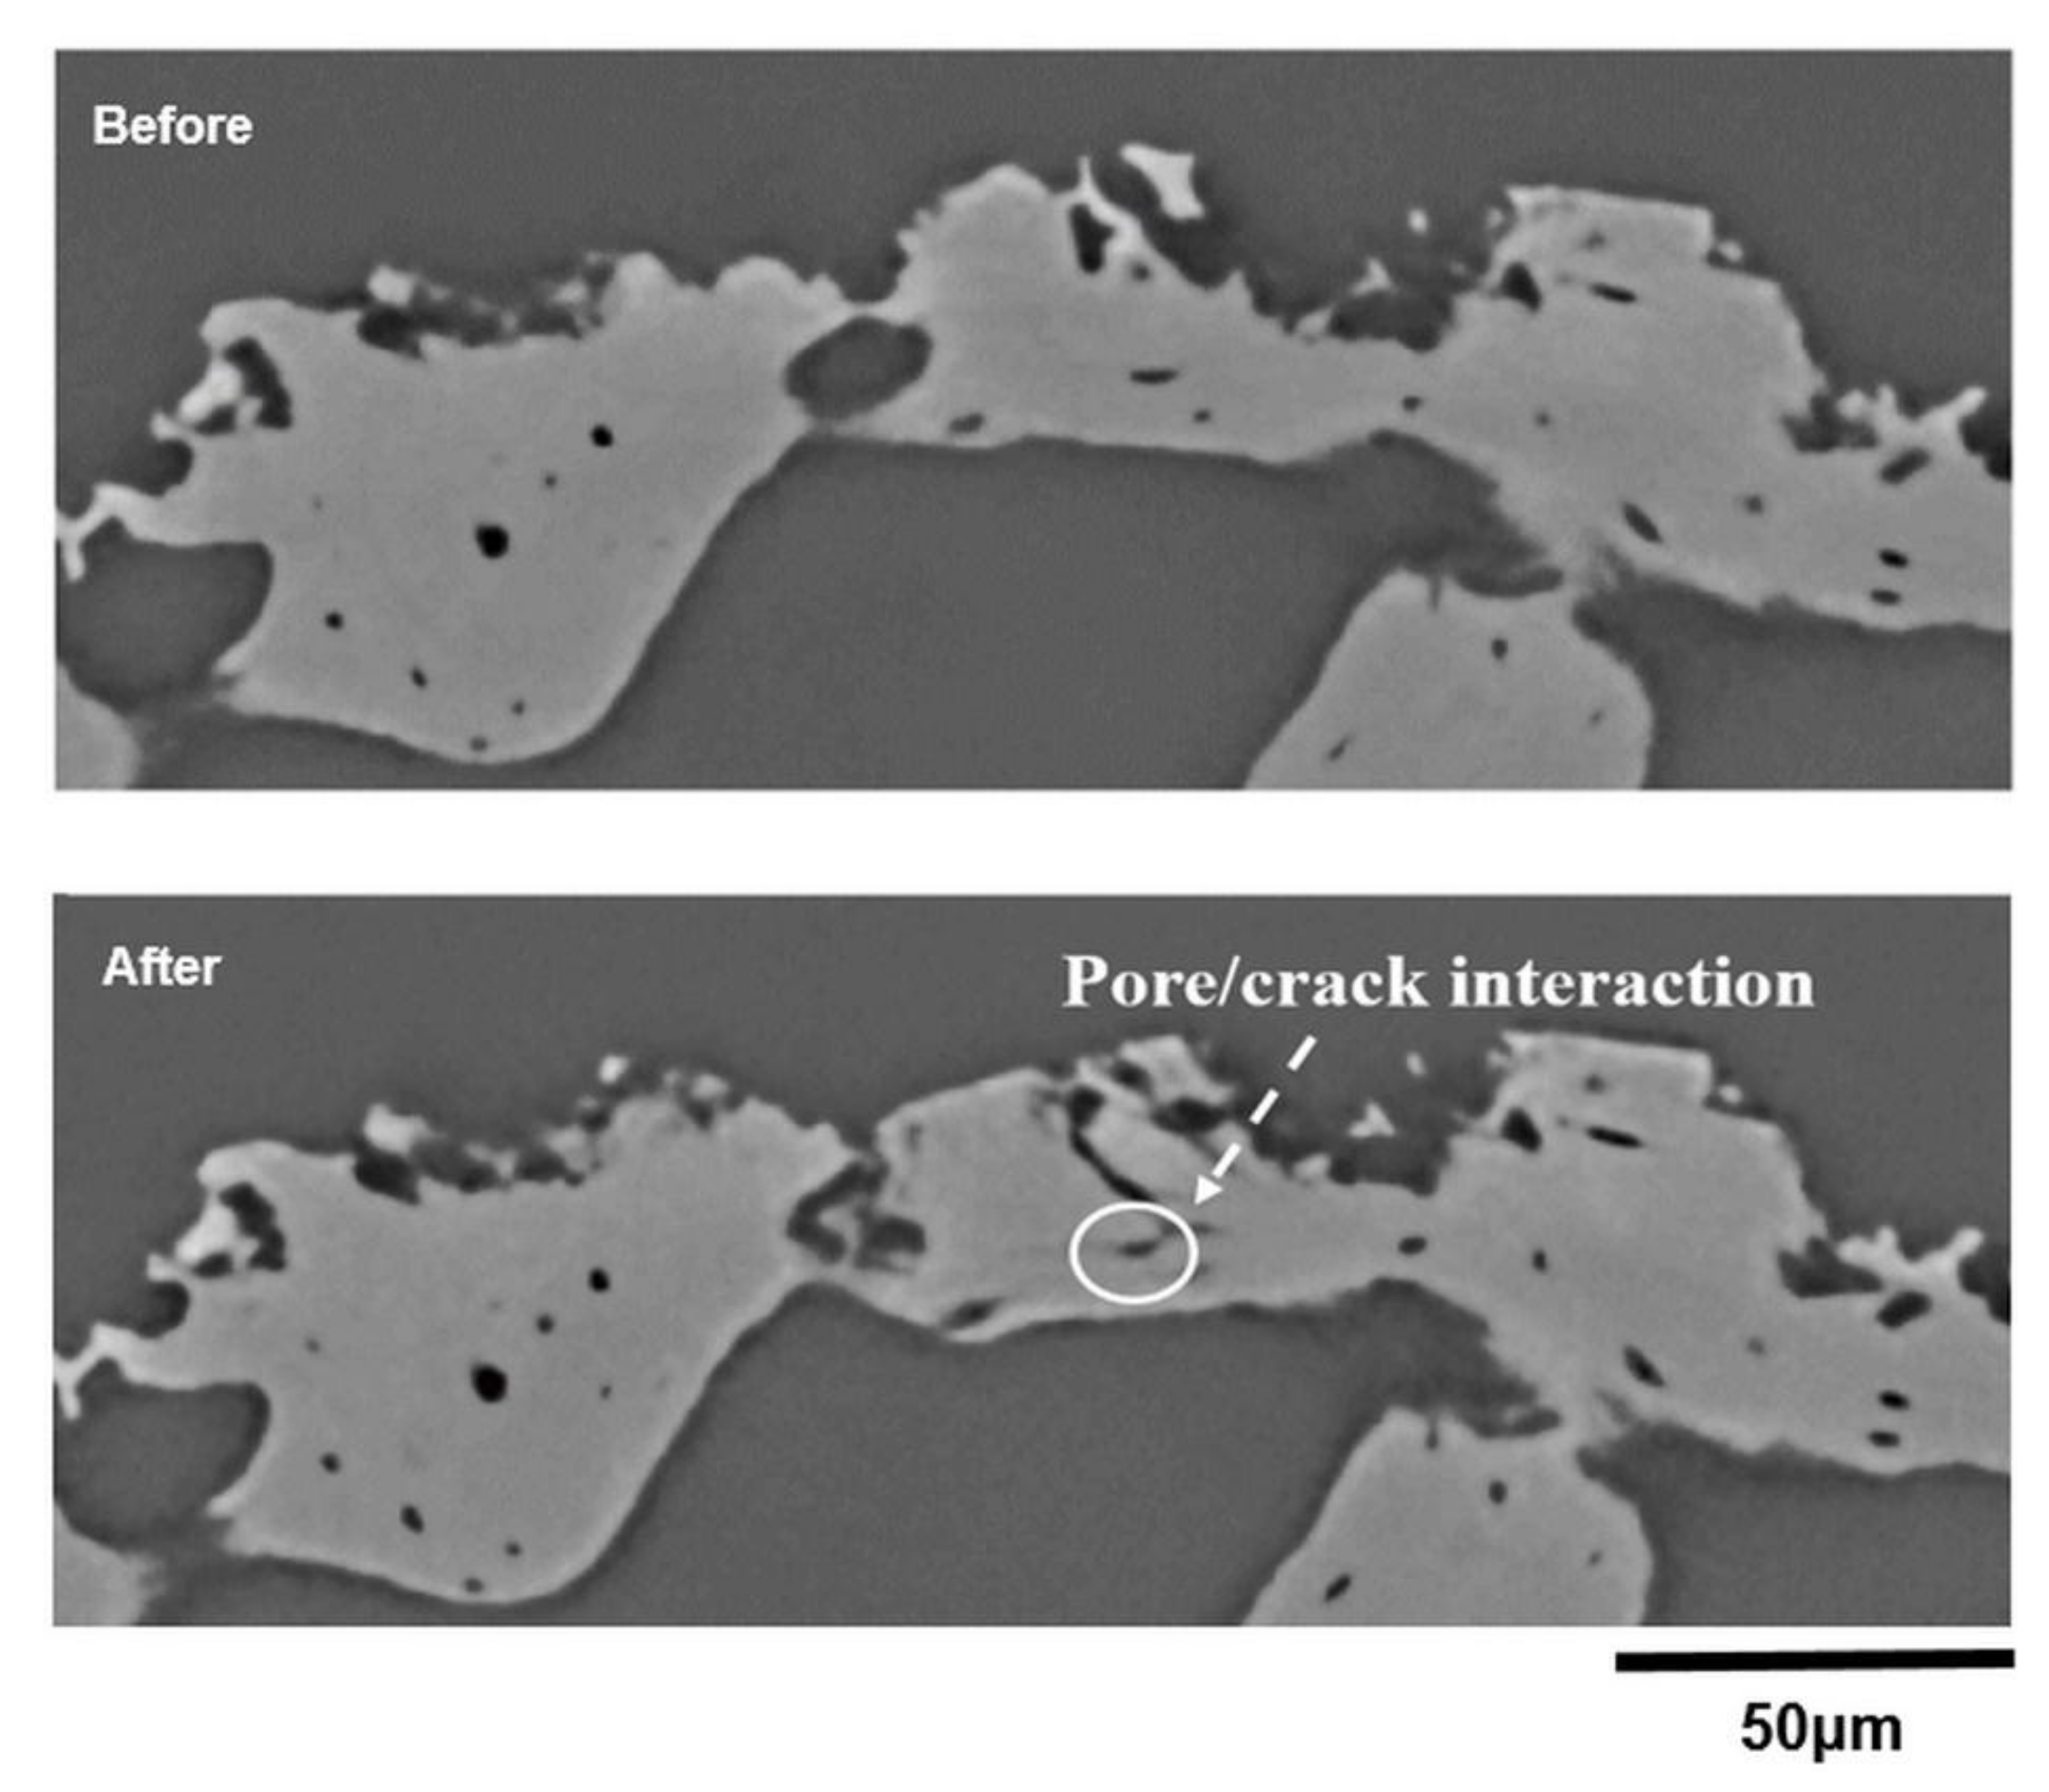
The propagation of micro-cracks local to the indentation site and the interaction between the growing cracks and the pores found in the trabecular bone can be seen in Figure 8 and Figure 9. It is evident that there is no significant orientation of the pore structure, and the sizes of pores range between 5 and 30 µm. The micro-crack formation might be dependent on these pre-existing pore networks illustrated in both Figure 8 and Figure 9. On the one hand, pores may detrimentally affect the mechanical properties of bone due to the decrease in the total load bearing area [37] as well as acting as stress concentration sites. On the other hand, the internal pore structure may have a positive effect on suppressing crack propagation during indentation. Thus, it is important to understand the effects of crack-pore interactions on the toughening mechanisms of bone structure. Unfortunately, the existing literature is limited regarding the analysis of the interaction of cracks with the existing pore networks in the bone microstructure, and no work has been conducted on how cracks develop and interact with the microstructural features of bone over time during indentation loading.
In Figure 9, we can see how a crack interacts with an existing pore within the bone structure, and the growth of the crack appears to be terminated at this point. However, the 2D view of cracks and their interactions with the pores illustrated in these figures can be highly misleading. In fact, the cracks themselves have complex 3D shapes that propagate through the bone, and the level of detail is therefore clearly necessary if this approach is to be used to validate non-linear crack growth models and their complex interactions with the pore networks in the bone structure. Figure 10 illustrates the individually rendered slice at a distance of 135 µm from the opposite side of the indenter tip and the 3D rendering of the crack structure illustrating the interaction between the growing crack and the pores found within the trabecular bone. The 2D visualisation suggests that the pore structure has completely stopped the crack from propagating, but the 3D view showing a significant flexural crack and its interaction with an existing pore implies that the real story is much more complex (Figure 10). To the best of our knowledge, this is the first time that indentation of bone has been visualised in high resolution to analyse the initiation and propagation of cracks and their interactions with the microstructural features of bone, specifically with pre-existing pore networks.
Figure 11 shows the damage at the centre of the indentation site. Some evidence of plastic deformation beneath the surface is visible which could provide resistance to crack propagation by blunting the crack tip through the formation of plastically deformed zones [7]. However, this intrinsic toughening mechanism seems to be very limited, preventing the formation of large shear cracks just beneath the vicinity of the indent corner (Figure 11c). The rotation of the indentation site around the pivot point (rotation point) is identified through the angular movement of the indented microstructure as highlighted in Figure 11b,c. It can be inferred that the bending moment induced by this identified rotation may be the underlying reason for the severe plastic deformation and shear crack propagation at the centre of the indentation site. A limited pile-up of material can be seen at the right edges of the impression, proving that plastic deformation occurred during indentation while displacement of materials is visible at the left edge due to the generated high strain at the surface of the indentation zone (Figure 11).
Previously indentation studies have yielded only information on the surface crack geometries, while sub-surface crack behaviour has only been predicted, or investigated through cross-sectional scanning electron microscope (SEM) images [27]. Here we have successfully visualised and linked different surface and sub-surface damage mechanisms in the bone structure, such as localized plastic deformation, pile-up of materials and propagation of different crack types by fracturing the head of a mouse femur using load-controlled indentation testing within the X-ray CT scanner. Since mouse bone has been widely used as a model for human bone diseases [7,24] this approach provides a novel way of exploring the bone quality and the fracture mechanics of bone as a function of aging and/or bone disease. While we are currently limited to using dried bone, future work will include the incorporation of a humidity controlled chamber so that freshly prepared bone can be used, allowing its well known differences in material properties to be assessed [38].
4. Conclusions
The present paper demonstrates the use of an indentation rig within an X-ray CT scanner to visualise and characterise the cracking of bone material at an unprecedented level of detail for the first time. This has revealed a range of surface and sub-surface damage mechanisms in the bone structure, such as localised plastic deformation and the propagation of different types of cracking. The results show that indentation coupled with X-ray CT has the potential to quantify the bone fracture mechanics associated with aging and disease process, such as osteoporosis and osteogenesis imperfecta.
The interactions of cracks with the existing pore networks and micro-cracks have been visualised in high resolution in 2D and 3D to understand the fracturing process of the bone structure. Further research is recommended on the 3D visualisation of these interactions to understand the fracture mechanics of bone. Time-lapse 3D imaging is a promising tool to better understand in-vivo indentation of bone to evaluate bone quality, the effects of normal development, and the impacts of disease processes and potential treatments.
The results illustrate that the 3D propagation of cracks and other deformation effects within the bone under the indentation load can be visualised with a resolution of ~2 µm by laboratory-based X-ray CT. This is sufficient to observe early crack formation while enabling us to see the microstructural features that might help prevent crack propagation. However, the current acquisition rate means that each scan took 52 h to acquire. This limited the number of frames that could be acquired in a time-lapse sequence. Furthermore, it introduces the risk of creep and relaxation affecting the interpretation of the results. Therefore, in-situ indentation tests under synchrotron X-ray CT imaging would be desirable to observe in-situ crack development as the indenter is progressively loaded. This would also allow the use of CT data to better understand the strain-strain features that occur during indentation in terms of the plastic hinging and crack propagation sub-surface. Such an approach will enable better interpretation and of indentation curves in terms of the effects of aging or disease. Nevertheless lab. X-ray CT is demonstrated to be a useful tool for characterising and quantifying sub-surface indentation damage for bone indentation testing.
Supplementary Materials
The following are available online at https://www.mdpi.com/1996-1944/11/12/2533/s1, Video S1: Animated sequences showing indentation damage in bone, Document S1: Materials and methods.
Author Contributions
Conceptualization, T.L., E.A., P.J.W. and W.S.; Funding Acquisition, P.J.W.; Investigation, T.L. and E.B.; Methodology, T.L. and E.B.; Project Administration, P.J.W.; Recourses, W.S.; Supervision, P.J.W.; Visualisation, T.L., E.B., and E.A.; Writing—Original Draft; E.A., W.S. and T.L.; Writing—Review & Editing; E.A., E.B., W.S., T.L., and P.J.W.
Funding
The X-ray kit was funded by the Higher education Funding Council for England UK (HEFCE). We would like to acknowledge the UK Research Partnership Investment Fund (UKRPIF) and the Engineering and Physical Sciences Research Council (ESPRC) for funding the Henry Moseley X-ray Imaging Facility through grants (EP/F007906/1, EP/F001452/1 and EP/M010619/1). P.J.W. also acknowledges support from the European Research Council (ERC) grant No. 695638 CORREL-CT. E.B. would like to acknowledge the Canadian Natural Sciences and Engineering Research Council’s support through the Postdoctoral Fellowship program.
Acknowledgments
The authors would like to thank Xun Zhang and Douglas Stauffer for advising on the use of the Hysitron indentation rig, and Andrew Chamberlain for providing the bone samples.
Conflicts of Interest
The authors declare no conflict of interest. The funders had no role in the design of the study; in the collection, analyses, or interpretation of data; in the writing of the manuscript, or in the decision to publish the results.
References
- Currey, J.D. Bones: Structure and Mechanics; Princeton University Press: Princeton, NJ, USA, 2002; ISBN 9780691128047. [Google Scholar]
- Alexander, R.M. Principles of Animal Locomotion; Princetown University Press: Princeton, NJ, USA, 2006; ISBN 9781400849512. [Google Scholar]
- Quemeneur, S.; De Buffrenil, V.; Laurin, M. Microanatomy of the amniote femur and inference of lifestyle in limbed vertebrates. Biol. J. Linn. Soc. 2013, 109, 644–655. [Google Scholar] [CrossRef] [Green Version]
- Biewener, A.A. Biomechanics of Mammalian Terrestrial Locomotion. Science 1990, 250, 1097–1103. [Google Scholar] [CrossRef] [PubMed]
- LeBlanc, A.D.; Spector, E.R.; Evans, H.J.; Sibonga, J.D. Skeletal responses to space flight and the bed rest analog: A review. J. Musculoskelet. Neuronal Interact. 2007, 7, 33–47. [Google Scholar] [PubMed]
- Dall’Ara, E.; Schmidt, R.; Zysset, P. Microindentation can discriminate between damaged and intact human bone tissue. Bone 2012, 50, 925–929. [Google Scholar] [CrossRef] [PubMed]
- Carriero, A.; Zimmermann, E.A.; Shefelbine, S.J.; Ritchie, R.O. A methodology for the investigation of toughness and crack propagation in mouse bone. J. Mech. Behav. Biomed. Mats 2014, 39, 38–47. [Google Scholar] [CrossRef] [PubMed]
- Hunt, H.B.; Donnelly, E. Bone quality assessment techniques: Geometric, compositional, and mechanical characterization from macroscale to nanoscale. Clin. Rev. Bone Miner. Metab. 2016, 14, 133–149. [Google Scholar] [CrossRef]
- Oliver, W.C.; Pharr, G.M. Measurement of hardness and elastic modulus by instrumented indentation: Advances in understanding and refinements to methodology. J. Mater. Res. 2011, 19, 3–20. [Google Scholar] [CrossRef]
- Nyman, J.S.; Granke, M.; Singleton, R.C.; Pharr, G.M. Tissue-Level Mechanical Properties of Bone Contributing to Fracture Risk. Curr. Osteoporos. Rep. 2016, 14, 138–150. [Google Scholar] [CrossRef] [Green Version]
- Chang, A.; Easson, G.W.; Tang, S.Y. Clinical Measurements of Bone Tissue Mechanical Behavior Using Reference Point Indentation. Clin. Revn Bone Miner. Metab. 2018, 16, 87–94. [Google Scholar] [CrossRef]
- Bruce Martin, R. Fatigue Damage, Remodeling, and the Minimization of Skeletal Weight. J. Theor. Biol. 2003, 220, 271–276. [Google Scholar] [CrossRef]
- Lee, T.C.; O’Brien, F.L.; Parkesh, R.; Gunnlaugsson, T. Visualisation and Quantification of Fatigue Induced Microdamage in Bone: Histology and Radiology. In Proceedings of the 11th International Conference on Fracture 2005 (ICF 11), Turin, Italy, 20–25 March 2005. [Google Scholar]
- Alexander, R.M. Animal Mechanics; Sidgwick & Jackson: London, UK, 1968. [Google Scholar]
- Mohsin, S.; O’Brien, F.J.; Lee, T.C. Osteonal crack barriers in ovine compact bone. J. Anat. 2006, 208, 81–89. [Google Scholar] [CrossRef] [PubMed] [Green Version]
- Larrue, A.; Rattner, A.; Peter, Z.A.; Olivier, C.; Laroche, N.; Vico, L.; Peyrin, F. Synchrotron radiation micro-CT at the micrometer scale for the analysis of the three-dimensional morphology of microcracks in human trabecular bone. PLoS ONE 2011, 6, e21297. [Google Scholar] [CrossRef] [PubMed]
- O’Brien, F.J.; Taylor, D.; Dickson, G.R.; Lee, T.C. Visualisation of three-dimensional microcracks in compact bone. J. Anat. 2000, 197, 413–420. [Google Scholar] [CrossRef] [PubMed] [Green Version]
- Thurner, P.J.; Wyss, P.; Voide, R.; Stauber, M.; Stampanoni, M.; Sennhauser, U.; Muller, R. Time-lapsed investigation of three-dimensional failure and damage accumulation in trabecular bone using synchrotron light. Bone 2006, 39, 289–299. [Google Scholar] [CrossRef] [PubMed]
- Lee, T.C.; Mohsin, S.; Taylor, D.; Parkesh, R.; Gunnlaugsson, T.; O’Brien, F.J.; Giehl, M.; Gowin, W. Detecting microdamage in bone. J. Anat. 2003, 203, 161–172. [Google Scholar] [CrossRef] [PubMed] [Green Version]
- Metscher, B.D. MicroCT for comparative morphology: Simple staining methods allow high-contrast 3D imaging of diverse non-mineralized animal tissues. BMC Physiol. 2009, 9, 11. [Google Scholar] [CrossRef] [PubMed]
- Maire, E.; Withers, P.J. Quantitative X-ray tomography. Int. Mater. Rev. 2013, 59, 1–43. [Google Scholar] [CrossRef] [Green Version]
- Pogoda, P.; Priemel, M.; Schilling, A.F.; Gebauer, M.; Catala-Lehnen, P.; Barvencik, F.; Beil, F.T.; Munch, C.; Rupprecht, M.; Muldner, C.; et al. Mouse models in skeletal physiology and osteoporosis: Experiences and data on 14,839 cases from the Hamburg Mouse Archives. J. Bone Miner. Metab. 2005, 23 (Suppl. 1), 97–102. [Google Scholar] [CrossRef]
- Feser, M.; Gelb, J.; Chang, H.; Cui, H.; Duewer, F.; Lau, S.H.; Tkachuk, A.; Yun, W. Sub-micron resolution CT for failure analysis and process development. Meas. Sci. Technol. 2008, 19, 094001. [Google Scholar] [CrossRef]
- Carriero, A.; Bruse, J.L.; Oldknow, K.J.; Millan, J.L.; Farquharson, C.; Shefelbine, S.J. Reference point indentation is not indicative of whole mouse bone measures of stress intensity fracture toughness. Bone 2014, 69, 174–179. [Google Scholar] [CrossRef] [Green Version]
- Zwierzak, I.; Baleani, M.; Viceconti, M. Microindentation on cortical human bone: Effects of tissue condition and indentation location on hardness values. Proc. Inst. Mech. Eng. Part H J. Eng. Med. 2009, 223, 913–918. [Google Scholar] [CrossRef] [PubMed]
- Johnson, W.M.; Rapoff, A.J. Microindentation in bone: Hardness variation with five independent variables. J. Mater. Sci. Mater. Med 2007, 18, 591–597. [Google Scholar] [CrossRef] [PubMed]
- Kruzic, J.J.; Kim, D.K.; Koester, K.J.; Ritchie, R.O. Indentation techniques for evaluating the fracture toughness of biomaterials and hard tissues. J. Mech. Behav. Biomed. Mater. 2009, 2, 384–395. [Google Scholar] [CrossRef] [PubMed]
- Oyen, M.L.; Shean, T.A.V.; Strange, D.G.T.; Galli, M. Size effects in indentation of hydrated biological tissues. J. Mater. Res. 2011, 27, 245–255. [Google Scholar] [CrossRef] [Green Version]
- Boughton, O.R.; Ma, S.; Zhao, S.; Arnold, M.; Lewis, A.; Hansen, U.; Cobb, J.P.; Giuliani, F.; Abel, R.L. Measuring bone stiffness using spherical indentation. PLoS ONE 2018, 13, e0200475. [Google Scholar] [CrossRef] [PubMed]
- Hardiman, M.; Vaughan, T.J.; McCarthy, C.T. The effects of pile-up, viscoelasticity and hydrostatic stress on polymer matrix nanoindentation. Polym. Test. 2016, 52, 157–166. [Google Scholar] [CrossRef]
- Tang, Z.; Guo, Y.; Jia, Z.; Li, Y.; Wei, Q. Examining the Effect of Pileup on the Accuracy of Sharp Indentation Testing. Adv. Mater. Sci. Eng. 2015, 2015, 1–10. [Google Scholar] [CrossRef]
- Zysset, P.K. Indentation of bone tissue: A short review. Osteoporosis 2009, 20, 1049–1055. [Google Scholar] [CrossRef]
- Ritchie, R.O.; Nalla, R.K.; Kruzic, J.J.; Ager, J.W.; Balooch, G.; Kinney, J.H. Fracture and Ageing in Bone: Toughness and Structural Characterization. Strain 2006, 42, 225–232. [Google Scholar] [CrossRef] [Green Version]
- Diez-Perez, A.; Guerri, R.; Nogues, X.; Caceres, E.; Pena, M.J.; Mellibovsky, L.; Randall, C.; Bridges, D.; Weaver, J.C.; Proctor, A.; et al. Microindentation for in vivo measurement of bone tissue mechanical properties in humans. J. Bone Miner. Res. 2010, 25, 1877–1885. [Google Scholar] [CrossRef] [Green Version]
- Ager, J.W.; Balooch, G.; Ritchie, R.O. Fracture, aging, and disease in bone. J. Mater. Res. 2011, 21, 1878–1892. [Google Scholar] [CrossRef]
- Hauthier, R. Crack Propagation Mechanisms in Human Cortical Bone on Different Paired Anatomical locations: Biomechanical, Tomographic and Biochemical Approaches. Ph.D. Thesis, Université de Lyon, Lyon, France, 2017. [Google Scholar]
- Zimmermann, E.A.; Busse, B.; Ritchie, R.O. The fracture mechanics of human bone: Influence of disease and treatment. BoneKEy Rep. 2015, 4, 743. [Google Scholar] [CrossRef] [PubMed]
- Currey, J. Measurement of the mechanical properties of bone: A recent history. Clin. Orthop. Relat. Res. 2009, 467, 1948–1954. [Google Scholar] [CrossRef] [PubMed]
Figure 1.
(a) Bone mounted on a steel plate with the femoral head pointing vertically for indentation, (b) Specimen mounted within the Hysitron in-situ nanomechanical testing rig.
Figure 1.
(a) Bone mounted on a steel plate with the femoral head pointing vertically for indentation, (b) Specimen mounted within the Hysitron in-situ nanomechanical testing rig.

Figure 2.
(a) The Hysitron indentation rig mounted within the Zeiss-Xradia VersaXRM-520 system during initial specimen alignment, (b) Magnified image showing the indentation tip position.
Figure 2.
(a) The Hysitron indentation rig mounted within the Zeiss-Xradia VersaXRM-520 system during initial specimen alignment, (b) Magnified image showing the indentation tip position.

Figure 3.
(a) Radiographs showing the indentation sequence using a Berkovich indenter geometry, (b) Virtual slice and 3D reconstruction of the head of the mouse femur.
Figure 3.
(a) Radiographs showing the indentation sequence using a Berkovich indenter geometry, (b) Virtual slice and 3D reconstruction of the head of the mouse femur.

Figure 4.
The load and displacement curves recorded as a function of time.

Figure 5.
The load-displacement curve of the full indentation and variation of the contact stiffness during the loading segment. The load drop during the hold stage is evident.
Figure 5.
The load-displacement curve of the full indentation and variation of the contact stiffness during the loading segment. The load drop during the hold stage is evident.

Figure 6.
Secondary electron SEM image of the indentation residual imprint location on the femoral head and higher-magnification of the indentation (inset) at 1 kV with a tilt angle of 45°.
Figure 6.
Secondary electron SEM image of the indentation residual imprint location on the femoral head and higher-magnification of the indentation (inset) at 1 kV with a tilt angle of 45°.

Figure 7.
Volumetric rendering of the indentation site and geometry of the contact area after removal of the indenter.
Figure 7.
Volumetric rendering of the indentation site and geometry of the contact area after removal of the indenter.

Figure 8.
Individual virtual slices before (left) and after (right) indentation at distances of 250 µm, 214 µm, 113 µm and 99 µm from the indenter tip (see also animated sequences in supplementary video online).
Figure 8.
Individual virtual slices before (left) and after (right) indentation at distances of 250 µm, 214 µm, 113 µm and 99 µm from the indenter tip (see also animated sequences in supplementary video online).

Figure 9.
Individual slice images before and after indentation showing plastic deformation, collapse and cracking as a result of the indenter at a distance of 66 µm from the indenter tip (see also animated sequences in supplementary video online).
Figure 9.
Individual slice images before and after indentation showing plastic deformation, collapse and cracking as a result of the indenter at a distance of 66 µm from the indenter tip (see also animated sequences in supplementary video online).

Figure 10.
2D and 3D visualisations of a larger flexural crack from the opposite side of the indenter tip showing how the 2D image can be misleading in terms of crack complexity and propagation.
Figure 10.
2D and 3D visualisations of a larger flexural crack from the opposite side of the indenter tip showing how the 2D image can be misleading in terms of crack complexity and propagation.

Figure 11.
(a) Volumetric rendering of the indentation site, (b) Orthoslice from the other orientation showing the pivot point, (c) Individual slice images showing the damage immediately below the indentation tip (see also animated sequences in supplementary video online).
Figure 11.
(a) Volumetric rendering of the indentation site, (b) Orthoslice from the other orientation showing the pivot point, (c) Individual slice images showing the damage immediately below the indentation tip (see also animated sequences in supplementary video online).

© 2018 by the authors. Licensee MDPI, Basel, Switzerland. This article is an open access article distributed under the terms and conditions of the Creative Commons Attribution (CC BY) license (http://creativecommons.org/licenses/by/4.0/).
Share and Cite
MDPI and ACS Style
Lowe, T.; Avcu, E.; Bousser, E.; Sellers, W.; Withers, P.J. 3D Imaging of Indentation Damage in Bone. Materials 2018, 11, 2533. https://doi.org/10.3390/ma11122533
AMA Style
Lowe T, Avcu E, Bousser E, Sellers W, Withers PJ. 3D Imaging of Indentation Damage in Bone. Materials. 2018; 11(12):2533. https://doi.org/10.3390/ma11122533
Chicago/Turabian StyleLowe, Tristan, Egemen Avcu, Etienne Bousser, William Sellers, and Philip J. Withers. 2018. "3D Imaging of Indentation Damage in Bone" Materials 11, no. 12: 2533. https://doi.org/10.3390/ma11122533
Note that from the first issue of 2016, this journal uses article numbers instead of page numbers. See further details here.