Fabrication of Titanium-Niobium-Zirconium-Tantalium Alloy (TNZT) Bioimplant Components with Controllable Porosity by Spark Plasma Sintering


Abstract
:1. Introduction
2. Experimental
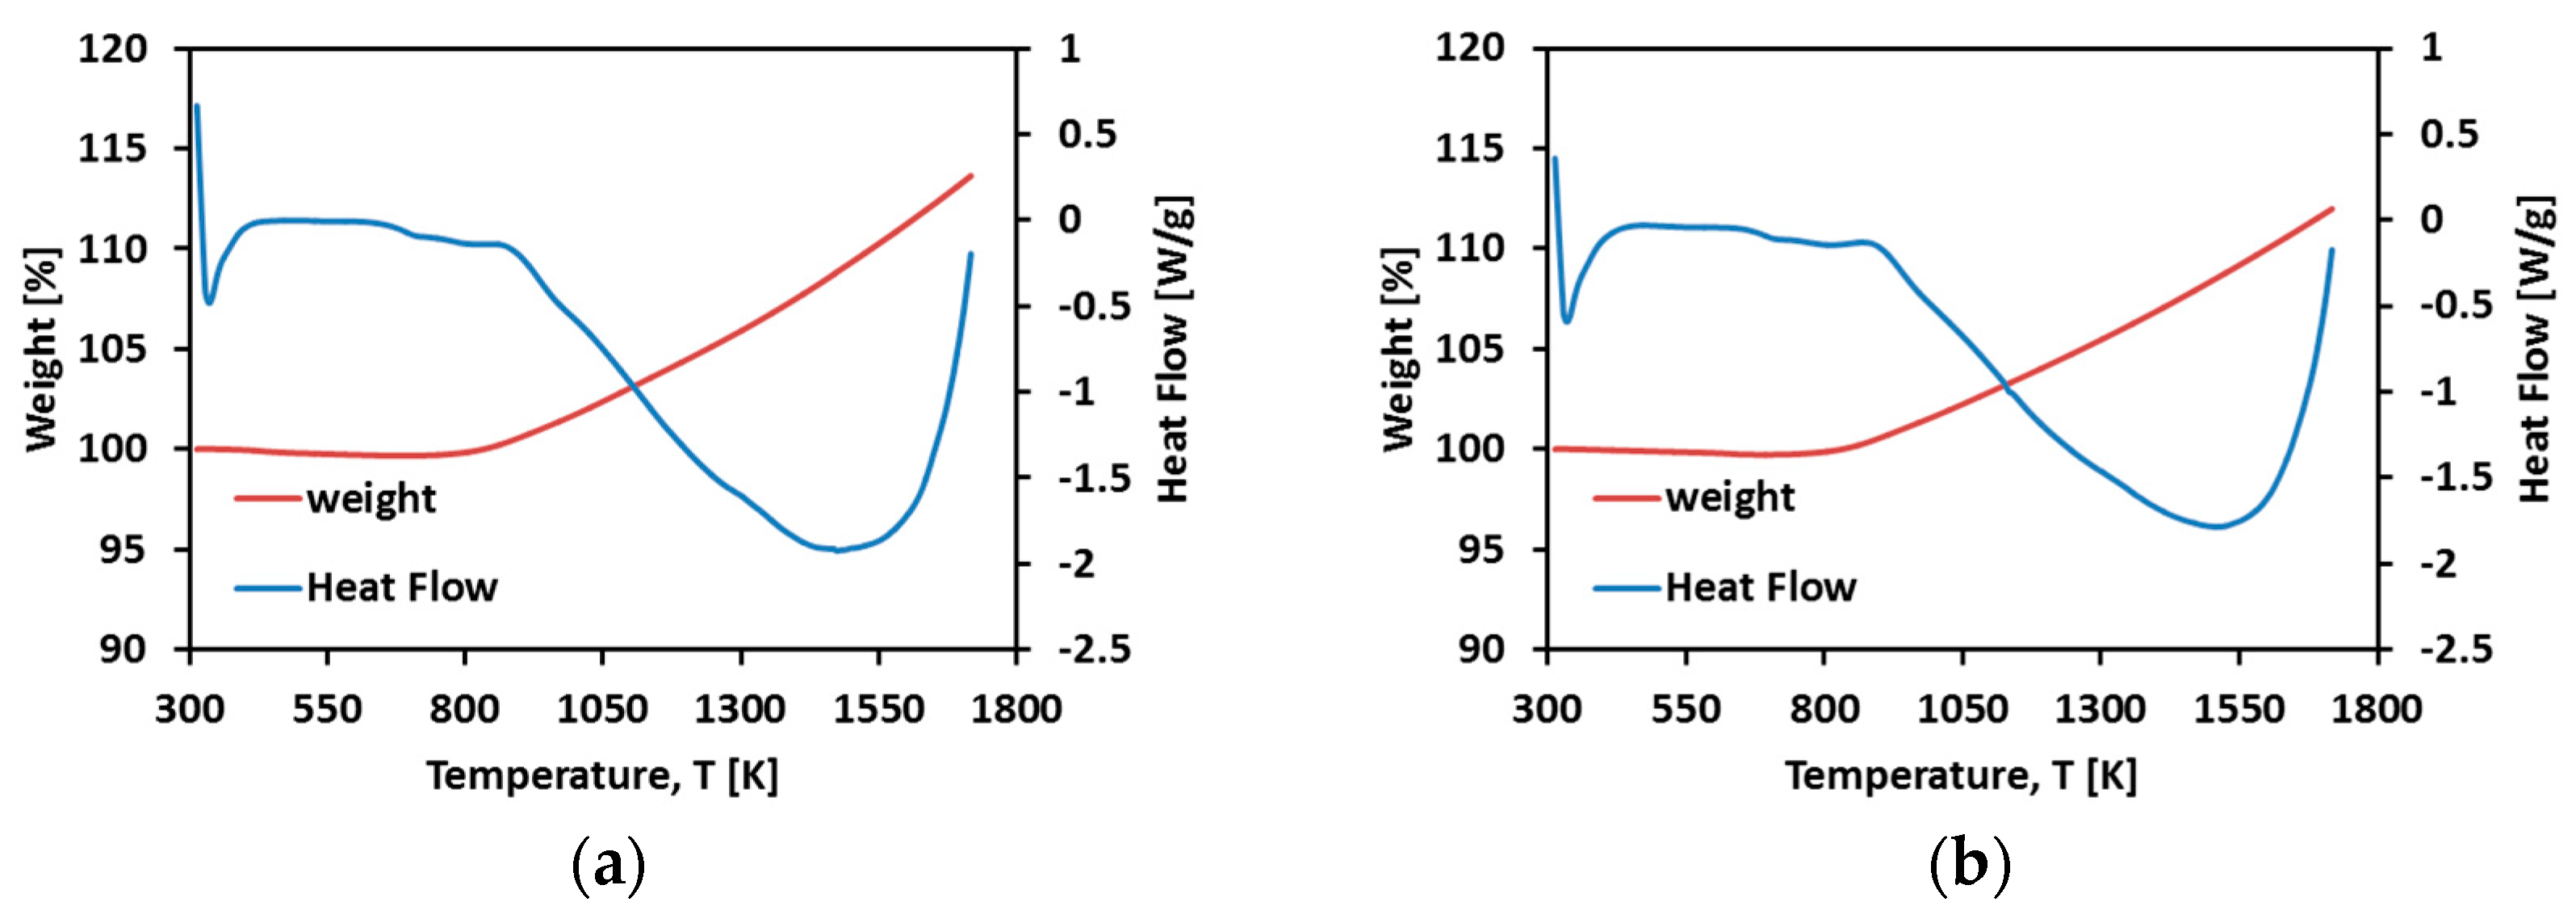
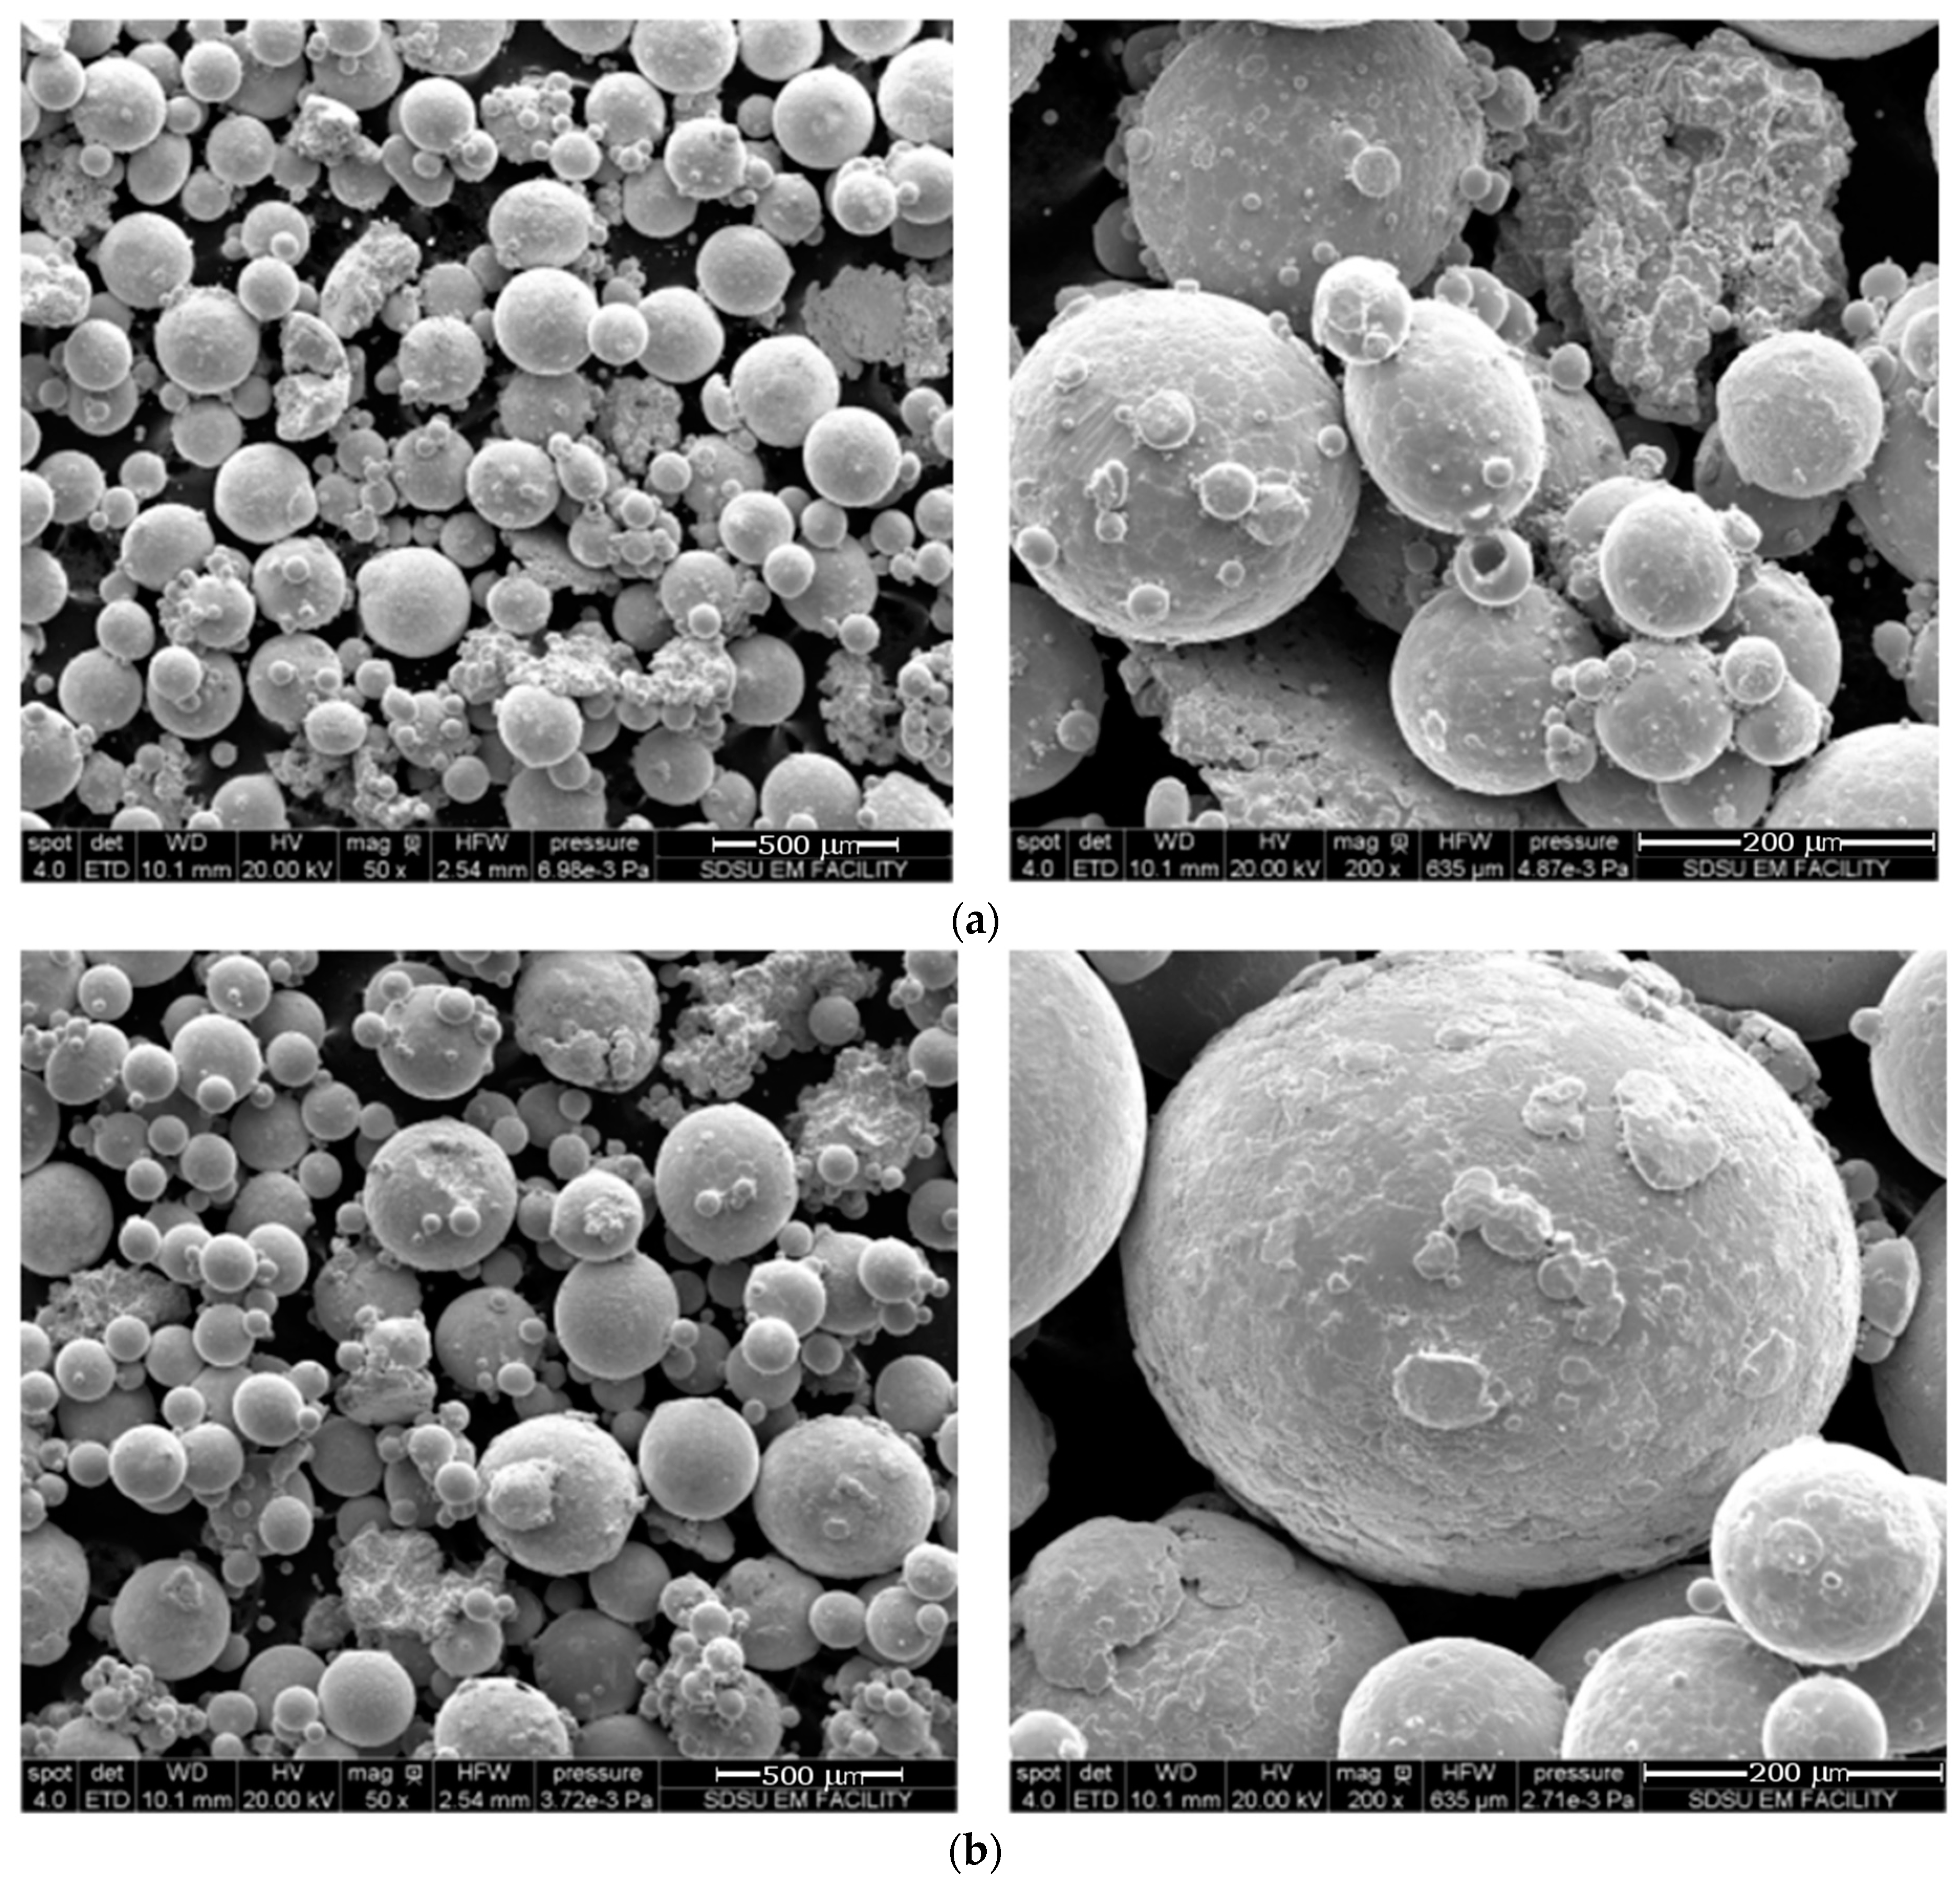
2.1. Powder Characterization
2.2. SPS Process
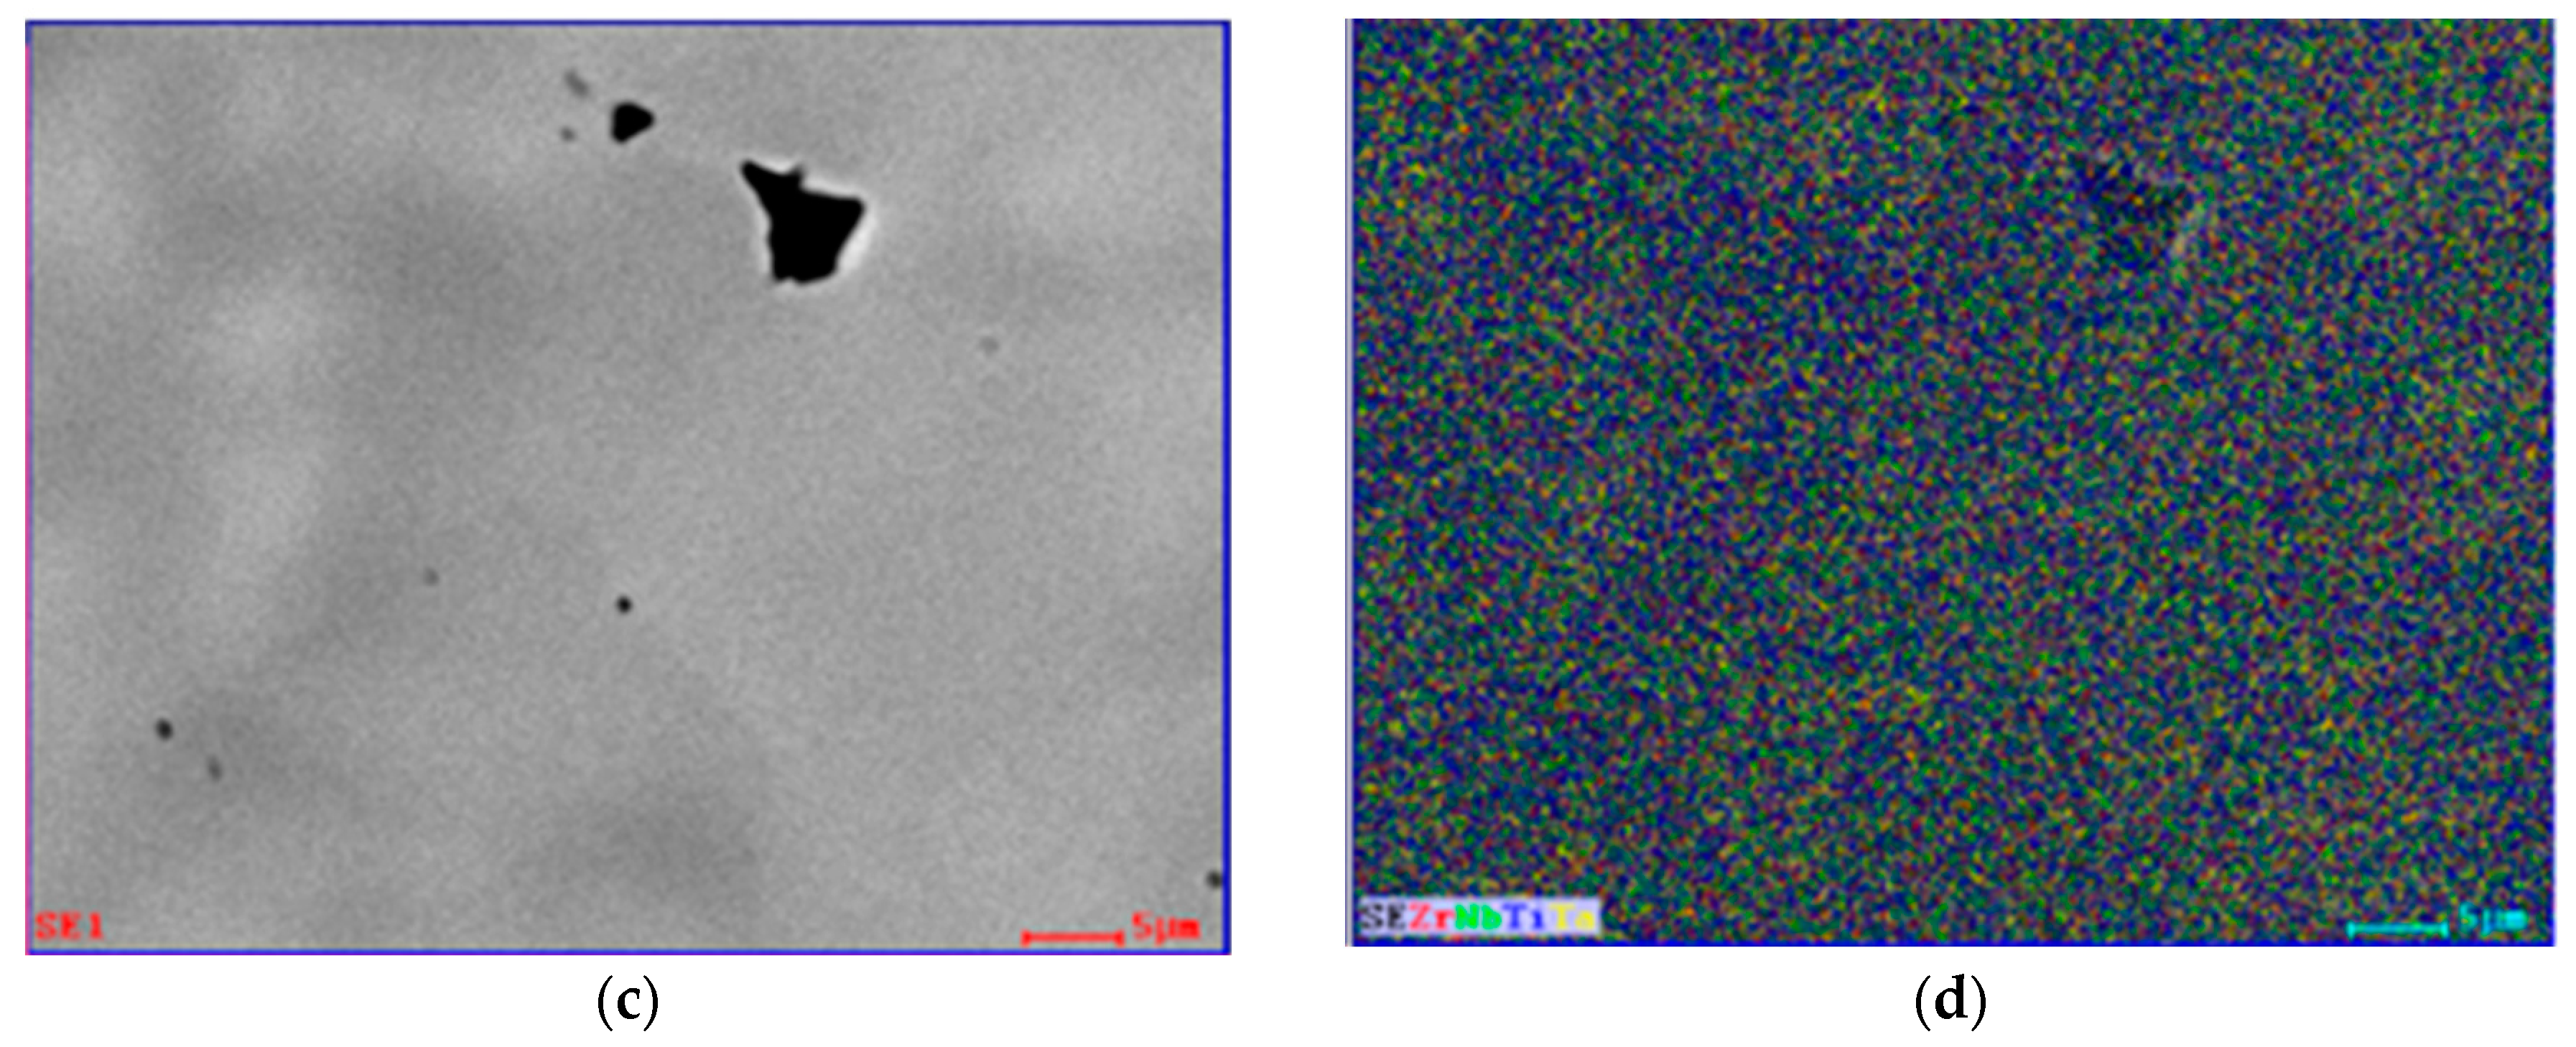
2.3. Microstructure and Mechanical Prorpietes Characterization
2.4. Densification Model
3. Results
- ❖
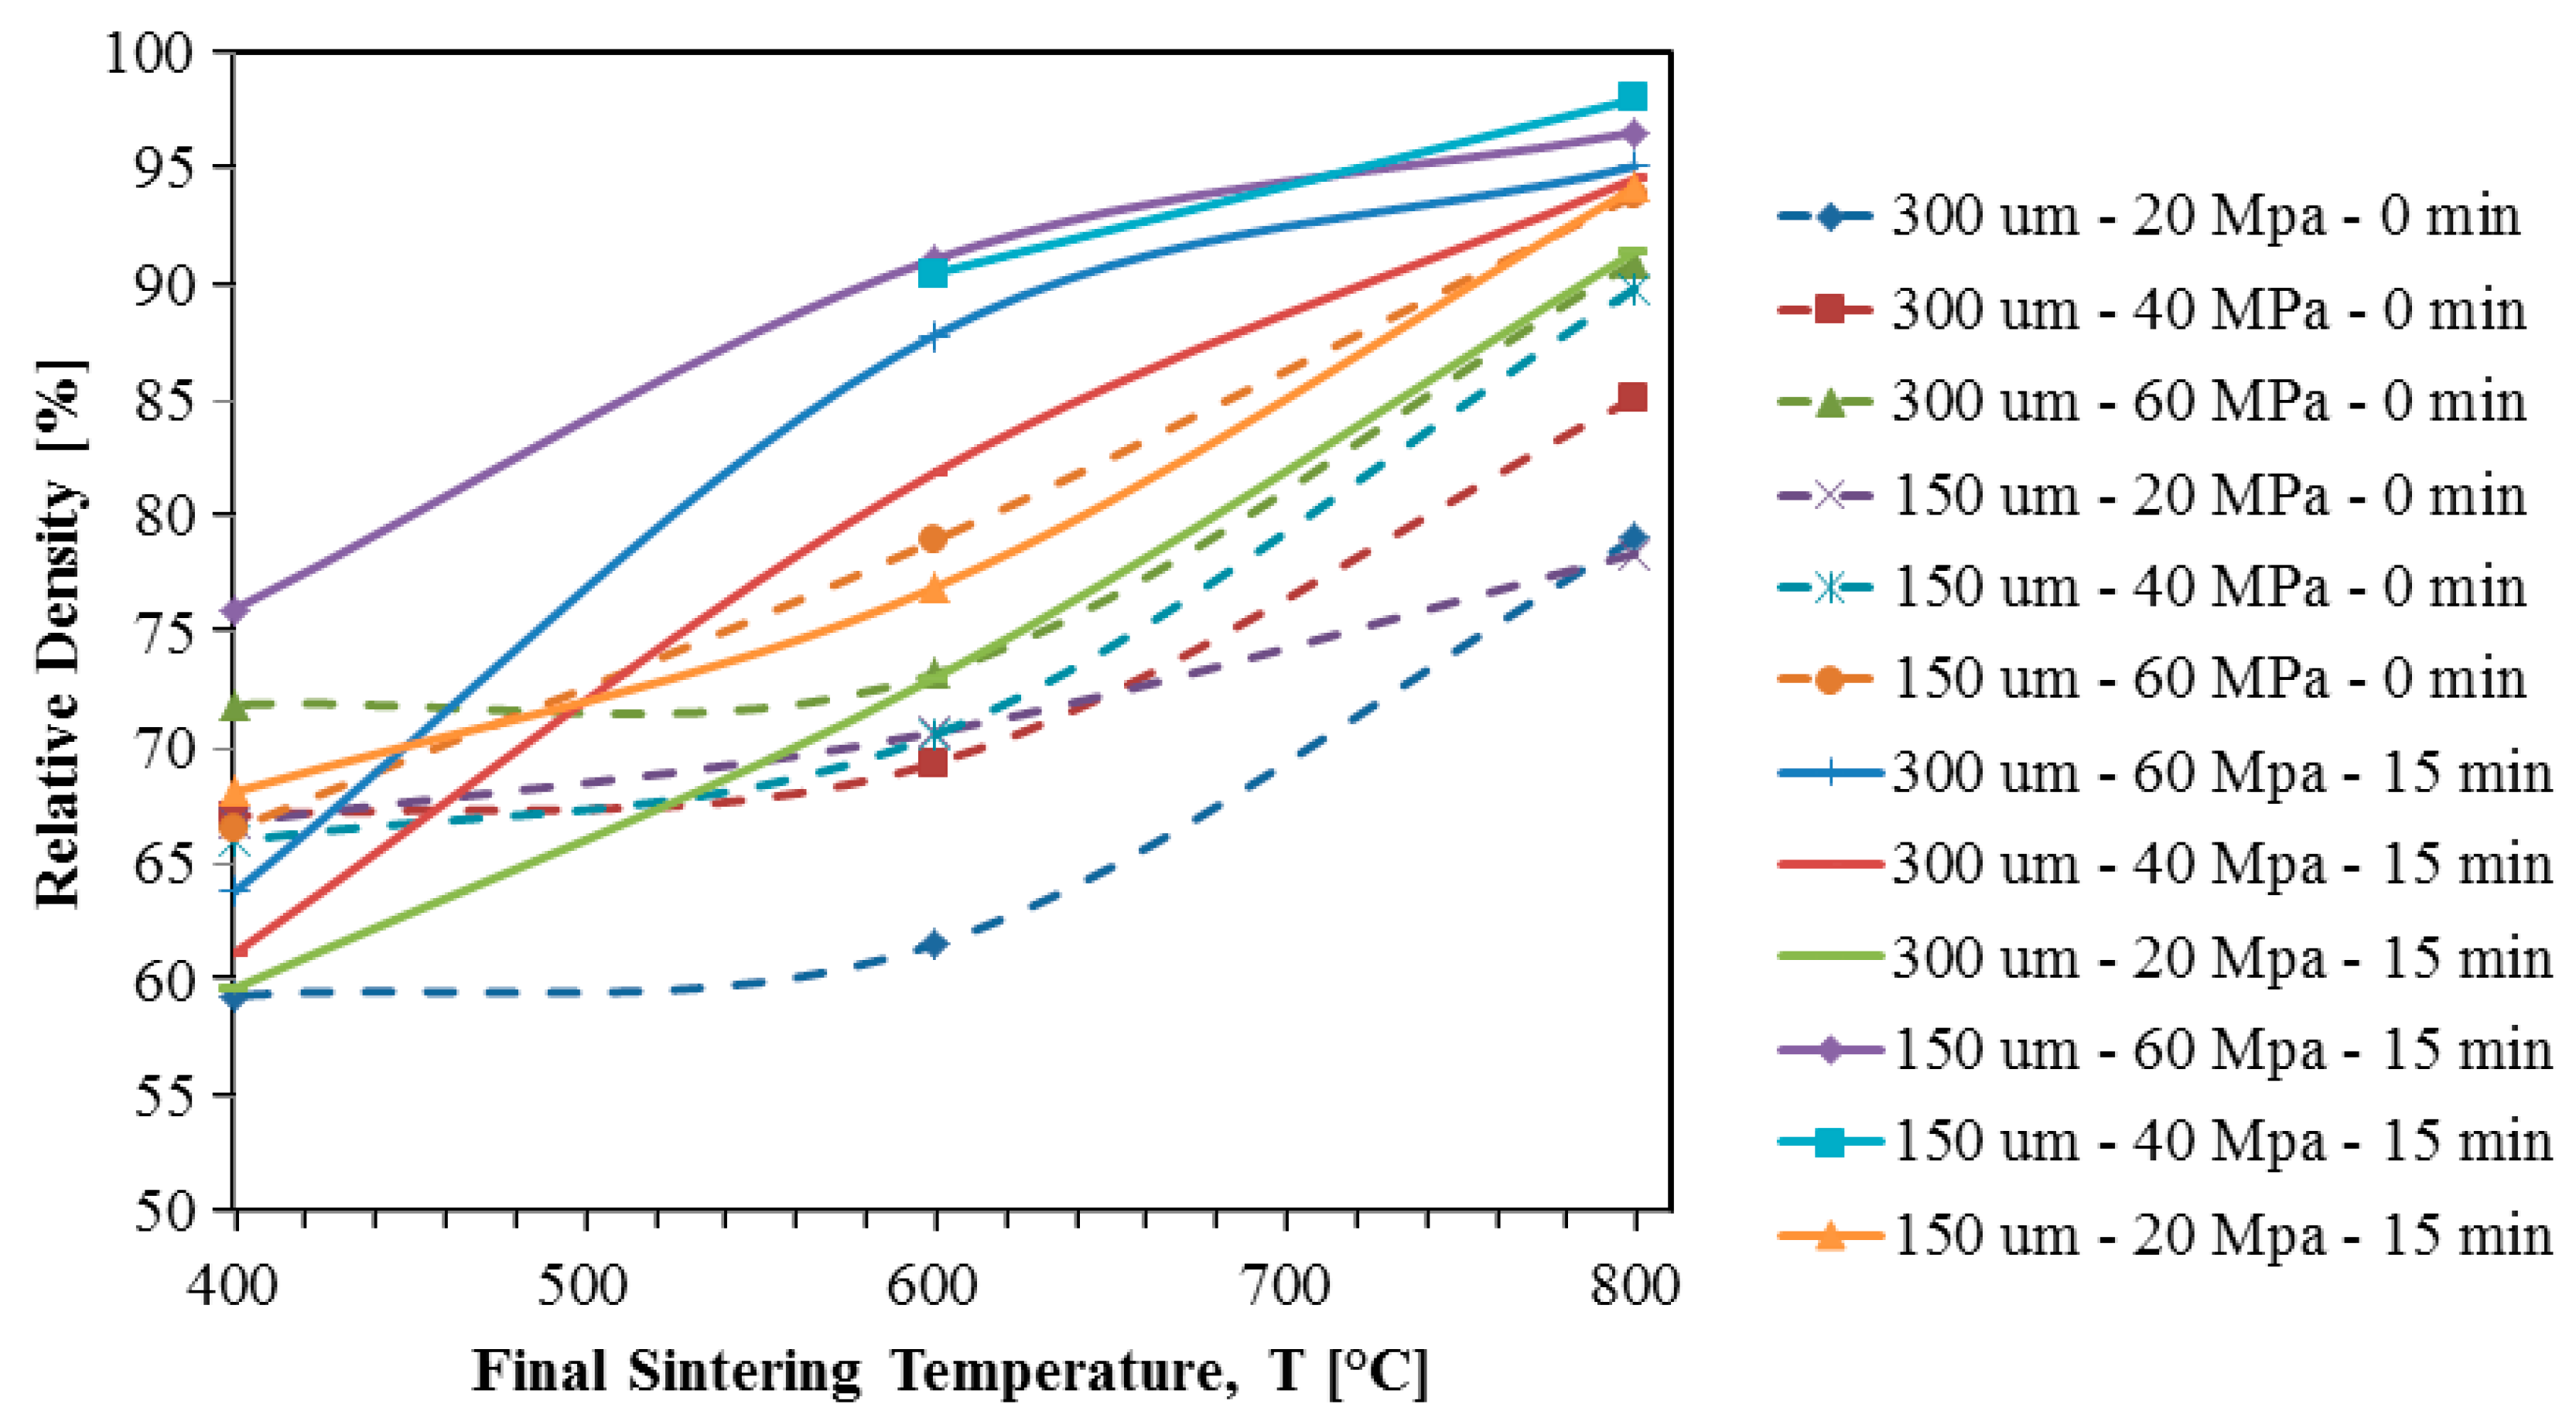
- Increasing the sintering temperature should increase the final sample density [29];
- ❖
- Increasing the sintering pressure should increase the final sample density [29];
- ❖
- Increasing the holding time should increase the final sample density [32];
- ❖
- Decreasing the initial particle size should increase the final sample density [33];
- ❖
- Using designed particle distributions can be employed to tune the compaction density [31].
4. Conclusions
Acknowledgments
Author Contributions
Conflicts of Interest
References
- Spriggs, R.M. Expression for Effect of Porosity on Elastic Modulus of Polycrystalline Refractory Materials, Particularly Aluminum Oxide. J. Am. Ceram. Soc. 1961, 44, 628–629. [Google Scholar] [CrossRef]
- Kawai, C.; Yamakawa, A. Effect of Porosity and Microstructure on the Strength of Si3N4: Designed Microstructure for High Strength, High Thermal Shock Resistance, and Facile Machining. J. Am. Ceram. Soc. 1997, 80, 2705–2708. [Google Scholar] [CrossRef]
- Coble, R.L.; Kingery, W.D. Effect of Porosity on Physical Properties of Sintered Alumina. J. Am. Ceram. Soc. 1956, 39, 377–385. [Google Scholar] [CrossRef]
- Knudsen, F.P. Dependence of Mechanical Strength of Brittle Polycrystalline Specimens on Porosity and Grain Size. J. Am. Ceram. Soc. 1959, 42, 376–387. [Google Scholar] [CrossRef]
- Robertson, D.M.; St Pierre, L.; Chahal, R. Preliminary observations of bone ingrowth into porous materials. J. Biomed. Mater. Res. A 1976, 10, 335–344. [Google Scholar] [CrossRef] [PubMed]
- Head, W.C.; Bauk, D.J.; Emerson, R.H., Jr. Titanium as the material of choice for cementless femoral components in total hip arthroplasty. Clin. Orthop. Relat. Res. 1995, 311, 85–90. [Google Scholar]
- Bandyopadhyay, A.; Espana, F.; Balla, V.K.; Bose, S.; Ohgami, Y.; Davies, N.M. Influence of porosity on mechanical properties and in vivo response of Ti-6Al-4V implants. Acta Biomater. 2010, 6, 1640–1648. [Google Scholar] [CrossRef] [PubMed]
- Cameron, H.U.; Macnab, I.; Pilliar, R.M. A porous metal system for joint replacement surgery. Int. J. Artif. Organs 1978, 1, 104–109. [Google Scholar] [PubMed]
- Evin, M.P.; Getter, L.; Adrian, J.; Cutright, D. Healing of periodontal defects with ceramic implants. J. Clin. Periodontol. 1974, 1, 197–205. [Google Scholar] [CrossRef]
- Grandjean-Laquerriere, A.; Laquerriere, P.; Guenounou, M.; Laurent-Maquin, D.; Phillips, T.M. Importance of the surface area ratio on cytokines production by human monocytes in vitro induced by various hydroxyapatite particles. Biomaterials 2005, 26, 2361–2369. [Google Scholar] [CrossRef] [PubMed]
- Laquerriere, P.; Grandjean-Laquerriere, A.; Jallot, E.; Balossier, G.; Frayssinet, P.; Guenounou, M. Importance of hydroxyapatite particles characteristics on cytokines production by human monocytes in vitro. Biomaterials 2003, 24, 2739–2747. [Google Scholar] [CrossRef]
- Yablon, I.G. The Effect of Methylmethacrylate on Fracture Healing. Clin. Orthop. Relat. Res. 1975, 114, 358–363. [Google Scholar] [CrossRef]
- Revell, P.A.; Braden, M.; Freeman, M.A.R. Review of the biological response to a novel bone cement containing poly(ethyl methacrylate) and n-butyl methacrylate. Biomaterials 1998, 19, 1579–1586. [Google Scholar] [CrossRef]
- El-Warrak, A.O.; Olmstead, M.; Schneider, R.; Meinel, L.; Bettschart-Wolfisberger, R.; Akens, M.K.; Auer, J.; Von Rechenberg, B. An experimental animal model of aseptic loosening of hip prostheses in sheep to study early biochemical changes at the interface membrane. BMC Musculoskelet. Disord. 2004, 5, 1–13. [Google Scholar] [CrossRef] [PubMed] [Green Version]
- El-Warrak, A.O.; Olmstead, M.L.; von Rechenberg, B.; Auer, J.A. A Review of Aseptic Loosening in Total Hip Arthroplasty. Vet. Comp. Orthop. Traumatol. 2002, 14, 115–124. [Google Scholar]
- Taniguchi, N.; Fujibayashi, S.; Takemoto, M.; Sasaki, K.; Otsuki, B.; Nakamura, T.; Matsushita, T.; Kokubo, T.; Matsuda, S. Effect of pore size on bone ingrowth into porous titanium implants fabricated by additive manufacturing: An in vivo experiment. Mater. Sci. Eng. C 2016, 59, 690–701. [Google Scholar] [CrossRef] [PubMed]
- Nag, S.; Banerjee, R.; Fraser, H.L. Microstructural evolution and strengthening mechanisms in Ti–Nb–Zr–Ta, Ti–Mo–Zr–Fe and Ti–15Mo biocompatible alloys. Mater. Sci. Eng. C 2005, 25, 357–362. [Google Scholar] [CrossRef]
- Özcan, M.; Hämmerle, C. Titanium as a Reconstruction and Implant Material in Dentistry: Advantages and Pitfalls. Materials 2012, 5, 1528–1545. [Google Scholar] [CrossRef] [Green Version]
- Niinomi, M. Recent metallic materials for biomedical applications. Metall. Mater. Trans. A 2002, 33, 477–486. [Google Scholar] [CrossRef]
- Hendrickson, M.; Mantri, S.A.; Ren, Y.; Alam, T.; Soni, V.; Gwalani, B.; Styles, M.; Choudhuri, D.; Banerjee, R. The evolution of microstructure and microhardness in a biomedical Ti-35Nb-7Zr-5Ta alloy. J. Mater. Sci. 2017, 52, 3062–3073. [Google Scholar] [CrossRef]
- Kuroda, D.; Niinomi, M.; Morinaga, M.; Kato, Y.; Yashiro, T. Design and mechanical properties of new β type titanium alloys for implant materials. Mater. Sci. Eng. A 1998, 243, 244–249. [Google Scholar] [CrossRef]
- Niinomi, M.; Kuroda, D.; Fukunaga, K.; Morinaga, M.; Kato, Y.; Yashiro, T.; Suzuki, A. Corrosion wear fracture of new β type biomedical titanium alloys. Mater. Sci. Eng. A 1999, 263, 193–199. [Google Scholar] [CrossRef]
- Niinomi, M. Mechanical properties of biomedical titanium alloys. Mater. Sci. Eng. A 1998, 243, 231–236. [Google Scholar] [CrossRef]
- Taddei, E.B.; Henriques, V.A.R.; Silva, C.R.M.; Cairo, C.A.A. Production of new titanium alloy for orthopedic implants. Mater. Sci. Eng. C 2004, 24, 683–687. [Google Scholar] [CrossRef]
- Hutmacher, D.W. Scaffolds in tissue engineering bone and cartilage. Biomaterials 2000, 21, 2529–2543. [Google Scholar] [CrossRef]
- Ryan, G.; Pandit, A.; Apatsidis, D.P. Fabrication methods of porous metals for use in orthopaedic applications. Biomaterials 2006, 27, 2651–2670. [Google Scholar] [CrossRef] [PubMed]
- Li, Y.H.; Yang, C.; Wang, F.; Zhao, H.D.; Qu, S.G.; Li, X.Q.; Zhang, W.W.; Li, Y.Y. Biomedical TiNbZrTaSi alloys designed by d-electron alloy design theory. Mater. Des. 2015, 85, 7–13. [Google Scholar] [CrossRef]
- Bordia, R.K.; Kang, S.-J.L.; Olevsky, E.A. Current understanding and future research directions at the onset of the next century of sintering science and technology. J. Am. Ceram. Soc. 2017, 100, 2314–2352. [Google Scholar] [CrossRef]
- Wei, X.; Maximenko, A.L.; Back, C.; Izhvanov, O.; Olevsky, E.A. Effects of loading modes on densification efficiency of spark plasma sintering: Sample study of zirconium carbide consolidation. Philos. Mag. Lett. 2017, 97, 265–272. [Google Scholar] [CrossRef]
- Bellosi, A.; Monteverde, F.; Sciti, D. Fast Densification of Ultra-high-temperature ceramics by spark plasma sintering. Int. J. Appl. Ceram. Technol. 2006, 3, 32–40. [Google Scholar] [CrossRef]
- Petersen, A.S.; Cheung, A.M.; Neilson, H.J.; Poon, S.J.; Shiflet, G.J.; Lewandowski, J.J. Processing and properties of Ni-based bulk metallic glass via spark plasma sintering of pulverized amorphous ribbons. Mater. Res. Soc. Adv. 2017, 1–6. [Google Scholar] [CrossRef]
- Ghasali, E.; Fazili, A.; Alizadeh, M.; Shirvanimoghaddam, K.; Ebadzadeh, T. Evaluation of Microstructure and Mechanical Properties of Al-TiC Metal Matrix Composite Prepared by Conventional, Microwave and Spark Plasma Sintering Methods. Materials 2017, 10, 1255. [Google Scholar] [CrossRef] [PubMed]
- Olevsky, E.A. Theory of sintering: From discrete to continuum. Mater. Sci. Eng. R Rep. 1998, 23, 41–100. [Google Scholar] [CrossRef]
- Lee, G.; McKittrick, J.; Ivanov, E.; Olevsky, E.A. Densification mechanism and mechanical properties of tungsten powder consolidated by spark plasma sintering. Int. J. Refract. Met. Hard Mater. 2016, 61, 22–29. [Google Scholar] [CrossRef]
- Ashby, M.F. HIP 6.0 Background Reading; University Of Cambridge: Cambridge, UK, 1990. [Google Scholar]
- Kun, W.; Zhengyi, F.; Weimin, W.; Yucheng, W.; Jinyong, Z.; Qingjie, Z. Study on fabrication and mechanism in of porous metals by spark plasma sintering. J. Mater. Sci. 2007, 42, 302–306. [Google Scholar] [CrossRef]
- Coble, R.L. Effects of Particle-Size Distribution in Initial-Stage Sintering. J. Am. Ceram. Soc. 1973, 56, 461–466. [Google Scholar] [CrossRef]
- Revankar, G.; Saxena, A.; Voorhees, H.; Ritchie, R.; Shapiro, E.; Walsh, R.; Robinson, R.; Shoberg, R.S.; Waterhouse, R.; Roos, E.; et al. Harness Testing. Mechanical Testing and Evaluation, 1st ed.; ASM International Press: Materials Park, OH, USA, 2000; Volume 8, pp. 282–287. [Google Scholar]
- Nakai, M.; Niinomi, M.; Akahori, T.; Tsutsumi, H.; Ogawa, M. Effect of Oxygen Content on Microstructure and Mechanical Properties of Biomedical Ti-29Nb-13Ta-4.6Zr Alloy under Solutionized and Aged Conditions. Mater. Trans. 2009, 50, 2716–2720. [Google Scholar] [CrossRef]
- Kopova, I.; Stráský, J.; Harcuba, P.; Landa, M.; Janeček, M.; Bačákova, L. Newly developed Ti–Nb–Zr–Ta–Si–Fe biomedical beta titanium alloys with increased strength and enhanced biocompatibility. Mater. Sci. Eng. C 2016, 60, 230–238. [Google Scholar] [CrossRef] [PubMed]
- Paneto, F.J.; Pereira, J.L.; Lima, J.O.; Jesus, E.J.; Silva, L.A.; Lima, E.S.; Cabral, R.F.; Santos, C. Effect of porosity on hardness of Al2O3–Y3Al5O12 ceramic composite. Int. J. Refract. Met. Hard Mater. 2015, 48, 365–368. [Google Scholar] [CrossRef]
- Wei, X.; Back, C.; Izhvanov, O.; Haines, C.D.; Olevsky, E.A. Zirconium carbide produced by spark plasma sintering and hot pressing: Densification kinetics, grain growth, and thermal properties. Materials 2016, 9, 577. [Google Scholar] [CrossRef] [PubMed]
- Manière, C.; Olevsky, E.A. Porosity Dependence of Powder Compaction Constitutive Parameters: Determination Based on Spark Plasma Sintering Tests. Scr. Mater. 2017, 141, 62–66. [Google Scholar] [CrossRef]
- Lee, G.; Olevsky, E.A.; Manière, C.; Maximenko, A.; Izhvanov, O.; Back, C.; McKittrick, J. Effect of electric current on densification behavior of conductive ceramic powders consolidated by spark plasma sintering. Acta Mater. 2018, 144, 524–533. [Google Scholar] [CrossRef]


| d (μm) | P (Mpa) | T (°C) | Q (kJ/mol) | m | R2 | Error |
|---|---|---|---|---|---|---|
| 300 | 20 | 400 | 153.91 | 0.23 | 0.741 | 0.052 |
| 600 | 154.00 | 0.23 | 0.989 | 0.001 | ||
| 800 | 131.37 | 0.23 | 0.987 | 0.007 | ||
| 40 | 400 | - | 0.23 | - | - | |
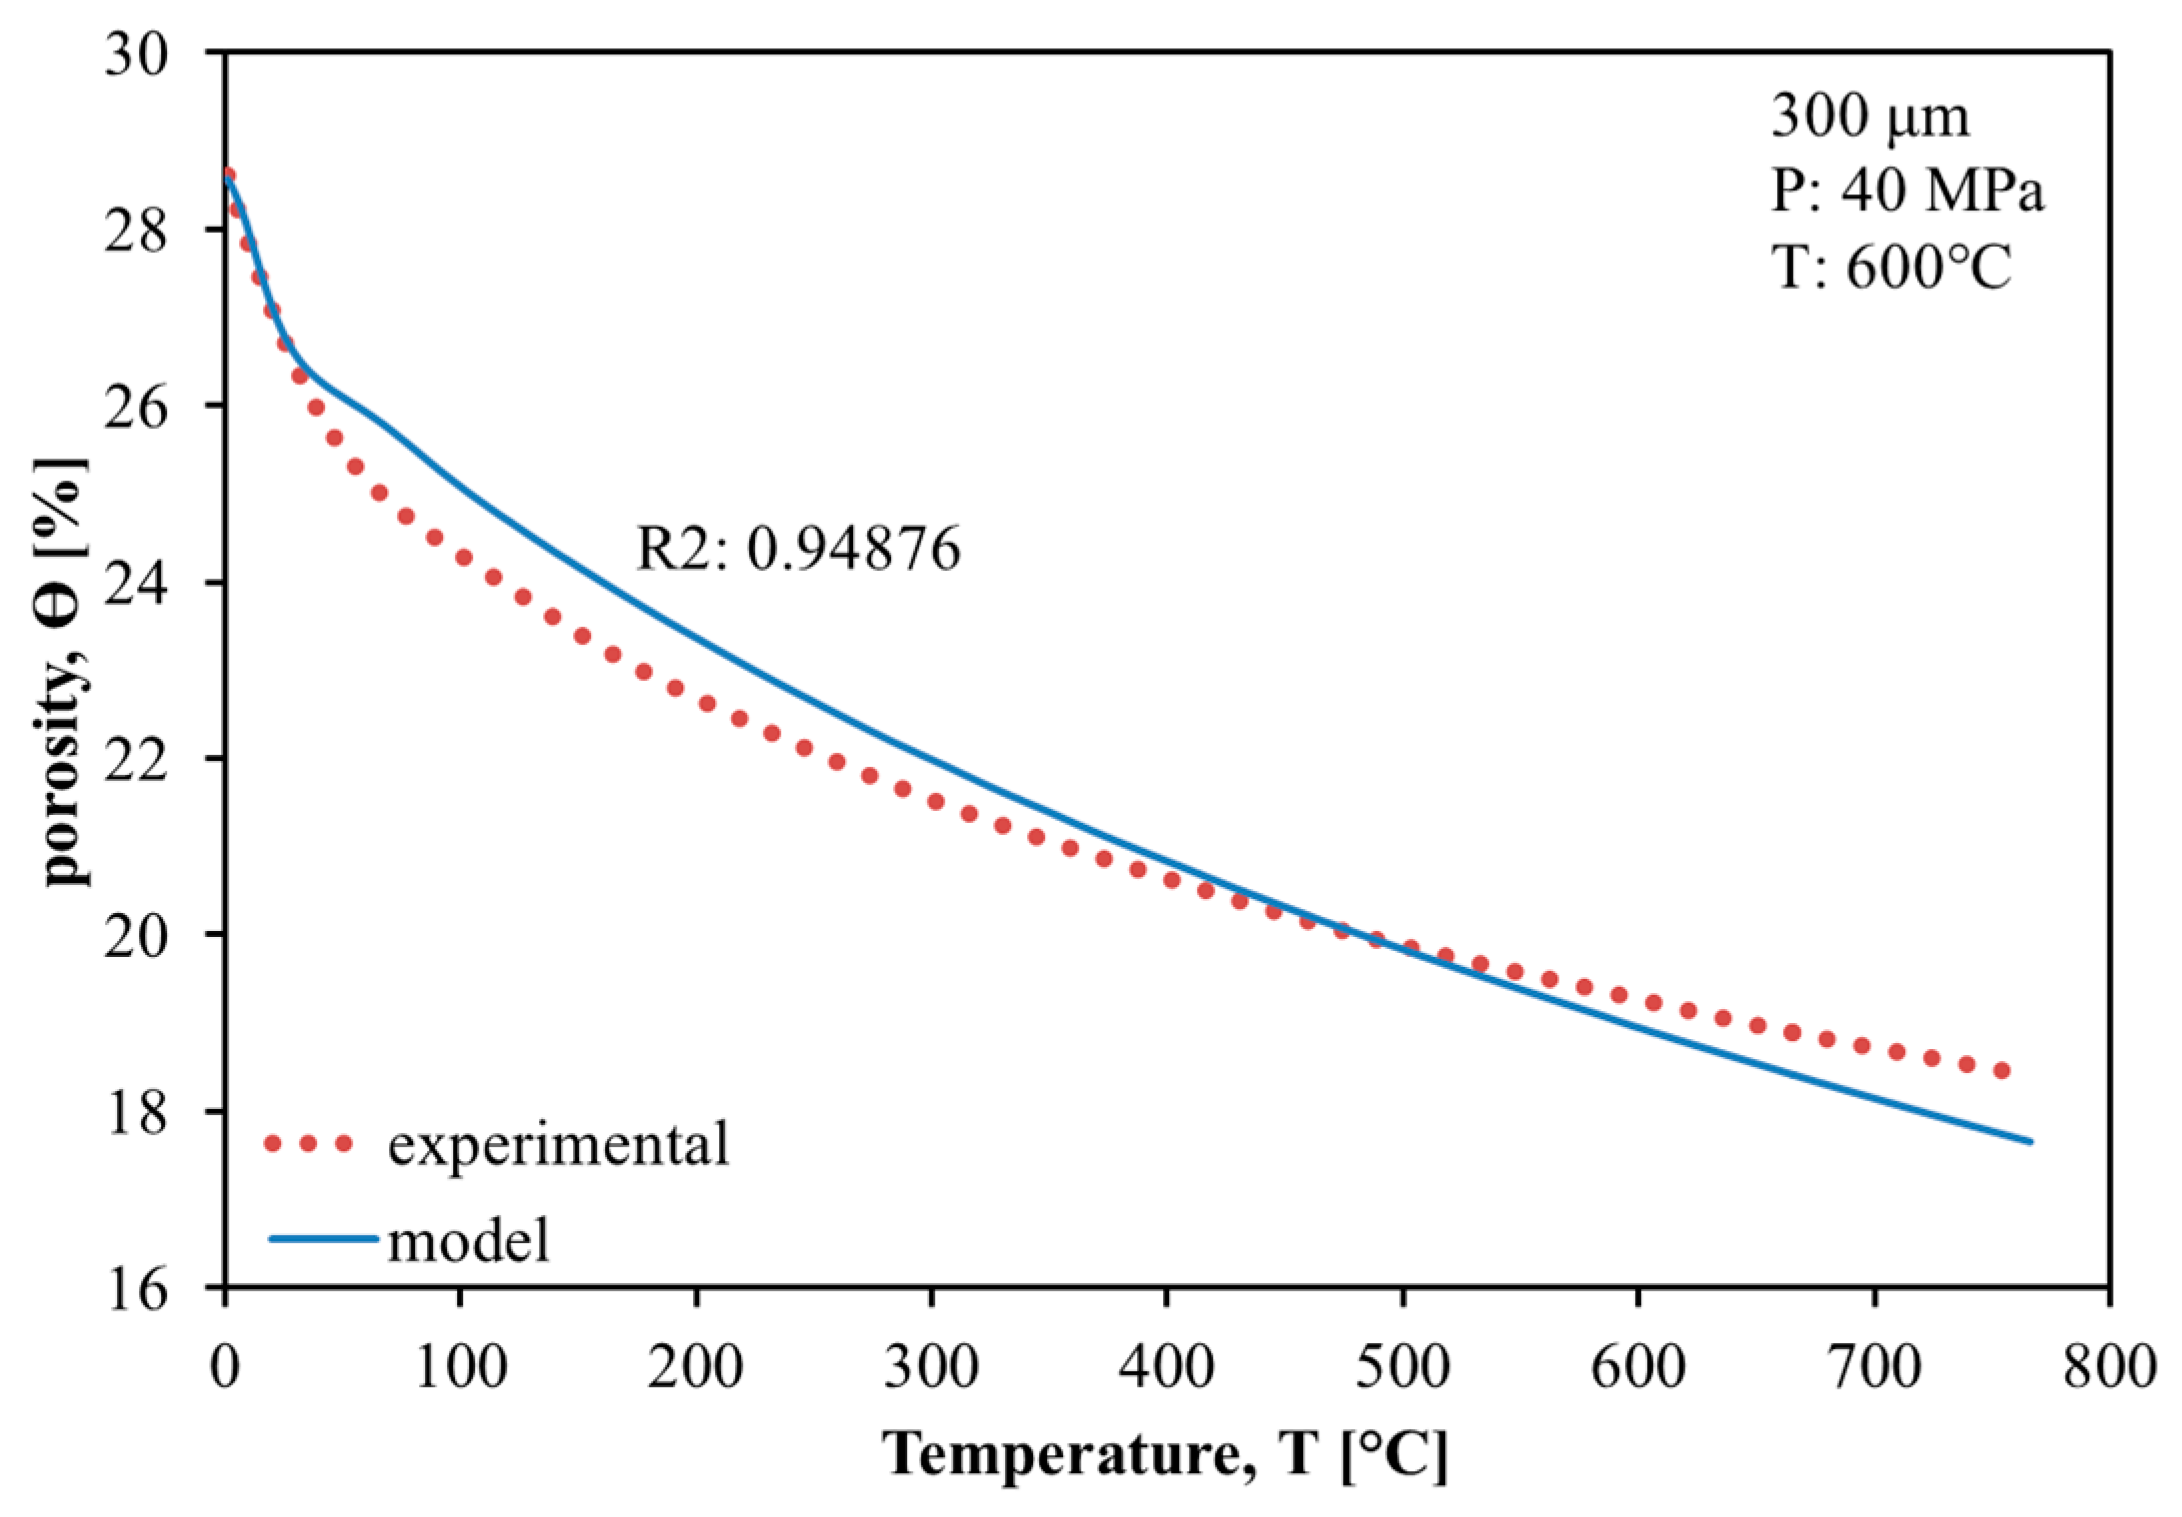
| 600 | 153.00 | 0.23 | 0.948 | 0.005 | ||
| 800 | - | 0.23 | - | -- | ||
| 60 | 400 | - | 0.23 | - | - | |
| 600 | 148.55 | 0.23 | 0.997 | 0.001 | ||
| 800 | - | 0.23 | - | - | ||
| 150 | 20 | 400 | - | 0.23 | - | - |
| 600 | - | 0.23 | - | - | ||
| 800 | 145.59 | 0.23 | 0.995 | 0.001 | ||
| 40 | 400 | - | 0.23 | - | - | |
| 600 | 141.65 | 0.23 | 0.997 | 0.001 | ||
| 800 | 149.15 | 0.23 | 0.949 | 0.001 | ||
| 60 | 400 | 153.89 | 0.23 | 0.824 | 0.0004 | |
| 600 | 146.23 | 0.23 | 0.996 | 0.001 | ||
| 800 | 144.87 | 0.23 | 2.699 | 0.006 |
© 2018 by the authors. Licensee MDPI, Basel, Switzerland. This article is an open access article distributed under the terms and conditions of the Creative Commons Attribution (CC BY) license (http://creativecommons.org/licenses/by/4.0/).
Share and Cite
Rechtin, J.; Torresani, E.; Ivanov, E.; Olevsky, E. Fabrication of Titanium-Niobium-Zirconium-Tantalium Alloy (TNZT) Bioimplant Components with Controllable Porosity by Spark Plasma Sintering. Materials 2018, 11, 181. https://doi.org/10.3390/ma11020181
Rechtin J, Torresani E, Ivanov E, Olevsky E. Fabrication of Titanium-Niobium-Zirconium-Tantalium Alloy (TNZT) Bioimplant Components with Controllable Porosity by Spark Plasma Sintering. Materials. 2018; 11(2):181. https://doi.org/10.3390/ma11020181
Chicago/Turabian StyleRechtin, Jack, Elisa Torresani, Eugene Ivanov, and Eugene Olevsky. 2018. "Fabrication of Titanium-Niobium-Zirconium-Tantalium Alloy (TNZT) Bioimplant Components with Controllable Porosity by Spark Plasma Sintering" Materials 11, no. 2: 181. https://doi.org/10.3390/ma11020181
APA StyleRechtin, J., Torresani, E., Ivanov, E., & Olevsky, E. (2018). Fabrication of Titanium-Niobium-Zirconium-Tantalium Alloy (TNZT) Bioimplant Components with Controllable Porosity by Spark Plasma Sintering. Materials, 11(2), 181. https://doi.org/10.3390/ma11020181