Highly-Bioreactive Silica-Based Mesoporous Bioactive Glasses Enriched with Gallium(III)

 ,
,  , ,
, , 
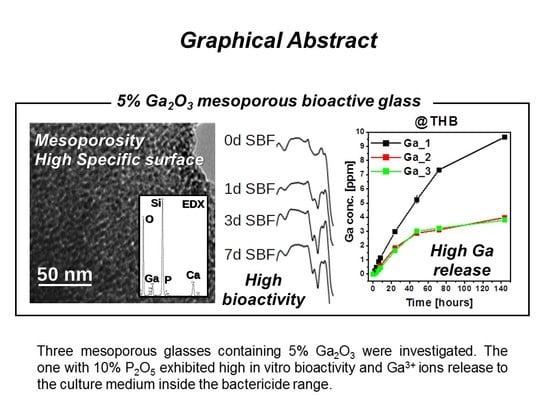
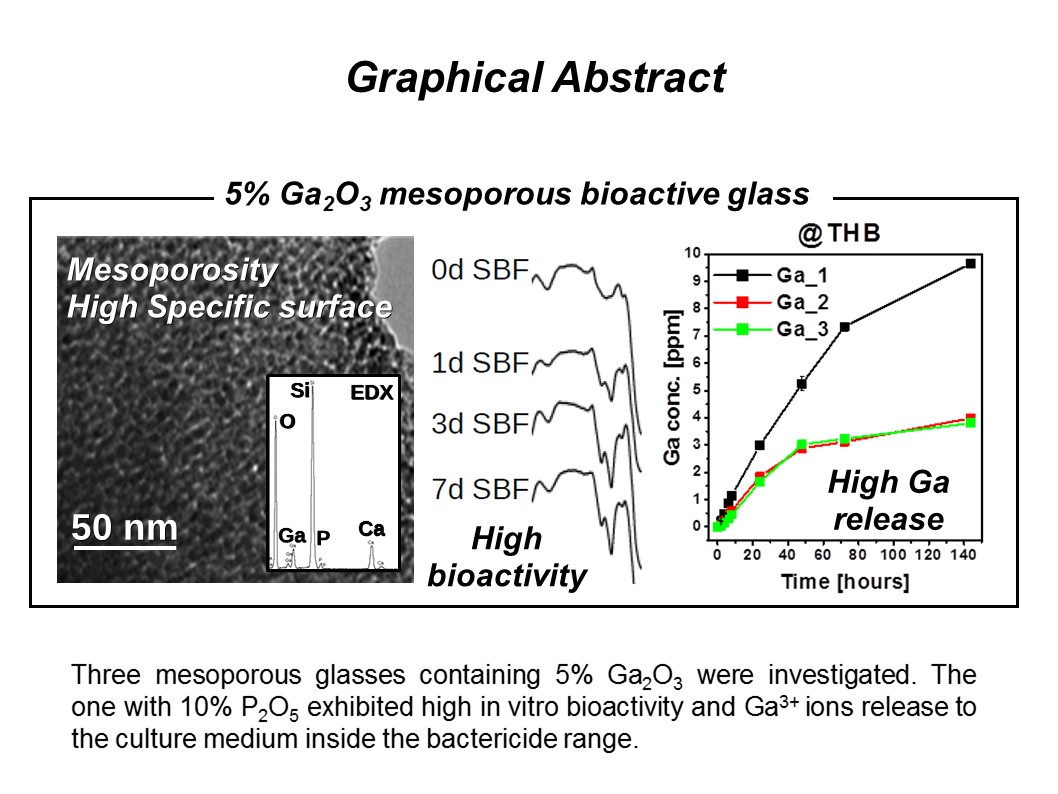
Abstract
:
1. Introduction
2. Results
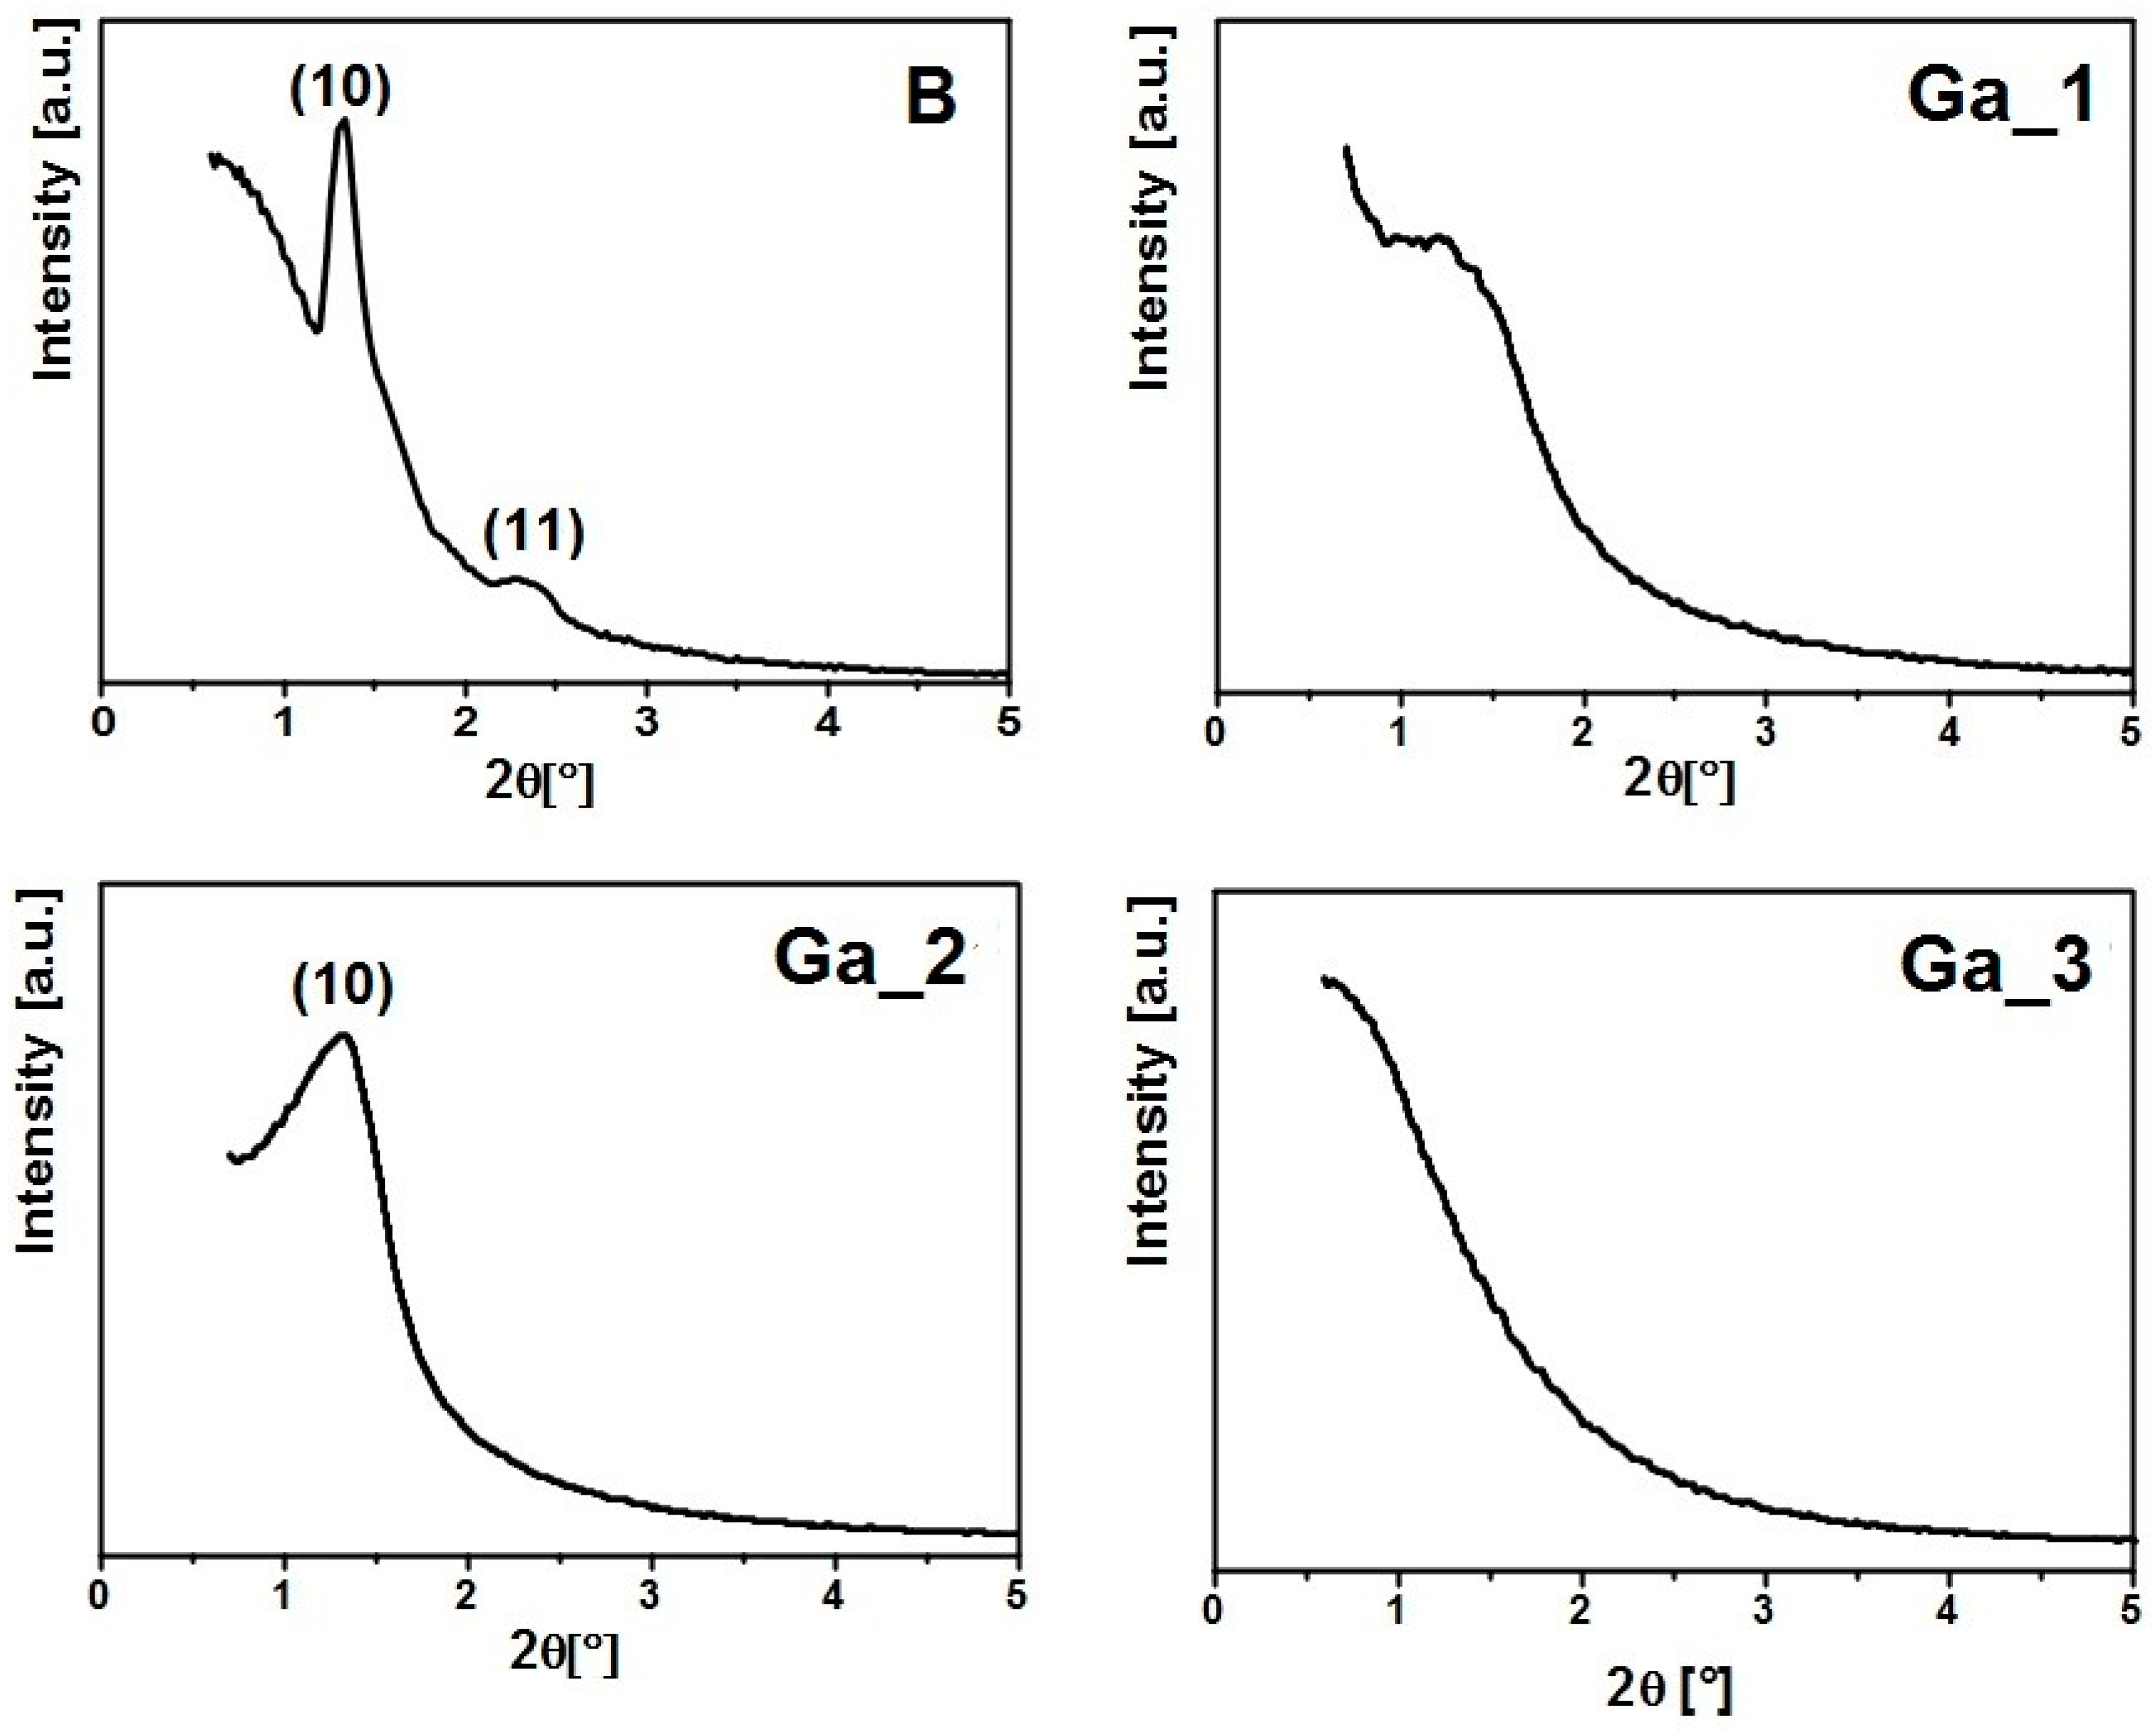
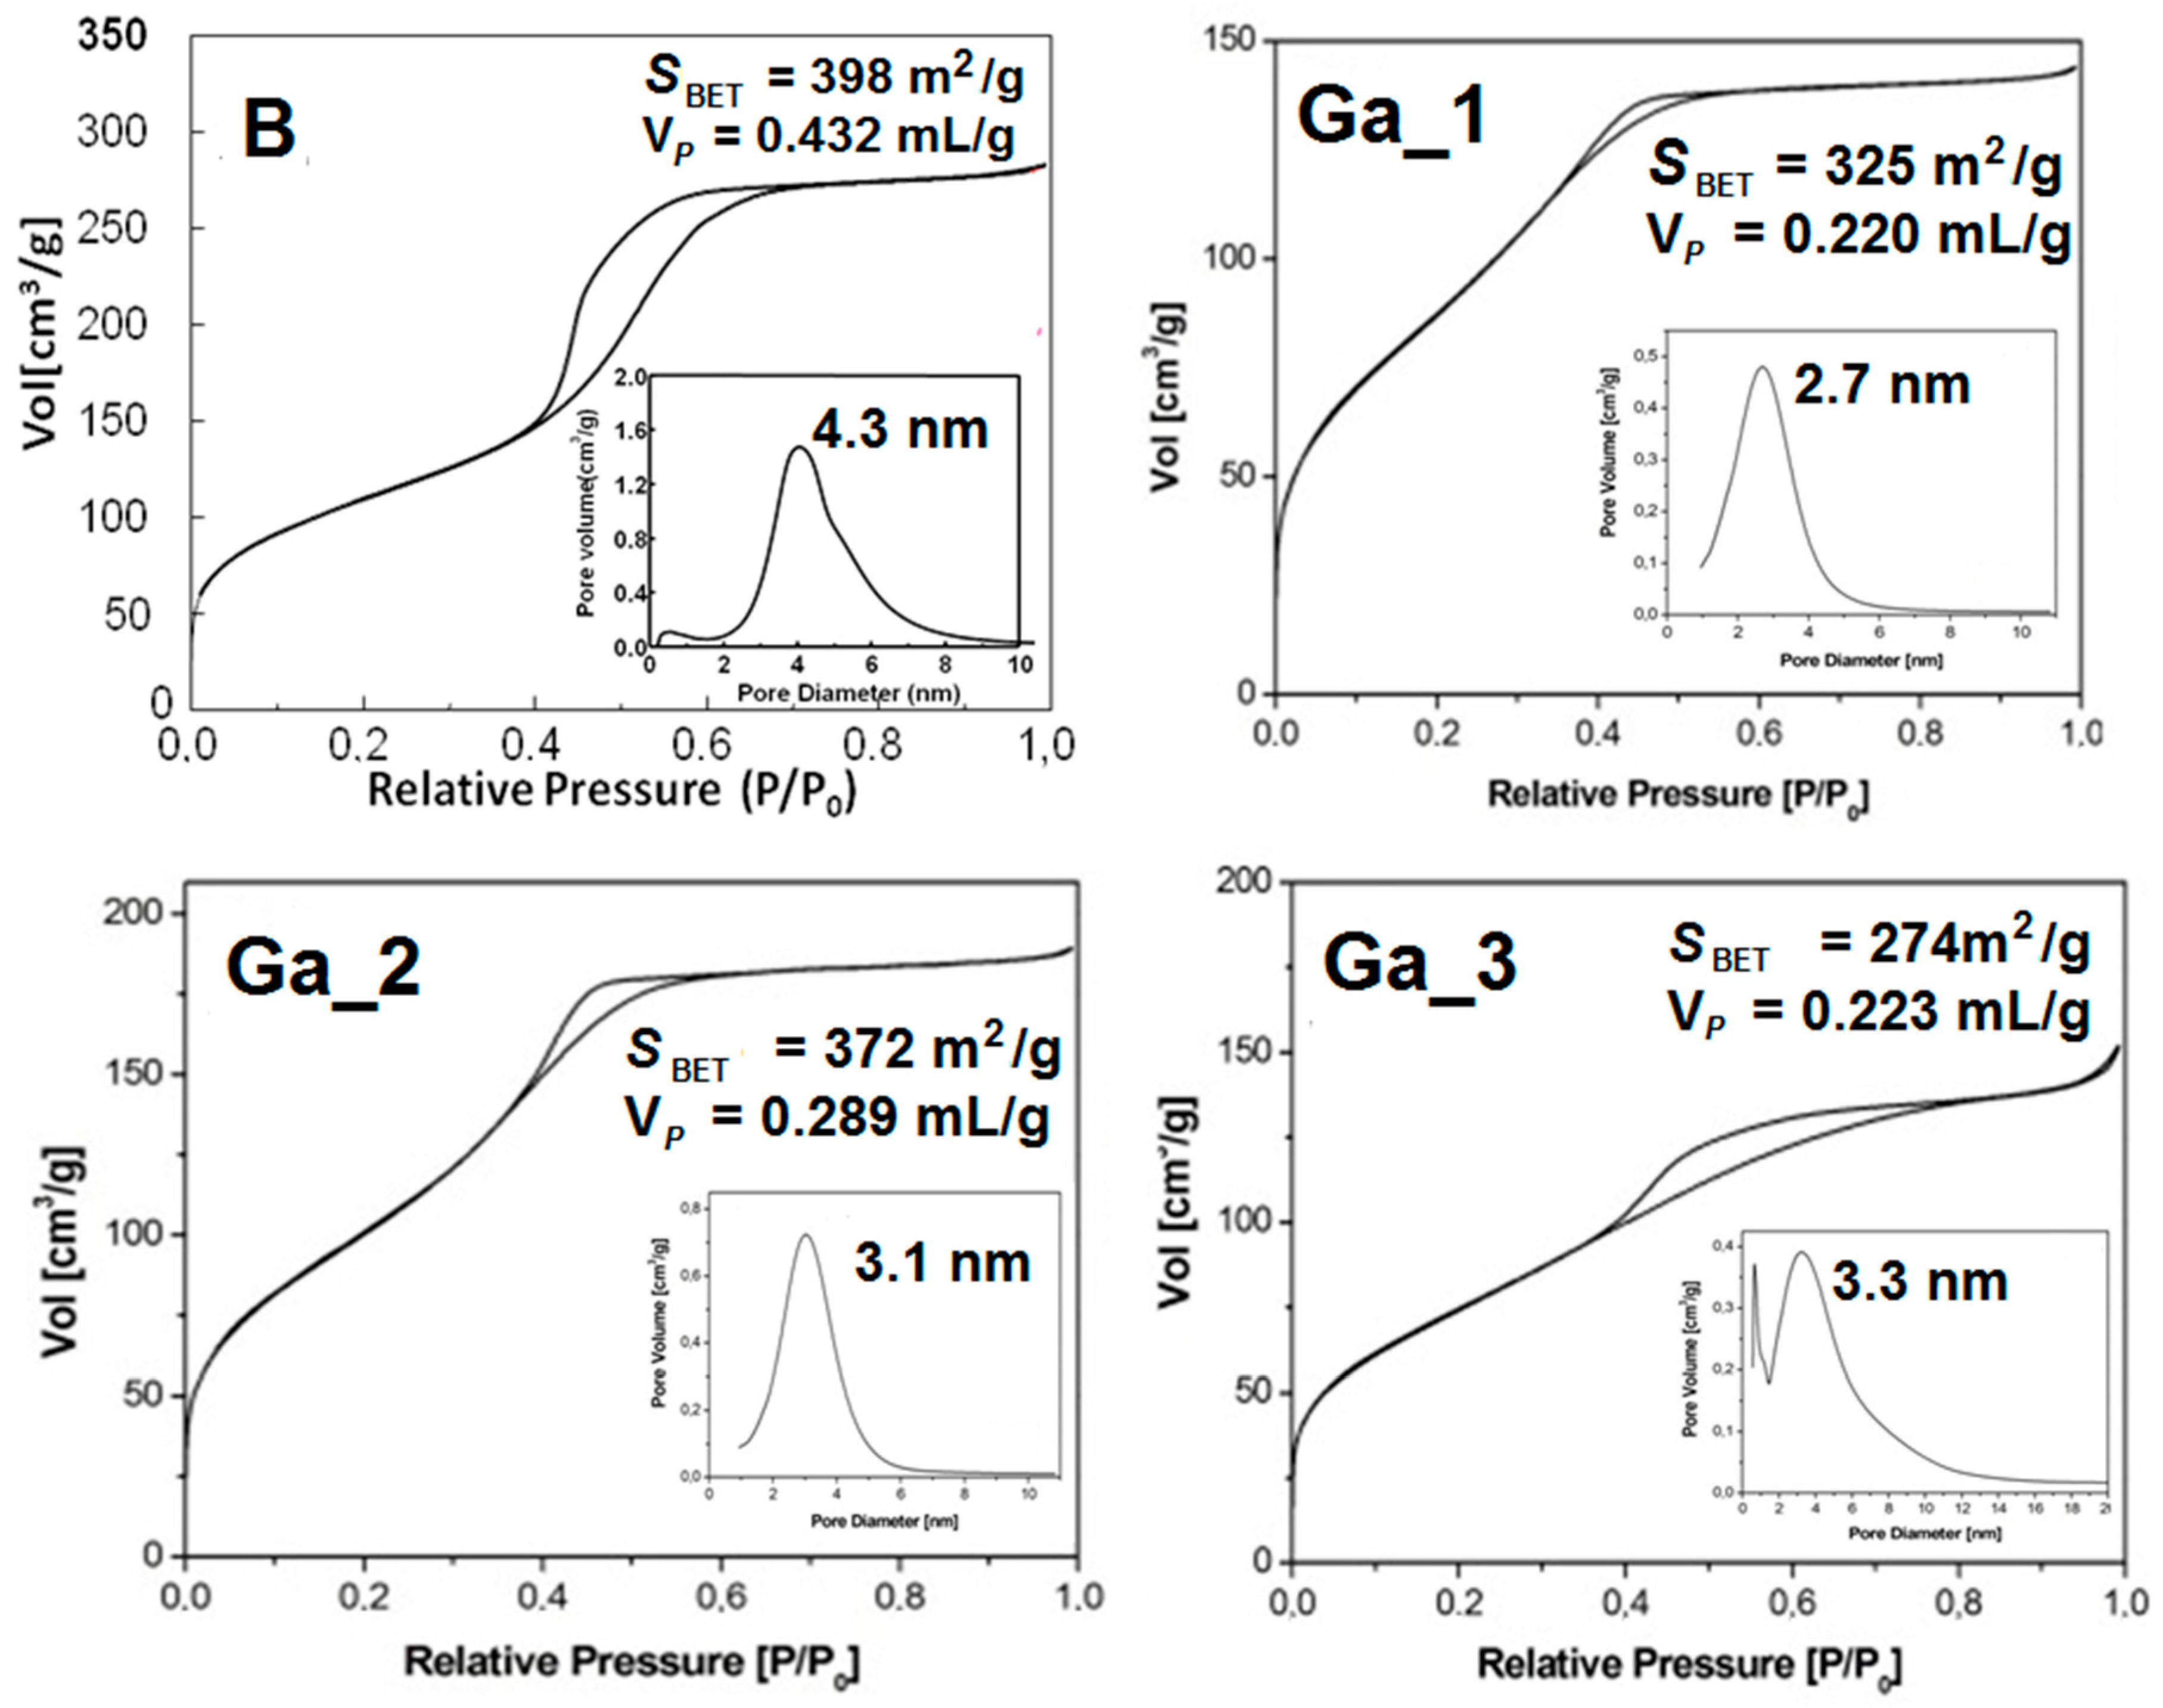
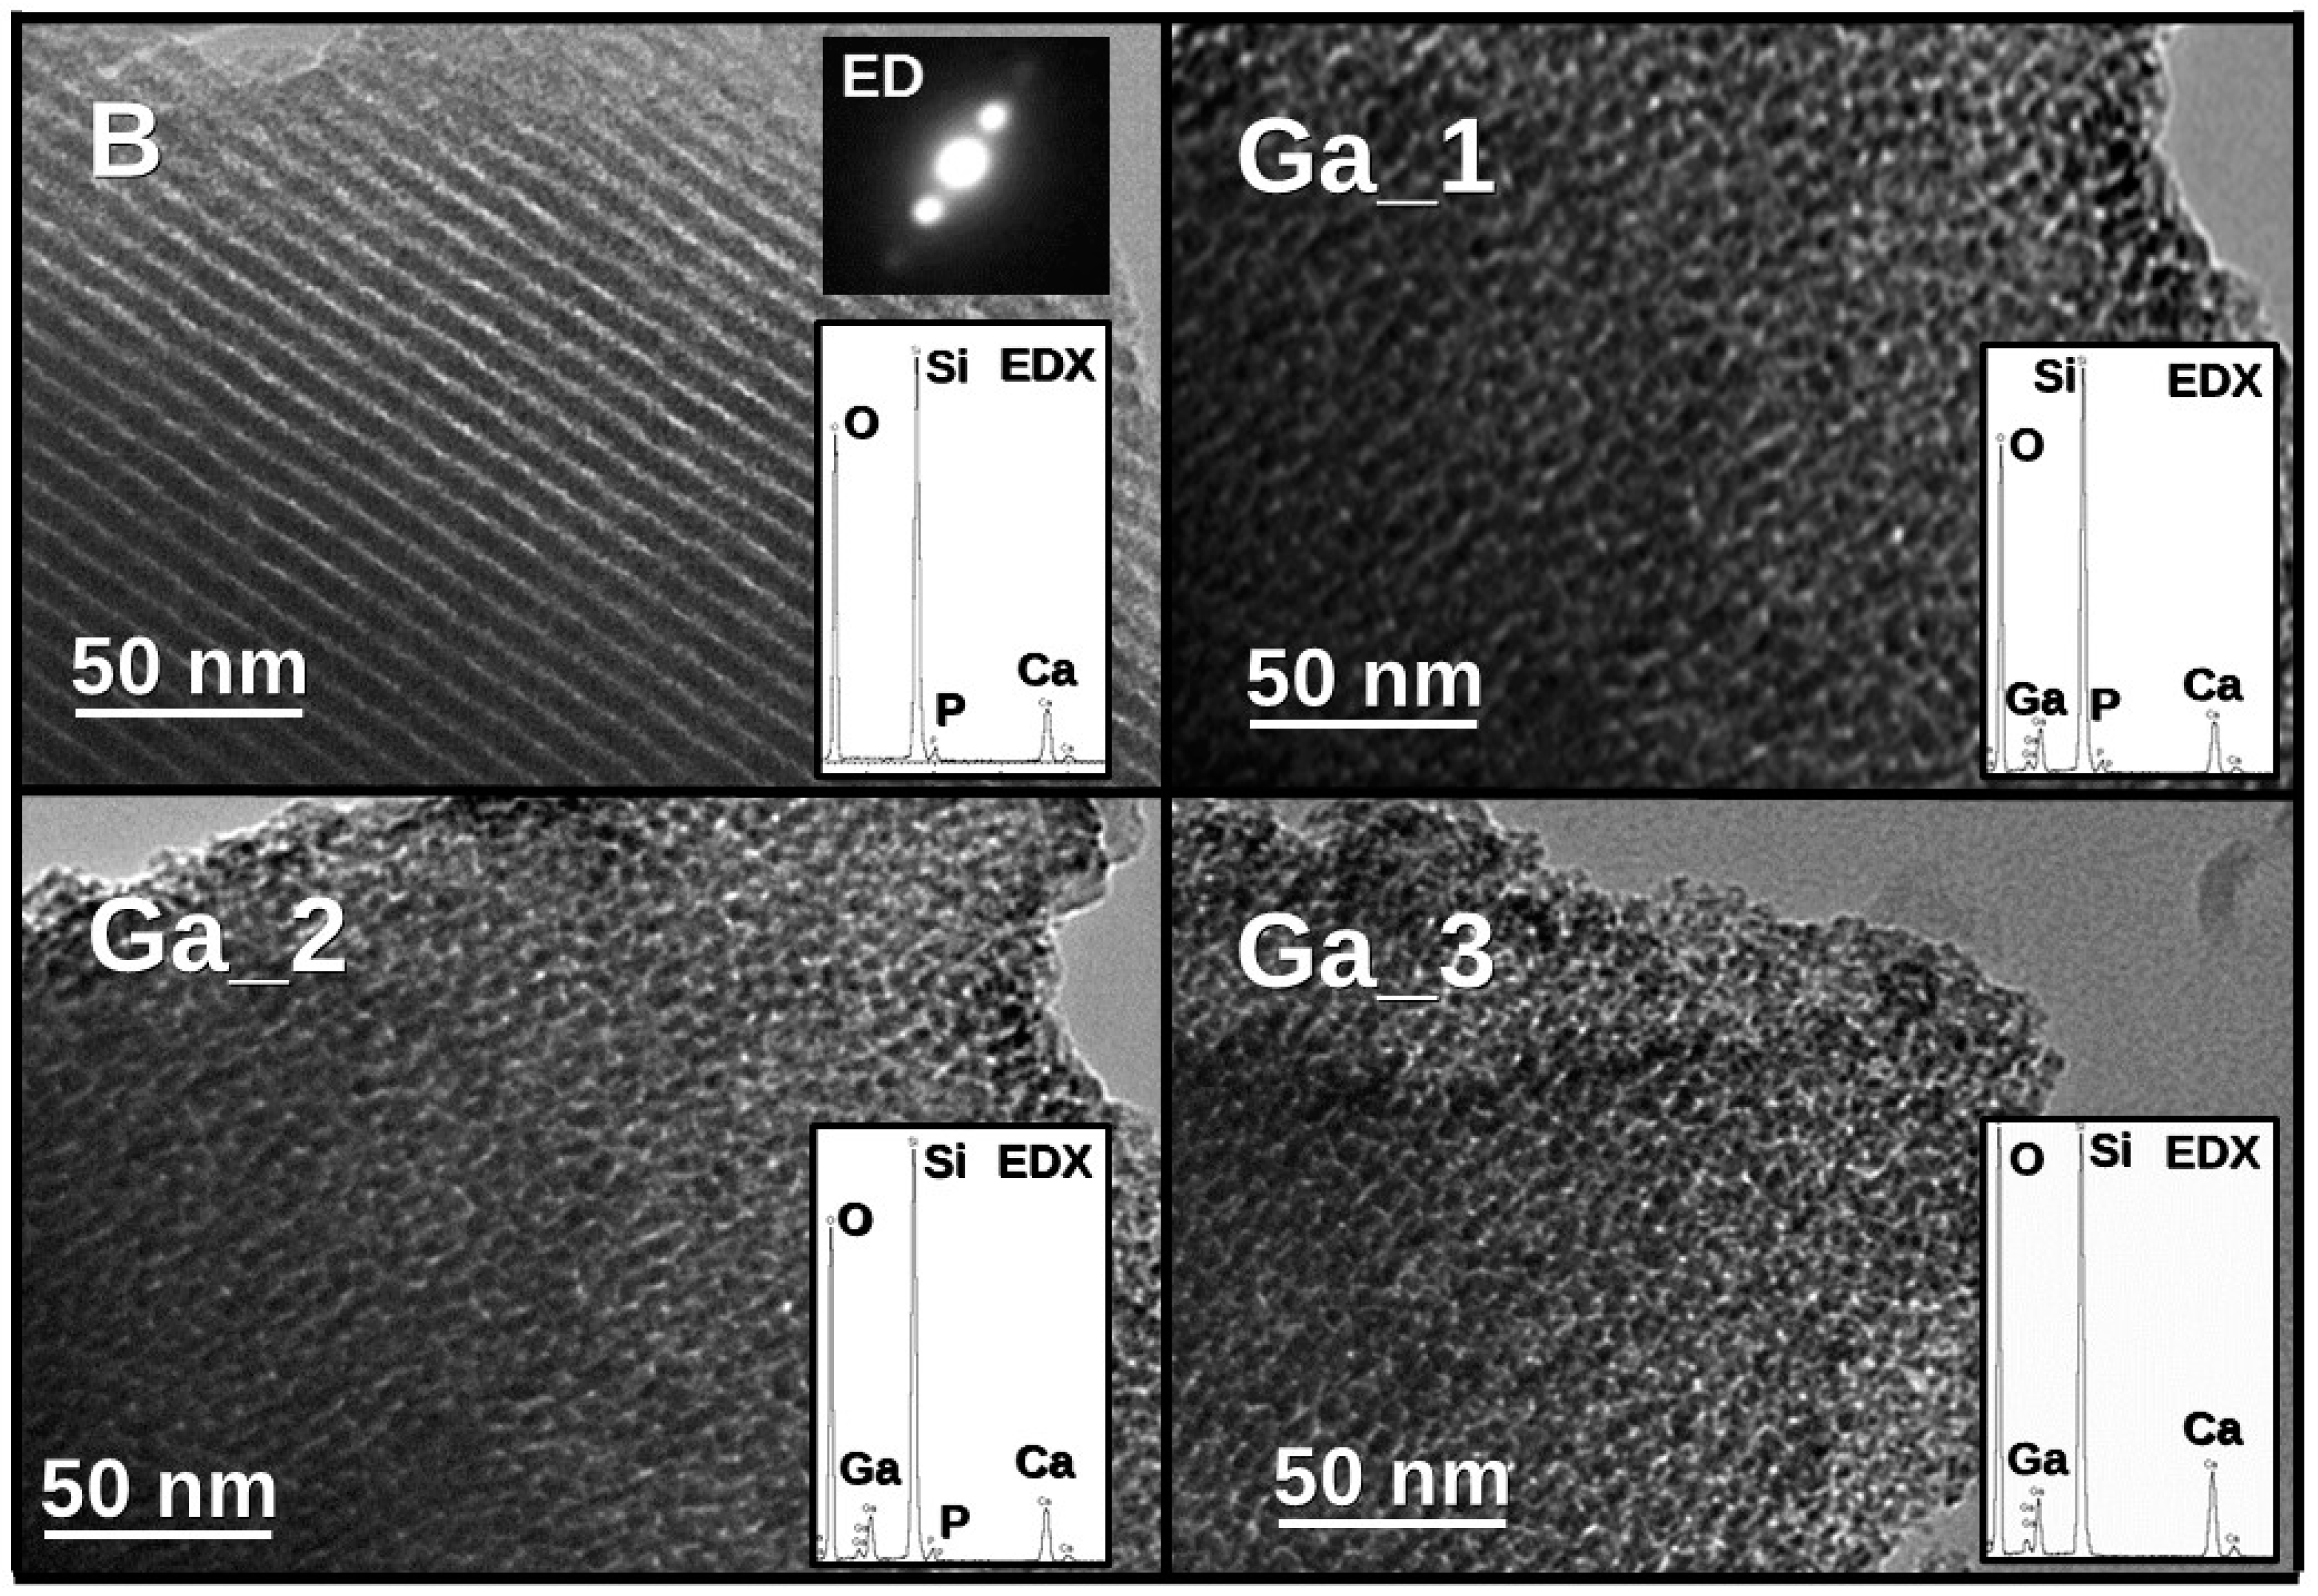
2.1. Synthesis of MBGs and Their Characterization
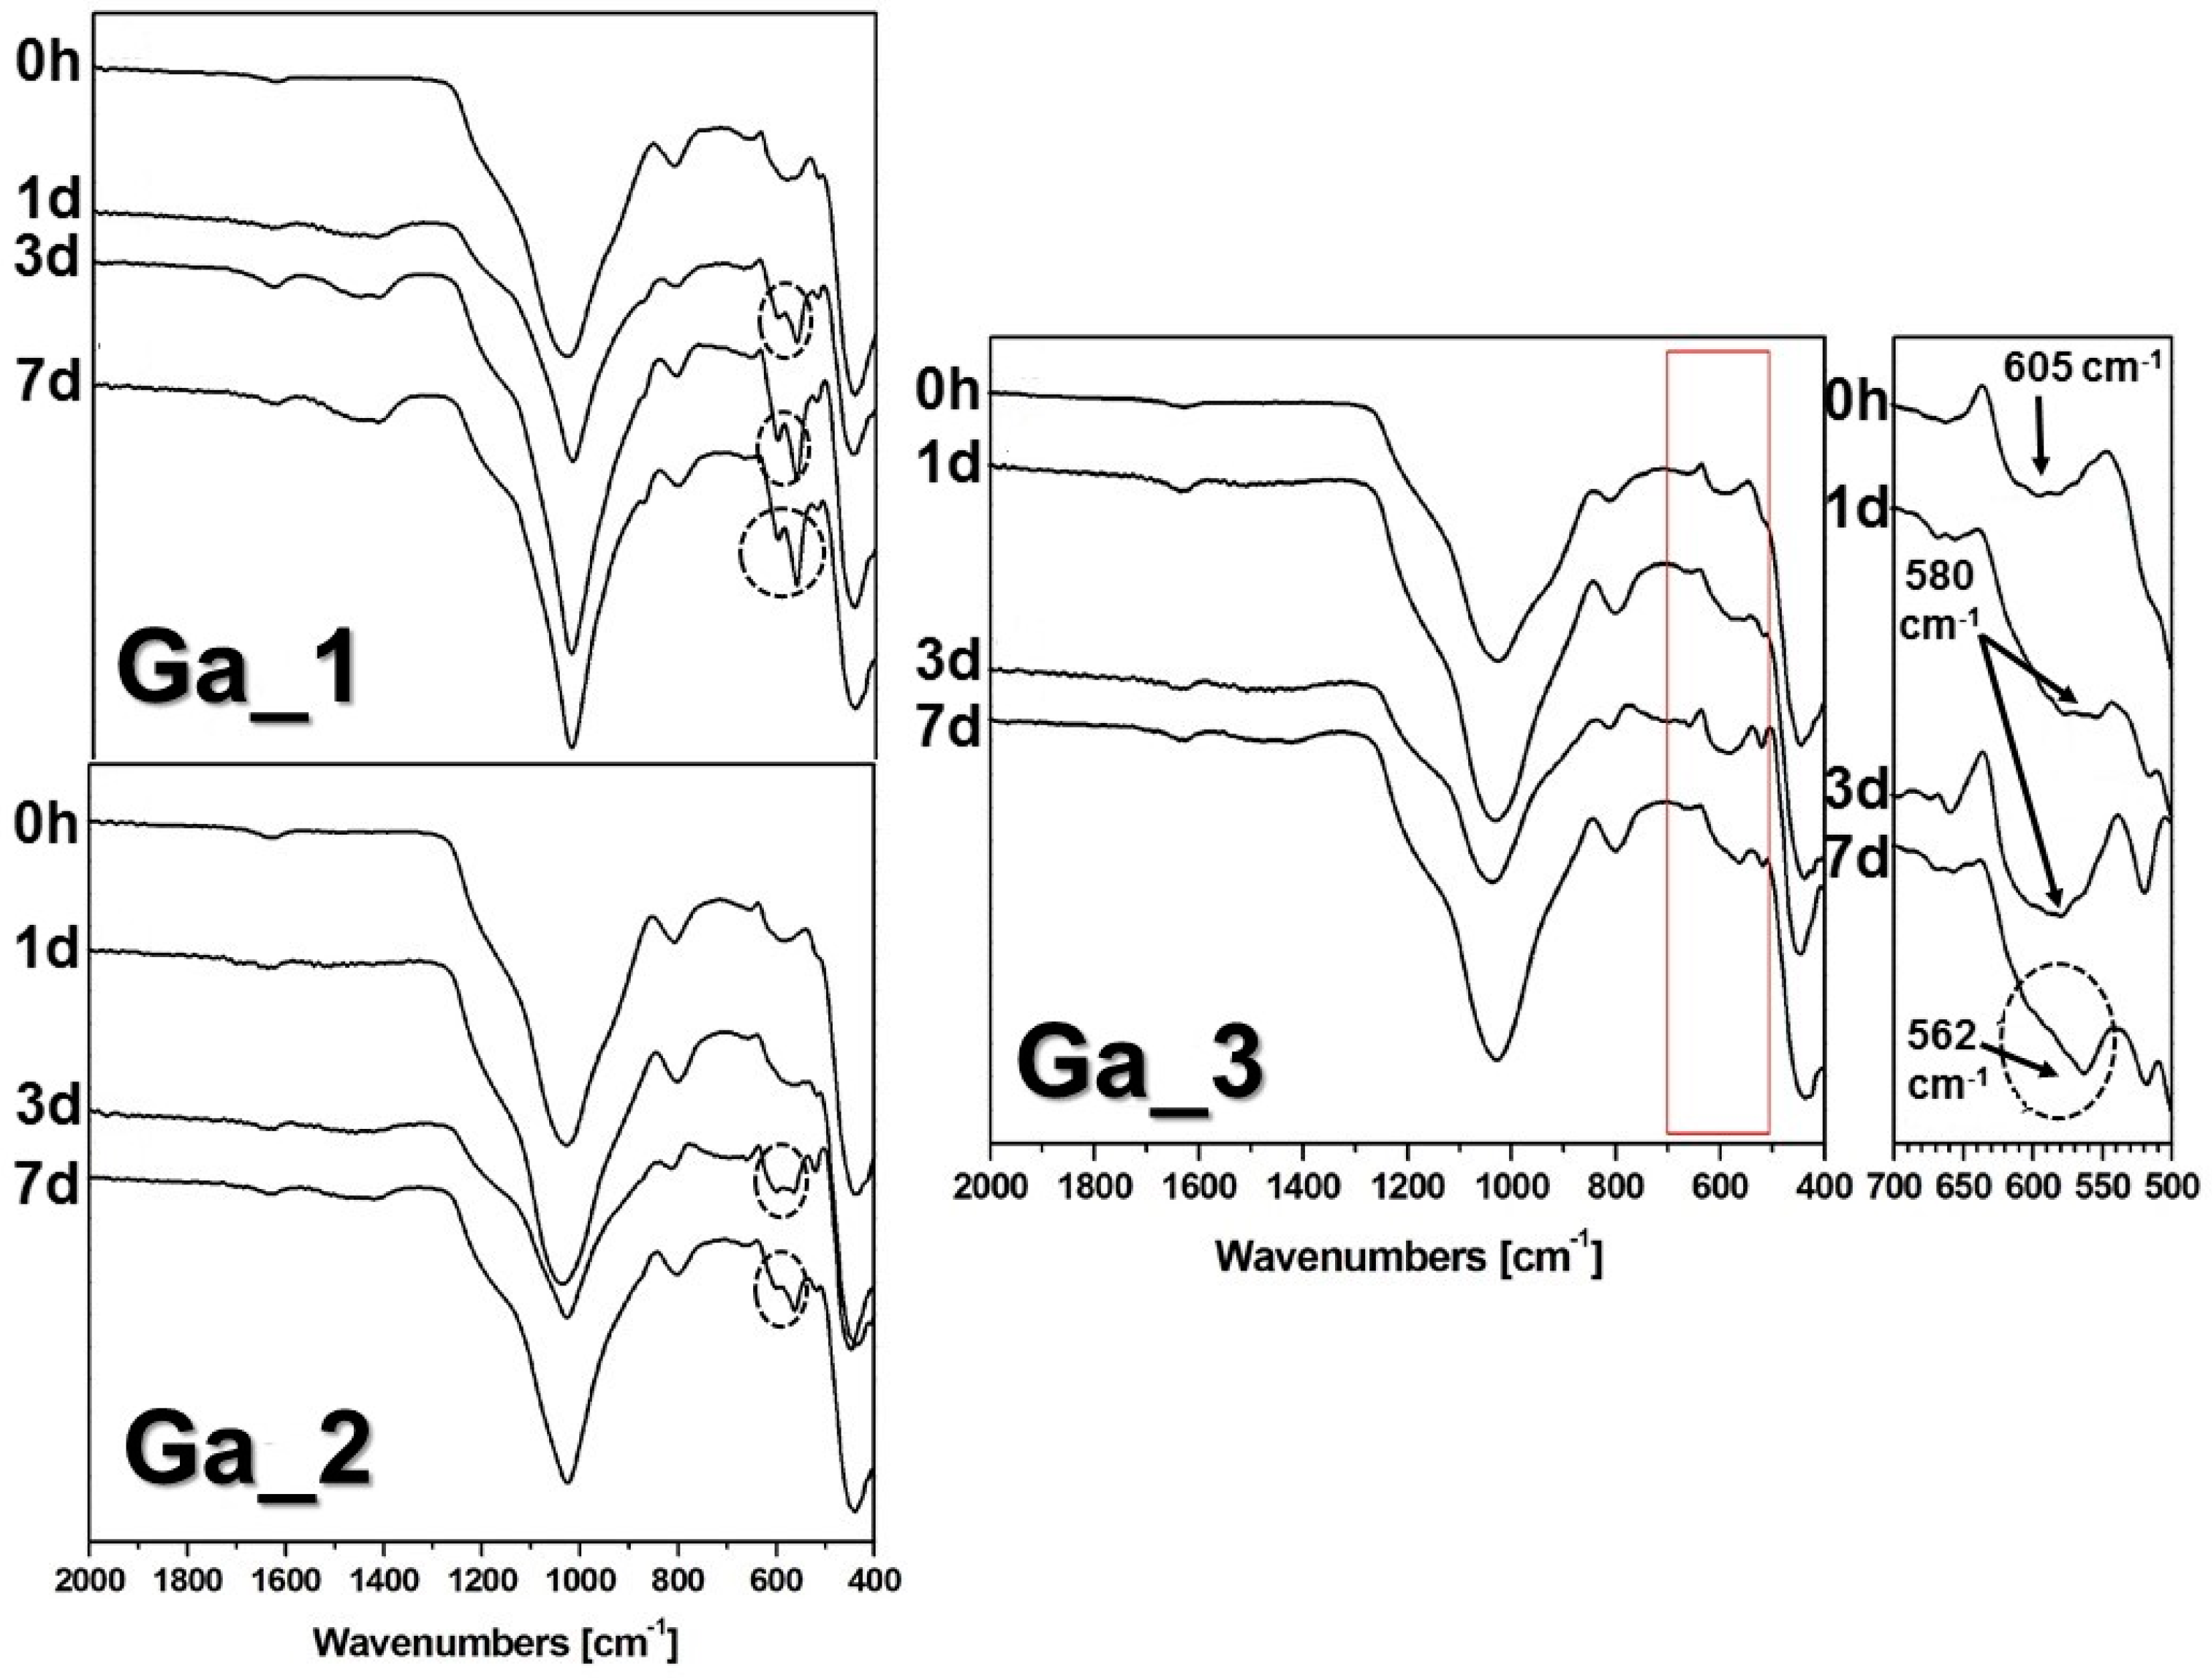
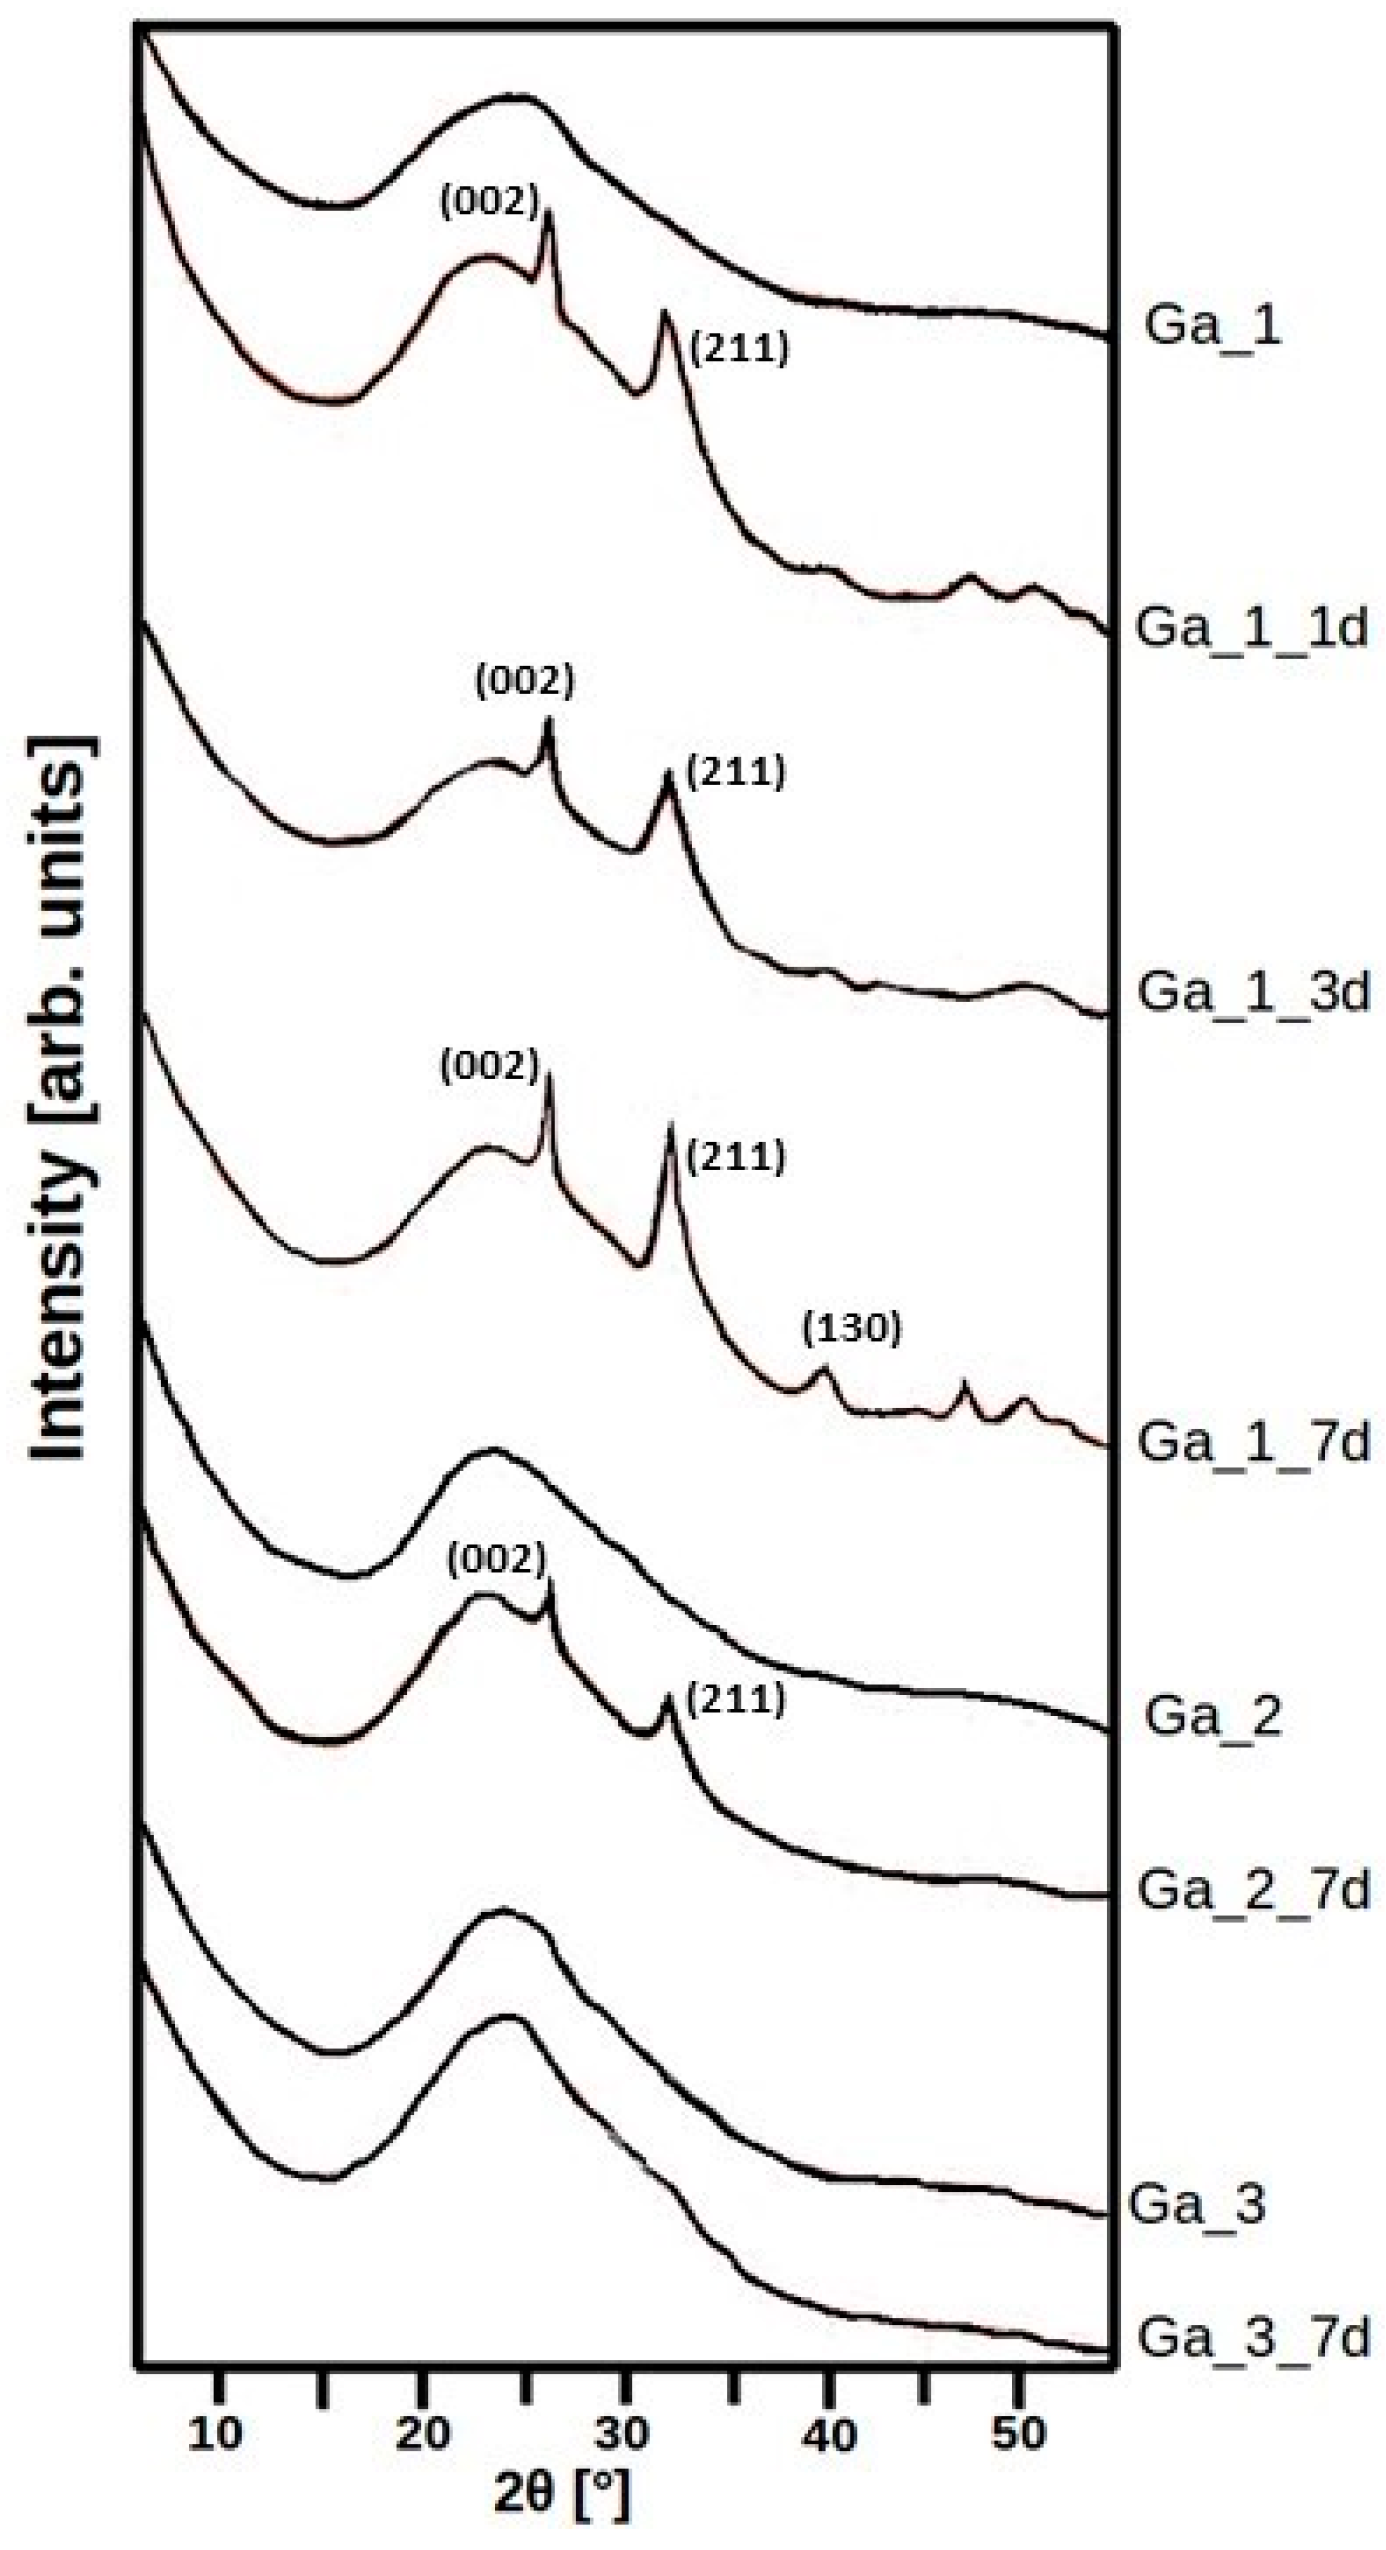
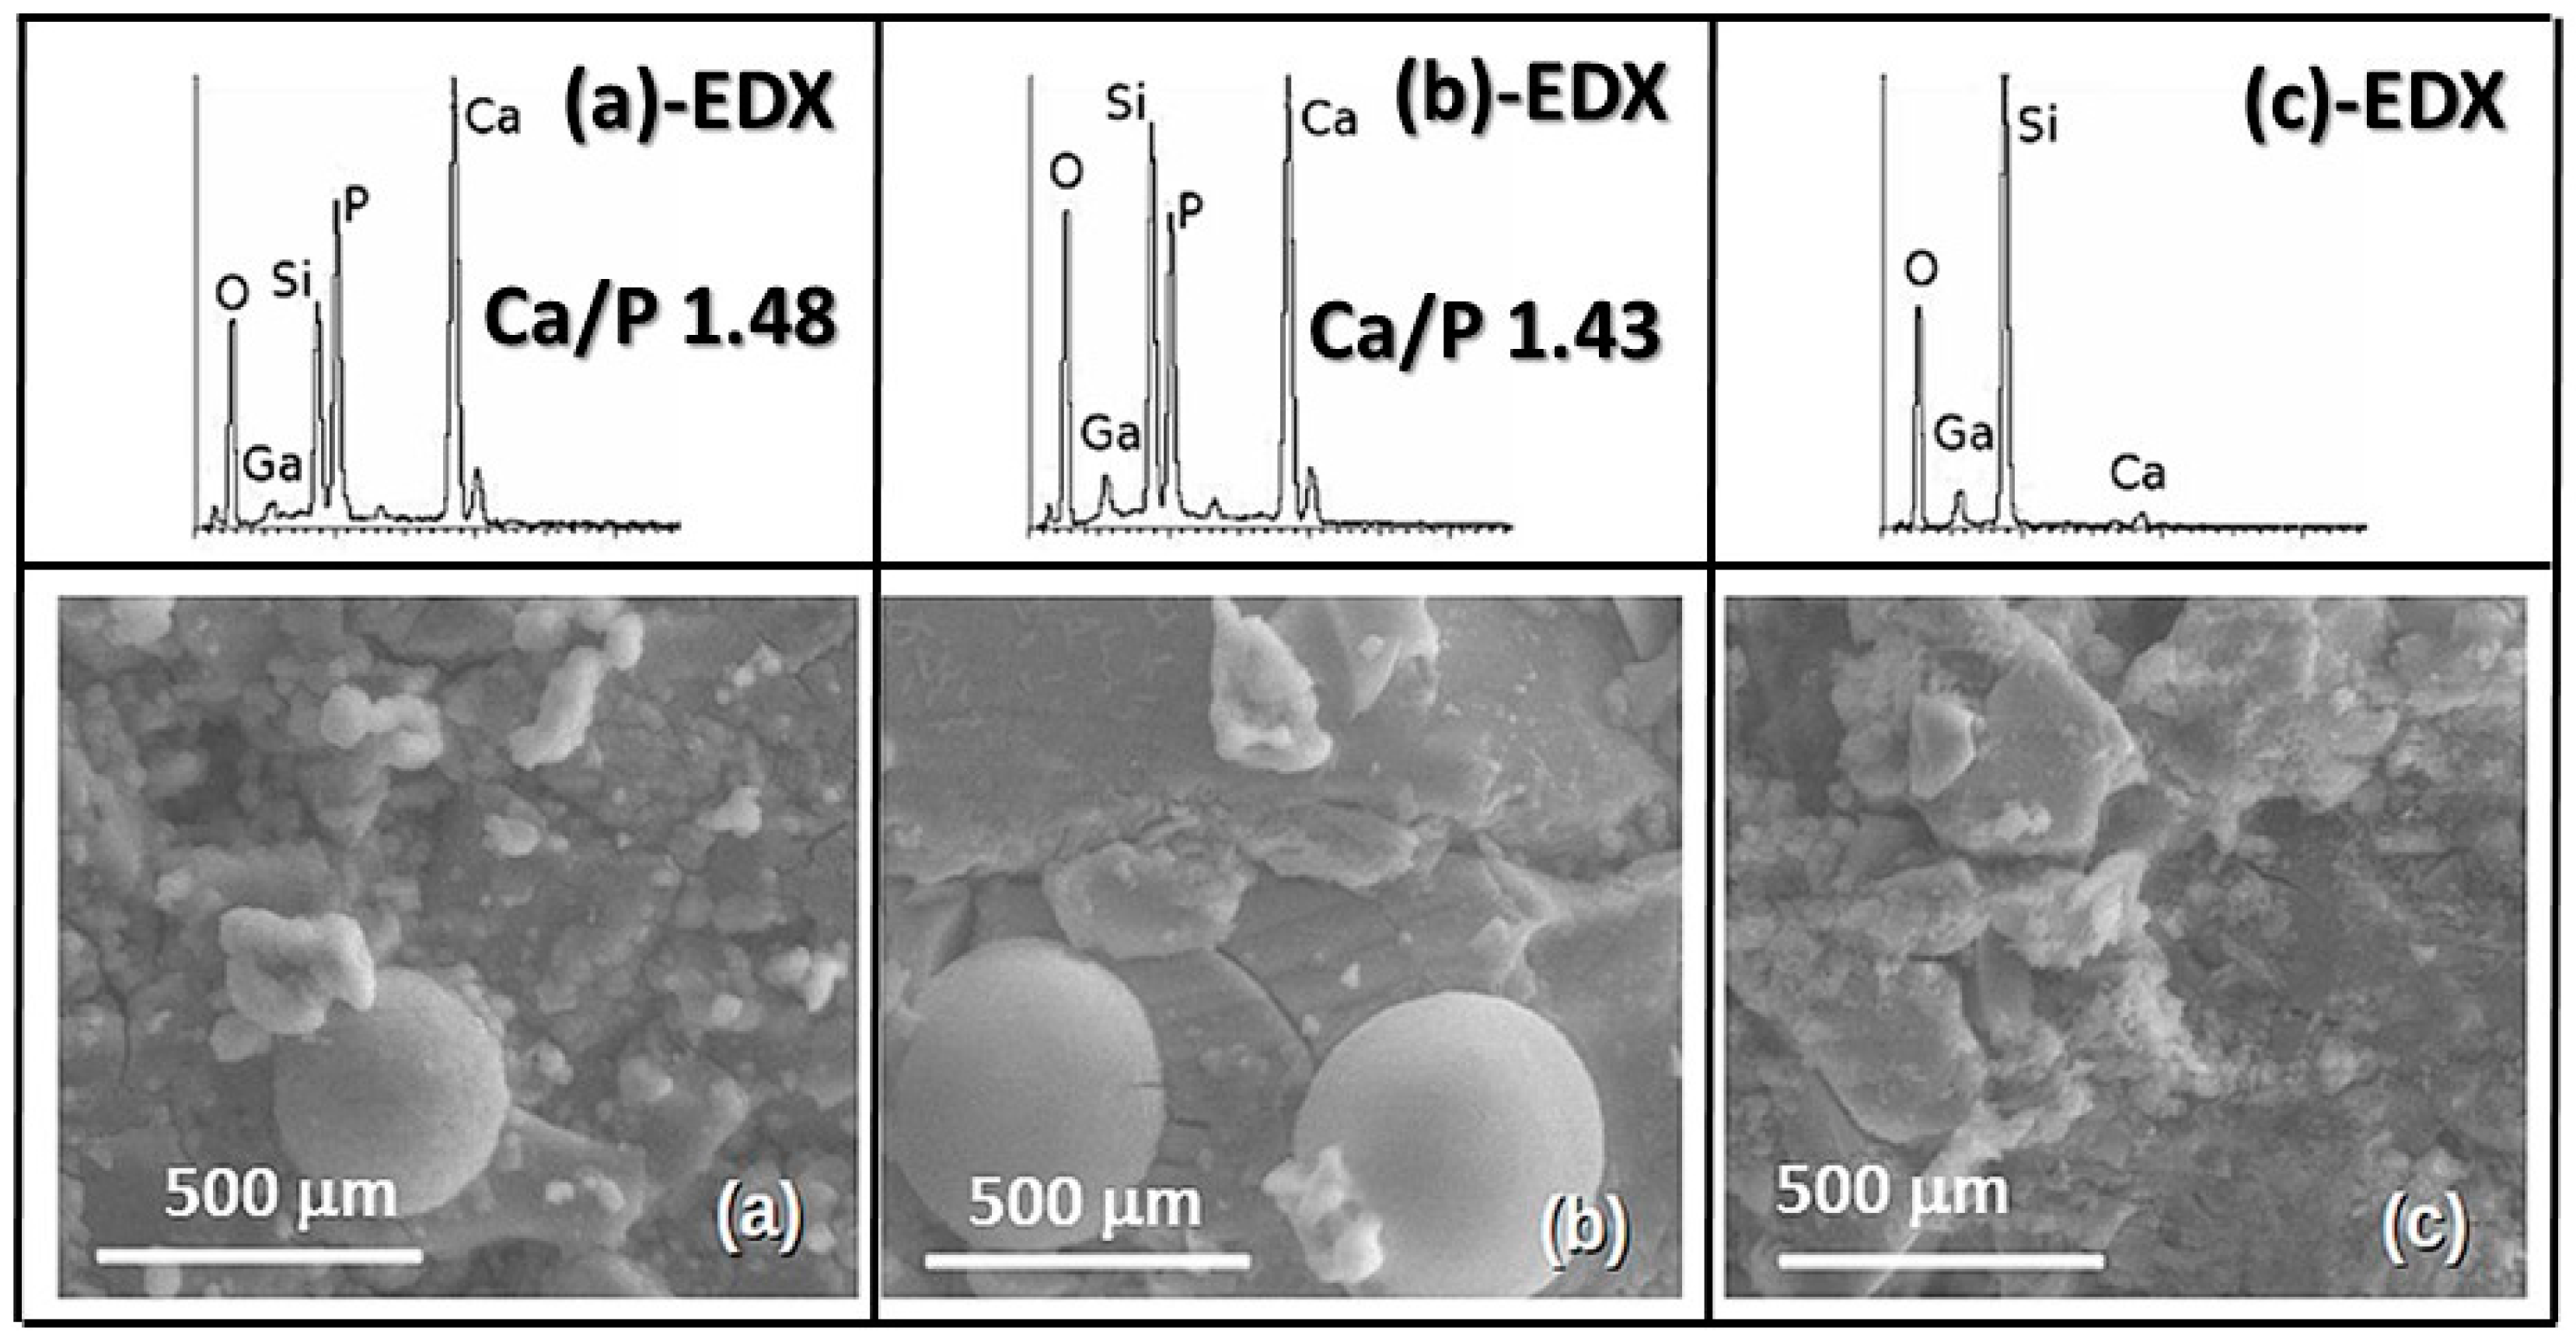
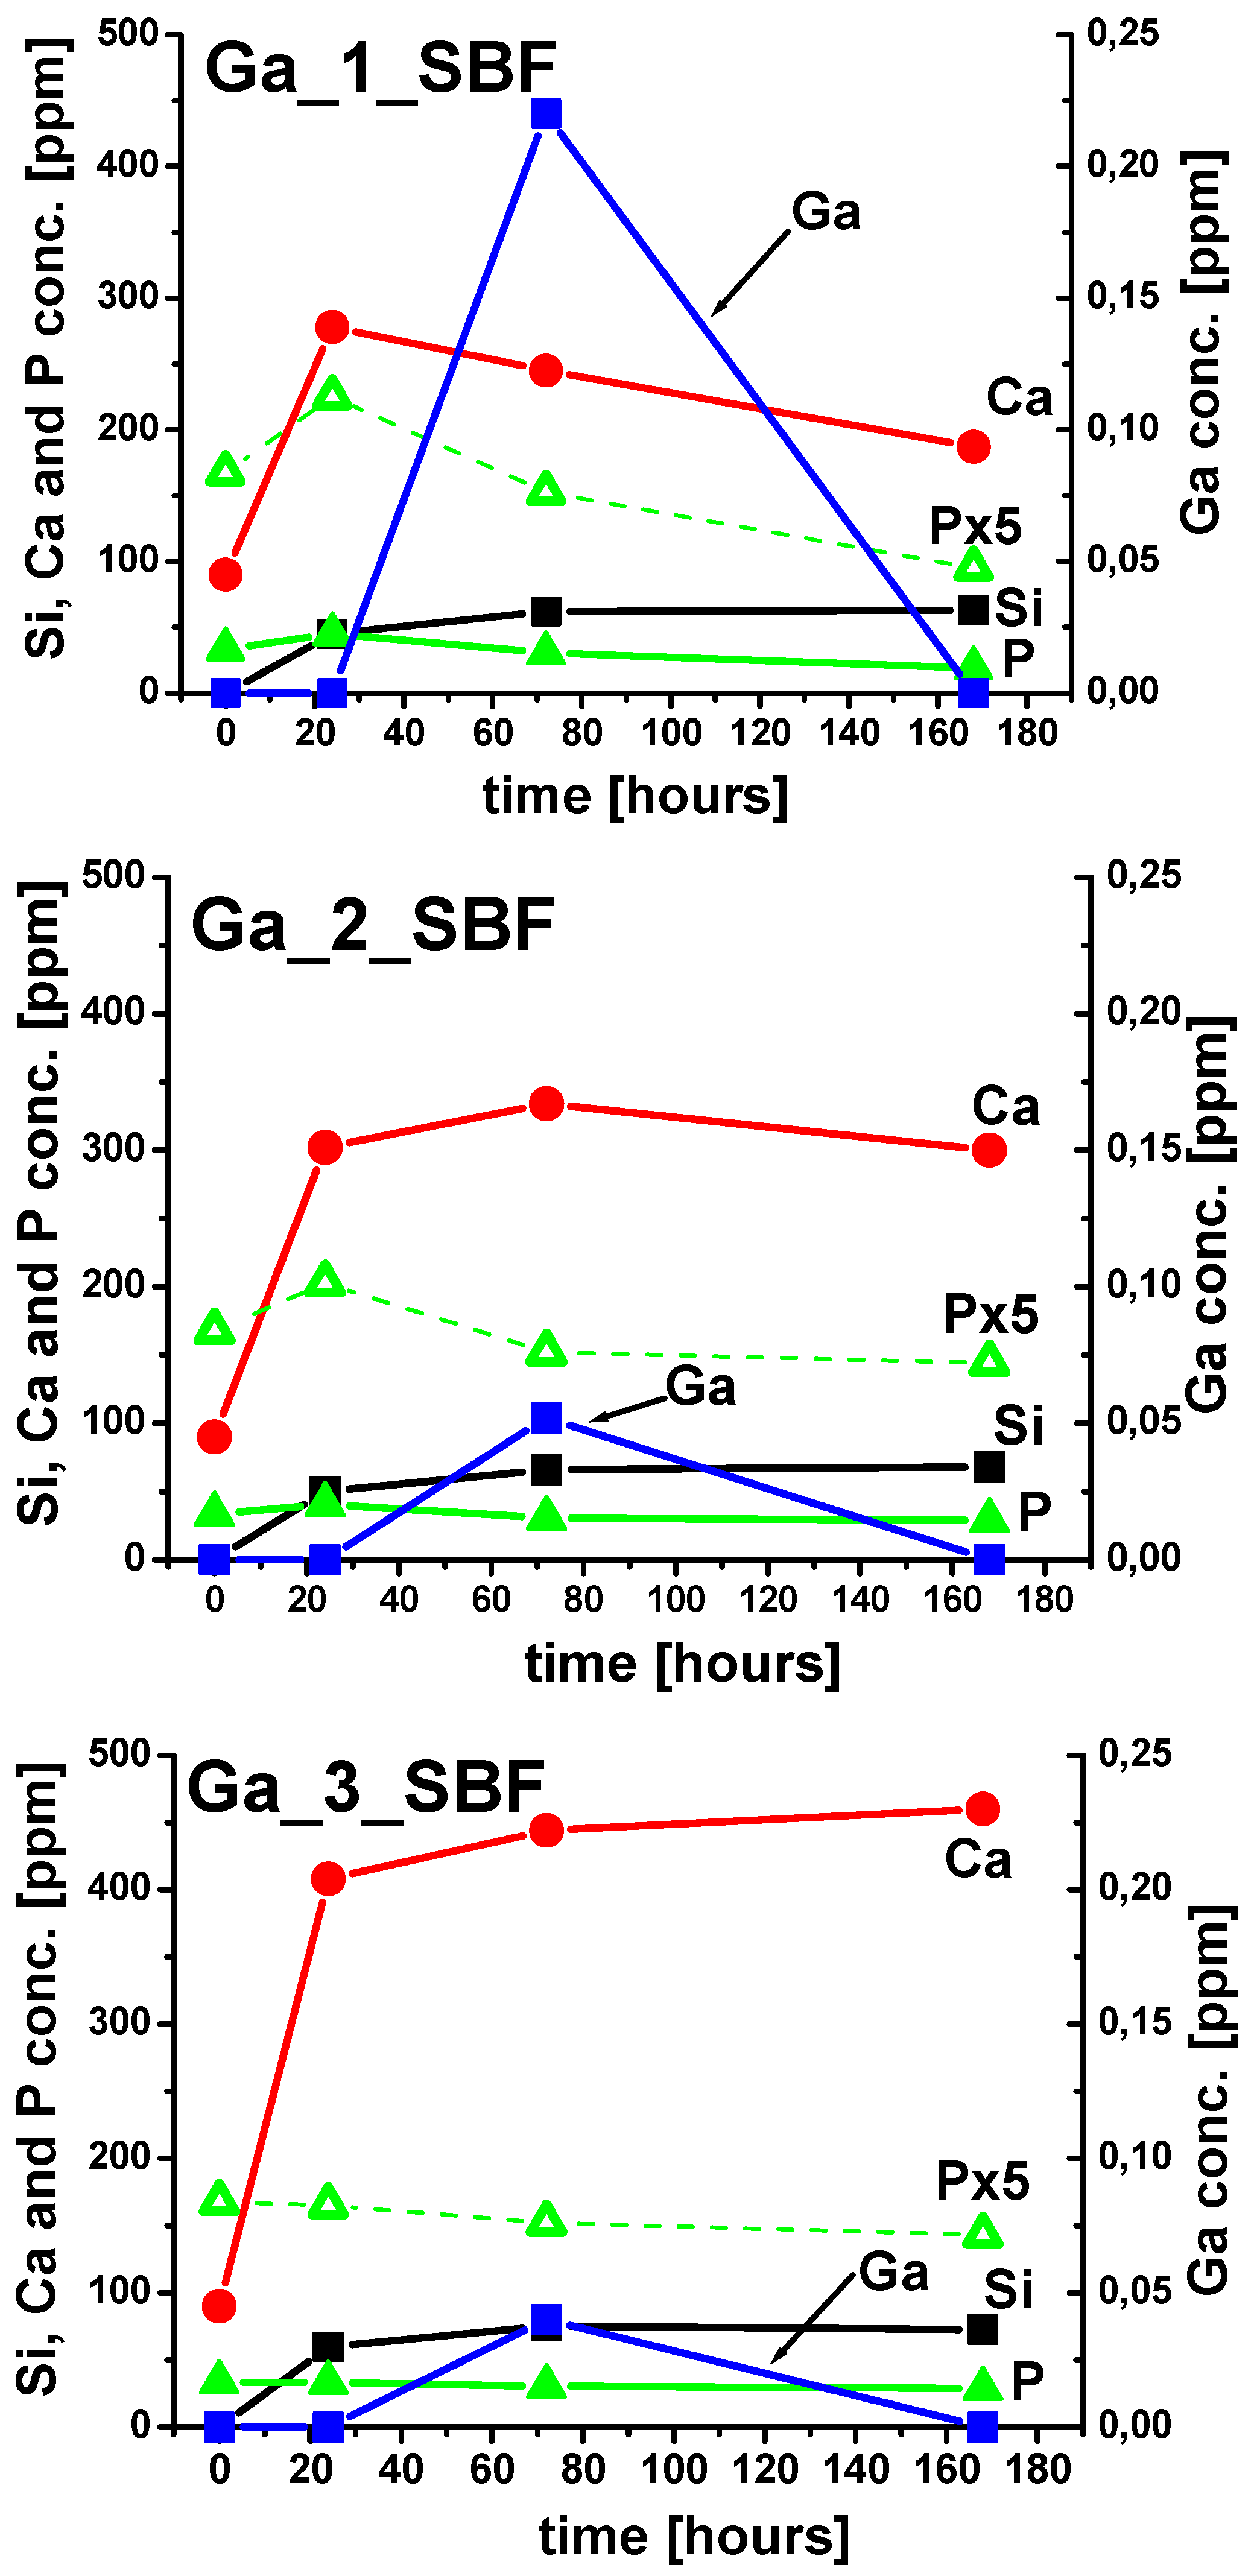
2.2. In Vitro Bioactivity Assay
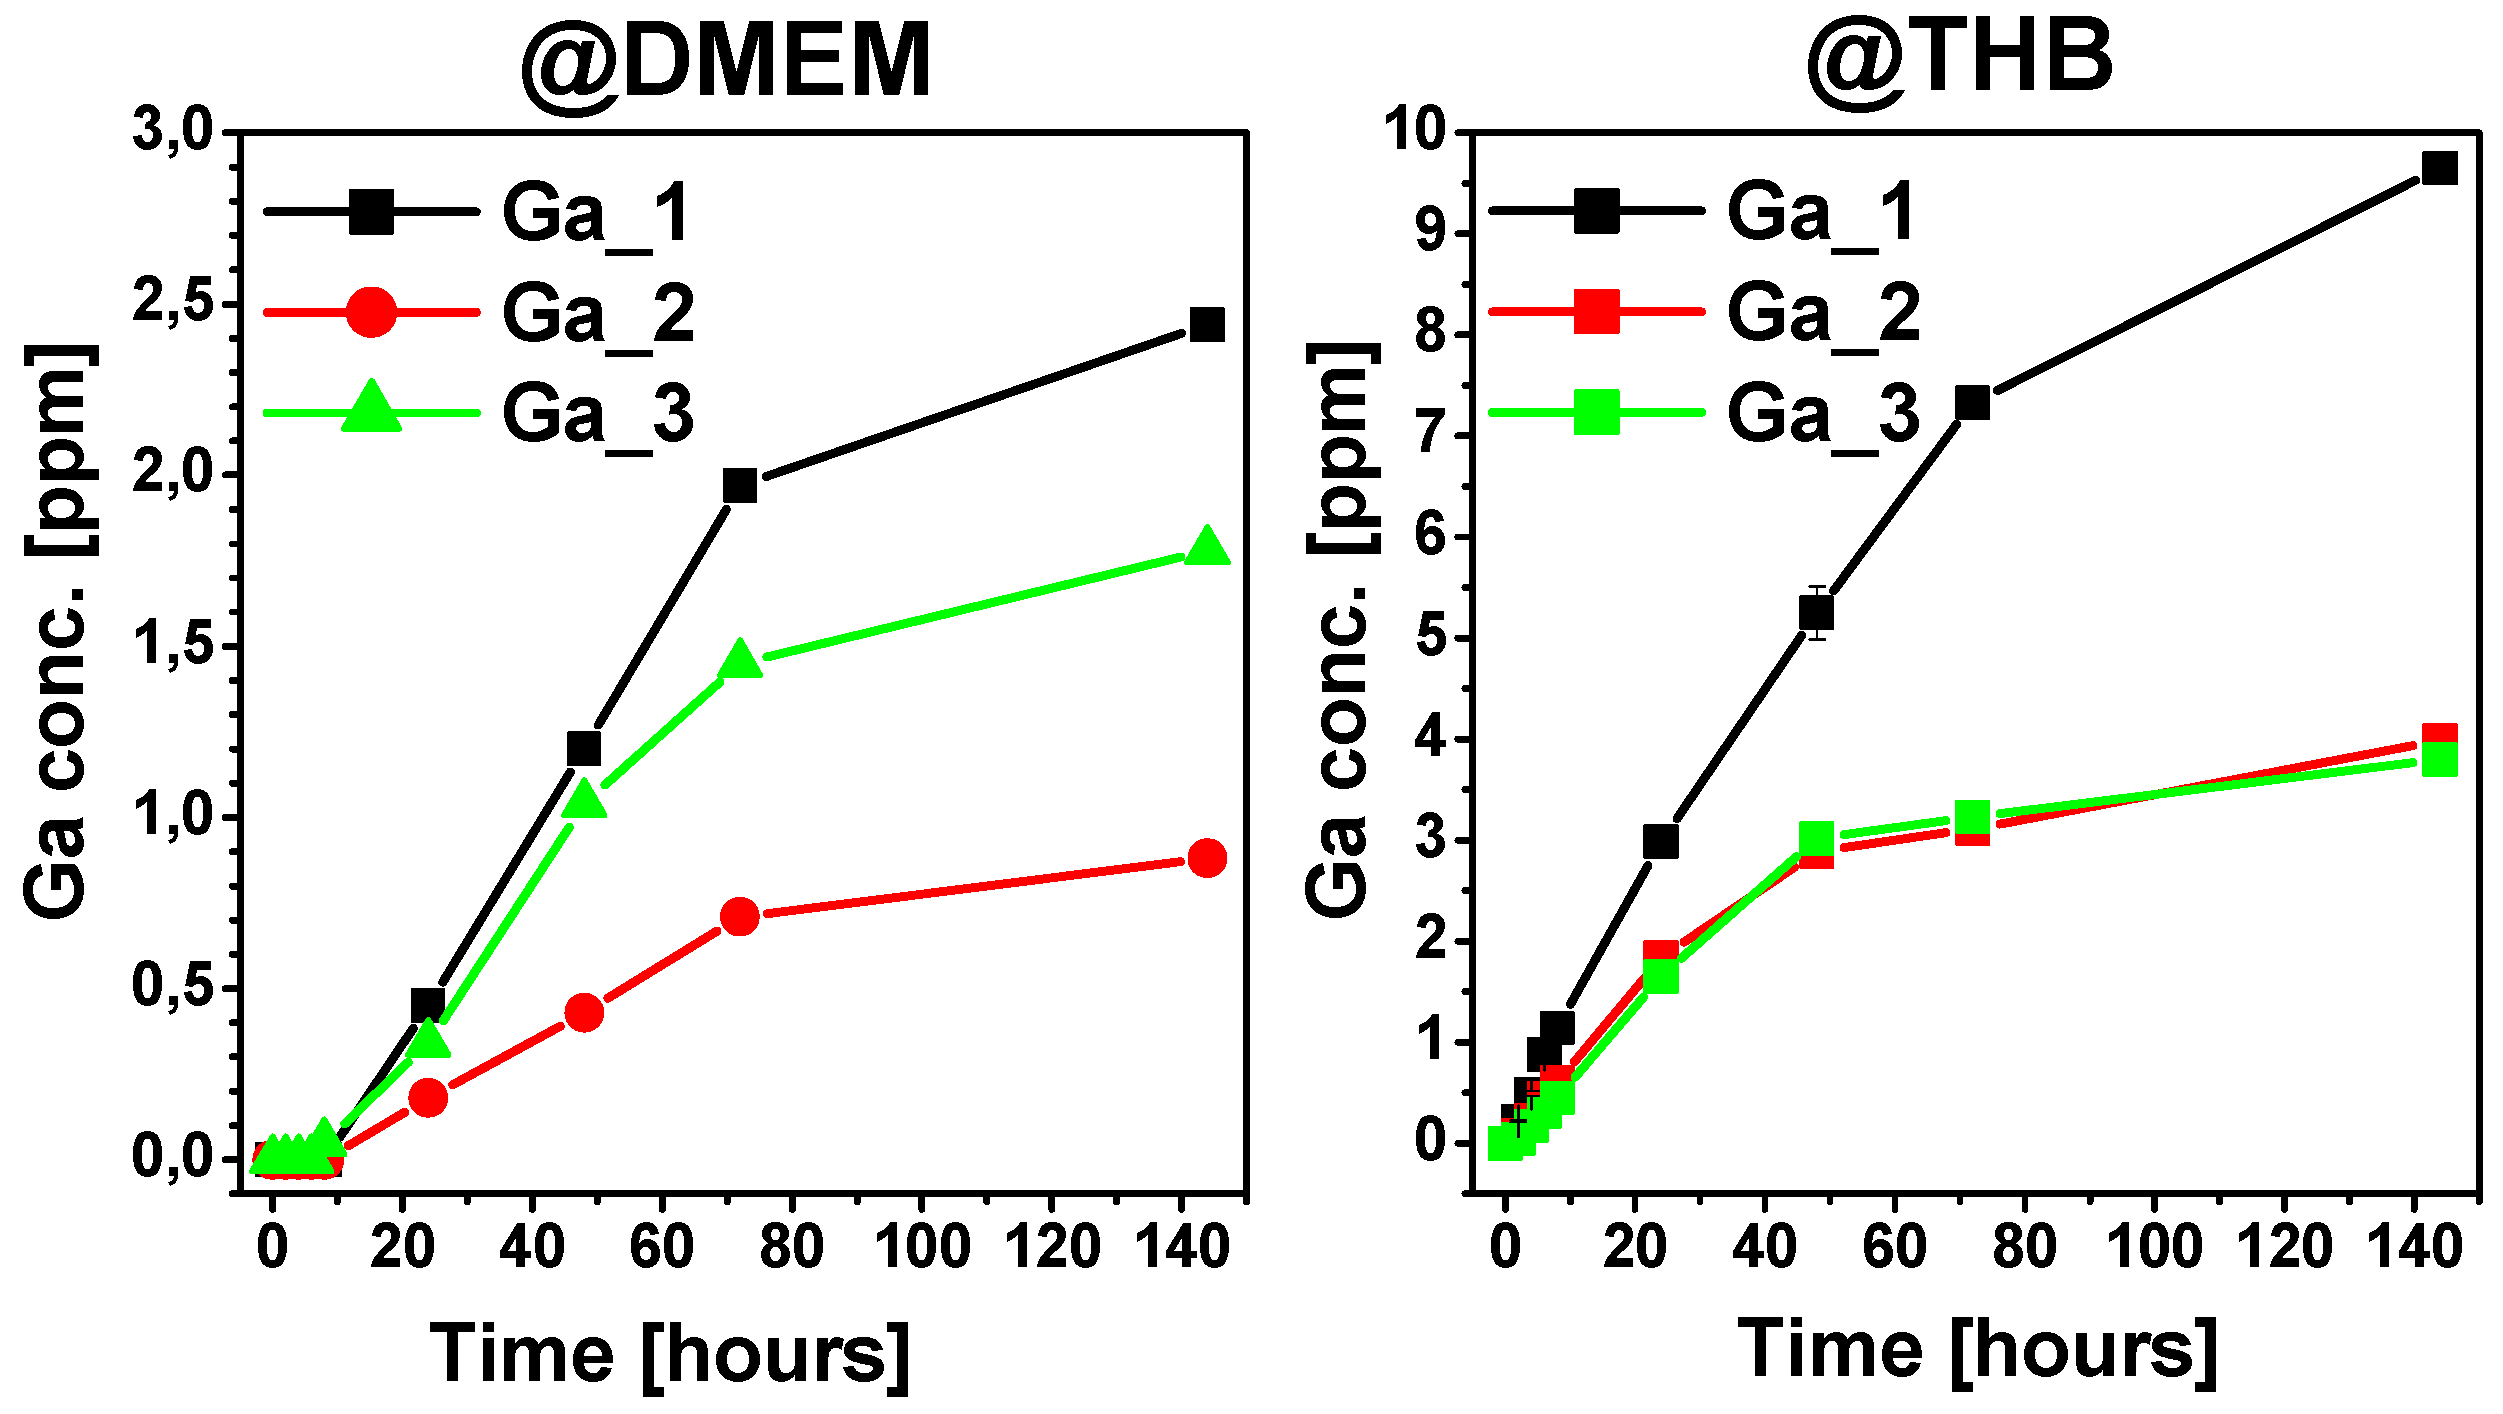
2.3. Ion Release Tests
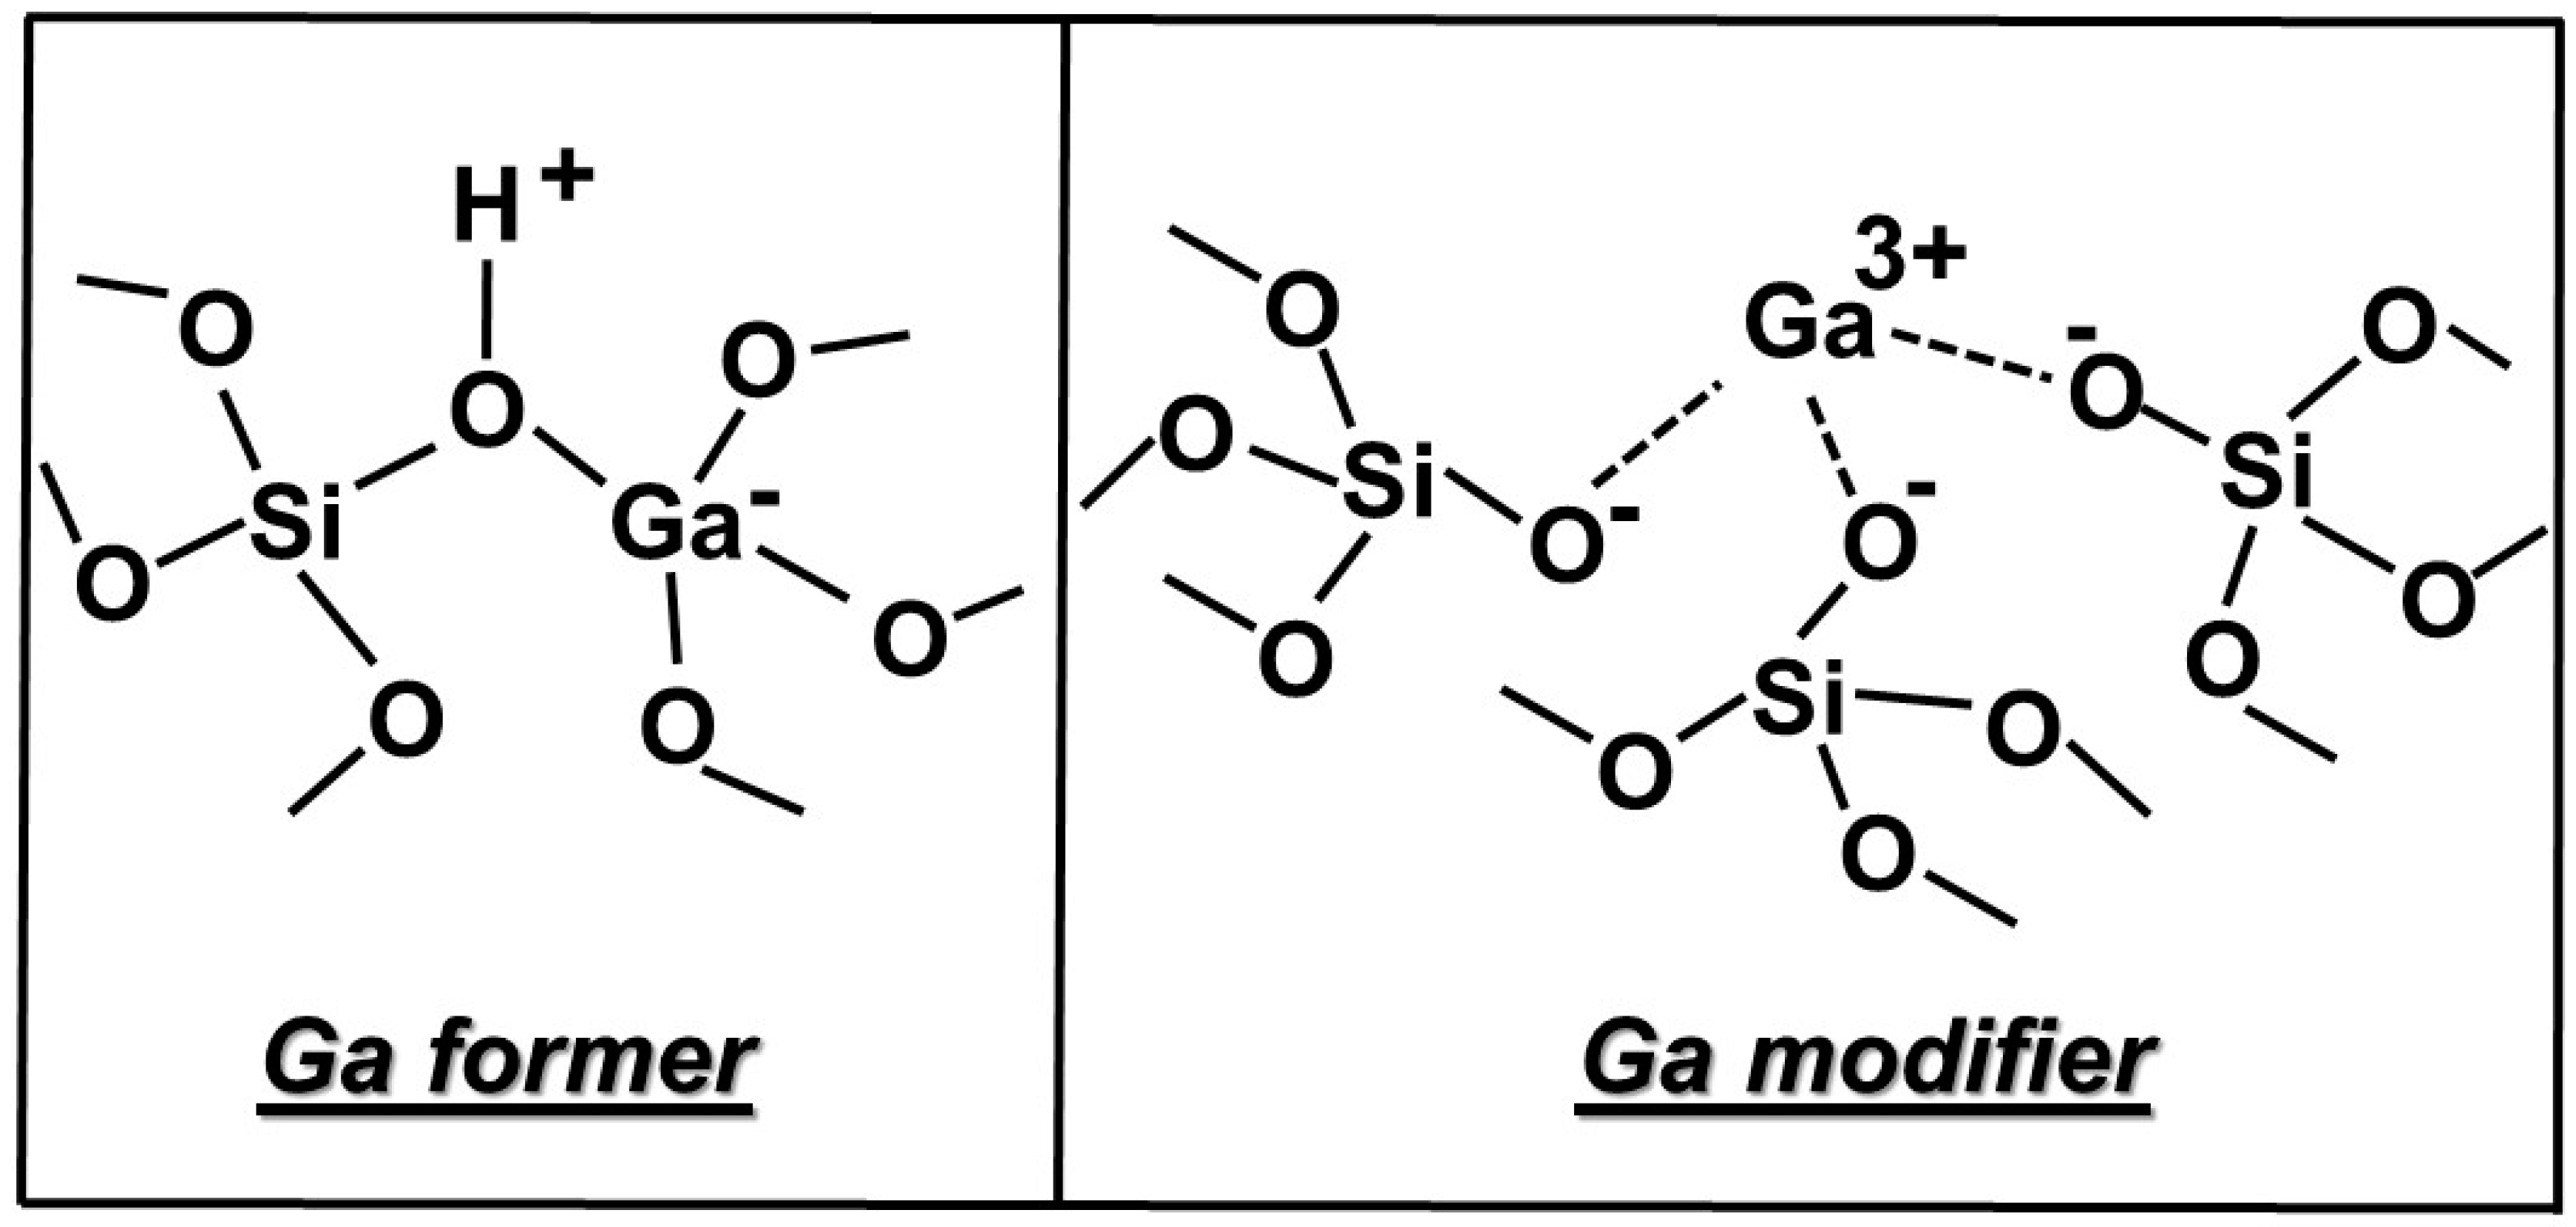
3. Discussion
4. Materials and Methods
4.1. MBG Preparation
4.2. MBG Characterization
4.3. In Vitro Bioactivity Tests
4.4. Ion Release Tests
5. Conclusions
Acknowledgments
Author Contributions
Conflicts of Interest
References
- Wu, C.; Chang, J. Multifunctional mesoporous bioactive glasses for effective delivery of therapeutic ions and drug/growth factors. J. Control. Release 2014, 193, 282–295. [Google Scholar] [CrossRef] [PubMed]
- Xynos, I.D.; Edgar, A.J.; Buttery, L.D.K.; Hench, L.L.; Polak, J.M. Gene-expression profiling of human osteoblasts following treatment with the ionic products of Bioglass® 45S5 dissolution. J. Biomed. Mater. Res. 2001, 55, 151–157. [Google Scholar] [CrossRef]
- Day, R.M. Bioactive glass stimulates the secretion of angiogenic growth factors and angiogenesis in vitro. Tissue Eng. 2005, 11, 768–777. [Google Scholar] [CrossRef] [PubMed]
- Allan, I.; Newman, H.; Wilson, M. Antibacterial activity of particulate Bioglass® against supra- and subgingival bacteria. Biomaterials 2001, 22, 1683–1687. [Google Scholar] [CrossRef]
- Day, R.M.; Boccaccini, A.R. Effect of particulate bioactive glasses on human macrophages and monocytes in vitro. J. Biomed. Mater. Res. A 2005, 73A, 73–79. [Google Scholar] [CrossRef] [PubMed]
- Bockman, R.S.; Repo, M.A.; Warrell, R.P., Jr.; Pounds, J.G.; Schidlovsky, G.; Gordon, B.M.; Jones, K.W. Distribution of trace levels of therapeutic gallium in bone as mapped by synchrotron X-ray microscopy. Proc. Natl. Acad. Sci. USA 1990, 87, 4149–4153. [Google Scholar] [CrossRef] [PubMed]
- Verron, E.; Loubat, A.; Carle, G.F.; Vignes-Colombeix, C.; Strazic, I.; Guicheux, J.; Rochet, N.; Bouler, J.M.; Scimeca, J.C. Molecular effects of gallium on osteoclastic differentiation of mouse and human monocytes. Biochem. Pharmacol. 2012, 83, 671–679. [Google Scholar] [CrossRef] [PubMed]
- Ma, Z.; Fu, Q. Therapeutic effect of organic gallium on ovariectomized osteopenic rats by decreased serum minerals and increased bone mineral content. Biol. Trace Elem. Res. 2010, 133, 342–349. [Google Scholar] [CrossRef] [PubMed]
- Bernstein, L.R. Mechanism of therapeutic activity for gallium. Pharmacol. Rev. 1998, 50, 665–682. [Google Scholar] [PubMed]
- Bockman, R.S.; Bosco, B. Treatment of patients with advanced Paget’s disease of bone with two cycles of gallium nitrate. Semin. Arthritis Rheum. 1994, 23, 268–269. [Google Scholar] [CrossRef]
- Campoccia, D.; Montanaro, L.; Arciola, C.R. The significance of infection related to orthopedic devices and issues of antibiotic resistance. Biomaterials 2006, 27, 2331–2339. [Google Scholar] [CrossRef] [PubMed]
- Kaneko, Y.; Thoendel, M.; Olakanmi, O.; Britigan, B.E.; Singh, P.K. The transition metal gallium disrupts Pseudomonas aeruginosa iron metabolism and has antimicrobial and antibiofilm activity. J. Clin. Investig. 2007, 117, 877–888. [Google Scholar] [CrossRef] [PubMed]
- Chitambar, C.R.; Narasimhan, J. Targeting iron-dependent DNA synthesis with gallium and transferrin-gallium. Pathobiology 1991, 59, 3–10. [Google Scholar] [CrossRef] [PubMed]
- Bullen, J.J.; Rogers, H.J.; Spalding, P.B.; Ward, C.G. Iron and infection: The heart of the matter. FEMS Immunol. Med. Microbiol. 2005, 43, 325–330. [Google Scholar] [CrossRef] [PubMed]
- Cochis, A.; Azzimonti, B.; Della Valle, C.; De Giglio, E.; Bloise, N.; Visai, L.; Cometa, S.; Rimondini, L.; Chiesa, R. The effect of silver or gallium doped titanium against the multidrug resistant Acinetobacter baumannii. Biomaterials 2016, 80, 80–95. [Google Scholar] [CrossRef] [PubMed]
- Verron, E.; Masson, M.; Khoshniat, S.; Duplomb, L.; Wittrant, Y.; Baud’huin, M.; Badran, Z.; Bujoli, B.; Janvier, P.; Scimeca, J.-C.; et al. Gallium modulates osteoclastic bone resorption in vitro without affecting osteoblasts. Br. J. Pharmacol. 2010, 159, 1681–1692. [Google Scholar] [CrossRef] [PubMed]
- Salinas, A.J.; Shruti, S.; Malavasi, G.; Menabue, L.; Vallet-Regi, M. Substitutions of cerium, gallium and zinc in ordered mesoporous bioactive glasses. Acta Biomater. 2011, 7, 3452–3458. [Google Scholar] [CrossRef] [PubMed]
- Pourshahrestani, S.; Zeimaran, E.; Adib Kadri, N.; Gargiulo, N.; Mahmood Jindal, H.; Naveen, S.V.; Devi Sekaran, S.; Kamarul, T.; Towler, M.R. Potency and Cytotoxicity of a Novel Gallium-Containing Mesoporous Bioactive Glass/Chitosan Composite Scaffold as Hemostatic Agents. ACS Appl. Mater. Interfaces 2017, 9, 31381–31392. [Google Scholar] [CrossRef] [PubMed]
- Valappil, S.P.; Ready, D.; Abou Neel, E.A.; Pickup, D.M.; Chrzanowski, W.; O’Dell, L.A.; Newport, R.J.; Smith, M.E.; Wilson, M.; Knowles, J.C. Antimicrobial Gallium-Doped Phosphate-Based Glasses. Adv. Funct. Mater. 2008, 8, 732–741. [Google Scholar] [CrossRef] [Green Version]
- Shruti, S.; Salinas, A.J.; Malavasi, G.; Lusvardi, G.; Menabue, L.; Ferrara, C.; Mustarelli, P.; Vallet-Regì, M. Structural and in vitro study of cerium, gallium and zinc containing sol–gel bioactive glasses. J. Mater. Chem. 2012, 22, 13698–13706. [Google Scholar] [CrossRef]
- Malavasi, G.; Menabue, L.; Menziani, M.C.; Pedone, A.; Salinas, A.J.; Vallet-Regí, M. New insights into the bioactivity of SiO2–CaO and SiO2–CaO–P2O5 sol–gel glasses by molecular dynamics simulations. J. Sol-Gel Sci. Technol. 2013, 67, 208–219. [Google Scholar] [CrossRef]
- Sanchez-Salcedo, S.; Shruti, S.; Salinas, A.J.; Malavasi, G.; Menabue, L.; Vallet-Regì, M. In vitro antibacterial capacity and cytocompatibility of SiO2–CaO–P2O5 meso-macroporous glass scaffolds enriched with ZnO. J. Mater. Chem. B 2014, 2, 4836–4847. [Google Scholar] [CrossRef]
- Lopez-Noriega, A.; Arcos, D.; Izquierdo-Barba, I.; Sakamoto, Y.; Terasaki, O.; Vallet-Regì, M. Ordered mesoporous bioactive glasses for bone tissue regeneration. Chem. Mater. 2006, 18, 3137–3144. [Google Scholar] [CrossRef]
- Hill, R.G.; Brauer, D.S. Predicting the bioactivity of glasses using the network connectivity or split network models. J. Non-Cryst. Solids 2011, 357, 3884–3887. [Google Scholar] [CrossRef]
- Martin, R.A.; Moss, R.M.; Lakhkar, N.J.; Knowles, J.C.; Cuello, G.J.; Smith, M.E.; Hanna, J.V.; Newport, R.J. Structural characterization of titanium-doped Bioglass using isotopic substitution neutron diffraction. Phys. Chem. Chem. Phys. 2012, 14, 15807–15815. [Google Scholar] [CrossRef] [PubMed]
- Gunawidjaja, P.N.; Mathew, R.; Lo, A.Y.H.; Izquierdo-Barba, I.; Garcia, A.; Arcos, D.; Vallet-Regì, M.; Eden, M. Local structures of mesoporous bioactive glasses and their surface alterations in vitro: Inferences from solid-state nuclear magnetic resonance. Philos. Trans. R. Soc. A 2012, 370, 1376–1399. [Google Scholar] [CrossRef] [PubMed]
- Garcia, A.; Cicuendez, M.; Izquierdo-Barba, I.; Arcos, D.; Vallet-Regi, M. Essential Role of Calcium Phosphate Heterogeneities in 2D-Hexagonal and 3D-Cubic SiO2−CaO−P2O5 Mesoporous Bioactive Glasses. Chem. Mater. 2009, 21, 5474–5484. [Google Scholar] [CrossRef]
- Leonova, E.; Izquierdo-Barba, I.; Arcos, D.; Lopez-Noriega, A.; Hedin, N.; Vallet-Regì, M.; Eden, M. Multinuclear solid-state NMR studies of ordered mesoporous bioactive glasses. J. Phys. Chem. C 2008, 112, 5552–5562. [Google Scholar] [CrossRef]
- Kokubo, T.; Takadama, H. How useful is SBF in predicting in vivo bone bioactivity? Biomaterials 2006, 27, 2907–2915. [Google Scholar] [CrossRef] [PubMed]
- Martinez, A.; Izquierdo-Barba, I.; Vallet-Regi, M. Bioactivity of CaO–SiO2 binary glass system. Chem. Mater. 2000, 12, 3080–3088. [Google Scholar] [CrossRef]
- De Andrade, J.S.; Pintiero, A.G.; Vasconcelos, I.F.; Sasaki, J.M.; de Paiva, J.A.C.; Valente, M.A.; Sombra, A.S.B. Raman and infrared spectra of KNbO3 in niobate glass-ceramics. J. Phys. Condens. Matter 1999, 11, 4451–4460. [Google Scholar] [CrossRef]
- Vallet-Regi, M.; Izquierdo-Barba, I.; Salinas, A.J. Influence of P2O5 on crystallinity of apatite formed in vitro on surface of bioactive glass. J. Biomed. Mater. Res. A 1999, 46, 560–565. [Google Scholar] [CrossRef]
- Wren, A.W.; Jones, M.C.; Misture, S.T.; Coughlan, A.; Keenan, N.L.; Towler, M.R.; Hall, M.M. A preliminary investigation into the structure, solubility and biocompatibility of solgel SiO2–CaO–Ga2O3 glass-ceramics. Mater. Chem. Phys. 2014, 148, 416–425. [Google Scholar] [CrossRef]
- Aina, V.; Morterra, C.; Lusvardi, G.; Malavasi, G.; Menabue, L.; Shruti, S.; Bianchi, C.L.; Bolis, V. Ga-Modified (Si–Ca–P) Sol–Gel Glasses: Possible Relationships between Surface Chemical Properties and Bioactivity. J. Phys. Chem. C 2011, 115, 22461–22474. [Google Scholar] [CrossRef]
- Malavasi, G.; Pedone, A.; Menziani, M.C. Study of the Structural Role of Gallium and Aluminum in 45S5 Bioactive Glasses by Molecular Dynamics Simulations. J. Phys. Chem. B 2013, 117, 4142–4150. [Google Scholar] [CrossRef] [PubMed]
- Otero Areán, C.; Turnes Palomino, G.; Geobaldo, F.; Zecchina, A. Characterization of Gallosilicate MFI-Type Zeolites by IR Spectroscopy of Adsorbed Probe Molecules. J. Phys. Chem. 1996, 100, 6678–6690. [Google Scholar] [CrossRef]
- Turnes Palomino, G.; Cuart Pascual, J.J.; Rodrıguez Delgado, M.; Parra, J.B.; Otero Areán, C. FT-IR studies on the acidity of gallium-substituted mesoporous MCM-41 silica. Mater. Chem. Phys. 2004, 85, 145–150. [Google Scholar] [CrossRef]
- Hadjiivanov, K.I.; Vayssilov, G.N. Characterization of oxide surfaces and zeolites by carbon monoxide as an IR probe molecule. Adv. Catal. 2002, 47, 307–511. [Google Scholar] [CrossRef]
- Ren, J.; Eckert, H. Intermediate Role of Gallium in Oxidic Glasses: Solid State NMR Structural Studies of the Ga2O3–NaPO3 System. J. Phys. Chem. C 2014, 18, 15386–15409. [Google Scholar] [CrossRef]
- Linati, L.; Lusvardi, G.; Malavasi, G.; Menabue, L.; Menziani, M.C.; Mustarelli, P.; Segre, U. Qualitative and quantitative Structure-Property Relationships analysis of multicomponent potential bioglasses. J. Phys. Chem. B 2005, 109, 4989–4998. [Google Scholar] [CrossRef] [PubMed]
- Lao, J.; Nedelec, J.M.; Moretto, P.; Jallot, E. Micro-PIXE–RBS methods highlighting the influence of phosphorus on the in vitro bioactivity of sol–gel derived glass particles in the SiO2–CaO–P2O5 system. Nucl. Instrum. Methods Phys. Res. B. 2008, 266, 2412–2417. [Google Scholar] [CrossRef] [Green Version]
- Minandri, F.; Bonchi, C.; Frangipani, E.; Imperi, F.; Visca, P. Promises and failures of gallium as an antibacterial agent. Future Microbiol. 2014, 9, 379–397. [Google Scholar] [CrossRef] [PubMed]
- Brunauer, S.; Emmet, P.H.; Teller, E. Adsorption of gases in multimolecular layers. J. Am. Chem. Soc. 1938, 60, 309–319. [Google Scholar] [CrossRef]
- Barrett, E.P.; Joyner, L.G.; Halenda, P.P. The Determination of Pore Volume and Area Distributions in Porous Substances. I. Computations from Nitrogen Isotherms. J. Am. Chem. Soc. 1951, 73, 373–380. [Google Scholar] [CrossRef]


| Glasses | SiO2 | CaO | P2O5 | Ga2O3 |
|---|---|---|---|---|
| B | 80.0 (82.3) | 15.0 (11.6) | 5.0 (6.1) | 0.0 (0.0) |
| Ga_1 | 70.0 (74.0) | 15.0 (13.0) | 10.0 (7.9) | 5.0 (5.1) |
| Ga_2 | 80.0 (81.8) | 12.0 (10.0) | 3.0 (3.2) | 5.0 (5.1) |
| Ga_3 | 80.0 (80.8) | 15.0 (14.2) | 0.0 (0.0) | 5.0 (5.0) |
| 29Si Single-Pulse | |||||||||
| Q4 | Q3 | Q2 | <Qn> | ||||||
| δ | Area | δ | Area | δ | Area | ||||
| B | −111.5 | 63.4 | −101.6 | 25.0 | −91.5 | 11.6 | 3.52 | ||
| Ga_1 | −112.1 | 45.9 | −102.6 | 48.4 | −89.2 | 5.7 | 3.40 | ||
| Ga_2 | −112.0 | 44.0 | −102.0 | 51.3 | −89.0 | 4.7 | 3.39 | ||
| Ga_3 | −112.0 | 33.2 | −102.9 | 54.8 | −89.3 | 11.9 | 3.21 | ||
| 29Si Cross-Polarization | |||||||||
| Q4 | Q3 | Q2H | Q2Ca | <Qn> | |||||
| δ | Area | δ | Area | δ | Area | δ | Area | ||
| B | −110.4 | 18.3 | −101.2 | 56.5 | −92.4 | 15.8 | −86.3 | 9.4 | 2.93 |
| Ga_1 | −107.7 | 20.4 | −100.8 | 37.9 | −92.9 | 19.0 | −86.8 | 22.5 | 2.78 |
| Ga_2 | −106.1 | 20.2 | −101.2 | 40.6 | −92.3 | 17.6 | −84.6 | 17.6 | 2.73 |
| Ga_3 | −106.8 | 22.3 | −100.9 | 36.0 | −92.7 | 18.1 | −84.0 | 18.1 | 2.70 |
| 31P Single Pulse | |||||
|---|---|---|---|---|---|
| Q0 | Q1 | <Qn> | |||
| δ | Area | δ | Area | ||
| B | 2.3 | 94.5 | −5.7 | 5.5 | 0.06 |
| Ga_1 | 2.0 | 93.3 | −5.5 | 6.7 | 0.07 |
| Ga_2 | 1.2 | 90.6 | −5.1 | 9.4 | 0.09 |
© 2018 by the authors. Licensee MDPI, Basel, Switzerland. This article is an open access article distributed under the terms and conditions of the Creative Commons Attribution (CC BY) license (http://creativecommons.org/licenses/by/4.0/).
Share and Cite
Sanchez-Salcedo, S.; Malavasi, G.; Salinas, A.J.; Lusvardi, G.; Rigamonti, L.; Menabue, L.; Vallet-Regi, M. Highly-Bioreactive Silica-Based Mesoporous Bioactive Glasses Enriched with Gallium(III). Materials 2018, 11, 367. https://doi.org/10.3390/ma11030367
Sanchez-Salcedo S, Malavasi G, Salinas AJ, Lusvardi G, Rigamonti L, Menabue L, Vallet-Regi M. Highly-Bioreactive Silica-Based Mesoporous Bioactive Glasses Enriched with Gallium(III). Materials. 2018; 11(3):367. https://doi.org/10.3390/ma11030367
Chicago/Turabian StyleSanchez-Salcedo, Sandra, Gianluca Malavasi, Antonio J. Salinas, Gigliola Lusvardi, Luca Rigamonti, Ledi Menabue, and Maria Vallet-Regi. 2018. "Highly-Bioreactive Silica-Based Mesoporous Bioactive Glasses Enriched with Gallium(III)" Materials 11, no. 3: 367. https://doi.org/10.3390/ma11030367