Quantifying Rock Weakening Due to Decreasing Calcite Mineral Content by Numerical Simulations


1
Fluid Systems Modelling, GFZ German Research Centre for Geosciences, Telegrafenberg, 14473 Potsdam, Germany
2
Institute of Earth and Environmental Science, University of Potsdam, Karl-Liebknecht-Str. 24/25, 14476 Potsdam, Germany
*
Author to whom correspondence should be addressed.
Materials 2018, 11(4), 542; https://doi.org/10.3390/ma11040542
Submission received: 16 February 2018
/
Revised: 21 March 2018
/
Accepted: 29 March 2018
/
Published: 1 April 2018
Abstract
:The quantification of changes in geomechanical properties due to chemical reactions is of paramount importance for geological subsurface utilisation, since mineral dissolution generally reduces rock stiffness. In the present study, the effective elastic moduli of two digital rock samples, the Fontainebleau and Bentheim sandstones, are numerically determined based on micro-CT images. Reduction in rock stiffness due to the dissolution of 10% calcite cement by volume out of the pore network is quantified for three synthetic spatial calcite distributions (coating, partial filling and random) using representative sub-cubes derived from the digital rock samples. Due to the reduced calcite content, bulk and shear moduli decrease by 34% and 38% in maximum, respectively. Total porosity is clearly the dominant parameter, while spatial calcite distribution has a minor impact, except for a randomly chosen cement distribution within the pore network. Moreover, applying an initial stiffness reduced by 47% for the calcite cement results only in a slightly weaker mechanical behaviour. Using the quantitative approach introduced here substantially improves the accuracy of predictions in elastic rock properties compared to general analytical methods, and further enables quantification of uncertainties related to spatial variations in porosity and mineral distribution.
1. Introduction
Mineral dissolution and precipitation are micro-scale processes, which may significantly change the mineralogical composition and microstructure of rocks, and consequently affect the effective mechanical rock behaviour at the macro scale. Predicting these changes has a wide practical importance in applied sciences and materials engineering, especially for hydraulically conductive materials where reactive transport takes place (Figure 1): hydrothermal alterations may weaken geological fractures [1] and fault zones up to their reactivation [2], chemical degradation of cements may influence the integrity of wells [3,4] and mineral dissolution can lead to significant weakening of geological reservoirs [5,6]. Hence, the quantification of this direct chemical–mechanical interaction is of substantial relevance within the context of risk assessment for most applications related to geological subsurface utilisation such as geothermal energy systems [7,8,9], enhanced oil recovery [10,11], radioactive waste disposal [12,13], underground coal gasification [14,15,16] and CO2 or geological energy storage [17,18,19].
The main factors contributing to macro-scale elastic rock properties are microstructure and mineral volume fractions as well as the constituent moduli. In addition to the experimental determination of elastic parameters due to changes in rock composition [5,20], a variety of analytical and numerical methods for their calculation exists (Appendix A). Relatively simple approximations are bounding methods, which predict upper and lower limits of the moduli for any given composition, as the estimates introduced by Voigt [21] and Reuss [22], respectively. Both methods average parameters based on the volume fractions of the rock constituents, while the narrower Hashin-Shtrikman [23] bounds allow additional consideration of a spherical shape of these components. The soft-sand and its counterpart the stiff-sand model [24] are based on sphere pack assumptions [25,26] and further take into account grain cementation. Both models are used for granular high-porosity rocks [27], being limited to only two components: fluid and rock. Traditional mean-field homogenisation schemes have the advantage of considering ellipsoidal inclusions of multiple components and are used to address several rock types [28,29,30,31]. These schemes are based on Eshelby’s solution [32] of one ellipsoidal inhomogeneity embedded in an infinite medium and involve the dilute scheme [33], the self-consistent approximation [34] as well as the Mori-Tanaka approach [35]. The simple dilute scheme neglects any mechanical interaction between neighbouring inclusions, and is therefore only valid for low-volume fractions. The Mori-Tanaka approach considers the interaction between the inclusions, but their effects on matrix properties are neglected. Therefore, it is only valid for inclusion volume fractions of up to 20–30% [36,37], whereas the self-consistent approximation is valid for higher inclusion volume fractions [38], since it considers no clear matrix phase and the effective medium is assumed to be a component itself. However, none of the analytical models can determine elastic rock parameters for multi-component systems over a broad range of volume fractions and complex rock microstructures [39,40,41].
Despite their higher computational demand, numerical models are more flexible regarding the number of constituents and complex geometries. These are further used to quantify the influence of pore network and inclusion geometries, using artificial microstructures [42,43,44] or simulating sedimentation processes [45]. Further, petrophysical properties of rocks can be calculated based on 3D images derived from micro-computer tomography (micro-CT) scans. The resulting model geometries consider a more realistic microstructure regarding the shape of single grains, cements and the overall pore network [46,47]. Digital rock physics in view of a virtual laboratory have the advantage of offering a non-destructive method with immediate access to rock parameters. Moreover, the same rock sample can be examined under varying testing conditions or mineral composition, which can be virtually varied [48]. Present numerical models employ calculation techniques to determine static [49,50,51] and dynamic moduli [52] mainly for reservoir rocks such as sandstones [53,54] and carbonates [55,56], but also for shales [57]. However, there is still a discrepancy between the achieved numerical estimates of mechanical properties derived from micro-CT images and laboratory data, where, regardless of the numerical approach, the simulated moduli are systematically higher [58,59]. Uncertainties resulting from micro-CT image processing and the applied segmentation method may contribute to these deviations. Another reason for this numerical overestimation is the inability to fully characterise micro heterogeneities such as grain contacts, small-scale pores and crack networks [60,61]. Furthermore, the effective properties of the mineral phases may be significantly lower than those listed in Mavko et al. [27], as illustrated by Mahabadi et al. [62] who determined the mean Young’s modulus of quartz by micro-indentation testing and demonstrated that its actual value is 15 GPa below that in the standard table [27]. Nevertheless, improving the computational workflow is ongoing research in digital rock physics [60,63], with numerical calculations providing already better estimates of bulk (K) and shear moduli (G) than analytical solutions for certain microstructures (Figure 2).
The present study employs a numerical approach to quantify changes in elastic rock properties, resulting from assumed mineralogical changes within the microstructure. For that purpose, 3D models of two sandstones are used, whereby calcite cement precipitated in the pore network is successively reduced. Since detailed micro-CT data on the development of the spatial calcite distribution in a reference volume are not yet publicly available, the general effect of its spatial distribution is examined by three different geometrical arrangements, including a random distribution, partial filling and coating around the grains. In this context, we also considered the impact of initial elastic moduli of the calcite cement. The simulated mechanical parameters are discussed in the context of widely used state-of-the-art analytical solutions. Improving the quantification of changes in elastic properties as well as the determination of uncertainties related to spatial variations in porosity and mineral distribution are the objectives of our study, supported by an innovative computational method. The investigated scenario is especially of interest within the context of geological subsurface utilisation at operational time scales (e.g., 30–50 years), where changes in elastic properties are of particular relevance to assess reservoir, caprock and fault integrity. Moreover, our findings can be directly applied in material sciences.
2. Materials and Methods
2.1. Characterisation of the Digital Sandstone Samples
In the present study, digital rock samples of the Fontainebleau and Bentheim sandstones are used, which have been comprehensively examined as reference rocks for reservoir engineering applications [65,66]. The available binary datasets are segmented and comprise only grains and intergranular porosity. Both rocks represent fine-grained sandstones (Figure 3b) and are homogeneous and isotropic at the investigated scale [67]. The quasi-pure Fontainebleau sandstone consists of well-sorted monodisperse quartz grains [68], whereby its elastic properties have been studied over a wide range of porosities [64]. The microstructure of the Fontainebleau sample employed here derives from the digital rock physics benchmark of Andrä et al. [59] and has a resolution of 288 × 288 × 300 voxels with an edge length of 7.5 μm (Figure 3a). The total porosity of this digital sample is 14.7%, with a mean grain diameter of 260 μm, calculated by means of the image processing software package ImageJ [69] using a watershed segmentation and particle analysis. The Bentheim sandstone consists besides its main constituent quartz of the minor components kaolinite (3%) and orthoclase (2%) [65]. Nevertheless, the provided microstructure by Alhashmi et al. [70] only comprises a binary dataset. With 10003 voxels and an edge length of 3 μm, it has a considerably higher resolution than the digital Fontainebleau sample. Further, the Bentheim sandstone has a higher porosity (21.6%), a lower mean grain size (190 μm) and a slightly wider particle size distribution (Figure 3b). Since effective elastic moduli are considerably influenced by rock microstructure [52] and differences due to micro-CT resolution should be avoided, the comparability of the microstructures is achieved by an equivalent voxel size, which is scaled to the average grain size. For the Fontainebleau sandstone, 35 voxels characterise an average grain, while the overall resolution of the Bentheim sample has to be reduced to 5003 voxels with an edge length of 6 μm to ensure a comparable representation of 32 voxels per grain.
2.2. Numerical Determination of Effective Rock Properties
The effective elastic rock properties are computed with the open source finite element software package Code_Aster [71] by performing digital uniaxial compression tests on the 3D microstructure of the previously introduced sandstone samples. Here, static rock moduli are determined by solving the equations of linear elasticity. Both, static [38,44] and dynamic approaches [55,60] are applicable to materials with heterogeneities and produce similar results [52]. For digital uniaxial compression testing, orthogonally-mixed boundary conditions are used [72,73]. A small uniform normal strain of 0.1% of the sample’s edge length is assigned at one boundary face, while displacements perpendicular to its opposite face and two adjacent boundaries are prohibited. Thereby, the sample is compressed and strain is forced to develop in the two unconstrained directions (Figure 4). Young’s modulus and Poisson’s ratio are calculated considering the mean stresses and strains along the boundary faces of the cubic sample. Elastic parameters for each orientation are obtained by loading the sample in the respective spatial direction, whereby potential anisotropy can also be determined. Unless otherwise noted, the effective elastic moduli are the mean values, resulting from the three different orthogonal loading directions. The initial parameters of the minerals are standard values, listed in Table 1. Pore space is modelled under dry conditions to ensure comparability with the data provided by Andrä et al. [59].
2.3. Choice of Representative Sub-Cubes
A sub-sampling method is used to decompose the microstructure in a specific number of sub-cubes, which all together represent the main structure (Figure 5). This workflow improves the processing efficiency and results in substantially lower computational times, which is especially relevant for multi-million voxel micro-CT scans. Microstructures are often divided into regular adjacent cubes, which are separated [53] or overlapping each other [55], but also non-neighbouring sub-volumes or a random selection can be employed for that purpose [75,76]. In our approach, the Fontainebleau sandstone is randomly decomposed into 30 sub-cubes of 1003 voxels each, with an allowed overlap of 34% in maximum. Since we calculate the effective elastic properties on the full micro-CT scan resolution, the employed methodology is validated against the benchmark of Ändrä et al. [59], who used the method of Garboczi [77] to determine the elastic parameters. In this context, they determined a bulk modulus of 24.3 and shear modulus of 26.6 GPa, while our mean values are 24.8 and 26.1 GPa, respectively (Table 2). The considerably larger microstructure of the Bentheim sandstone is decomposed randomly into 60 non-overlapping sub-cubes under consideration of the same grain resolution as applied for the Fontainebleau sandstone. Thus, 48% of the rock volume is sub-sampled. Calculating the mechanical properties only for a part of the whole sample will give reasonable results, since Faisal et al. [78] proposed that sampling of a volume fraction of 40–55% by non-overlapping cubes is sufficient to determine effective moduli. The resulting elastic properties and porosities vary for each of the sub-cubes and are discussed in Section 3.1. By decomposing the whole structure in smaller sub-volumes, three representative sub-cubes are identified for each rock. These sub-cubes are chosen by means of two criteria: (1) isotropy of elastic rock properties and (2) range of porosity variation. Both criteria support the representation of the range of uncertainty based on the rock microstructure. The resulting sub-cubes are used for our subsequent simulations to assess the change in elastic rock properties due to the removal of calcite cement.
2.4. Dissolution of Calcite Cementation
Former simulations, which investigated variations in elastic properties due to rock alteration, either assumed changes in its microstructure [75,79] or used micro-CT scans in advance of and subsequent to a dissolution experiment [56]. In all cases, only binary systems have been investigated, focussing on the porosity development due to solid phase degradation. Since quartz is hardly soluble at operational timescales in geological subsurface utilisation, we consider a mineral system consisting of three components: quartz grains, calcite cement and pore space. In this context, precipitated calcite cement within the pore network of the initial digital sandstone samples is assumed, as calcite has a high solubility, fast reaction kinetics and is almost ubiquitous in sedimentary rocks. Consequently, dissolution of calcite cement can lead to substantial rock alteration and weakening. Since reactive transport simulations at pore network scale are out of the scope of the present study, three different approaches to address the dissolution of calcite cement are employed and compared here. The pore space of the two initial sandstone microstructures is filled with calcite cement up to a volume fraction of 10%, whereby the sandstone is reinforced compared to the original microstructure. The permeability of the Fontainebleau sandstone amounts to about 10 mD for an effective porosity of 5% by means of the Kozeny–Carman relation [66]. Even though this represents a relatively low reservoir permeability, the rock is not impervious to fluid flow. Further, the impact of spatial cement distribution is investigated by three general calcite arrangements, which are straightforward to implement: (1) random distribution, (2) partial filling and (3) coating around the grains (Figure 6a). These three basic geometries are used to quantify the general impact of the spatial calcite distribution and to assess if a more complex precipitation pattern, i.e., generated by reactive transport simulations at pore scale, is required for the purpose of the present study. The relative changes in effective elastic properties are quantified by numerical simulations, considering a successive removal of the hypothetical calcite cement (Figure 6b). For some binary microstructures, weaker moduli of the mineral phase quartz are assigned to the grain contact cements, so that the simulated values become consistent with the measured ones [80]. Since the calcite mineral is comparably stiff, the intra-porous calcite cement bulk and shear moduli likely notably differ from those of the mineral phase. Possible reasons for this may be different mineral structures (crystalline, amorphous) and the size of the precipitates, and therefore undetected microporosity. As data on elastic behaviour of calcite cement is not yet available apart from the stiffness moduli for the calcite mineral, a significantly softer value for amorphous calcite [74] is used in our simulations (Table 1). Both values are regarded as upper and lower bounds to enclose a possible range of effective elastic property variation and allow to examine the effect of initial cement moduli.
3. Results
3.1. Evaluation of the Representative Sub-Cubes
The sub-samples representing the entire digital rock vary in porosity, whereby bulk and shear moduli decrease quasi-linearly with increasing porosity. Porosities of the Fontainebleau sub-cubes range between 13.3% and 16.4% (Figure 7a), while the Bentheim sample has a considerably broader porosity spectrum with 14.6% to 28.3% (Figure 7b). The calculated mean elastic properties considering all sub-cubes of the Fontainebleau sandstone show values of 24.8 and 26.1 GPa for bulk and shear moduli, respectively (Table 2), whereas the higher porosities of the Bentheim sample result in lower elastic parameters of 20.4 GPa (K) and 19.6 GPa (G). The mean directional difference of all sub-samples is determined by the mean difference between the minimum and maximum moduli for the three spatial loading directions. Higher values for the Bentheim sandstone are related to its higher total porosity and broader range in particle size as discussed in Section 2.1. The linear relationship between porosity and effective elastic properties for the representative sub-cubes is indicated by a coefficient of determination (r2) of 0.84 to 0.93 for both digital rocks (Table 2). Considering the moduli resulting from the different loading directions instead, characterising the anisotropy of the sub-cubes leads to a lower coefficient of determination with 0.65 to 0.79. As previously stated, the representative sub-cubes should ideally be isotropic and comprise the entire porosity variation bandwidth of the sample to support the representation of the uncertainty range by means of the rock microstructure. Hence, one sub-cube with a porosity equivalent to the entire digital rock sample is selected, while the porosities of the two other sub-volumes are within a distance of one standard deviation (σ) with a tolerance of ± 0.2 σ (Figure 7a,b). Isotropic elastic behaviour of the three sub-cubes is achieved by selecting those with the least difference in directional moduli. Based on these selection criteria, the representative sub-cubes for each rock are highlighted in Figure 7, and represents the porosity bandwidth for the entire sample. For the Fontainebleau sandstone, the elastic moduli of the representative sub-cubes differ between 25.8 and 23.8 GPa (K) as well as 27.3 and 25 GPa (G) (Table 3). The mean value of the three selected sub-cubes deviates between 2.1% (K) and 1.6% (G) compared to the calculated values of Andrä et al. [59] for the entire Fontainebleau microstructure, what demonstrates the validity of our results and the approach using representative sub-cubes to calculate effective properties. The range is broader for the representative sub-volumes of the Bentheim sandstone with 22.4 to 18.2 GPa and 21.4 to 16.9 GPa for bulk and shear moduli, respectively.
3.2. Effect of Spatial Calcite Distribution on Elastic Rock Properties
Digital rock weakening by successive dissolution of calcite cement is implemented by removing calcite minerals in our models. For that purpose, porosity-dependent reduction in elastic rock properties is investigated for three spatial cement distributions (Figure 8). The illustrated range is based on the three selected representative sub-cubes and determined by the least porosity of the representative sub-samples. The respective variations are mainly based on the different volume fractions of calcite cement in the sub-volumes due to their different initial porosities. Calculated elastic moduli for a given mineral composition differ only slightly for the three assessed spatial distributions. Due to the simplified partial filling, rocks behave stiffer in parallel direction to the calcite front and weaker perpendicular to it. Nevertheless, partial mineral filling as well as coating result in similar dissolution-induced elastic moduli reductions and differ by 1.9 GPa in maximum for the Bentheim digital sample (Figure 8b). On the contrary, the random calcite distribution shows slightly higher variations in calculated elastic properties with up to 4 GPa and a generally stiffer behaviour, which is reversed for low calcite volume fractions. For both investigated rock samples, the general trends of reduction in bulk and shear moduli resulting from the spatial distribution of the calcite cement are almost identical. However, the Bentheim rock sample exhibits an overall weaker behaviour and broader variation bandwidths due to the higher initial porosities of the three chosen sub-cubes. The decrease in elastic properties of the Bentheim sandstone is slightly lower compared to that of the Fontainebleau sample in view of the absolute moduli reduction at the same relative calcite cementation. Mean differences in bulk and shear moduli of 1.3 GPa are relatively small, but indicate that the impact of cementation is more pronounced at lower porosities, i.e., for the Fontainebleau sample used here.
3.3. Impact of Calcite Cement Modulus on Effective Elastic Rock Properties
As expected, applying significantly softer moduli for the calcite cement, whereby the initial stiffness is reduced by 47 %, leads to lower effective elastic rock properties (Table 1). However, the general trend remains mainly unchanged (Figure 8). Only the differences between the three investigated spatial calcite distributions decrease, while the range based on the three representative sub-cubes becomes broader, since differences in their initial porosities become more dominant. Considering a stiff cement, calcite dissolution of 10% by volume out of the pore network reduces bulk and shear moduli in maximum by 34.2% and 38.4%, respectively. Reduction in effective elastic properties amounts to 24.3% (K) and 29.1% (G), assuming significantly softer calcite cement moduli (Table 4). Similar results are obtained for a calcite cement removal of 5% by volume, whereby the differences between soft and stiff cements are less pronounced due to the overall lower calcite volume fraction. Hence, initial elastic parameters of the cement are not the dominant factor, since also considerably softer calcite moduli induce a significant effective elastic property reduction.
4. Discussion
For the considered changes in microstructure of both sandstones, porosity is the dominant parameter determining the effective mechanical rock properties, as emphasised by our results indicating only low differences in elastic moduli between the three investigated spatial calcite distributions. Only the random distribution exhibits higher bulk and especially shear moduli, resulting from the interconnection of calcite cement within the pore network, strengthening the entire sample structure. This interconnection decreases for significantly lower calcite volume fractions, whereby more isolated cement minerals occur, resulting in lower effective moduli. The considered random and coating calcite distributions represent two uniform dissolution patterns [81], while synthetic partial filling is an equivalent to a discrete dissolution front. Besides these three scenarios, evolving wormholes or fingering are further observed phenomena [82,83] due to development of preferential flow paths. Even if not taken into account here, it can be assumed that wormholes will induce a significant anisotropy within the microstructure, while the mean value of the effective elastic properties is likely identical to that in the scenarios considered in the present study, e.g., as for the extreme case of partial filling. Examining such complex structures is of particular relevance when anisotropic changes in elastic properties are addressed, which is out of the scope of the present study. Further, our simulation results show slight differences in elastic moduli for all scenarios due to the initial porosity of the sandstones, indicating that the impact of calcite cementation is more pronounced at lower porosities, since cements generally tend to stabilise the rock matrix. This is consistent with the findings of Vanorio et al. [84], who analysed salt precipitation and demonstrated that high-porosity sandstones (porosities > 15%) are less sensitive to rock strengthening than low-porosity ones.
Simulating effective rock properties due to variations in the volumetric calcite cement content by three spatial calcite distributions further allows to quantify rock strengthening due to calcite precipitation. In this context, rock weakening due to mineral dissolution is of particular interest in geological subsurface utilisation, especially related to reservoir, caprock and fault integrity, but also in material sciences related to hydraulically conductive materials (e.g., natural stones used in construction works). Previous studies investigated this effect by means of laboratory experiments [5,6] and numerical simulations [56,75]. While Bemer et al. [5] demonstrated by flow-through experiments on a limestone that homogeneous chemical alterations induced a porosity reduction by up to 2% and a decrease in elastic moduli by up to 35%, Shulakova et al. [56] numerically simulated changes for the same rock type based on micro-CT scans before and after dissolution experiments. They determined a porosity increase of 6.6% by volume and a comparably lower decrease in elastic moduli by 28.6% (K) and 23% (G). The precipitation of 2% salt by volume in sandstones has been experimentally investigated by Vanorio et al. [84] and exhibits an increase in rock stiffness by 4% and 28% for the bulk and shear moduli, respectively. Lamy-Chappuis et al. [6] examined the dissolution of calcite minerals in a sandstone, where an increase in total porosity by only 4.5% reduces rock stiffness by 36% (K) and 33% (G). Following our findings, an absolute porosity decrease by 5% reduces bulk and shear moduli by up to 26.2% and 18.4%, respectively (Table 4). These results are comparable to those of Shulakova et al. [56], but underestimate available experimental data, which is partly related to differences in the rock microstructure, initial porosity and rock property variations. However, the higher elastic moduli reductions determined in the aforementioned laboratory experiments [5,6,84] emphasise the relevance of chemical-mechanical interactions as well as the substantial requirement to improve the related process understanding and to consider these processes in assessments of elastic rock properties.
Nevertheless, the quantified changes in effective mechanical rock properties can only achieve the quality of the geometrical representation of the initial microstructure. While the elastic moduli determined for the Fontainebleau sandstone exhibit a generally good agreement with available benchmark data [59] and only low overestimation of experimental data (Figure 9), the simulated moduli for the Bentheim microstructure are significantly higher than the published data with 12.5 GPa (K) and 13 GPa (G) [63]. The Bentheim sandstone has minor components of the weak clay mineral kaolinite with 3% by volume [65]. This was not considered in the initial microstructure but could notably reduce elastic rock properties, especially when these are present as pore-lining phase [48]. Moreover, effective elastic moduli overestimation is a general problem within the field of digital rock physics [58] due to the high sensitivity to micro heterogeneities such as cracks, grain contacts and microporosity, which are only insufficiently represented at grain scale [60]. However, improving numerical simulation approaches to determine effective elastic properties is in the scope of ongoing research [58,60,63].
Despite these general challenges in digital rock physics, the method introduced here allows to quantify changes in elastic rock moduli with an increase in accuracy compared to state-of-the-art analytical methods, e.g., the Mori-Tanaka approach or the self-consistent scheme (Figure 9). Furthermore, with the availability of micro-CT scans and/or synthetic microstructures, numerical models allow us to overcome the limitation of using ellipsoidal inclusions, which is generally the case for analytical approaches. Hence, uncertainties related to the composition and structure of the pore network can be quantified in addition to the effect of elastic moduli of cementing minerals as well as temporal and spatial changes in the rock microstructure due to chemical alterations.
5. Conclusions
The presented approach is employed to numerically determine bulk and shear moduli of two digital rock samples, the Fontainebleau and the Bentheim sandstones, based on micro-CT images by means of representative sub-cubes. It allows for quantification of changes in mechanical rock behaviour as a result of variations in mineral composition and microstructure, as demonstrated here for the successive removal of calcite cement. Moreover, it enables to determine uncertainties related to porosity variations of micro-CT scans, the effect of initial cement moduli and varying spatial distributions of calcite cement within the pore network. The accuracy in predicting elastic rock properties is substantially improved compared to the general analytical methods. For the dissolution of 10% calcite by volume investigated in the present study, the elastic properties decrease by up to 34% and 38% for the bulk and shear moduli, respectively. For the considered changes in the sandstone microstructure, porosity is clearly the dominant parameter, while significant softer calcite cement moduli lead only to a slightly weaker mechanical behaviour. Also, the spatial cement distribution has only a minor impact, except for the case of a random mineral distribution. Here, the calcite cement is interconnected and stabilises the rock matrix.
Future work will focus on the integration of experimentally-determined variations in mechanical rock behaviour with simulations based on micro-CT images derived from flow-through experiments taking into account chemical reactions. In this context, micromechanical approaches may offer an opportunity to study variations in rock anisotropy, which is of high practical interest. Further, the validation of digital rock physics as potential upscaling methodology for mechanical rock properties is currently intensively discussed in the digital rock physics community. Particularly the choice of the representative volume element size for heterogeneous rock structures, depending on the scope of application is a challenge of high priority. Moreover, different rock types, also including such with pre-existing fractures, should be investigated prioritised by their relevance to geological subsurface utilisation. All these scientific challenges will significantly contribute to the understanding of macro-scale natural phenomena and further improve geotechnical applications, where changes in elastic properties are of particular relevance regarding reservoir, caprock and fault integrity, but also beyond.
Acknowledgments
The authors gratefully acknowledge the funding received for the Geo: N project GEOSMART (grant 03G0867E) by the German Federal Ministry for Education and Research (BMBF). Furthermore, we are grateful for the constructive comments provided by the three anonymous reviewers.
Author Contributions
M.W., T.K. and M.K. conceived and designed the simulations; M.W. performed the simulations; M.W. and T.K. analysed the data; M.W., T.K. and M.K. wrote paper.
Conflicts of Interest
The authors declare no conflict of interest.
Appendix A. Analytical Methods to Calculate Effective Elastic Properties
Effective elastic rock properties mainly depend on the volume fractions and mechanical properties of their components (minerals and pore fluids) as well as the rock microstructure. The four well-known analytical approaches for calculating effective elastic rock properties, explained in the following were used for comparison against our simulation results.
Appendix A.1. Voigt and Reuss Bounds
The simplest bounding methods to calculate effective elastic moduli of a composite can be derived from Voigt [21] and Reuss [22]. The authors predict upper and lower strength bounds by averaging elastic parameters of the respective constituents, while neglecting the microstructure. Effective moduli for any given volume fraction fall between these bounds. Voigts average (Equation (A1)) gives the upper bound for the effective elastic properties of a rock, consisting of i isotropic components by calculating the arithmetic mean () of the component’s moduli () weighted by their volume fractions ().
For any composition, Reuss’ average (Equation (A2)) gives the lower bound by determining the harmonic mean () of the component’s moduli () weighted by their volume fractions (). The predicted effective elastic properties coincide with the Hashin–Shtrikman lower bound [23], when one of the constituents is a pore fluid with a zero shear modulus [27].
Appendix A.2. Mori-Tanaka Scheme
The Mori-Tanaka scheme [35,85] belongs to a group of analytical mean-field homogenization approaches, which consider a simplified microstructure in terms of an ellipsoidal shape of its components. It is used for moderate inclusion volume fractions of 30% in maximum [37]. Each of the ellipsoidal inhomogeneities is assumed to be ebedded in an infinite matrix material, derived from the approximations of Eshelby [32]. Interactions between the components are taken into account by applying an effective uniform matrix strain to each of the inclusions. The Mori-Tanaka approach coincides with the Hashin-Shtrikman upper and lower bounds in case of binary mixtures with spherical inclusions [86]. The effective elasticity tensor () of a composite can be calculated by Equation (A3), considering the stiffness of a matrix material (), its inclusions () and the inclusion’s volume fractions ().
The strain-localization tensor () is given by Equation (A4) and comprises the fourth-order identity tensor (I), the volume fractions of the matrix () and the influence tensor ().
To determine the influence tensor (Equation (A5)), the Eshelby tensor () has to be calculated, which in turn depends on the shape of the ellipsoid and Poisson’s ratio of the matrix ().
Here, a spherical shape is assumed for all inclusions, whereby the fourth-order Eshelby tensor has the compact form given in Equation (A6). Mathematical expressions for several ellipsoidal inclusion shapes can be found in Mura [87]. The indices denote the position of the tensor component. Kronecker delta () is equal to one, if two indices have the same value (e.g., for ), otherwise it becomes zero (e.g., for ).
Appendix A.3. Self-Consistent Scheme
Another mean-field homogenization approach is the self-consistent scheme by Hill [34]. It is also based on Eshelby’s solution for an ellipsoidal inclusion embedded in an infinite matrix material and is defined by Equation (A7). Unlike the Mori-Tanaka approach, it can be employed for higher volume fractions [38], since interactions between the components are approximated by replacing the matrix () by a material of unknown stiffness ().
Hence, the influence tensor (Equation (A8)) depends on the elasticity tensor of the unknown matrix material (), whereby an iterative implementation is required to calculate and the related Eshelby tensor .
References
- Meller, C.; Kohl, T. The significance of hydrothermal alteration zones for the mechanical behavior of a geothermal reservoir. Geotherm. Energy 2014, 2, 1–21. [Google Scholar] [CrossRef]
- Heinicke, J.; Fischer, T.; Gaupp, R.; Götze, J.; Koch, U.; Konietzky, H.; Stanek, K. Hydrothermal alteration as a trigger mechanism for earthquake swarms: The Vogtland/NW Bohemia region as a case study. Geophys. J. Int. 2009, 178, 1–13. [Google Scholar] [CrossRef]
- Li, Q.; Lim, Y.M.; Flores, K.M.; Kranjc, K.; Jun, Y.S. Chemical reactions of portland cement with aqueous CO2 and their impacts on cement’s mechanical properties under geologic CO2 sequestration conditions. Environ. Sci. Technol. 2015, 49, 6335–6343. [Google Scholar] [CrossRef] [PubMed]
- Choi, B.Y.; Lee, H.; Chae, G.T.; Kim, T.; Kim, J.C. Alteration processes of cement induced by CO2-saturated water and its effect on physical properties: Experimental and geochemical modeling study. Chem. Erde Geochem. 2016, 76, 597–604. [Google Scholar] [CrossRef]
- Bemer, E.; Nguyen, M.T.; Dautriat, J.; Adelinet, M.; Fleury, M.; Youssef, S. Impact of chemical alteration on the poromechanical properties of carbonate rocks. Geophys. Prospect. 2016, 64, 810–827. [Google Scholar] [CrossRef]
- Lamy-Chappuis, B.; Angus, D.; Fisher, Q.J.; Yardley, B.W.D. The effect of CO2-enriched brine injection on the mechanical properties of calcite-bearing sandstone. Int. J. Greenh. Gas Control 2016, 52, 84–95. [Google Scholar] [CrossRef]
- Hofmann, H.; Blöcher, G.; Börsing, N.; Maronde, N.; Pastrik, N.; Zimmermann, G. Potential for enhanced geothermal systems in low permeability limestones - stimulation strategies for the Western Malm karst (Bavaria). Geothermics 2014, 51, 351–367. [Google Scholar] [CrossRef]
- Blöcher, G.; Reinsch, T.; Henninges, J.; Milsch, H.; Regenspurg, S.; Kummerow, J.; Francke, H.; Kranz, S.; Saadat, A.; Zimmermann, G.; et al. Hydraulic history and current state of the deep geothermal reservoir Groß Schönebeck. Geothermics 2016, 63, 27–43. [Google Scholar] [CrossRef]
- Jacquey, A.B.; Cacace, M.; Blöcher, G.; Watanabe, N.; Huenges, E.; Scheck-Wenderoth, M. Thermo-poroelastic numerical modelling for enhanced geothermal system performance: Case study of the Groß Schönebeck reservoir. Tectonophysics 2016, 684, 119–130. [Google Scholar] [CrossRef]
- Liu, D.; Zhong, X.; Guo, J.; Shi, X.; Qi, Y. Enhanced oil recovery from fractured carbonate reservoir using membrane technology. J. Pet. Sci. Eng. 2015, 135, 10–15. [Google Scholar] [CrossRef]
- Hoteit, H.; Chawathe, A. Making field-scale chemical EOR simulations a practical reality using dynamic gridding. In Proceedings of the Spe EOR Conference at Oil and Gas West Asia, Muscat, Oman, 31 March–2 April 2014; pp. 1–18. [Google Scholar]
- Alexander, W.; Reijonen, H.; McKinley, I. Natural analogues: Studies of geological processes relevant to radioactive waste disposal in deep geological repositories. Swiss J. Geosci. 2015, 108, 75–100. [Google Scholar] [CrossRef]
- Fall, M.; Nasir, O.; Nguyen, T.S. A coupled hydro-mechanical model for simulation of gas migration in host sedimentary rocks for nuclear waste repositories. Eng. Geol. 2014, 176, 24–44. [Google Scholar] [CrossRef]
- Otto, C.; Kempka, T. Prediction of steam jacket dynamics and water balances in underground coal gasification. Energies 2017, 10, 739. [Google Scholar] [CrossRef]
- Otto, C.; Kempka, T.; Kapusta, K.; Stańczyk, K. Fault reactivation can generate hydraulic short circuits in underground coal gasification—New insights from regional-scale thermo-mechanical 3D modeling. Minerals 2016, 6, 101. [Google Scholar] [CrossRef]
- Otto, C.; Kempka, T. Thermo-mechanical simulations of rock behavior in underground coal gasification show negligible impact of temperature-dependent parameters on permeability changes. Energies 2015, 8, 5800–5827. [Google Scholar] [CrossRef]
- De Lucia, M.; Kempka, T.; Kühn, M. A coupling alternative to reactive transport simulations for long-term prediction of chemical reactions in heterogeneous CO2 storage systems. Geosci. Model Dev. 2015, 8, 279–294. [Google Scholar] [CrossRef]
- Klein, E.; De Lucia, M.; Kempka, T.; Kühn, M. Evaluation of long-term mineral trapping at the Ketzin pilot site for CO2 storage: An integrative approach using geochemical modelling and reservoir simulation. Int. J. Greenh. Gas Control 2013, 19, 720–730. [Google Scholar] [CrossRef]
- Hangx, S.; Bakker, E.; Bertier, P.; Nover, G.; Busch, A. Chemical-mechanical coupling observed for depleted oil reservoirs subjected to long-term CO2-exposure—A case study of the Werkendam natural CO2 analogue field. Earth Planet. Sci. Lett. 2015, 428, 230–242. [Google Scholar] [CrossRef]
- Vialle, S.; Vanorio, T. Laboratory measurements of elastic properties of carbonate rocks during injection of reactive CO2-saturated water. Geophys. Res. Lett. 2011, 38, L01302. [Google Scholar] [CrossRef]
- Voigt, W. Über die Beziehung zwischen den beiden Elasticitätsconstanten isotroper Körper. Ann. Phys. 1889, 274, 573–587. (In German) [Google Scholar] [CrossRef]
- Reuss, A. Berechnung der Fliessgrenze von Mischkristallen auf Grund der Plastizitätitsbedingung für Einkristalle. Z. Angew. Math. Mech. 1929, 9, 49–58. (In German) [Google Scholar] [CrossRef]
- Hashin, Z.; Shtrikman, S. A variational approach to the elastic behavior of multiphase materials. J. Mech. Phys. Solids 1962, 11, 127–140. [Google Scholar] [CrossRef]
- Dvorkin, J.; Nur, A. Elasticity of high-porosity sandstones: Theory for two North Sea data sets. Geophysics 1996, 61, 890–893. [Google Scholar] [CrossRef]
- Hertz, H. Über die Berührung fester elastischer Körper. J. Die Reine Angew. Math. 1881, 92, 156–171. (In German) [Google Scholar]
- Mindlin, R. Compliance of elastic bodies in contact. J. Appl. Mech. 1949, 16, 259–268. [Google Scholar]
- Mavko, G.; Mukerji, T.; Dvorkin, J. The Rock Physics Handbook: Tools for Seismic Analysis of Porous Media; Cambridge University Press: Cambridge, UK, 2009; ISBN 9780521861366. [Google Scholar]
- Maghous, S.; Consoli, N.; Fonini, A.; Pasa Dutra, V. A theoretical-experimental approach to elastic and strength properties of artificially cemented sand. Comput. Geotech. 2014, 62, 40–50. [Google Scholar] [CrossRef]
- Zhao, L.Y.; Zhu, Q.Z.; Xu, W.Y.; Dai, F.; Shao, J.F. A unified micromechanics-based damage model for instantaneous and time-dependent behaviors of brittle rocks. Int. J. Rock Mech. Min. Sci. 2016, 84, 187–196. [Google Scholar] [CrossRef]
- Arns, C.; Knackstedt, M.; Pinczewski, W.; Garboczi, E. Computation of linear elastic properties from microtomographic images: Methodology and agreement between theory and experiment. Geophysics 2002, 67, 1396–1405. [Google Scholar] [CrossRef]
- Nicolás-López, R.; Valdiviezo-Mijangos, O.C. Rock physics templates for integrated analysis of shales considering their mineralogy, organic matter and pore fluids. J. Pet. Sci. Eng. 2016, 137, 33–41. [Google Scholar] [CrossRef]
- Eshelby, J. The determination of the elastic field of an ellipsoidal inclusion, and related problems. Math. Phys. Eng. Sci. 1957, 241, 376–396. [Google Scholar] [CrossRef]
- Withers, P.; Stobb, W.; Pedersen, O. The application of the Eshelby method of internal stress determination to short fibre metal matrix composites. Acta Metall. 1989, 37, 3061–3084. [Google Scholar] [CrossRef]
- Hill, R. A self-consistent mechanics of composite materials. J. Mech. Phys. Solids 1965, 13, 213–222. [Google Scholar] [CrossRef]
- Mori, T.; Tanaka, K. Average stress in matrix and average elastic energy of materials with misfitting inclusions. Acta Metall. 1973, 21, 571–574. [Google Scholar] [CrossRef]
- Giraud, A.; Huynh, Q.V.; Hoxha, D.; Kondo, D. Application of results on Eshelby tensor to the determination of effective poroelastic properties of anisotropic rocks-like composites. Int. J. Solids Struct. 2007, 44, 3756–3772. [Google Scholar] [CrossRef]
- Parsaee, A.; Shokrieh, M.M.; Mondali, M. A micro-macro homogenization scheme for elastic composites containing high volume fraction multi-shape inclusions. Comput. Mater. Sci. 2016, 121, 217–224. [Google Scholar] [CrossRef]
- Klusemann, B.; Svendsen, B. Homogenization methods for multi-phase elastic composites: Comparisons and benchmarks. Tech. Mech. 2010, 30, 374–386. [Google Scholar]
- Sherzer, G.; Gao, P.; Schlangen, E.; Ye, G.; Gal, E. Upscaling cement paste microstructure to obtain the fracture, shear, and elastic concrete mechanical LDPM parameters. Materials 2017, 10, 242. [Google Scholar] [CrossRef] [PubMed]
- Zhuang, X.; Wang, Q.; Zhu, H. Effective properties of composites with periodic random packing of ellipsoids. Materials 2017, 10, 112. [Google Scholar] [CrossRef] [PubMed]
- Pettermann, H.E.; Huber, C.O.; Luxner, M.H.; Nogales, S.; Böhm, H.J. An incremental Mori-Tanaka homogenization scheme for finite: Strain thermoelastoplasticity of MMCs. Materials 2010, 3, 434–451. [Google Scholar] [CrossRef]
- Wetzel, M.; Kempka, T.; Kühn, M. Predicting macroscopic elastic rock properties requires detailed information on microstructure. Energy Procedia 2017, 125, 561–570. [Google Scholar] [CrossRef]
- Suvorov, A.; Selvadurai, A. Effective medium methods and a computational approach for estimating geomaterial properties of porous materials with randomly oriented ellipsoidal pores. Comput. Geotech. 2011, 38, 721–730. [Google Scholar] [CrossRef]
- Tsesarsky, M.; Hazan, M.; Gal, E. Estimating the elastic moduli and isotropy of block inmatrix (bim) rocks by computational homogenization. Eng. Geol. 2016, 200, 58–65. [Google Scholar] [CrossRef]
- Sain, R. Numerical Simulation of Pore-Scale Heterogeneity and Its Effects on Elastic, Electrical and Transport Properties. Ph.D. Thesis, Stanford University, Stanford, CA, USA, 2010. [Google Scholar]
- Dvorkin, J.; Derzhi, N.; Diaz, E.; Fang, Q. Relevance of computational rock physics. Geophysics 2011, 76, E141–E153. [Google Scholar] [CrossRef]
- Sell, K.; Saenger, E.; Falenty, A.; Chaouachi, M.; Haberthür, D.; Enzmann, F.; Kuhs, W.; Kersten, M. On the path to the digital rock physics of gas hydrate-bearing sediments—Processing of in situ synchrotron-tomography data. Solid Earth 2016, 7, 1243–1258. [Google Scholar] [CrossRef]
- Saxena, N. Exact results for generalized Biot-Gassmann equations for rocks that change in pore shape and grain geometry. Geophys. J. Int. 2015, 203, 1575–1586. [Google Scholar] [CrossRef]
- Roberts, A.; Garboczi, E. Computation of the linear elastic properties of random porous materials with a wide variety of microstructure. Proc. R. Soc. Lond. A Math. Phys. Eng. Sci. 2002, 458, 1033–1054. [Google Scholar] [CrossRef]
- Griffiths, D.V.; Paiboon, J.; Huang, J.; Fenton, G.A. Homogenization of geomaterials using the random finite element method. Geotech. Saf. Risk IV 2014, 43–51. [Google Scholar] [CrossRef]
- Cheng, H.; Zhu, B.; Yuen, D.A.; Shi, Y. Submicron size-scale mapping of carbonate effective elastic properties from FIB-SEM images and finite element method. Sci. China Earth Sci. 2016, 60, 557–575. [Google Scholar] [CrossRef]
- Saenger, E.H. Numerical methods to determine effective elastic properties. Int. J. Eng. Sci. 2008, 46, 598–605. [Google Scholar] [CrossRef]
- Dvorkin, J.; Nur, A. Scale of experiment and rock physics trends. Lead. Edge 2009, 28, 110–115. [Google Scholar] [CrossRef]
- Han, Y.; Hu, D.; Matzar, L. Numerical computation of elastic properties for porous rocks based on CT-scanned images using direct mapping method. J. Pet. Sci. Eng. 2014, 122, 346–353. [Google Scholar] [CrossRef]
- Saenger, E.H.; Vialle, S.; Lebedev, M.; Uribe, D.; Osorno, M.; Duda, M.; Steeb, H. Digital carbonate rock physics. Solid Earth 2016, 7, 1185–1197. [Google Scholar] [CrossRef]
- Shulakova, V.; Sarout, J.; Pimienta, L.; Lebedev, M.; Mayo, S.; Clennell, M.; Pervukhina, M. Effect of supercritical CO2 on carbonates: Savonnières sample case study. Geophys. Prospect. 2017, 65, 251–265. [Google Scholar] [CrossRef]
- Goodarzi, M.; Rouainia, M.; Aplin, A.C. Numerical evaluation of mean-field homogenisation methods for predicting shale elastic response. Comput. Geosci. 2016, 20, 1109–1122. [Google Scholar] [CrossRef]
- Saxena, N.; Hofmann, R.; Alpak, F.O.; Dietderich, J.; Hunter, S.; Day-Stirrat, R.J. Effect of image segmentation & voxel size on micro-CT computed effective transport & elastic properties. Mar. Pet. Geol. 2017, 86, 972–990. [Google Scholar] [CrossRef]
- Andrä, H.; Combaret, N.; Dvorkin, J.; Glatt, E.; Han, J.; Kabel, M.; Keehm, Y.; Krzikalla, F.; Lee, M.; Madonna, C.; et al. Digital rock physics benchmarks-part II: Computing effective properties. Comput. Geosci. 2013, 50, 33–43. [Google Scholar] [CrossRef]
- Madonna, C.; Almqvist, B.S.G.; Saenger, E.H. Digital rock physics: Numerical prediction of pressure-dependent ultrasonic velocities using micro-CT imaging. Geophys. J. Int. 2012, 189, 1475–1482. [Google Scholar] [CrossRef]
- Shulakova, V.; Pervukhina, M.; Tobias, M.M.; Lebedev, M.; Mayo, S.; Schmid, S.; Golodoniuc, P.; De Paula, O.B.; Clennell, M.B.; Gurevich, B. Computational elastic up-scaling of sandstone on the basis of X-ray micro-tomographic images. Geophys. Prospect. 2013, 61, 287–301. [Google Scholar] [CrossRef]
- Mahabadi, O.K.; Randall, N.X.; Zong, Z.; Grasselli, G. A novel approach for micro-scale characterization and modeling of geomaterials incorporating actual material heterogeneity. Geophys. Res. Lett. 2012, 39, L01303. [Google Scholar] [CrossRef]
- Saenger, E.H.; Lebedev, M.; Uribe, D.; Osorno, M.; Vialle, S.; Duda, M.; Iglauer, S.; Steeb, H. Analysis of high-resolution X-ray computed tomography images of Bentheim sandstone under elevated confining pressures. Geophys. Prospect. 2016, 64, 848–859. [Google Scholar] [CrossRef]
- Han, D. Effects of Porosity and Clay Content on Acoustic Properties of Sandstones and Uncosolidated Sediments. Ph.D. Thesis, Stanford University, Stanford, CA, USA, 1986. [Google Scholar]
- Klein, E.; Reuschlé, T. A model for the mechanical behaviour of Bentheim sandstone in the brittle regime. Pure Appl. geophys. 2003, 160, 833–849. [Google Scholar] [CrossRef]
- Gomez, C.; Dvorkin, D.; Vanorio, T. Laboratory measurements of porosity, permeability, resistivity, and velocity on Fontainebleau sandstones. Geophysics 2010, 75, E191–E204. [Google Scholar] [CrossRef]
- David, E.C.; Fortin, J.; Schubnel, A.; Guéguen, Y.; Zimmerman, R.W. Laboratory measurements of low- and high-frequency elastic moduli in Fontainebleau sandstone. Geophysics 2013, 78, D369–D379. [Google Scholar] [CrossRef]
- Bourbie, T.; Zinszner, B. Hydraulic and acoustic properties as a function of porosity in Fontainebleau Sandstone. J. Geophys. Res. Solid Earth 1985, 90, 11524–11532. [Google Scholar] [CrossRef]
- Schindelin, J.; Rueden, C.T.; Hiner, M.C.; Eliceiri, K.W. The ImageJ ecosystem: An open platform for biomedical image analysis. Mol. Reprod. Dev. 2015, 82, 518–529. [Google Scholar] [CrossRef] [PubMed]
- Alhashmi, Z.; Blunt, M.J.; Bijeljic, B. The Impact of Pore Structure Heterogeneity, Transport, and Reaction Conditions on Fluid–Fluid Reaction Rate Studied on Images of Pore Space. Transp. Porous Media 2016, 115, 215–237. [Google Scholar] [CrossRef]
- Electricité de France. Finite Element Code_Aster, Analysis of Structures and Thermomechanics for Studies and Research. 2017. Available online: www.code-aster.org (accessed on 30 March 2018).
- Huang, J.; Krabbenhoft, K.; Lyamin, A. Statistical homogenization of elastic properties of cement paste based on X-ray microtomography images. Int. J. Solids Struct. 2013, 50, 699–709. [Google Scholar] [CrossRef]
- Cho, Y.J.; Kang, Y.; Lee, Y.C.; Park, Y.; Lee, W. Influence of partially debonded interface on elasticity of syntactic foam: A numerical study. Materials 2017, 10, 911. [Google Scholar] [CrossRef] [PubMed]
- Faatz, M.; Cheng, W.; Wegner, G.; Fytas, G.; Penciu, R.S.; Economou, E. Mechanical strength of amorphous CaCO3 colloidal spheres. Langmuir 2005, 21, 6666–6668. [Google Scholar] [CrossRef] [PubMed]
- Wojtacki, K.; Lewandowska, J.; Gouze, P.; Lipkowski, A. Numerical computations of rock dissolution and geomechanical effects for CO2 geological storage. Int. J. Numer. Anal. Methods Geomech. 2015, 39, 482–506. [Google Scholar] [CrossRef] [Green Version]
- Łydzba, D.; Rózański, A.; Rajczakowska, M.; Stefaniuk, D. Random checkerboard based homogenization for estimating effective thermal conductivity of fully saturated soils. J. Rock Mech. Geotech. Eng. 2016, 9, 18–28. [Google Scholar] [CrossRef]
- Garboczi, E. Finite Element and Finite Difference Programs for Computing the Linear Electric and Linear Elastic Properties of Digital Images of Random Materials; Internal Report 6269; National Institute of Standards and Technology-NIST: Gaithersburg, MD, USA, 1998. [Google Scholar]
- Faisal, T.; Awedalkarim, A.; Chevalier, S.; Jouini, M.; Sassi, M. Direct scale comparison of numerical linear elastic moduli with acoustic experiments for carbonate rock X-ray CT scanned at multi-resolutions. J. Pet. Sci. Eng. 2017, 152, 653–663. [Google Scholar] [CrossRef]
- Wojtacki, K.; Daridon, L.; Monerie, Y. Computing the elastic properties of sandstone submitted to progressive dissolution. Int. J. Rock Mech. Min. Sci. 2017, 95, 16–25. [Google Scholar] [CrossRef]
- Knackstedt, M.; Latham, S.; Madadi, M.; Sheppard, A.; Varslot, T. Digital rock physics: 3D imaging of core material and correlations to acoustic and flow properties. Lead. Edge 2009, 28, 28–33. [Google Scholar] [CrossRef]
- Menke, H.; Bijeljic, B.; Andrew, M.; Blunt, M. Dynamic three-dimensional pore-scale imaging of reaction in a carbonate at reservoir conditions. Environ. Sci. Technol. 2015, 49, 4407–4414. [Google Scholar] [CrossRef] [PubMed]
- Lebedev, M.; Zhang, Y.; Sarmadivaleh, M.; Barifcani, A.; Al-Khdheeawi, E.; Iglauer, S. Carbon geosequestration in limestone: Pore-scale dissolution and geomechanical weakening. Int. J. Greenh. Gas Control 2017, 66, 106–119. [Google Scholar] [CrossRef]
- Luquot, L.; Hebert, V.; Rodriguez, O. Calculating structural and geometrical parameters by laboratory measurements and X-ray microtomography: A comparative study applied to a limestone sample before and after a dissolution experiment. Solid Earth 2016, 7, 441–456. [Google Scholar] [CrossRef]
- Vanorio, T.; Nur, A.; Ebert, Y. Rock physics analysis and time-lapse rock imaging of geochemical effects due to the injection of CO2 into reservoir rocks. Geophysics 2011, 76, O23–O33. [Google Scholar] [CrossRef]
- Benveniste, Y. A new approach to the application of Mori-Tanaka’s theory in composite materials. Mech. Mater. 1987, 6, 147–157. [Google Scholar] [CrossRef]
- Weng, G.J. A dynamical theory for the Mori-Tanaka and Ponte Castañeda-Willis estimates. Mech. Mater. 2010, 42, 886–893. [Google Scholar] [CrossRef]
- Mura, T. Micromechanics of Defects in Solids; Martinus Nijhoff Publishers: Dordrecht, The Netherlands, 1987. [Google Scholar]
Figure 1.
(a) Chemical processes at micro scale, as the precipitation and the dissolution of minerals, can significantly weaken or strengthen a rock, which affects coupled processes at the macro scale. (b) This is of particular relevance for risk assessment within the context of geological subsurface utilisation, e.g., to assess potential well leakage, reservoir integrity and fault reactivation.

Figure 2.
State-of-the-art analytical solutions as the Mori-Tanaka approach (MT, dotted line) and the self-consistent scheme (SC, dashed line) overestimate the experimentally determined (a) bulk and (b) shear moduli (black-filled circles) of the Fontainebleau sandstone [64], while numerical simulations (empty circle) based on a micro-CT scan [59] result in substantially better estimations.
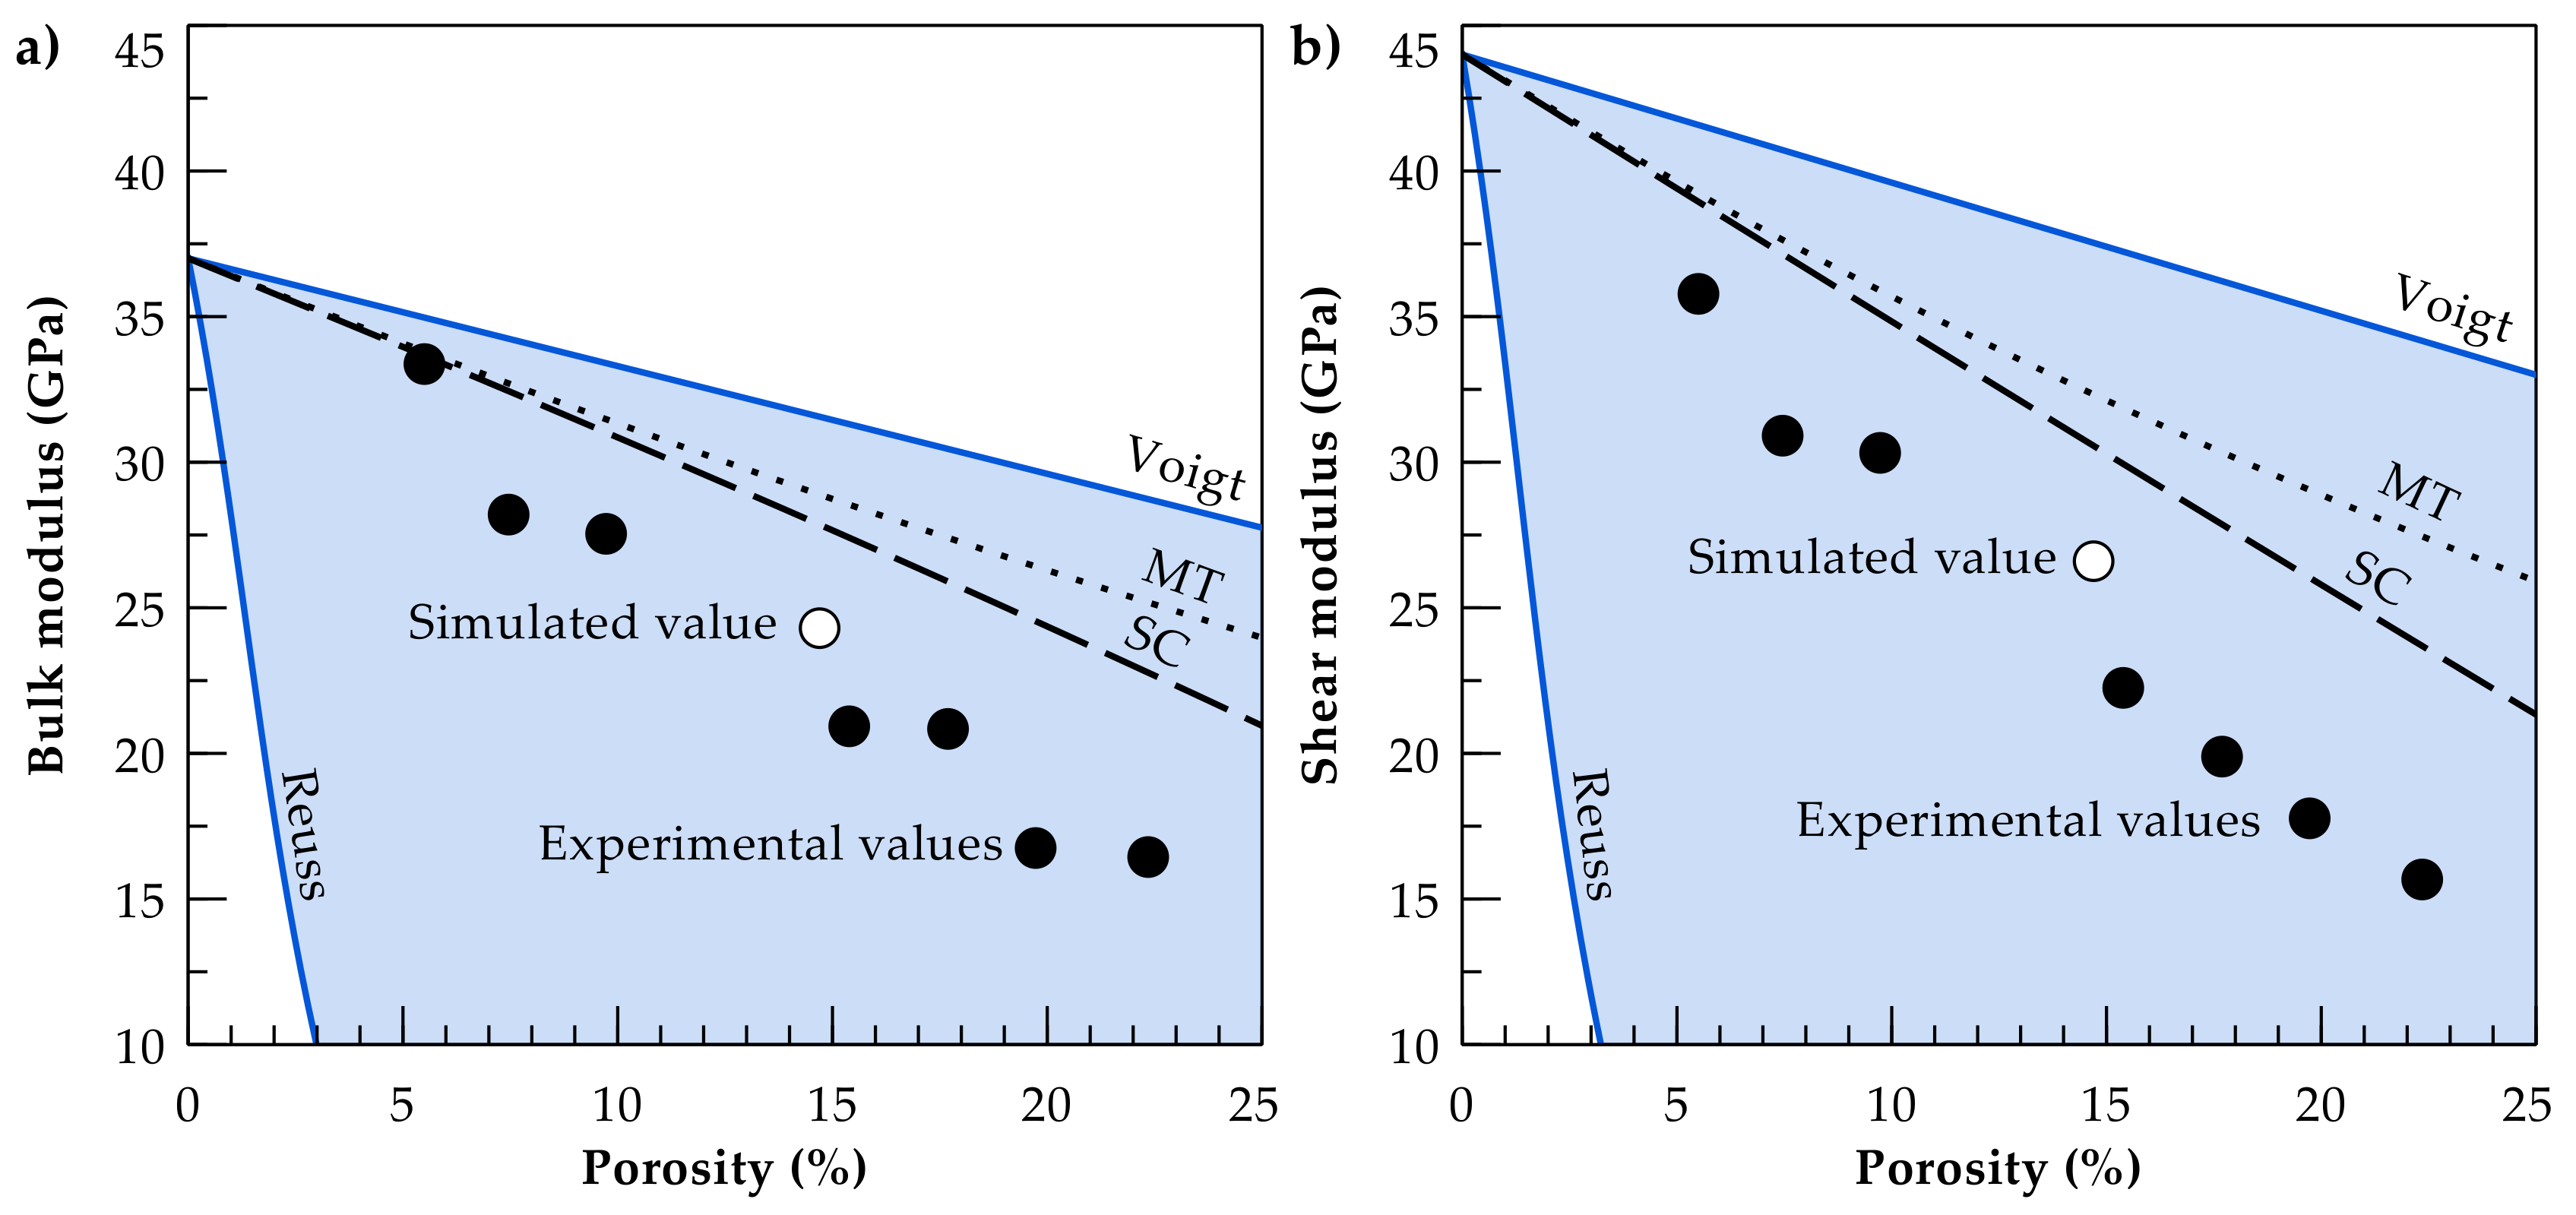
Figure 3.
(a) Size and resolution of the binary micro-CT scans for the digital sandstone samples [59,70]. The voxel edge length of the original Bentheim microstructure is reduced to 6 μm to achieve a grain resolution equivalent to the Fontainebleau microstructure. (b) Both sandstones have similar grain size distributions, while the Bentheim sandstone has a slightly wider distribution in particle size.

Figure 4.
Effective elastic properties are calculated using the stress-strain behaviour of the normalized digital rock sample. For that purpose, a small strain is applied at one boundary face (z = 1), while roller boundaries fix the displacements perpendicular to its opposite face (z = 0) and two adjacent boundaries (x = 0, y = 0).

Figure 5.
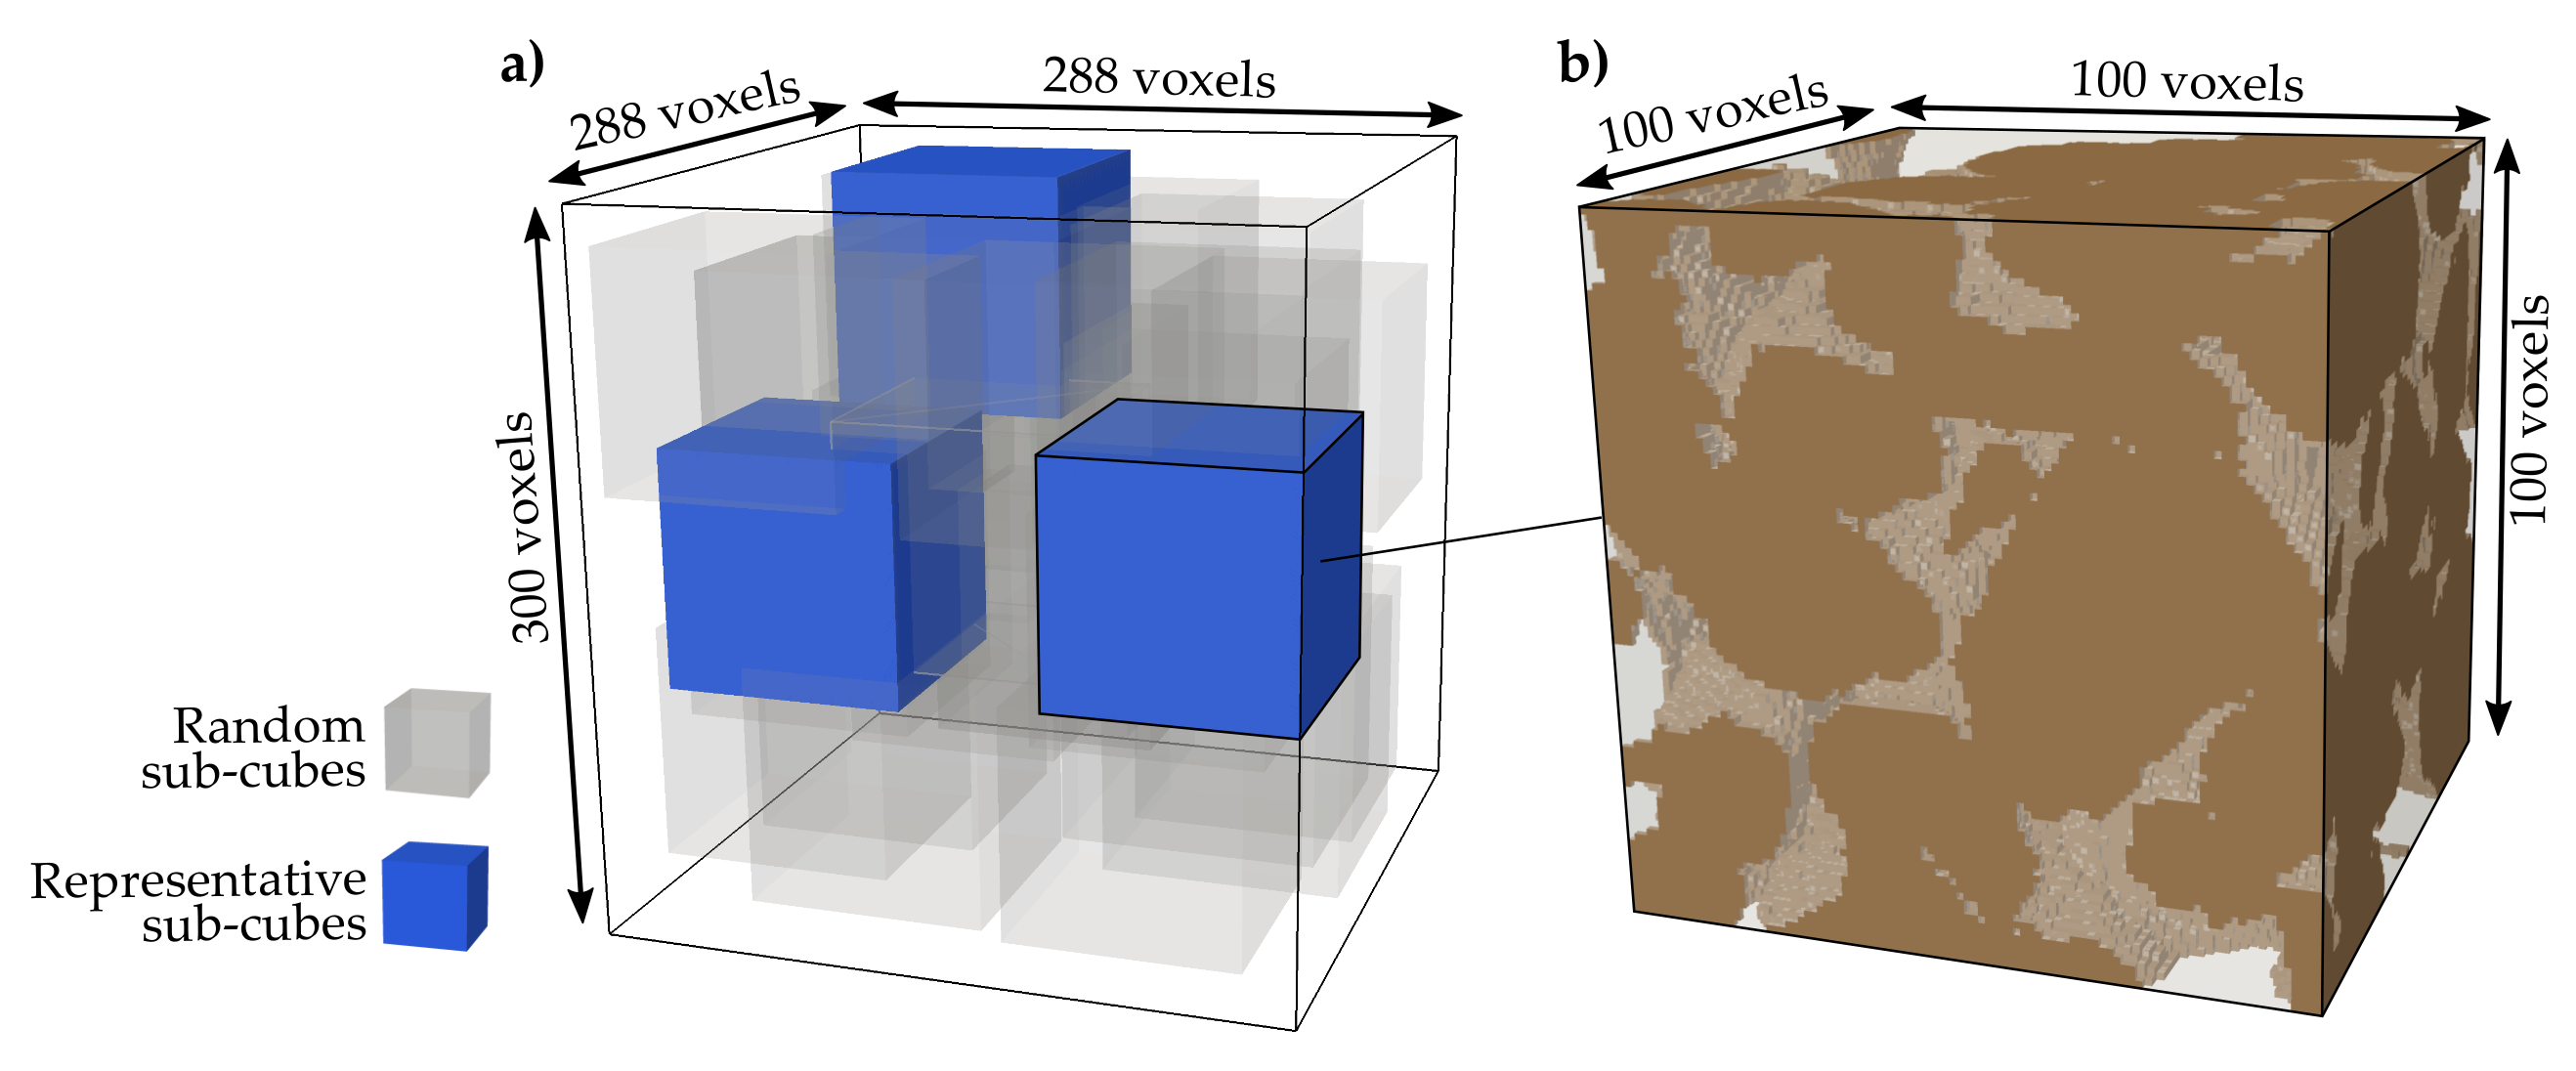
(a) The entire microstructure of the Fontainebleau sandstone consists of 24.8 million voxels and is randomly decomposed into 30 sub-cubes (grey) (b) comprising 1 million voxels each. Three sub-cubes are identified (blue) being representative for the main microstructure and are further used in our simulations to quantify changes in elastic rock properties due to variations in the calcite volume fraction.
Figure 5.
(a) The entire microstructure of the Fontainebleau sandstone consists of 24.8 million voxels and is randomly decomposed into 30 sub-cubes (grey) (b) comprising 1 million voxels each. Three sub-cubes are identified (blue) being representative for the main microstructure and are further used in our simulations to quantify changes in elastic rock properties due to variations in the calcite volume fraction.

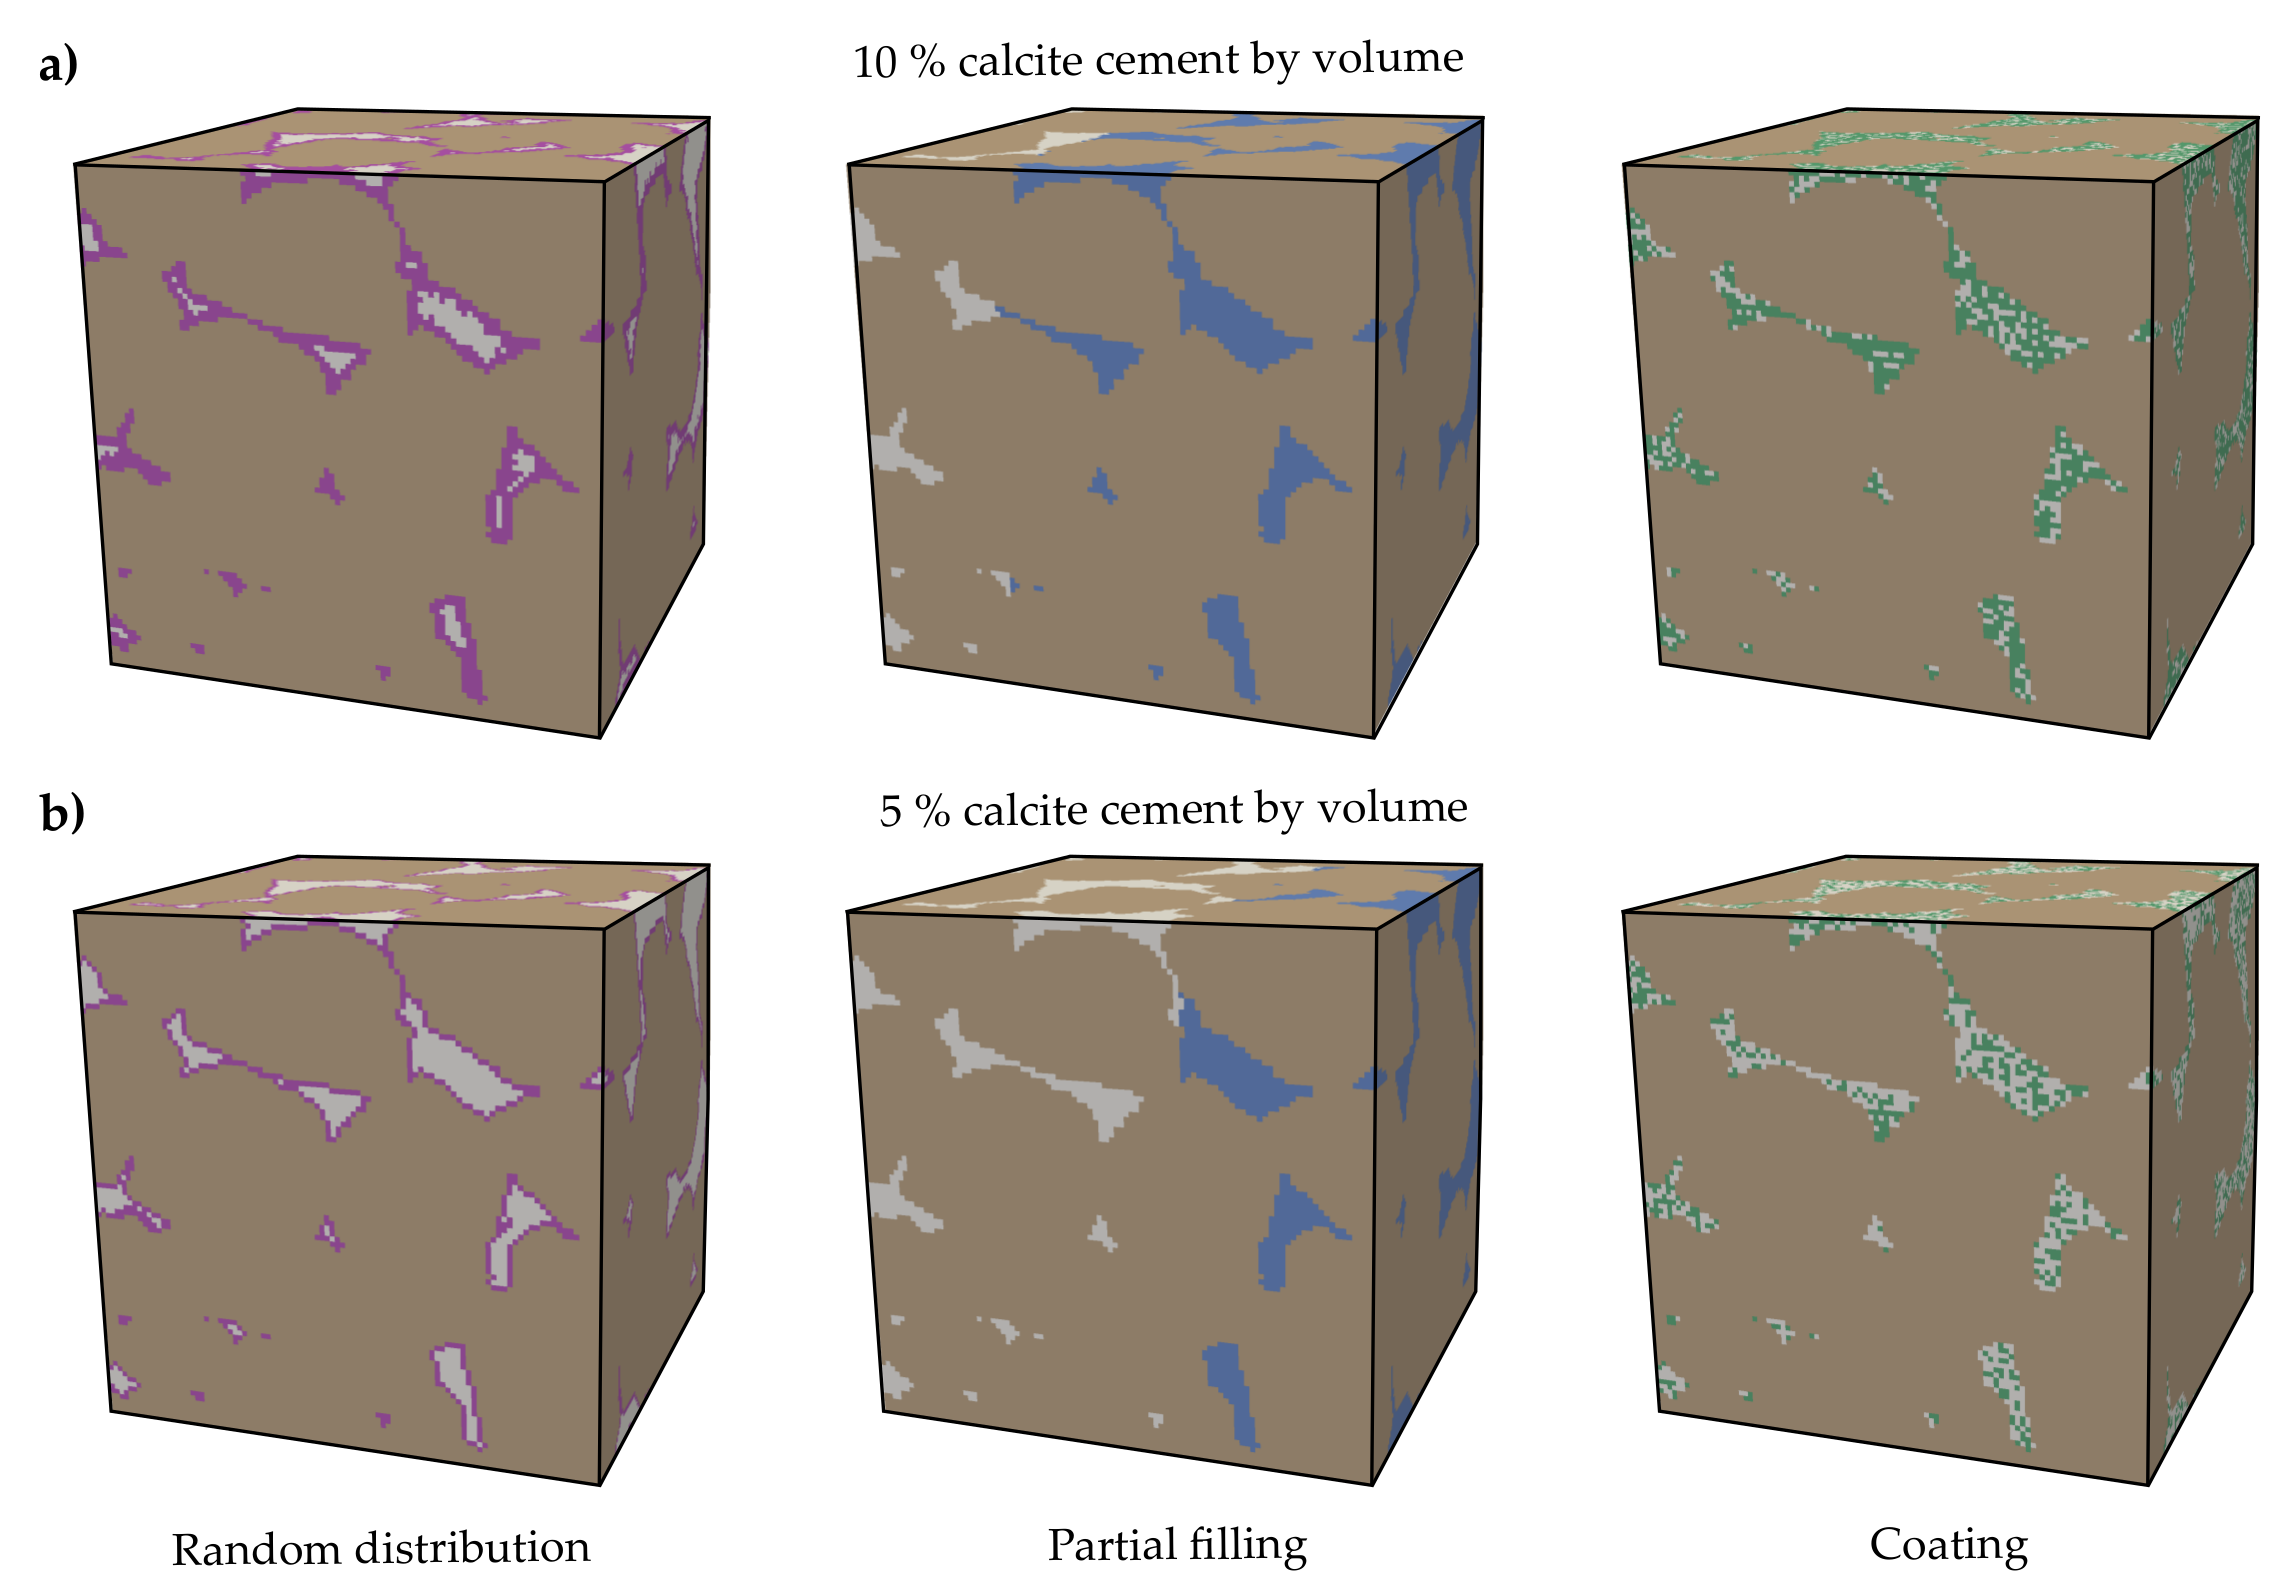
Figure 6.
Representative sub-cubes of the Fontainebleau sandstone comprise quartz grains (brown), pore space (light grey) and calcite cement with three general spatial arrangements: random distribution (green), partial filling (blue) and coating (magenta). The pore network is exemplarily filled with a calcite cement volume fraction of (a) 10% and (b) 5%.

Figure 7.
Bulk and shear moduli of all sub-cubes (empty circles) decrease linearly with porosity. Three representative sub-cubes (blue- and red-filled circles), which are preferably isotropic, are selected from (a) 30 Fontainebleau and (b) 60 Bentheim sandstone sub-samples. While the sub-volumes of the Fontainebleau sample have a relatively narrow porosity spectrum (blue lines), the range for the Bentheim sandstone porosity (red lines) is substantially wider.
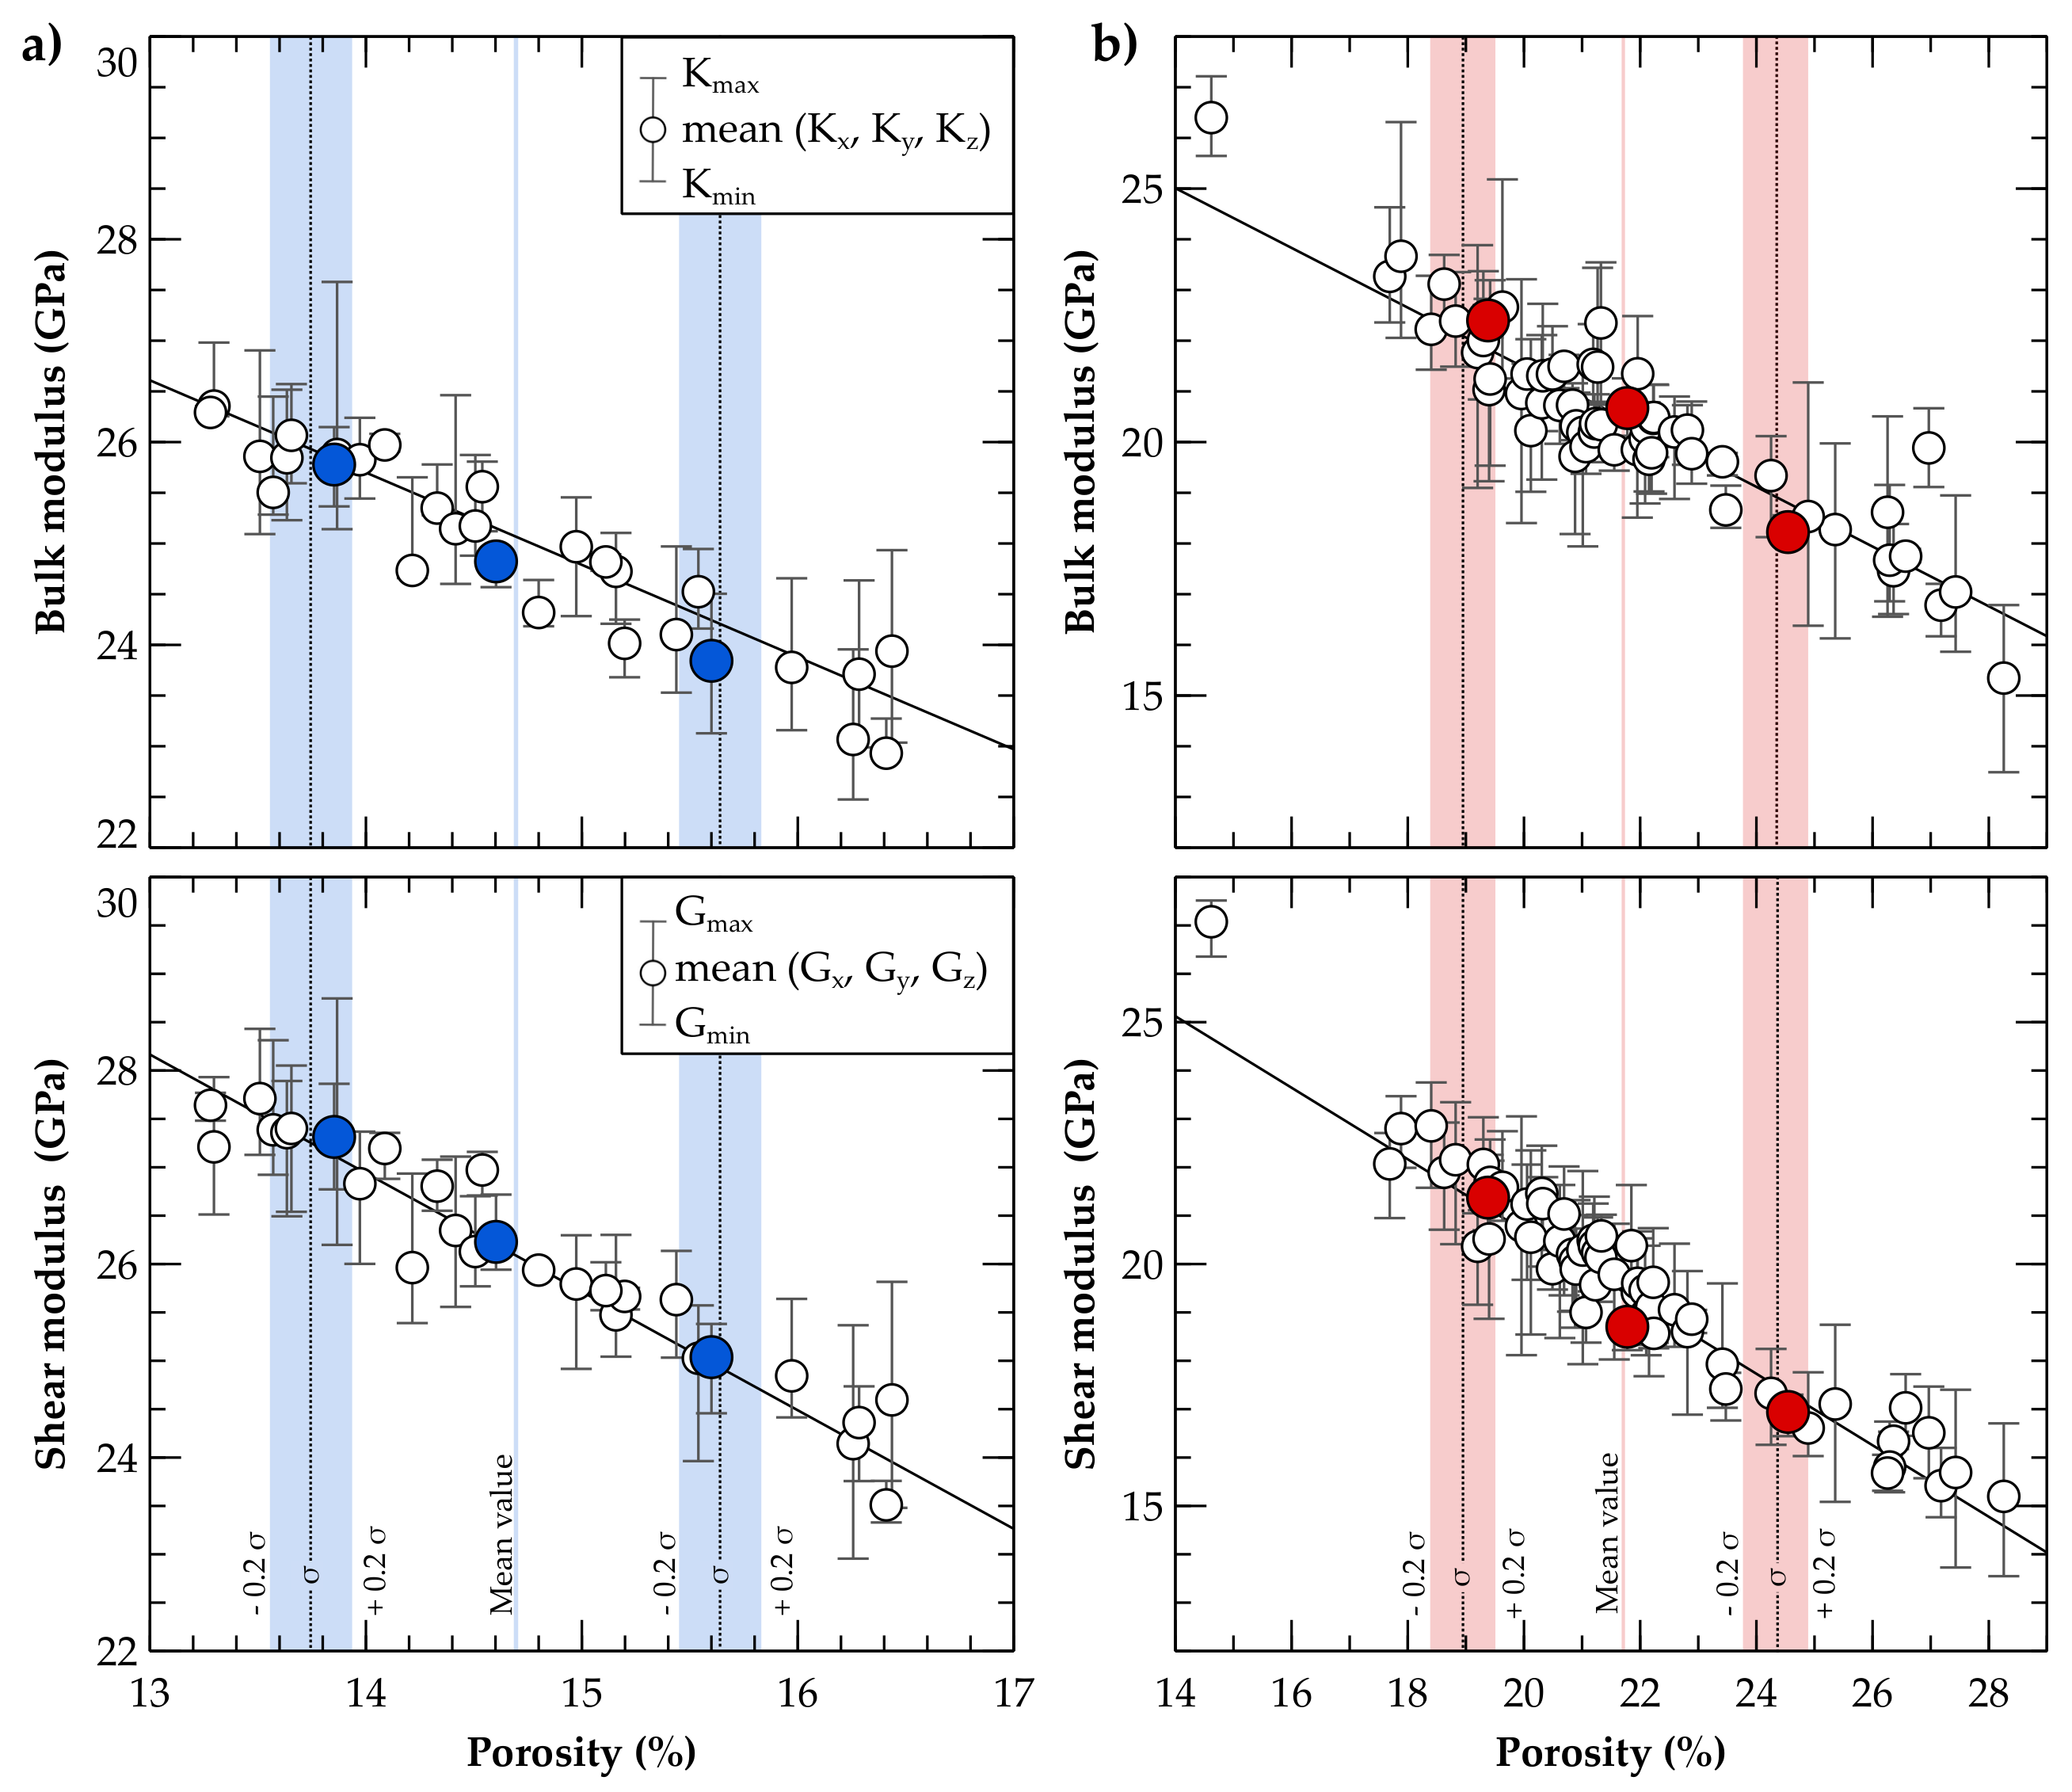
Figure 8.
General trends of reduction in elastic properties due to calcite cement dissolution, considering stiff and soft cement moduli for the two investigated digital samples of (a) the Fontainebleau and the (b) Bentheim sandstones. The range for the three investigated spatial calcite distributions (green, blue, magenta) is based on the three selected representative sub-cubes and determined by their least porosity.
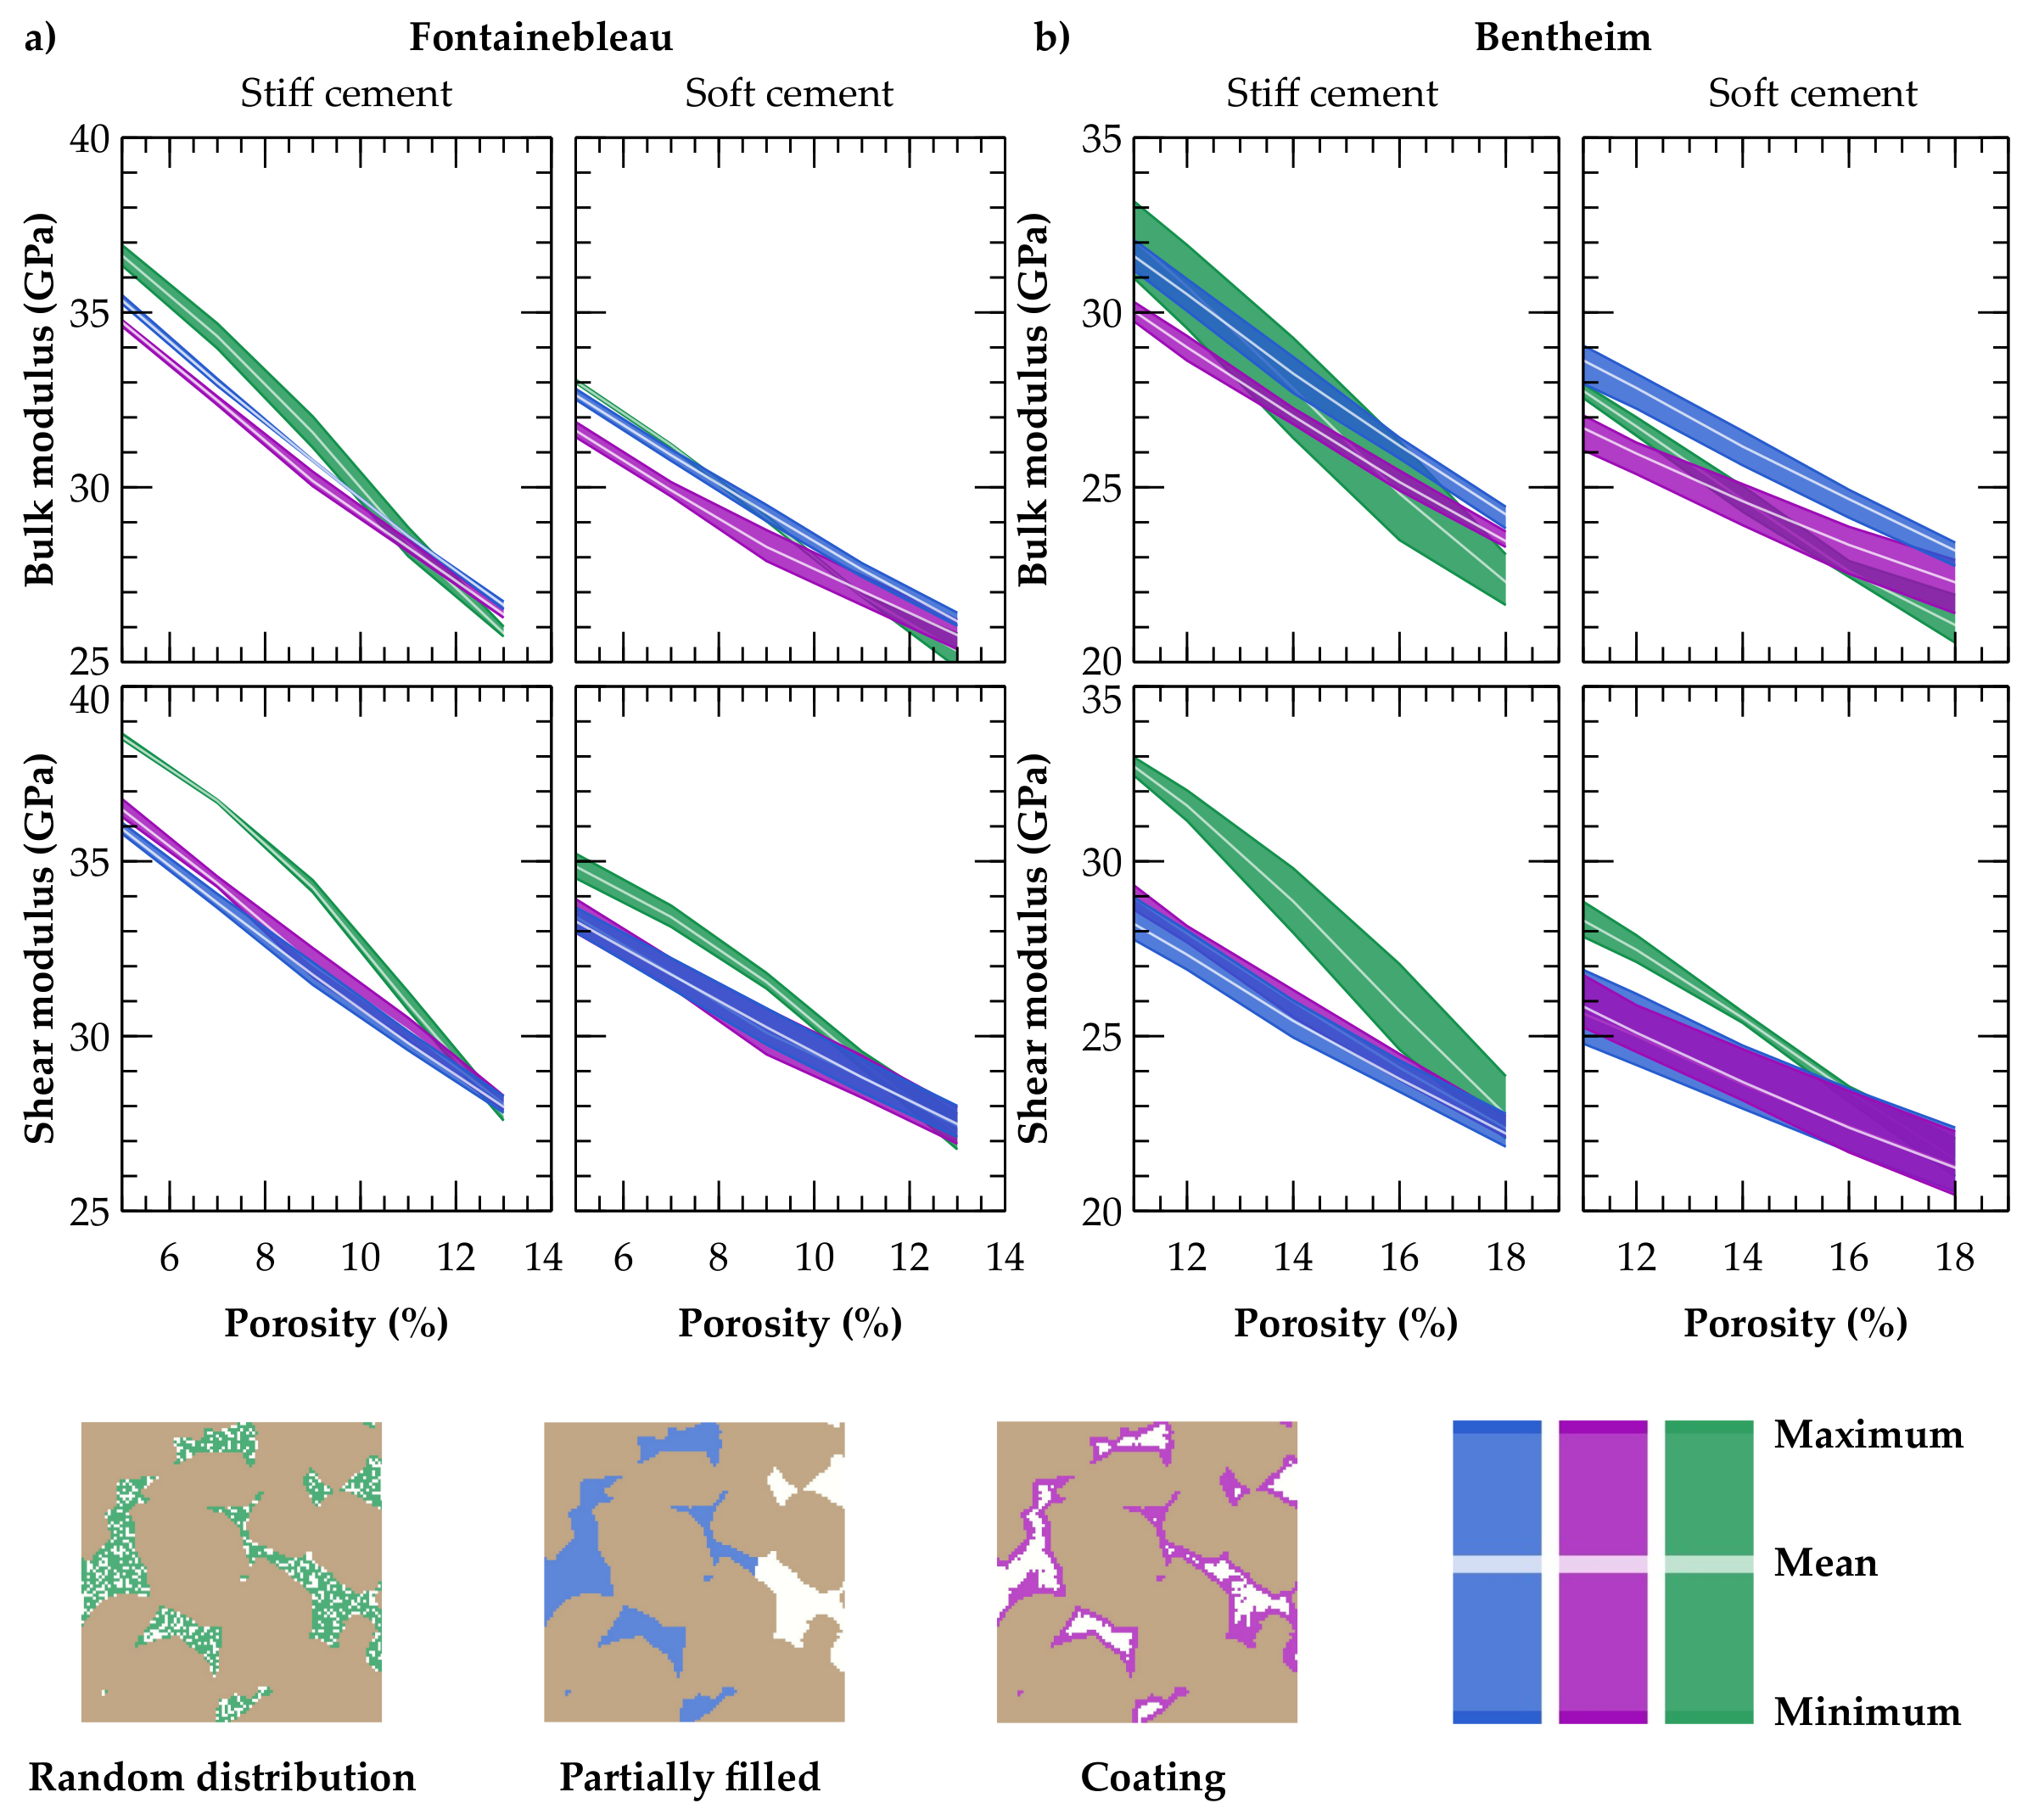
Figure 9.
Simulations considering random (green), partially filled (blue) and coated (magenta) calcite distributions substantially reduce the overestimation produced by state-of-the-art analytical solutions as the Mori-Tanaka approach (MT, dotted line) and the self-consistent scheme (SC, dashed line). (a) Bulk and (b) shear moduli for the Fontainebleau sandstone determined in laboratory experiments [64] (black-filled circles), taking into account only the quartz component and void volume.


Table 1.
Bulk (K) and shear (G) moduli for selected minerals to compute effective elastic properties.
Table 1.
Bulk (K) and shear (G) moduli for selected minerals to compute effective elastic properties.
| Mineral | K (GPa) | G (GPa) | Reference |
|---|---|---|---|
| Quartz | 37.0 | 44.0 | [27] |
| Calcite | 74.8 | 30.6 | [27] |
| Calcite (amorphous) | 35.5 | 14.0 | [74] |
| Pore space * | 1 × 10 | 3 × 10 |
* negligibly small moduli are applied to represent porosity in Code_Aster.
Table 2.
Bulk (K) and shear (G) moduli of both digital sandstone samples and their correlation to porosity considering all sub-cubes.
Table 2.
Bulk (K) and shear (G) moduli of both digital sandstone samples and their correlation to porosity considering all sub-cubes.
| Digital Sample | Modulus of Elasticity | Mean Value (GPa) | Mean Directional Difference (GPa)* | r2 (Mean Value) | r2 (Three Spatial Directions) |
|---|---|---|---|---|---|
| Fontainebleau | K | 24.8 | 4.7 | 0.90 | 0.68 |
| G | 26.1 | 4.6 | 0.94 | 0.78 | |
| Bentheim | K | 20.4 | 9.3 | 0.84 | 0.65 |
| G | 19.6 | 9.5 | 0.93 | 0.79 |
* difference between the maximum and minimum bulk and shear moduli for the three spatial loading directions.
Table 3.
Porosity as well as bulk (K) and shear (G) moduli of the representative sub-cubes.
| Digital Sample | Porosity (%) | Effective Elastic Property | Mean Directional Difference | ||
|---|---|---|---|---|---|
| K (GPa) | G (GPa) | K (GPa) | G (GPa) | ||
| Fontainebleau | 13.9 | 25.8 | 27.3 | 3.0 | 3.9 |
| 14.6 | 24.8 | 26.2 | 1.6 | 2.9 | |
| 15.6 | 23.8 | 25.0 | 4.6 | 3.6 | |
| Bentheim | 19.4 | 22.4 | 21.4 | 2.7 | 7.0 |
| 21.8 | 20.7 | 18.7 | 5.3 | 4.0 | |
| 24.5 | 18.2 | 16.9 | 2.9 | 5.0 | |
Table 4.
Percentage reduction in bulk (K) and shear (G) moduli resulting from the removal of calcite.
Table 4.
Percentage reduction in bulk (K) and shear (G) moduli resulting from the removal of calcite.
| Digital Sample | Spatial Cement Distribution | 10% Calcite Cement by Volume | 5% Calcite Cement by Volume | ||||||
|---|---|---|---|---|---|---|---|---|---|
| Stiff Cement | Soft Cement | Stiff Cement | Soft Cement | ||||||
| K (%) | G (%) | K (%) | G (%) | K (%) | G (%) | K (%) | G (%) | ||
| Fontainebleau | Random | 32.9 | 32.8 | 25.5 | 25.6 | 21.9 | 19.1 | 18.2 | 15.6 |
| Partially filled | 30.5 | 28.0 | 24.6 | 22.1 | 19.0 | 17.0 | 15.2 | 13.4 | |
| Coating | 29.3 | 29.1 | 22.2 | 22.5 | 18.5 | 17.3 | 14.6 | 13.8 | |
| Bentheim | Random | 34.2 | 38.4 | 24.3 | 29.1 | 23.2 | 22.9 | 18.4 | 18.1 |
| Partially filled | 33.6 | 28.7 | 27.1 | 22.0 | 17.4 | 15.8 | 14.0 | 12.6 | |
| Coating | 30.2 | 30.3 | 21.9 | 22.4 | 16.2 | 16.8 | 12.2 | 13.2 | |
© 2018 by the authors. Licensee MDPI, Basel, Switzerland. This article is an open access article distributed under the terms and conditions of the Creative Commons Attribution (CC BY) license (http://creativecommons.org/licenses/by/4.0/).
Share and Cite
MDPI and ACS Style
Wetzel, M.; Kempka, T.; Kühn, M. Quantifying Rock Weakening Due to Decreasing Calcite Mineral Content by Numerical Simulations. Materials 2018, 11, 542. https://doi.org/10.3390/ma11040542
AMA Style
Wetzel M, Kempka T, Kühn M. Quantifying Rock Weakening Due to Decreasing Calcite Mineral Content by Numerical Simulations. Materials. 2018; 11(4):542. https://doi.org/10.3390/ma11040542
Chicago/Turabian StyleWetzel, Maria, Thomas Kempka, and Michael Kühn. 2018. "Quantifying Rock Weakening Due to Decreasing Calcite Mineral Content by Numerical Simulations" Materials 11, no. 4: 542. https://doi.org/10.3390/ma11040542
Note that from the first issue of 2016, this journal uses article numbers instead of page numbers. See further details here.