Article

Effect of Recrystallization Annealing on Corrosion Behavior of Ta-4%W Alloy

1
College of Materials Science and Engineering, Chongqing University, Chongqing 400044, China
2
Southwest Technology and Engineering Research Institute, Chongqing 400039, China
*
Authors to whom correspondence should be addressed.
Materials 2019, 12(1), 117; https://doi.org/10.3390/ma12010117
Submission received: 30 November 2018 / Revised: 20 December 2018 / Accepted: 25 December 2018 / Published: 31 December 2018
(This article belongs to the Section Corrosion)

Abstract

:
The effect of recrystallization annealing on corrosion behavior of Ta-4%W alloy was studied. It is found that the deformed sample contains high dense dislocations and dislocation boundaries. During annealing, these dislocations and dislocation boundaries are replaced by recrystallizing grains until the alloy is fully recrystallized. Both the anodic dissolution and the cathodic activity is much more blocked. The corrosion potential gradual shift towards negative values and corrosion current density decrease, while polarization resistance increases after annealing, indicating enhanced corrosion resistance of the alloy. Such an enhancement is caused by the increase of low-Σ coincide site lattice boundaries and decrease of dislocations and dislocation boundaries.

Graphical Abstract

1. Introduction

Tantalum (Ta) alloys have attracted great interests in many technological applications, such as electronic industry, high-temperature applications, chemical processing and bone repair implants, for their excellent properties of high density, high melting point, good biocompatibility and high corrosion resistance [1,2,3,4,5]. To protect structural materials, for example stainless steels or nickel based alloys from severe corrosion during processing strong corrosion medium, Ta alloys are usually processed into thin layers on surfaces of these materials to achieve corrosion resistance [1,3]. During such processing, crystallographic defects would generate in these alloys and affect its corrosion resistance during such process [6,7].
The corrosion resistance of Ta alloys in H3PO4, NaCl and KOH solutions has been extensively examined [8,9,10]. Many studies have also been focused on the preparation of Ta films on structural materials to improve their anti-corrosion against sulfuric acid. Ghorbani et al. [11] reported that Ta film can strongly enhance the corrosion resistance of the 316L stainless steel in Ringer’s solution. Wang et al. [12] suggested that the Ta ion implantation is an effective method to improve the cytocompatibility of pure Fe for biomedical applications and only the Ta ion dosage reaching a critical value can significantly increase corrosion resistance in the solution containing SO42−. Moreover, Wei et al. [13] coated Ta alloy on the surface of pure titanium and found that the Ta coating shows excellent corrosion resistance in different concentrations of sulfuric acid. However, these studies ignored corrosion resistance of Ta itself since Ta is much superior to other anti-corrosive alloys in sulfuric acid. Robin and de Souza [14,15] observed the corrosion behavior of Ti–Ta and Nb–Ta alloys in sulfuric acid solutions and found the corrosion rates of all materials increase with Ta contents. Friedrich et al. [16] suggested that Ta can be used as a reactor material for high temperature applications up to 360 °C with strongly oxidizing environments. Piotrowski et al. [17] showed that the shape of polarization curves was strongly influenced by the sulfuric acid concentration when electropolishing Ta in sulfuric acid–methanol electrolytes. More recently, Picone et al. [18] reported some corrosion data for Ta alloys in 0.5 M H2SO4 at 22.7 °C. Nevertheless, the relationship between microstructures and corrosion behaviors of Ta alloy was less investigated; and there is no known study on the effect of deformation and recrystallization annealing on the corrosion behaviors of Ta. Therefore, the aim of present study is to explore the influence of recrystallizing annealing on corrosion behaviors of deformed Ta alloys in sulphuric acid. To do so, potentiodynamic polarization curves tests, electrochemical impedance spectroscopy (EIS) tests, electron backscatter diffraction (EBSD) and transmission electron microscopy (TEM) characterizations were carried out, and the effect of annealing on corrosion behaviors for the alloy was discussed.

2. Materials and Methods

The starting material used for this work was Ta containing 4 wt % tungsten (W), which was obtained by electron beam fusion method followed by hot forging. Then the material (initial 5 mm thickness) was cold rolled to 70% reductions (von Mises strain of 1.39). The rolled sheet is 1.5 mm in thickness finally. Samples with sizes of 12 mm long along the rolling direction (RD) and 10 mm wide along the transverse direction (TD) were cut from the rolled sheet, and then annealed at 1200 °C for 10 min and at 1350 °C for 240 min, respectively. The electrochemical measurements were performed in a multi-functional electrochemical workstation (model CS350) by using a conventional three-electrode cell system, i.e., the sample acts as working electrode, 1 cm2 platinum sheet as counter electrode and saturated calomel electrode (SCE) as reference electrode. The electrolytic cell prepared for flat sheet has a fixed 5 mm diameter orifice for exposing the sample surface (0.196 cm2 area) and 100 mL capacity. To avoid the interference of crevice corrosion, a thin layer 703 sealant was smeared around the orifice. Prior to EIS tests, there was 1000 s waiting time for getting a steady-state condition and then EIS tests were carried out at stabilized open-circuit potential (OCP) within a frequency range of 100 kHz to 10 mHz and with a 10 mV ac voltage signal amplitude perturbation. Potentiodynamic polarization tests were performed at a scan rate of 1 mV/s with scanning potentials varying from −0.6 VSCE to +1.2 VSCE after the EIS measurements. All corrosion tests were performed on the section containing the RD and the TD. To reduce the effect of surface roughness on corrosion performance, all specimens were ground to 5000 grit abrasive papers and cleaned with deionized water before corrosion tests. During electrochemical corrosion testing, specimens were exposed to a 5 wt % H2SO4 solution at 33 ± 1 °C. Samples were also immersed in a 50 wt % H2SO4 containing 1 wt % fluoride ions for 7 days to accelerate the corrosion process.
The microstructures of both deformed and annealed samples were characterized by EBSD and TEM techniques. EBSD samples were polished in a mixture of hydrofluoric acid, sulfuric acid (1:9 by volume fraction) at room temperature, and then characterized by using an Oxford AZtec EBSD system [19] equipped on a JEOL 7800F scanning electron microscope (SEM, Akishima, Japan) operating at 20 kV. TEM foils were prepared by conventional twin-jet technique in a mixture of hydrofluoric acid, sulfuric acid and methyl alcohol (1:5:94 by volume) at 243 K, and then observed in a JOEL JEM 2100 TEM operated at 200 kV. Five TEM foils were prepared for each state sample for good statistics. EBSD and TEM characterizations were conducted on the longitudinal section containing the RD and the ND (normal direction) of samples. Depending on the energy and properties, grain boundaries are classified as Σ 1 boundary (low angle boundaries), low-Σ coincidence site lattice (CSL) boundaries with Σ values ranging from 3 to 29, and general boundaries (high-Σ CSL boundaries and the other boundaries) [20]. CSL boundaries were identified following the Brandon criteria [21]. It should be pointed out that only the boundaries with misorientation higher than 2° are marked out due to the resolution of the EBSD technique. Morphologies of corroded surfaces were observed by the SEM.

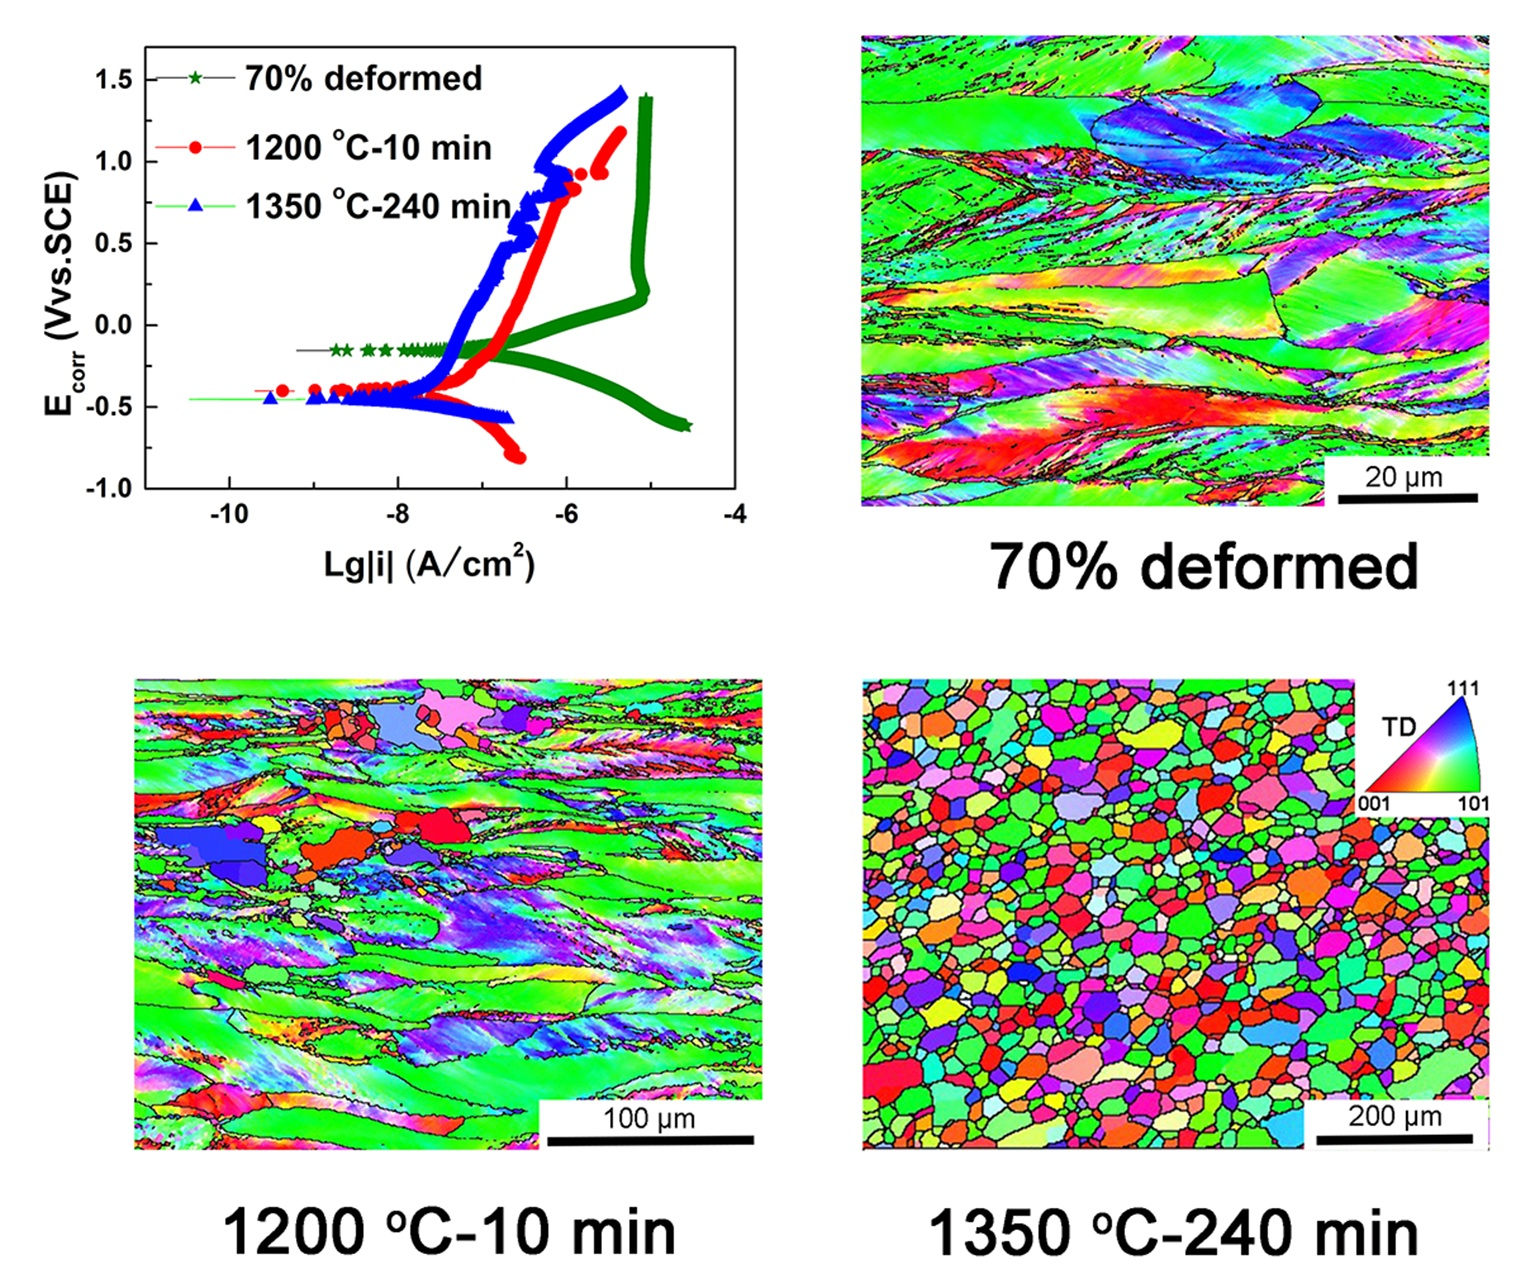
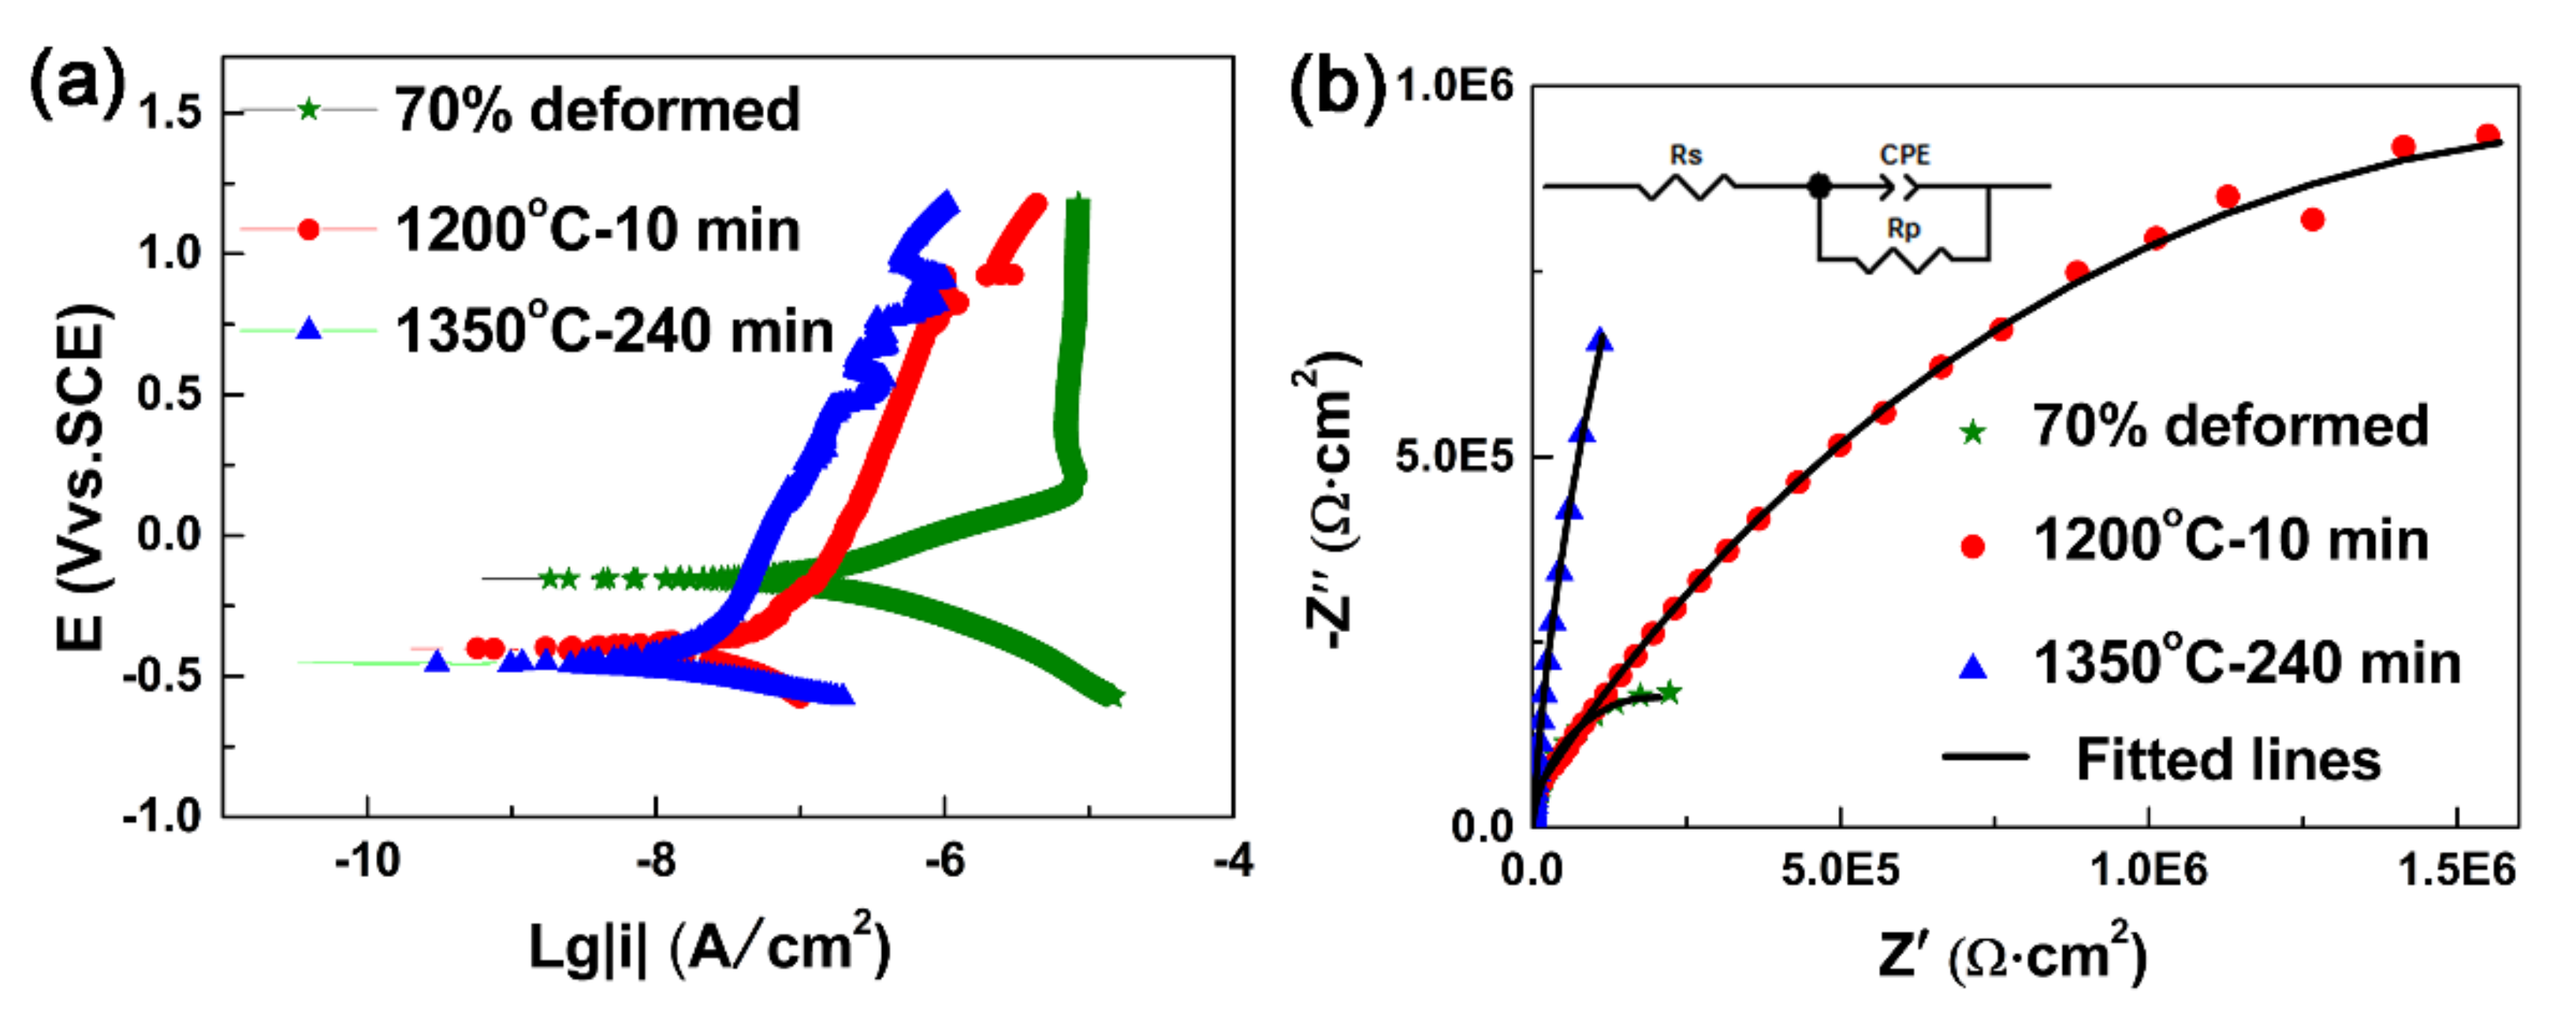
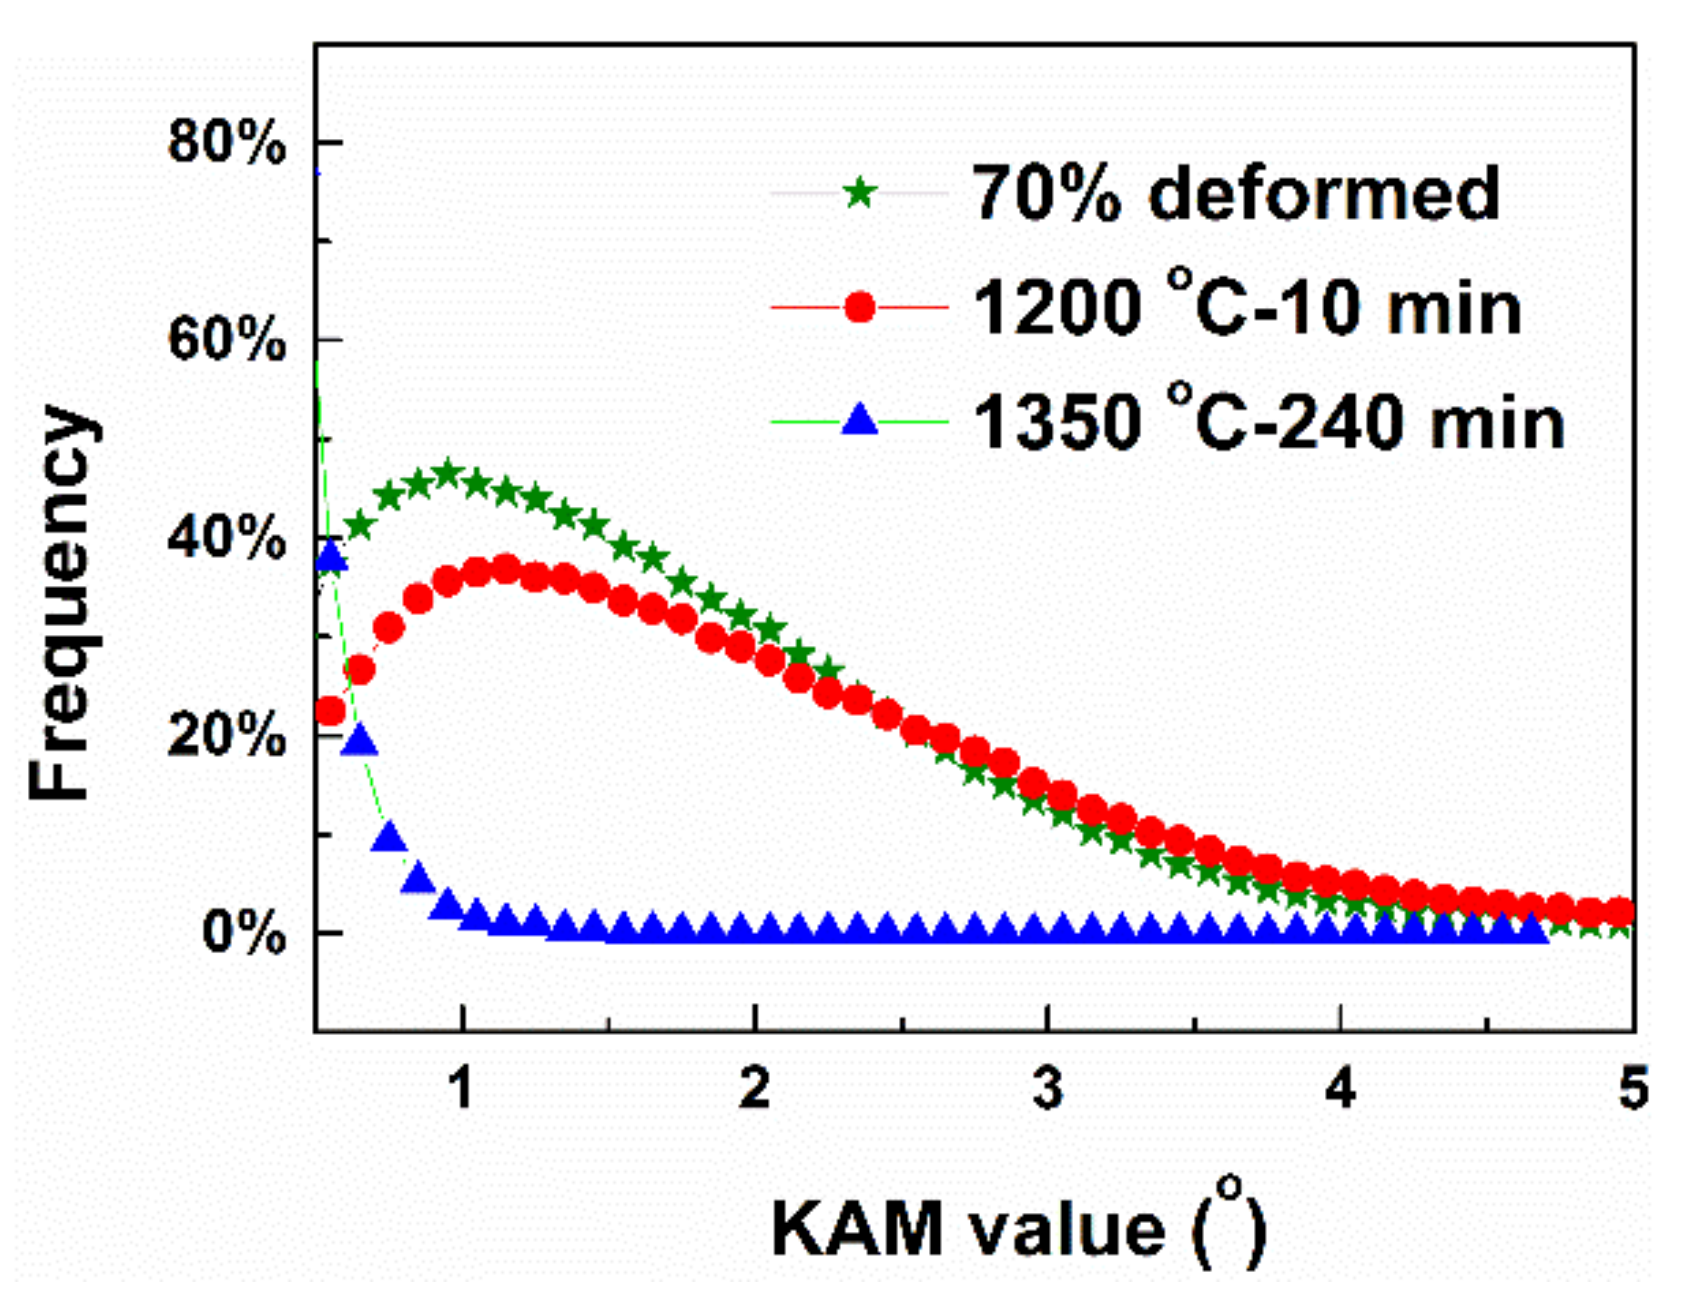
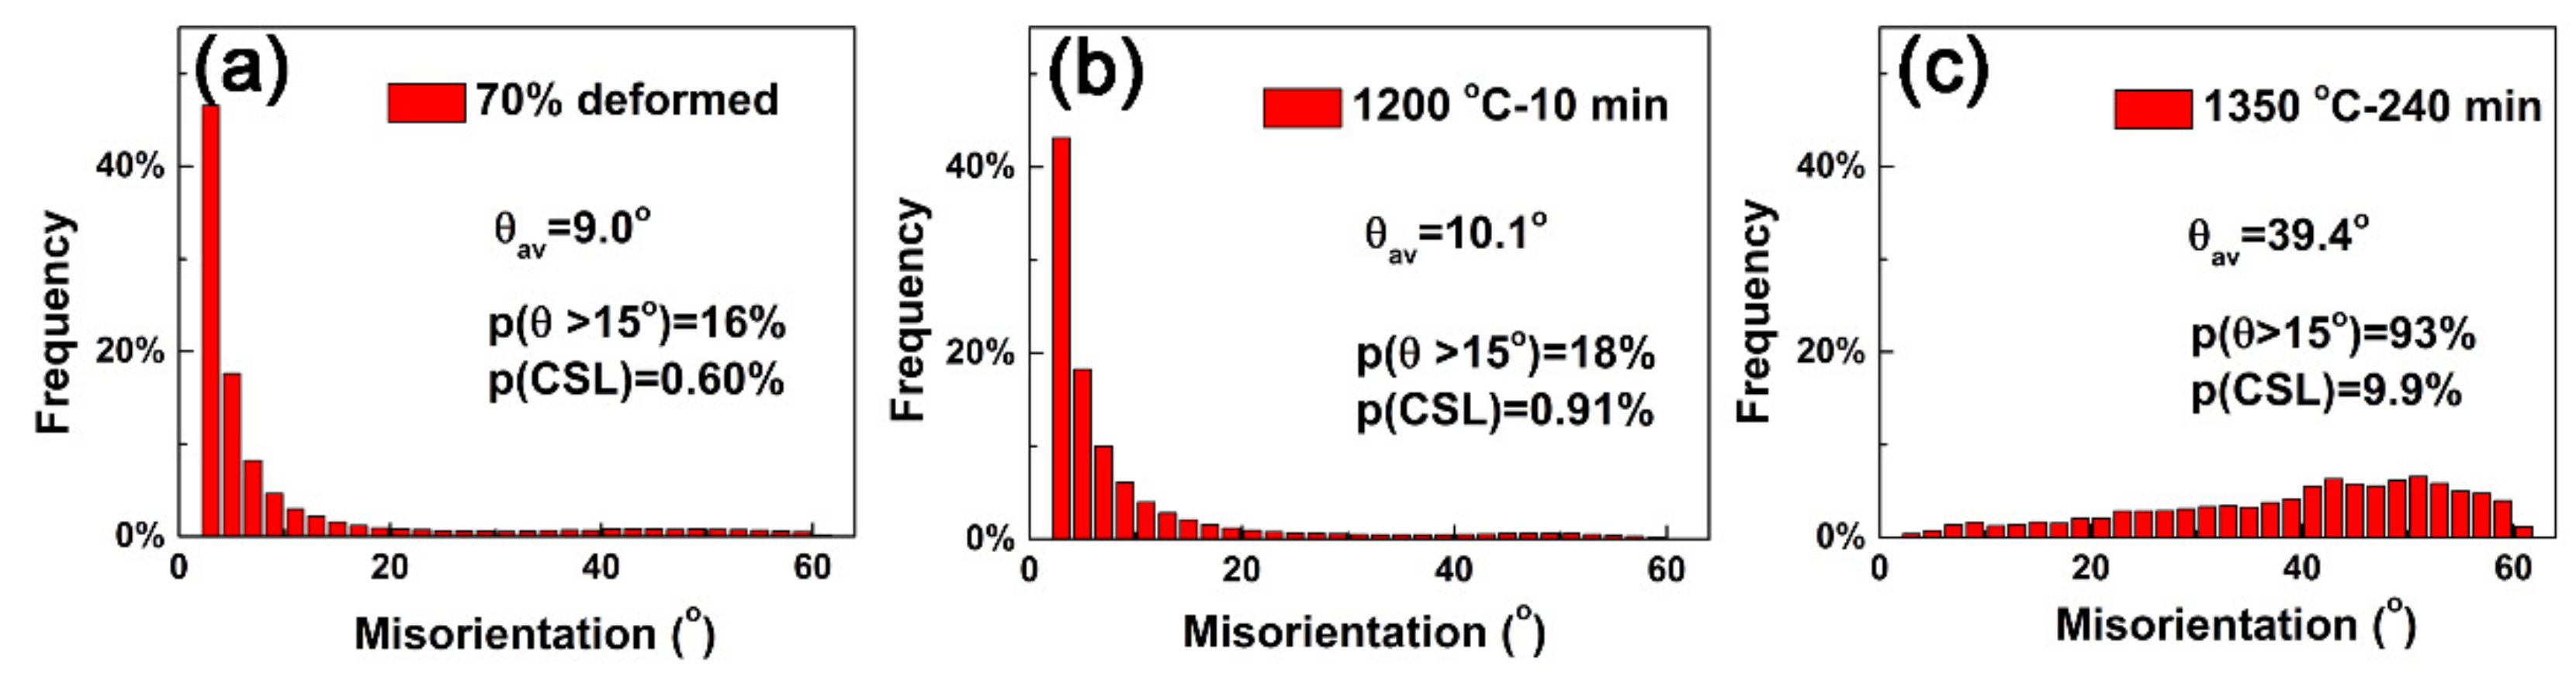
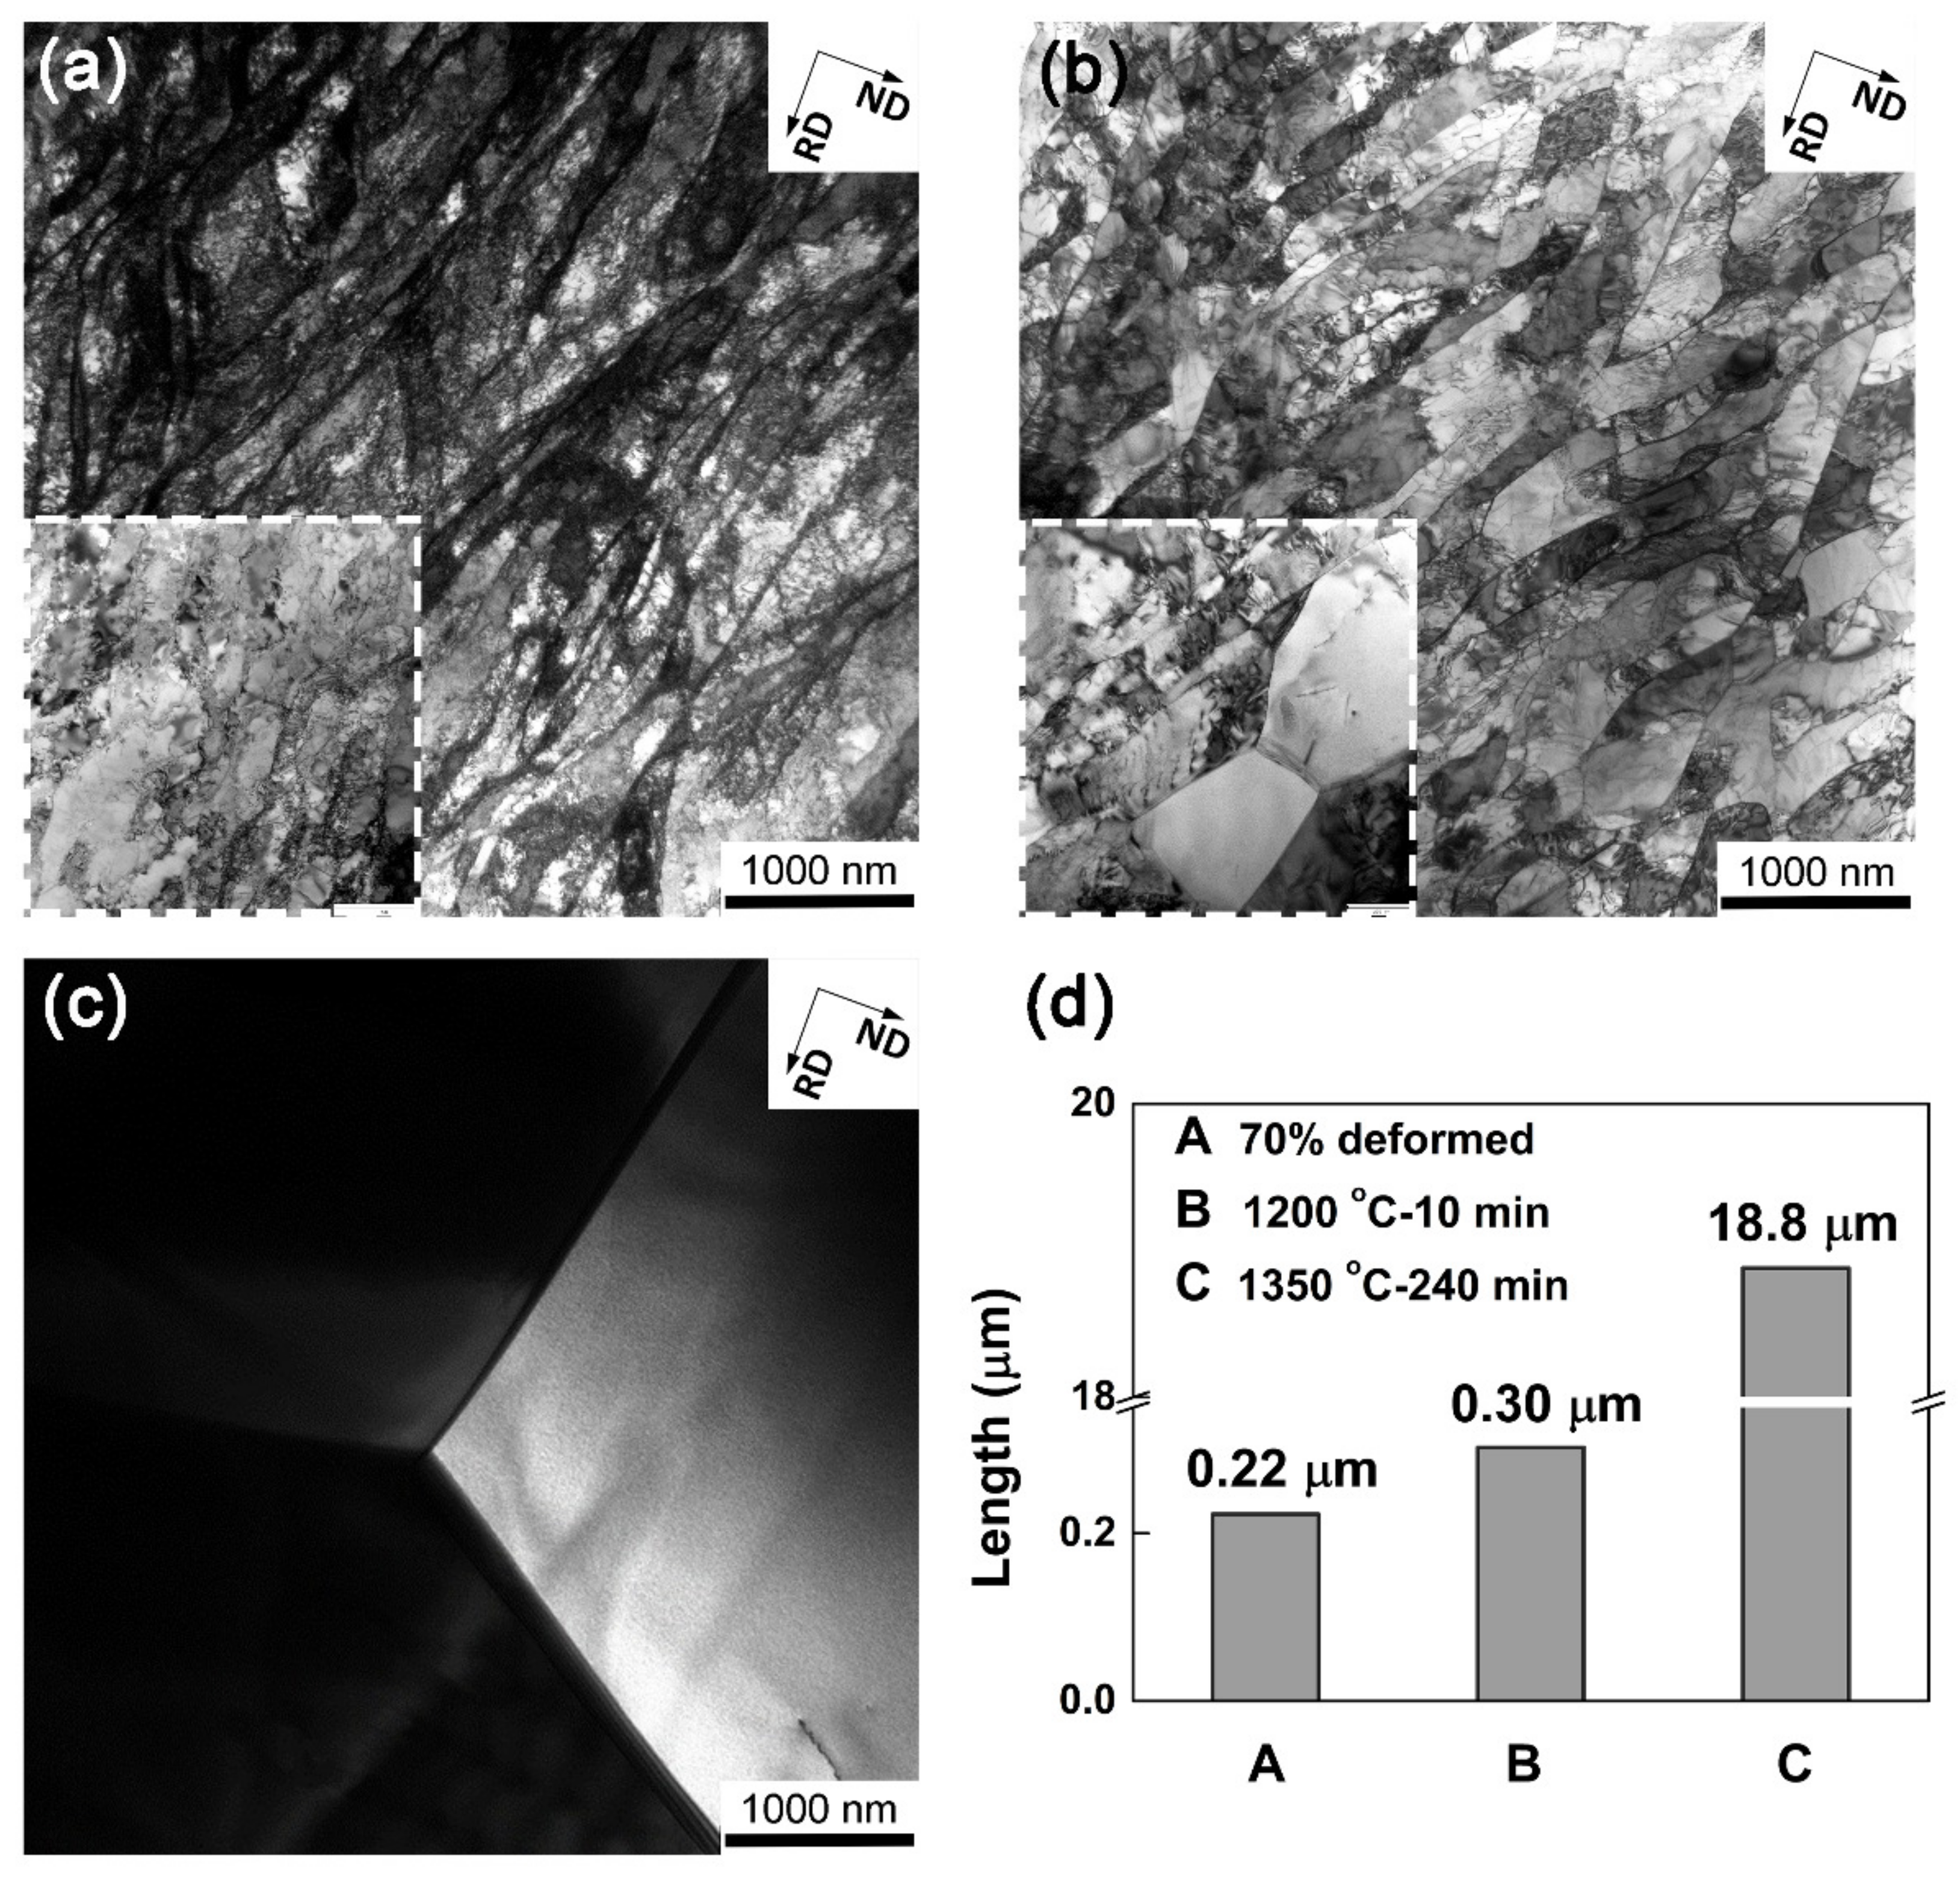
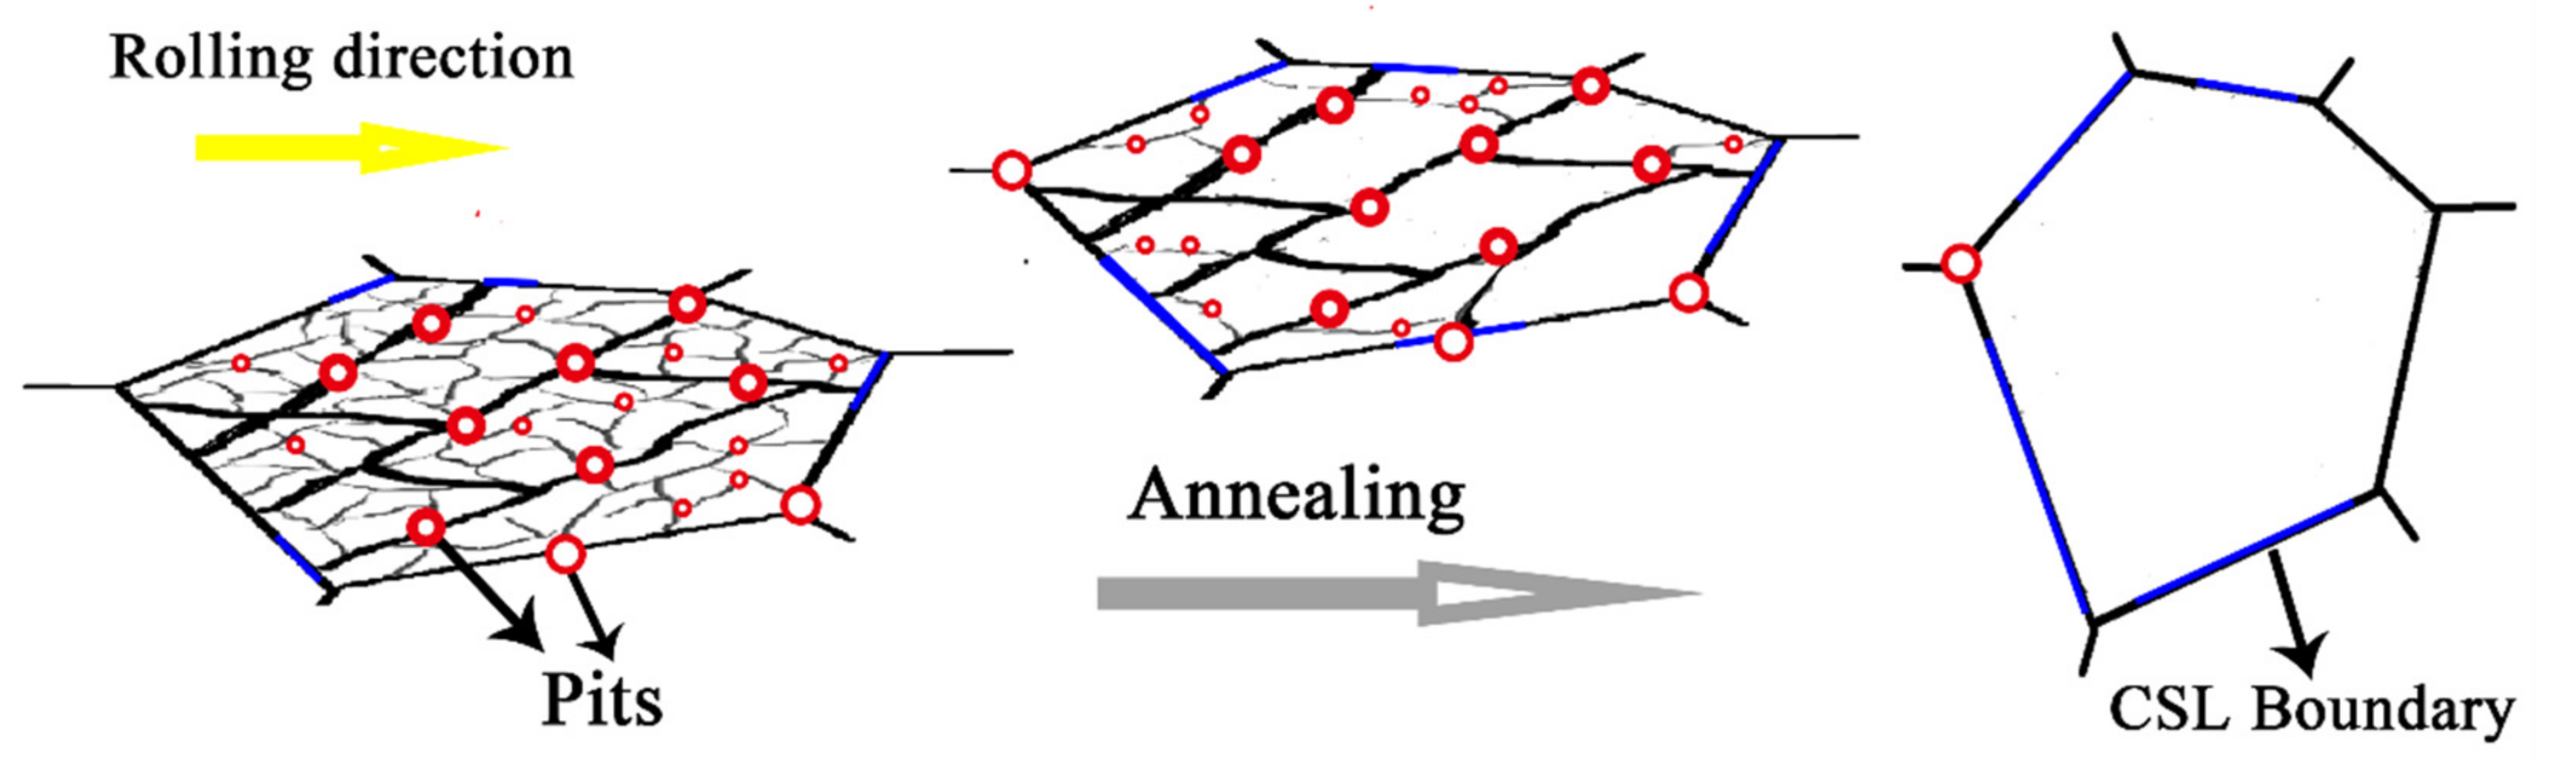
3. Results and Discussion

Figure 1 shows the potentiodynamic polarization curves and Nyquist plots of the Ta alloy. As can be seen in the potentiodynamic polarization curves (Figure 1a), the polarization behavior of deformed sample is much more similar to earlier results [15,18] that is, the anodic and cathodic Tafel behaviors. For the deformed sample, there is a transition point that the anodic slope of plot is changed abruptly and the anodic current increases slightly with increasing more positive the potential. The anodic dissolution continues with a constant rate. However, polarization behaviors of the annealing samples show difference that anodic currents increase gradually with increasing more positive the potential. For both anodic and cathode branches, the current densities of the annealing samples are much smaller than those of the deformed sample one. This indicates that the microstructure is not only affecting anodic dissolution, but also catalysis of the cathodic reaction and the corrosion performance is both governed by the anodic and cathodic reactions. Moreover, there are fluctuations in current for the annealed samples at more positive potential which may be relate to the sudden dissolution events, such as deposited layer drop from the electrode and re-form subsequently. Figure 1b represents the Nyquist plot of different samples in the H2SO4 solution. For each Nyquist plot, there is only one typical imperfect depressed semicircle. Therefore, there is only one time constant, and there are no intermediate products such as adsorption complex formed on electrode surface. Depending on the shape of Nyquist plot, equivalent circuit model was selected to obtain the polarization resistance (Rp), as shown in the in-set of Figure 1b. Rs is the resistance of test solution between the reference electrode and working electrode and the constant phase element (CPE), defined as Z = 1/Y0 (jw)-n is used to explain non-ideal capacitive response from the interface. It is generally accepted that the diameter of semicircle is related to the Rp of passive films. Increase of the diameter means increase of corrosion resistance. The corrosion potential (Ecorr) and corrosion current density (icorr) was also obtained by Tafer slope fitting.
The value of Ecorr is −0.16 V for the deformed sample. While the values of Ecorr are −0.40 V and −0.45 V for the sample annealed at 1200 °C for 10 min and the sample annealed at 1350 °C for 240 min, respectively. Therefore, Ecorr of the annealed samples is more negative than that of the deformed one. This indicates that not only the anodic dissolution is much more blocked, but also the cathodic activity is much lower, resulting in lower corrosion rates at Ecorr. The icorr of the deformed sample is 14 × 10−8 A/cm2. While the icorr is reduced to 7.5 × 10⁻⁸ A/cm2 for the sample annealed at 1200 °C for 10 min, and further decreased to 2.3 × 10⁻⁸ A/cm2 after annealing at 1350 °C for 240 min, suggesting that corrosion resistance is enhanced after annealing. The Rp of the deformed sample is 0.46 × 10⁶ Ω cm2. While the values of Rp are 3.7 × 10⁶ Ω cm2 and 7.3 × 10⁶ Ω cm2 after annealed at 1200 °C for 10 min and at 1350 °C for 240 min, respectively. It is clear a series of better corrosion resistant behavior, due to the gradual shift of Ecorr towards negative values and gradual decreasing of Icorr and increasing of Rp.
Figure 2a,c,e shows the SEM images of morphologies for the alloy after accelerated corrosion. The corroded surface was unevenly distributed with localized corrosion for the deformed sample (Figure 2a). While, this phenomenon persists in the sample annealed at 1200 °C for 10 min (Figure 2c). After annealing at 1350 °C for 240 min (Figure 2e), the corrosion surface becomes quite uniform and there are no significant difference between different regions. Figure 2b,d,f show their grain boundary maps. It is seen that severe eroded regions always have deformation induced low angle dislocation boundaries (gray line) or original grain boundaries (black line), while the regions of relatively flat surface are always free of low angle dislocation boundaries, i.e., boundary-free regions. This phenomenon was marked by A and B in Figure 2c,d. Therefore, the corrosion process of the alloy is controlled by microstructural features. During plastic deformation, many dislocations are created and thus dislocation structures are formed. The characteristics of dislocation structures depend on deformation processes and materials [22]. The mechanical energy is stored in form of tangled dislocations and dislocation boundaries. Etch of interfaces immersed in electrolytic solutions was closely related to their mechanical energy. The higher of mechanical energy, the greater corrosion degradation of the region. Since the microstructure of Ta alloy is non-uniform as seen in Figure 2b,d, the mechanical energy changes in different regions. Therefore, corrosion behavior tended to become more localized in the deformed sample and the sample annealed at 1200 °C for 10 min [23]. The inhomogeneity reduced significantly after annealing at 1350 °C for 240 min.
Figure 3 shows the EBSD inverse pole figure (IPF) maps and kernel average misorientation (KAM) map of the alloy. As shown in the IPF map of the deformed sample (Figure 3a), grains are seen to be elongated along RD after rolling. Within these grains, many well-defined dislocation boundaries can be recognized. This is a typical deformation microstructure, which is similar to those in Al, Ni and IF steel [24,25,26,27,28]. These dislocation boundaries have been identified to be geometrically necessary dislocation boundaries (GNBs) [19]. After annealing at 1200 °C for 10 min (Figure 3b), the microstructure is similar to the deformed sample except that a small number of recrystallizing grains are observed (indicated by arrows). These recrystallizing grains have different orientations and distribute in-homogeneously in the deformation matrix, which is related to the heterogeneous deformation structure after rolling. After annealing at 1350 °C for 240 min (Figure 3c), GNBs in the interiors of grains are disappeared and the microstructure is composed of equiaxed recrystallized grains indicating that the sample is fully recrystallized. KAM represents local misorientations between two adjacent points within a grain. It can be applied to characterize dislocation density since the value of KAM directly links to dislocation accumulation extent [29]. As shown in Figure 3d–f, KAM values of majority grains in deformed sample are high. Only a few grains have relatively low KAM, which is coincident with grains boundary-free regions in Figure 2b. However, the KAM values decrease pronouncedly in recrystallized grains (indicated by arrows) in the sample annealed at 1200 °C for 10 min. It should be noted that recrystallization grains prefer to be formed in high KAM regions, shown in Figure 3e. After annealing at 1350 °C for 240 min, all grains show low KAM values. Figure 4 shows the distributions of KAM for individual samples. It is seen that the dislocation density represented by KAM values decreases rapidly after annealing.
Figure 5 shows the statistical analysis of boundaries represented by misorientation distributions. The deformed sample as shown in Figure 5a exhibits high contents of Σ1 boundaries, and little change occurs in misorientation distribution after annealing at 1200 °C for 10 min, as shown in Figure 5b. Nevertheless, the sample annealed at 1350 °C for 240 min as shown in Figure 5c shows different misorientation distribution. Most of the low-angle boundaries are disappeared and mainly high-angle boundaries are left. With the increasing annealing temperature and time, both the average misorientation angle and the proportions of high-angle boundaries increase. However, it should be noted that the total number of boundaries reduced after annealing. It is well known that low-Σ CSL boundaries belong to low-energy boundaries comparing to other boundaries and have excellent corrosion resistance [30,31]. Low-Σ CSL boundaries are also parts of high-angle boundaries (misorientation angle ≥ 15°). Thus, higher proportion of high-angle boundaries will result more fraction of low-Σ CSL boundaries [20]. Low-Σ CSL boundaries statistical analysis shows there are approximately 0.6%, 0.91% and 9.9% low-Σ CSL boundaries in the deformed sample and the samples annealed at 1200 °C for 10 min and at 1350 °C for 240 min samples, respectively.
Figure 6 presents TEM micrographs of individual samples. In the deformed sample, there are well-defined dislocation boundaries (being operated at edge-on) exhibiting a certain width (Figure 6a). Between these dislocation boundaries, there are large amounts of tangled dislocations. The “boundary-free regions” detected on the grain boundary map of Figure 2b were also be observed by TEM, as shown in the inset of Figure 6a. These regions compose of diffused dislocation boundaries with very small misorientations (typically lower than 2°). After annealing at 1200 °C for 10 min (Figure 6b), the dislocation boundaries however become sharper and better-defined. These changes suggest the occurrence of a recovery process by rearrangement of dislocations in these boundaries. The tangled dislocations that exist in the volumes between these boundaries decreased distinctly. Nevertheless, the most remarkable change observed is the formation of subgrains as shown in the inset of Figure 6b, which can reduce dislocation density significantly. After annealing at 1350 °C for 240 min (Figure 6c), dislocations boundaries disappear and only a few individual dislocations exist. Grain boundaries can be observed clearly since the sample is fully recrystallized. As shown in Figure 6d, after annealing at 1200 °C for 10 min the average dislocation boundary spacing (DG) increases slightly [27]. After annealing at 1350 °C for 240 min, the DG increases greatly.
Deformation induced dislocation can be divided into two categories: statistically stored dislocations (SSDs) and geometrically necessary dislocations (GNDs). SSDs are normally in forms of individual dislocations and dislocation tangles caused by random trapping, while GNDs are in forms of dislocation boundaries due to accommodation of lattice rotation [22]. According to Hughes et al. [27,28], large amount of GNDs will be accumulates to form dislocation boundaries (i.e., GNBs) and SSDs will be stored between these GNBs. The dislocation density (ρG) in these GNBs is estimated as:
ρG = (1.5θavSV)/b,
In this equation, θav is the average misorientation angle and SV is area per volume of boundaries (SV = 1/DG for deformed and 1200 °C-10 min annealed samples, and SV = π/2DG for 1350 °C-240 min annealed sample) [32] and b is Burgers vector (being 0.286 nm for Ta). The calculated ρG are listed in Table 1. For excellent corrosion resistance, percentages of low-Σ CSL boundaries in high-angle boundaries are also calculated with p(CSL)/p(θ > 15°). The results are shown in the Table 1. Dislocation boundaries can act as fast diffusion paths and corrosion anode comparing to bulk material. The ρG estimated by equation (1) decreases dramatically after annealing, and the density of SSDs significantly decrease as can be seen from TEM images. It is clear that more high-angle boundaries are converted to low-Σ CSL boundaries in the annealed sample, especially the fully recrystallized sample. High fraction of low- Σ CSL boundaries will keep the boundary diffusivity closer to the bulk diffusivity [33], which can reduce localized corrosion and lead to the formation of a continuous passive film during the corrosion process.
Previous studies have indicated that grain boundaries act as crystallographic defects and thus facilitate corrosion [34,35]. In this paper, SEM observations and EBSD characterizations demonstrate that localized corrosion tend to happen at regions of original grain boundaries and deformation induced dislocation boundaries. The dislocation boundaries observed in EBSD maps correlate to regions with high KAM value and these dislocation boundaries were confirmed in the TEM. However, the regions assumed as “boundary-free regions” by EBSD actually contain diffused boundaries with low misorientations as detected by the TEM. These regions are few with localized corrosion. It means that anodic processes take place in the regions with high dislocation density, while regions with lower dislocation density will be protected by cathodic process during electrochemical corrosion [36]. The low-Σ CSL boundaries also have excellent corrosion resistance due to the coincidence lattices and low boundary energies. After annealing process, internal dislocation density and dislocation boundaries are decreased and the fraction of low-Σ CSL boundaries are increased.
Figure 7 shows the schematic of dislocation structure and corrosion behavior of the alloy. Deformation introduces a large amount of dislocation boundaries (thick line in Figure 7) and tangled dislocations (thin line in Figure 7) between dislocation boundaries. The regions with crystal defects will be high in stored energies and more likely to be accelerated in corrosion. Therefore, pitting is more concentrated in this region [37]. After annealing, the SV of dislocation boundaries and tangled dislocations between dislocation boundaries decrease. The accelerated corrosion is weakened. Moreover, fraction of low-Σ CSL boundaries (blue line in Figure 7) is increased after annealing, which will keep the boundary corrosion behavior closer to the bulk. As a result, corrosion process tends to more uniform. Annealing is a processing method to tailor the structures of Ta, by which the contents of dislocations and dislocation boundaries are reduced and the contents of low-ΣCSL boundaries are increased. Therefore, the increase of corrosion resistance after annealing is related to the increase of low-Σ CSL boundaries and the decrease of dislocation boundaries as well as the tangled dislocations between boundaries.

4. Conclusions

The Ta-4%W alloy was cold deformed to 70% reductions in thickness and was annealed. The corrosion resistance of the alloy was evaluated in a 5 wt % sulfuric solution at 33 °C. It has been found that the alloy contains a large amount of dislocation boundaries and tangled dislocations between these boundaries after deformation. After annealing at 1200 °C for 10 min, the density of tangled dislocations decreases greatly, dislocation boundaries become sharper, and recrystallizing grains develop in the matrix. After annealing at 1350 °C for 240 min, the alloy is fully recrystallized and dislocation boundaries in interiors of grains are disappeared. Localized corrosion occurs at regions of original grain boundaries and dislocation boundaries indicating a microstructural feature controlled corrosion process of the alloy. Polarization curves show that corrosion potential gradual shift towards negative values and corrosion current density decrease after annealing. Both the anodic dissolution and the cathodic activity is much more blocked. For every Nyquist plot, there is only one typical semicircle and the polarization resistance increases. It is discussed that the increase of corrosion resistance of the alloy after annealing is caused by the increase of low-Σ CSL boundaries and decrease of dislocations as well as dislocation boundaries.

Author Contributions

Data curation, G.M., X.L. and Q.H.; Formal analysis, G.M., G.W. and X.L.; Investigation, G.M. and Q.H.; Resources, Q.C.; Supervision, G.W. and Q.C.; Writing—original draft, G.M. and G.W; Writing—review and editing, G.W.

Funding

This research was funded by the Fundamental Research Funds for the Central Universities, grant number 2018CDJDCL0019 and by Key Courses Program for Graduate Students of Chongqing University, grant number 201704020.

Conflicts of Interest

The authors declare no conflict of interest.

References

  1. Ma, Z.J.; Xie, H.; Wang, B.J.; Wei, X.W.; Zhao, D.W. A novel Tantalum coating on porous SiC used for bone filling material. Mater. Lett. 2016, 179, 166–169. [Google Scholar] [CrossRef]
  2. Hosseini, E.; Kazeminezhad, M. Dislocation structure and strength evolution of heavily deformed tantalum. Int. J. Refract. Metals Hard Mater. 2009, 27, 605–610. [Google Scholar] [CrossRef]
  3. Yang, H.L.; Li, J.; Zhou, Z.C.; Ruan, J.M. Structural preparation and biocompatibility evaluation of highly porous Tantalum scaffolds. Mater. Lett. 2013, 100, 152–155. [Google Scholar] [CrossRef]
  4. Bischof, M.; Mayer, S.; Leitner, H.; Clemens, H.; Staron, P.; Geiger, E.; Voiticek, A.; Knabl, W. On the development of grain growth resistant tantalum alloys. Int. J. Refract. Metals Hard Mater. 2006, 24, 437–444. [Google Scholar] [CrossRef]
  5. Bermúdez, M.D.; Carrión, F.J.; Martínez-Nicolás, G.; López, R. Erosion–corrosion of stainless steels, titanium, tantalum and zirconium. Wear 2005, 258, 693–700. [Google Scholar] [CrossRef]
  6. Seidl, W.M.; Bartosik, M.; Kolozsvári, S.; Bolvardi, H.; Mayrhofer, P.H. Improved mechanical properties, thermal stabilities, and oxidation resistance of arc evaporated Ti-Al-N coatings through alloying with Ta. Surf. Coat. Technol. 2018, 344, 244–249. [Google Scholar] [CrossRef]
  7. Chen, Y.I.; Chen, S.M. Annealing effects on nanostructure and mechanical properties of nanolaminated Ta–Zr coatings. Surf. Coat. Technol. 2013, 215, 209–217. [Google Scholar] [CrossRef]
  8. Fattah-Alhosseini, A.; Attarzadeh, F.R.; Vafaeian, S.; Haghshenas, M.; Keshavarz, M.K. Electrochemical behavior assessment of tantalum in aqueous KOH solutions. Int. J. Refract. Metals Hard Mater. 2017, 64, 168–175. [Google Scholar] [CrossRef]
  9. Silva, R.A.; Walls, M.; Rondot, B.; Da Cunha Belo, M.; Guidoin, R. Electrochemical and microstructural studies of tantalum and its oxide films for biomedical applications in endovascular surgery. J. Mater. Sci. Mater. Med. 2002, 13, 495–500. [Google Scholar] [CrossRef]
  10. Robin, A.; Rosa, J.L. Corrosion behavior of niobium, tantalum and their alloys in hot hydrochloric and phosphoric acid solutions. Int. J. Refract. Metals Hard Mater. 2000, 18, 13–21. [Google Scholar] [CrossRef]
  11. Ghorbani, H.; Abdollah-Zadeh, A.; Bagheri, F.; Poladi, A. Improving the bio-corrosion behavior of AISI316L stainless steel through deposition of Ta-based thin films using PACVD. Appl. Surf. Sci. 2018, 456, 398–402. [Google Scholar] [CrossRef]
  12. Wang, H.; Zheng, Y.; Jiang, C.; Li, Y.; Fu, Y. In vitro corrosion behavior and cytocompatibility of pure Fe implanted with Ta. Surf. Coat. Technol. 2017, 320, 201–205. [Google Scholar] [CrossRef] [Green Version]
  13. Wei, D.B.; Chen, X.H.; Zhang, P.Z.; Ding, F.; Li, F.K.; Yao, Z.J. Plasma surface tantalum alloying on titanium and its corrosion behavior in sulfuric acid and hydrochloric acid. Appl. Surf. Sci. 2018, 441, 448–457. [Google Scholar] [CrossRef]
  14. Robin, A. Corrosion behavior of niobium, tantalum and their alloys in boiling sulfuric acid solutions. Int. J. Refract. Metals Hard Mater. 1997, 15, 317–323. [Google Scholar] [CrossRef]
  15. Souza, A.D.; Robin, A. Influence of concentration and temperature on the corrosion behavior of titanium, titanium-20 and 40% tantalum alloys and tantalum in sulfuric acid solutions. Mater. Chem. Phys. 2007, 103, 351–360. [Google Scholar] [CrossRef]
  16. Friedrich, C.; Kritzer, P.; Boukis, N.; Frans, G.; Dinjus, E. The corrosion of tantalum in oxidizing sub- and supercritical aqueous solutions of HCl, H2SO4 and H3PO4. J. Mater. Sci. 1999, 34, 3137–3141. [Google Scholar] [CrossRef]
  17. Piotrowski, O.; Madore, C.; Landolt, D. Electropolishing of tantalum in sulfuric acid-methanol electrolytes. Electrochim. Acta 1999, 44, 3389–3399. [Google Scholar] [CrossRef]
  18. Carmo, D.R.D.; Picone, C.A. Corrosion resistance of niobium, tantalum and titanium in sea water and sulfuric acid. Electrochem. Soc. 2013, 224, 1722. [Google Scholar]
  19. Zhang, J.; Ma, G.Q.; Godfrey, A.; Shu, D.Y.; Chen, Q.; Wu, G.L. Orientation dependence of the deformation microstructure of Ta-4%W after cold-rolling. IOP Conf. Ser. Mater. Sci. Eng. 2017, 219, 012051. [Google Scholar] [CrossRef]
  20. Luo, H.; Wang, X.Z.; Dong, C.F.; Xiao, K.; Li, X.G. Effect of cold deformation on the corrosion behaviour of UNS S31803 duplex stainless steel in simulated concrete pore solution. Corros. Sci. 2017, 124, 178–192. [Google Scholar] [CrossRef]
  21. Brandon, D.G. The structure of high-angle grain boundaries. Acta Metall. 1966, 14, 1479–1484. [Google Scholar] [CrossRef]
  22. Hughes, D.A.; Hansen, N.; Bammann, D.J. Geometrically necessary boundaries, incidental dislocation boundaries and geometrically necessary dislocations. Scr. Mater. 2003, 48, 147–153. [Google Scholar] [CrossRef]
  23. Rofagha, R.; Erb, U.; Ostrander, D.; Palumbo, G.; Aust, K.T. The effects of grain size and phosphorus on the corrosion of nanocrystalline Ni-P alloys. Nanostruct. Mater. 1993, 2, 1–10. [Google Scholar] [CrossRef]
  24. Liu, Q.; Hansen, N. Geometrically necessary boundaries and incidental dislocation boundaries formed during cold deformation. Scr. Metall. Mater. 1995, 32, 1289–1295. [Google Scholar] [CrossRef]
  25. Liu, Q.; Jensen, D.; Hansen, N. Effect of grain orientation on deformation structure in cold-rolled polycrystalline aluminium. Acta Mater. 1998, 46, 5819–5838. [Google Scholar] [CrossRef]
  26. Hughes, D.A.; Hansen, N. Microstructural evolution in nickel during rolling from intermediate to large strains. Metall. Trans. A 1993, 24, 2022–2037. [Google Scholar] [CrossRef]
  27. Hughes, D.A.; Hansen, N. Microstructure and strength of nickel at large strains. Acta Mater. 2000, 48, 2985–3004. [Google Scholar] [CrossRef]
  28. Li, B.L.; Godfrey, A.; Meng, Q.C.; Liu, Q.; Hansen, N. Microstructural evolution of IF-steel during cold rolling. Acta Mater. 2004, 52, 1069–1081. [Google Scholar] [CrossRef]
  29. Kamaya, M. Assessment of local deformation using EBSD: Quantification of accuracy of measurement and definition of local gradient. Ultramicroscopy 2011, 111, 1189–1199. [Google Scholar] [CrossRef]
  30. Kobayashi, S.; Kobayashi, R.; Watanabe, T. Control of grain boundary connectivity based on fractal analysis for improvement of intergranular corrosion resistance in SUS316L austenitic stainless steel. Acta Mater. 2016, 102, 397–405. [Google Scholar] [CrossRef]
  31. Shimada, M.; Kokawa, H.; Wang, Z.J.; Sato, Y.S.; Karibe, I. Optimization of grain boundary character distribution for intergranular corrosion resistant 304 stainless steel by twin-induced grain boundary engineering. Acta Mater. 2002, 50, 2331–2341. [Google Scholar] [CrossRef]
  32. Godfrey, A.; Hughes, D.A. Determination of boundary area and spacing in prismatic structures with applications to dislocation boundaries. Mater. Charact. 2002, 48, 89–99. [Google Scholar] [CrossRef]
  33. Tan, L.; Ren, X.; Sridharan, K.; Allen, T.R. Corrosion behavior of Ni-base alloys for advanced high temperature water-cooled nuclear plants. Corros. Sci. 2008, 50, 3056–3062. [Google Scholar] [CrossRef]
  34. Song, G.L.; Xu, Z.Q. The surface, microstructure and corrosion of magnesium alloy AZ31 sheet. Electrochim. Acta 2010, 55, 4148–4161. [Google Scholar] [CrossRef]
  35. Zhang, T.; Shao, Y.; Meng, G.; Cui, Z.; Wang, F. Corrosion of hot extrusion AZ91 magnesium alloy: I-relation between the microstructure and corrosion behavior. Corros. Sci. 2011, 53, 1960–1968. [Google Scholar] [CrossRef]
  36. Rault, V.; Vignal, V.; Krawiec, H.; Dufour, F. Quantitative assessment of local misorientations and pitting corrosion behaviour of pearlitic steel using electron backscattered diffraction and microcapillary techniques. Corros. Sci. 2015, 100, 667–671. [Google Scholar] [CrossRef]
  37. Maric, M.; Muránsky, O.; Karatchevtseva, I.; Ungár, T.; Hester, J. The effect of cold-rolling on the microstructure and corrosion behaviour of 316L alloy in FLiNaK molten salt. Corros. Sci. 2018, 142, 133–144. [Google Scholar] [CrossRef]
Figure 1. Electrochemical measurements of (a) Potentiodynamic polarization curves and (b) Nyquist plots.
Materials 12 00117 g001
Figure 2. Corrosion SEM images of the (a) deformed; (c) 1200 °C 10 min annealed and (e) 1350 °C 240 min annealed samples, and corresponding grain boundary maps of the (b) deformed; (d) 1200 °C 10 min annealed and (f) 1350 °C 240 min annealed samples, respectively. Less localized corrosion regions are marked by A, and severe localized corrosion regions are marked by B. The dashed boxes indicate the SEM sites.
Materials 12 00117 g002
Figure 3. EBSD inverse pole figure (IPF) maps (ac) and average misorientation (KAM) maps (df) of (a,d) 70% deformed; (b,e) 1200 °C 10 min annealed and (c,f) 1350 °C 240 min annealed samples, respectively (arrows indicate recrystallizing grains).
Materials 12 00117 g003
Figure 4. Distribution of KAM value for different samples.
Materials 12 00117 g004
Figure 5. Misorientation distribution of the (a) 70% deformed; (b) 1200 °C 10 min and (c) 1350 °C 240 min annealed samples, respectively.
Materials 12 00117 g005
Figure 6. TEM images of the (a) deformed sample; (b) 1200 °C 10 min and (c) 1350 °C 240 min annealed samples; (d) distributions of boundary spacing.
Materials 12 00117 g006
Figure 7. Schematic drawing of the dislocation structure and corrosion behavior of the alloy.
Materials 12 00117 g007
Table 1. The calculate results of ρG and percentages of low-Σ CSL boundaries.
SampleρG (m−2)p(CSL)/p(θ>15°)
deformed3.74 × 10153.75%
1200 °C-10 min3.08 × 10155.06%
1350 °C-240 min3.01 × 101410.65%

