Surface Characterization and Tribological Performance of Anodizing Micro-Textured Aluminum-Silicon Alloys
by
 ,
,
Luanxia Chen
1,2, 
Zhanqiang Liu
1,2,*,
Bing Wang
1,2,
Qinghua Song
1,2,
Yi Wan
1,2 and
Long Chen
1,2 1
School of Mechanical Engineering, Shandong University, Jinan 250061, China
2
Key Laboratory of High Efficiency and Clean Mechanical Manufacture of MOE/Key National Demonstration Center for Experimental Mechanical Engineering Education, Jinan 250061, China
*
Author to whom correspondence should be addressed.
Materials 2019, 12(11), 1862; https://doi.org/10.3390/ma12111862
Submission received: 10 May 2019
/
Revised: 4 June 2019
/
Accepted: 5 June 2019
/
Published: 9 June 2019
(This article belongs to the Special Issue Textures and Anisotropy in Advanced Materials)
Abstract
:Eutectic aluminum-silicon alloys present high frictional coefficient and a high wear rate due to the low hardness under sliding friction conditions. In this paper, the eutectic aluminum-silicon alloy was textured firstly by micro-milling operations. Then, the micro-textured specimen was subjected to anodizing to fabricate alumina films. The surface topography, surface roughness, and bearing area ratio of micro-textured and anodizing micro-textured specimens were measured and characterized. For the anodizing micro-textured specimens, the surface roughness and superficial hardness increase compared with those for micro-textured ones. Tribological tests indicate that anodizing micro-textured samples present lower friction coefficient of 0.37 than that of flat samples of 0.43 under dry sliding conditions. However, they exhibit higher friction coefficient at 0.16 than that of flat samples of 0.13 under oil-lubricated conditions. The difference between the friction coefficient of anodizing micro-textured and flat samples under dry and oil-lubricated conditions is ascribed to the influence mechanism of surface roughness, bearing area ratio curves, and its relative parameters on the tribological performance of testing samples. The dry sliding friction coefficient has a positive correlation with bearing area ratio curves, while they present negative correlation with bearing area ratio curves under oil-lubricated conditions. The synergy method treated with micro-milling and anodizing provides an effective approach to enhance the dry sliding friction property of eutectic aluminum-silicon alloys.
1. Introduction
As the versatile material in automobile and military engineering, aluminum-silicon alloys are attractive for their high strength to weight ratio, excellent castability, high thermal conductivity, good wear, and corrosion resistance. Depending on the silicon content, aluminum-silicon alloys are classified into three types, i.e., hypoeutectic, eutectic, and hypereutectic. However, eutectic aluminum-silicon alloys present high frictional coefficient and a high wear rate due to the low hardness under sliding friction conditions. Various approaches to enhance the friction property of eutectic aluminum-silicon alloys are listed as follows: Microstructural modification by rapid solidification, such as selective laser melting [1,2,3]; morphology modification; reinforcement modification [4,5]; alloying [6,7]; and surface modifications [8,9,10].
Surface micro-texturing performed as a surface modification approach is attractive for enhancing the frictional property of mechanical components. Micro-textures act as the entrapment of wear particles to reduce the abrasion wear under dry sliding conditions [11,12,13,14]. Under boundary and mixed lubrication, micro-textures perform as lubricant reservoirs to generate secondary lubrication [15,16]. Furthermore, micro-texturescanemerge the hydrodynamic pressure lubrication to improve load carrying capacity under full-film lubrication [17,18,19].
However, Houdková et al. [20] concluded that the positive effect of micro-textures on frictional behavior was observed only on the initial stage of friction under the high-loaded testing conditions. Micro-textures on Al-Sn-Si samples were worn out rapidly by the counterparts. They then had no influence on the frictional property of testing specimens. To date, nitrogen ion implantation, anodic oxidation, high-velocity oxy fuel spraying, physical vapor deposition (PVD), and laser cladding have been employed on metal alloys after micro-texturing to improve their antifriction property [21,22,23,24].
Anodic oxidation of aluminum alloys synergistic with surface micro-texturing technology has been investigated recently [25,26,27]. However, most of the recent researches have focused on the improved surface hardness, deposition of PTFE/MoS2 particles on porous anodic aluminum oxide film, and its tribological properties under dry sliding conditions [10,25,28,29]. The tribological property and surface topography changes ascribed to anodizing process were not well investigated under dry and oil-lubricated conditions. Surface topography of aluminum-silicon alloys was changed with anodizing. Most of the researchers neglected the impact of surface topography on the friction property.
The frictional resistance is proportional to the load, independent of the apparent contact area, and sliding velocity of sliding surfaces has been known for a long time [30]. However, at the constant load, friction coefficient is material-dependent and often found to take different values for different conditions (e.g., humidity, surface property) of the sliding surfaces [31]. A large number of experiments have shown that in the early stage of friction and wear, the friction coefficient is greatly affected by the surface property parameters. The surface property parameters will affect the real contact area of two contact surfaces. Two of the most important surface property parameters are surface roughness and topography. The effect of surface roughness on the tribological performance needed to be investigated for proper design of contact surface.
Sedlaček et al. [32,33] investigated the correlation between standard roughness parameters (skewness, kurtosis) and tribological behavior of contact surfaces. Pin-on-disc test results indicated that surfaces with higher Sku and negative Ssk values tended to reduce friction under dry and lubricated conditions. Standard surface roughness parameters Sa and Sq were not sufficient to determine the tribological performance of contact surfaces as they provided only a rough estimate of the roughness class. A higher surface roughness (Sa, Sq) generally resulted in lower friction but longer distances to reach steady-state conditions under dry sliding conditions. However, the friction coefficient was lower while the roughness (Sa, Sq) was low. Surface roughness parameters Ssk, Sku, and Svk were demonstrated to show a good correlation to the tribological performance of contact surfaces.
Zhu et al. [34] investigated the influence mechanism of morphological parameters on tribological behaviors based on bearing area ratio curve. They established functions correlating the dry or lubricated friction coefficient and the bearing area ratio curves. Forty-five steel disc samples were prepared using different grades of grinding, polishing, turning, and milling methods to obtain diverse surface topography parameters to verify the functions correlation attained.
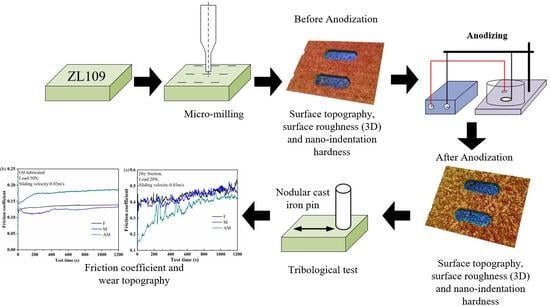
In the present paper, the impact of surface roughness on the friction property of eutectic aluminum-silicon alloys was investigated under dry and oil-lubricated conditions. The framework structure of this study is illustrated in Figure 1. The micro-milling process depended on forced material removal and was utilized to manufacture micro-textures on specimens. Then, the textured specimen was subjected to anodizing to fabricate alumina films. The phase composition and microstructure of the aluminum oxide films were investigated by X-ray diffractometer (XRD), scanning electron microscope (SEM), and energy dispersive spectroscopy (EDS) analyses. This sequential process is easy to implement with a high efficiency and low cost. Confocal laser scanning microscopy (CLSM) and SEM were employed to characterize the surface topography before and after anodizing. Nano-indentation tests were performed to measure the superficial hardness of alumina films. Frictional coefficients of testing specimens were reported to investigate the effect of surface roughness on frictional properties under dry friction and oil-lubricated conditions.
2. Materials and Experimental Setup
2.1. Preparation Process
2.1.1. Materials
Commercially available, flat eutectic aluminum-silicon alloys samples (10 mm × 10 mm × 5 mm, ZL109, GB/T 1173-2013) were used for the substrate under dry friction conditions. Table 1 displays the chemical composition of ZL109. Firstly, the flat ZL109 samples and nodular cast iron pins were wet polished using #600 to #1200 waterproof emery papers. Then, they were polished with 5 μm diamond suspension to obtain the mean surface roughness Sa of 1.17 and 0.56 μm, respectively.
The five-axis CNC milling machine (Kern Micro 2522, Kern Microtechnik GmbH, Eschenlohe, Germany) with a maximum rotating speed of 50,000 rpm was employed to micro-mill the micro-textures on the ZL109. A 4-flute cemented carbide end mill of 6 mm diameter (MX430, NS TOOL, Tokyo, Japan) was used for cutting the plane to fabricate surfaces under the same cutting parameters. Then, the tungsten carbide flat micro end mill with 200 µm diameter (MSES230P, NS TOOL, Tokyo, Japan) was employed to fabricate the rectangle dimples with arcs on specimens. Cutting parameters of micro-milling experiments to fabricate micro-textures are listed in Table 2. Supporting material was employed to control burr formation in the micro-milling experiment [35]. After micro-milling experiments, the supporting material was removed ultrasonically in acetone. Moreover, surface topography of micro-textured specimens and polished flat specimens were characterized with CLSM. All the tested specimens were ultrasonically cleaned in acetone and ethanol baths for 15 min each.
2.1.2. Anodization
The flat and micro-textured plate was degreased ultrasonically in ethanol and acetone for 10 min each. Then, the flat and micro-textured plates with a planar area of 100 mm2 were used as the substrate. The other surfaces were coated with resin to prevent from anodic oxidation. The anodization of ZL109 involved the surface pretreatment and anodic oxidation.
Before anodic oxidation, the flat and micro-textured plates were immersed into the alkaline electrolyte consisting of 20 g/L Na3PO4 and 5 g/L NaOH for 3 min at room temperature. This process was intended to remove the oxides from the ZL109 surface. Then, they were chemically polished in the solution containing aqueous HNO3 (50%, V/V), HF (5%, V/V) for 3 min to remove the black stains at 25 °C. The distilled deionized water was used to rinse experimental samples after each process.
The anodizing was performed in an electrolyte cell with flat and micro-textured ZL109 sheet as anode, lead sheet as cathode, and phosphoric acid solution (4 wt%) as electrolyte. The two electrodes were placed at a fixed distance of 10 mm. Anodization was carried out at the current density of 0.025 A/cm2 and a duration of 35 min. The electrolyte temperature during anodization was retained at 20 °C.
After anodizing, the surface topography of micro-textured specimens combined with anodizing was characterized by SEM (JSM-6610LV, Jeol, Tokyo, Japan) and CLSM (VK-X200 series, Keyence, Osaka, Japan). The phase constituents of ZL109 before and after anodizing were characterized by using an X-ray diffractometer (D8 Advance, Bruker AXS, Karlsruhe, Germany) with Cu Kα radiations (λ = 1.5406 Å), and the data were collected in the 2θ range from 20° to 80°.
2.2. Nanoindentation
The nanoindentation test was performed using a MML NanoTest TM nano-indenter (NanoTest TM, Micro-Materials, Wrexham, UK) to measure the hardness of ZL109, nodular cast iron, and aluminum oxide. A fixed maximum displacement indentation method with a Berkovich shaped diamond tip diameter of 50 nm was used in the nanoindentation test. In addition, the test parameters for nanoindentation are listed in Table 3. To avoid the substrate effect, the maximum indentation depth for the aluminum oxides was 240 nm, which should be less than 10% of the total film thickness (about 3000 nm) to meet the International Organization for Standardization ISO: 14577-1:2002E.
2.3. Friction Tests
Dry sliding friction tests were performed using a pin-on-plate configuration (UMT-3, CETR, USA) in the linear reciprocating sliding mode with the normal load of 20 N and the sliding speed of 0.03 m/s. Under oil-lubricated conditions, the applied load was 50 N, and the sliding velocity was 0.03 m/s. The upper counter-body was a nodular cast iron pin with the diameter of 5 mm. The contact surface between nodular cast iron pins and plate was flat. Each friction test continued for 1200 s. Three identical samples were made to conduct the tribological tests to evaluate the frictional performance.
After the friction tests, EDS analysis was employed to examine elemental characteristics of the wear tracks of testing specimens. In this paper, the flat sample is denoted as F, the micro-textured sample proceeded is designated as M, the anodizing micro-textured specimen is named as AM.
3. Results and Discussion
3.1. Surface Topography and XRD Analysis
The surface morphologies of F, M, and AM specimens are characterized by SEM in Figure 2. Figure 2a,b depicts the surface morphology of flat specimens. Figure 2c,d illustrates the SEM topography of micro-textured specimens. Before anodizing, the length, width, and distance of rectangle dimples are 600, 200, and 500 µm. The depth is 45 µm, and the dimple area density is 22.2%. The surface micrograph of micro-textured specimens treated with anodizing is illustrated in Figure 2e,f. The anodized surface becomes rougher than the micro-textured one. Porous aluminum oxide films have been fabricated on the surface of ZL109 by anodizing. The phosphoric acid anodic film surface appears to be relatively uniform. The pores are of irregular shapes, and the array is regular [36].
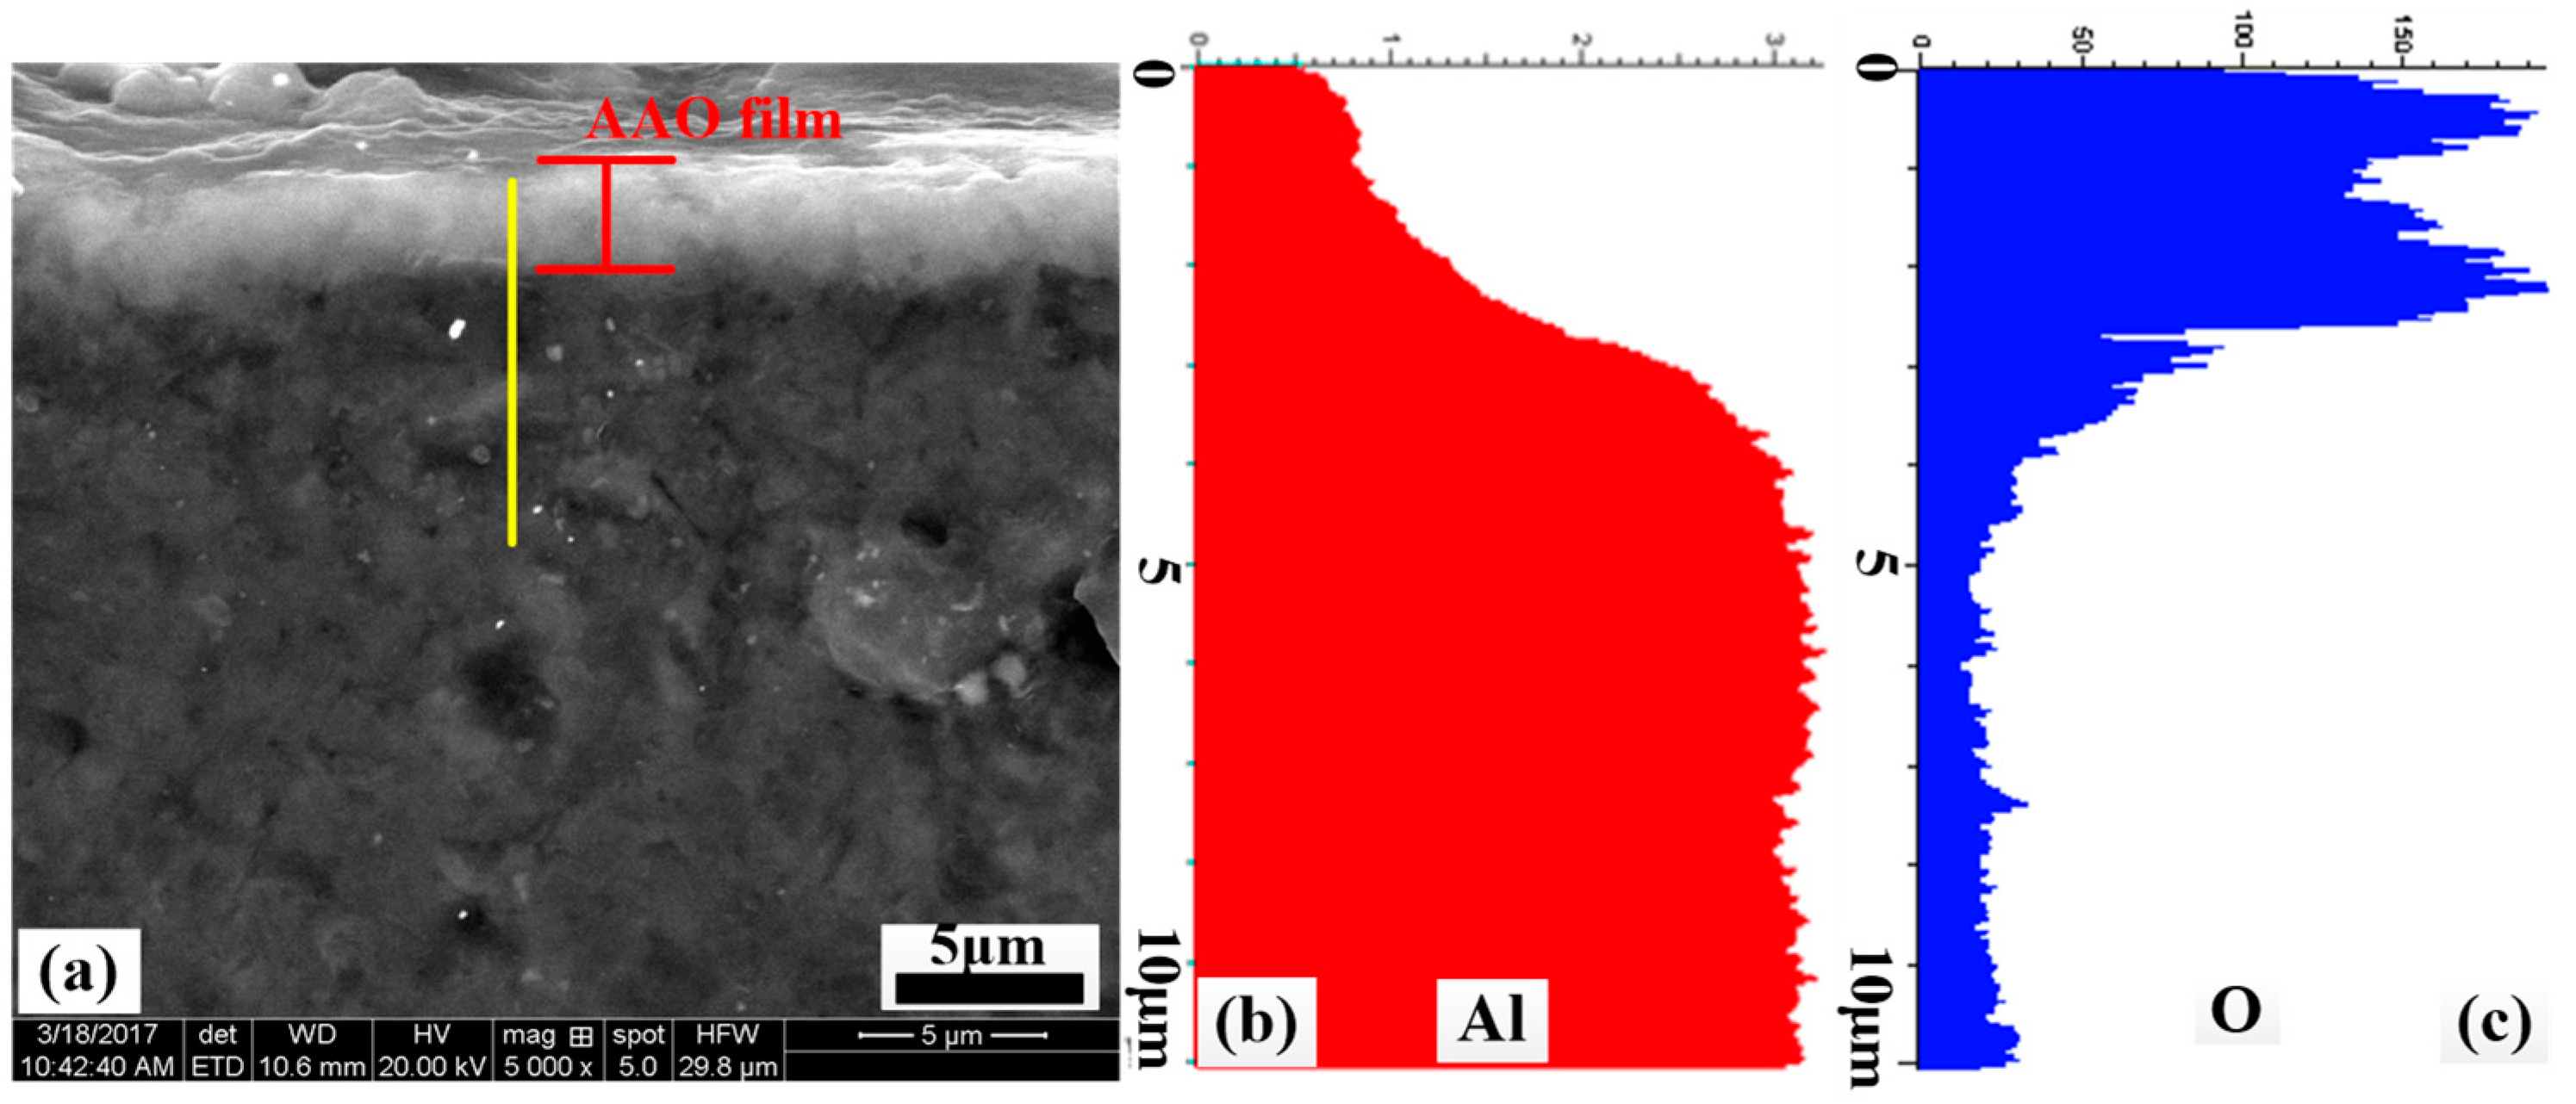
The cross-sectional SEM micrograph of anodized ZL109 is illustrated in Figure 3a. Alumina films are distributed evenly on ZL109 alloys with the thickness of 3 μm. The distribution of the aluminum oxide films’ elements is checked by EDS line scanning, and the results are presented in Figure 3b,c. As can be seen, the Al and O elements obviously diffuse on the ZL109. The aluminum and oxygen directly result from the growth of the anodic film.
The XRD patterns of ZL109 before and after anodizing performed on the surface are shown in Figure 4. The XRD pattern of ZL109 before anodizing shows that peaks of Al and Si arise from ZL109 alloy matrix of the composites (Figure 4a). Figure 4b shows that the main phase constituent of the aluminum oxide films is Al and Si. Al and Si come from ZL109 alloy substrate. The aluminum oxide films consist of mutinaite (Al2O3·54SiO2), Al2O3, and SiO2 phase, which formed mainly in the reaction process of anodization.
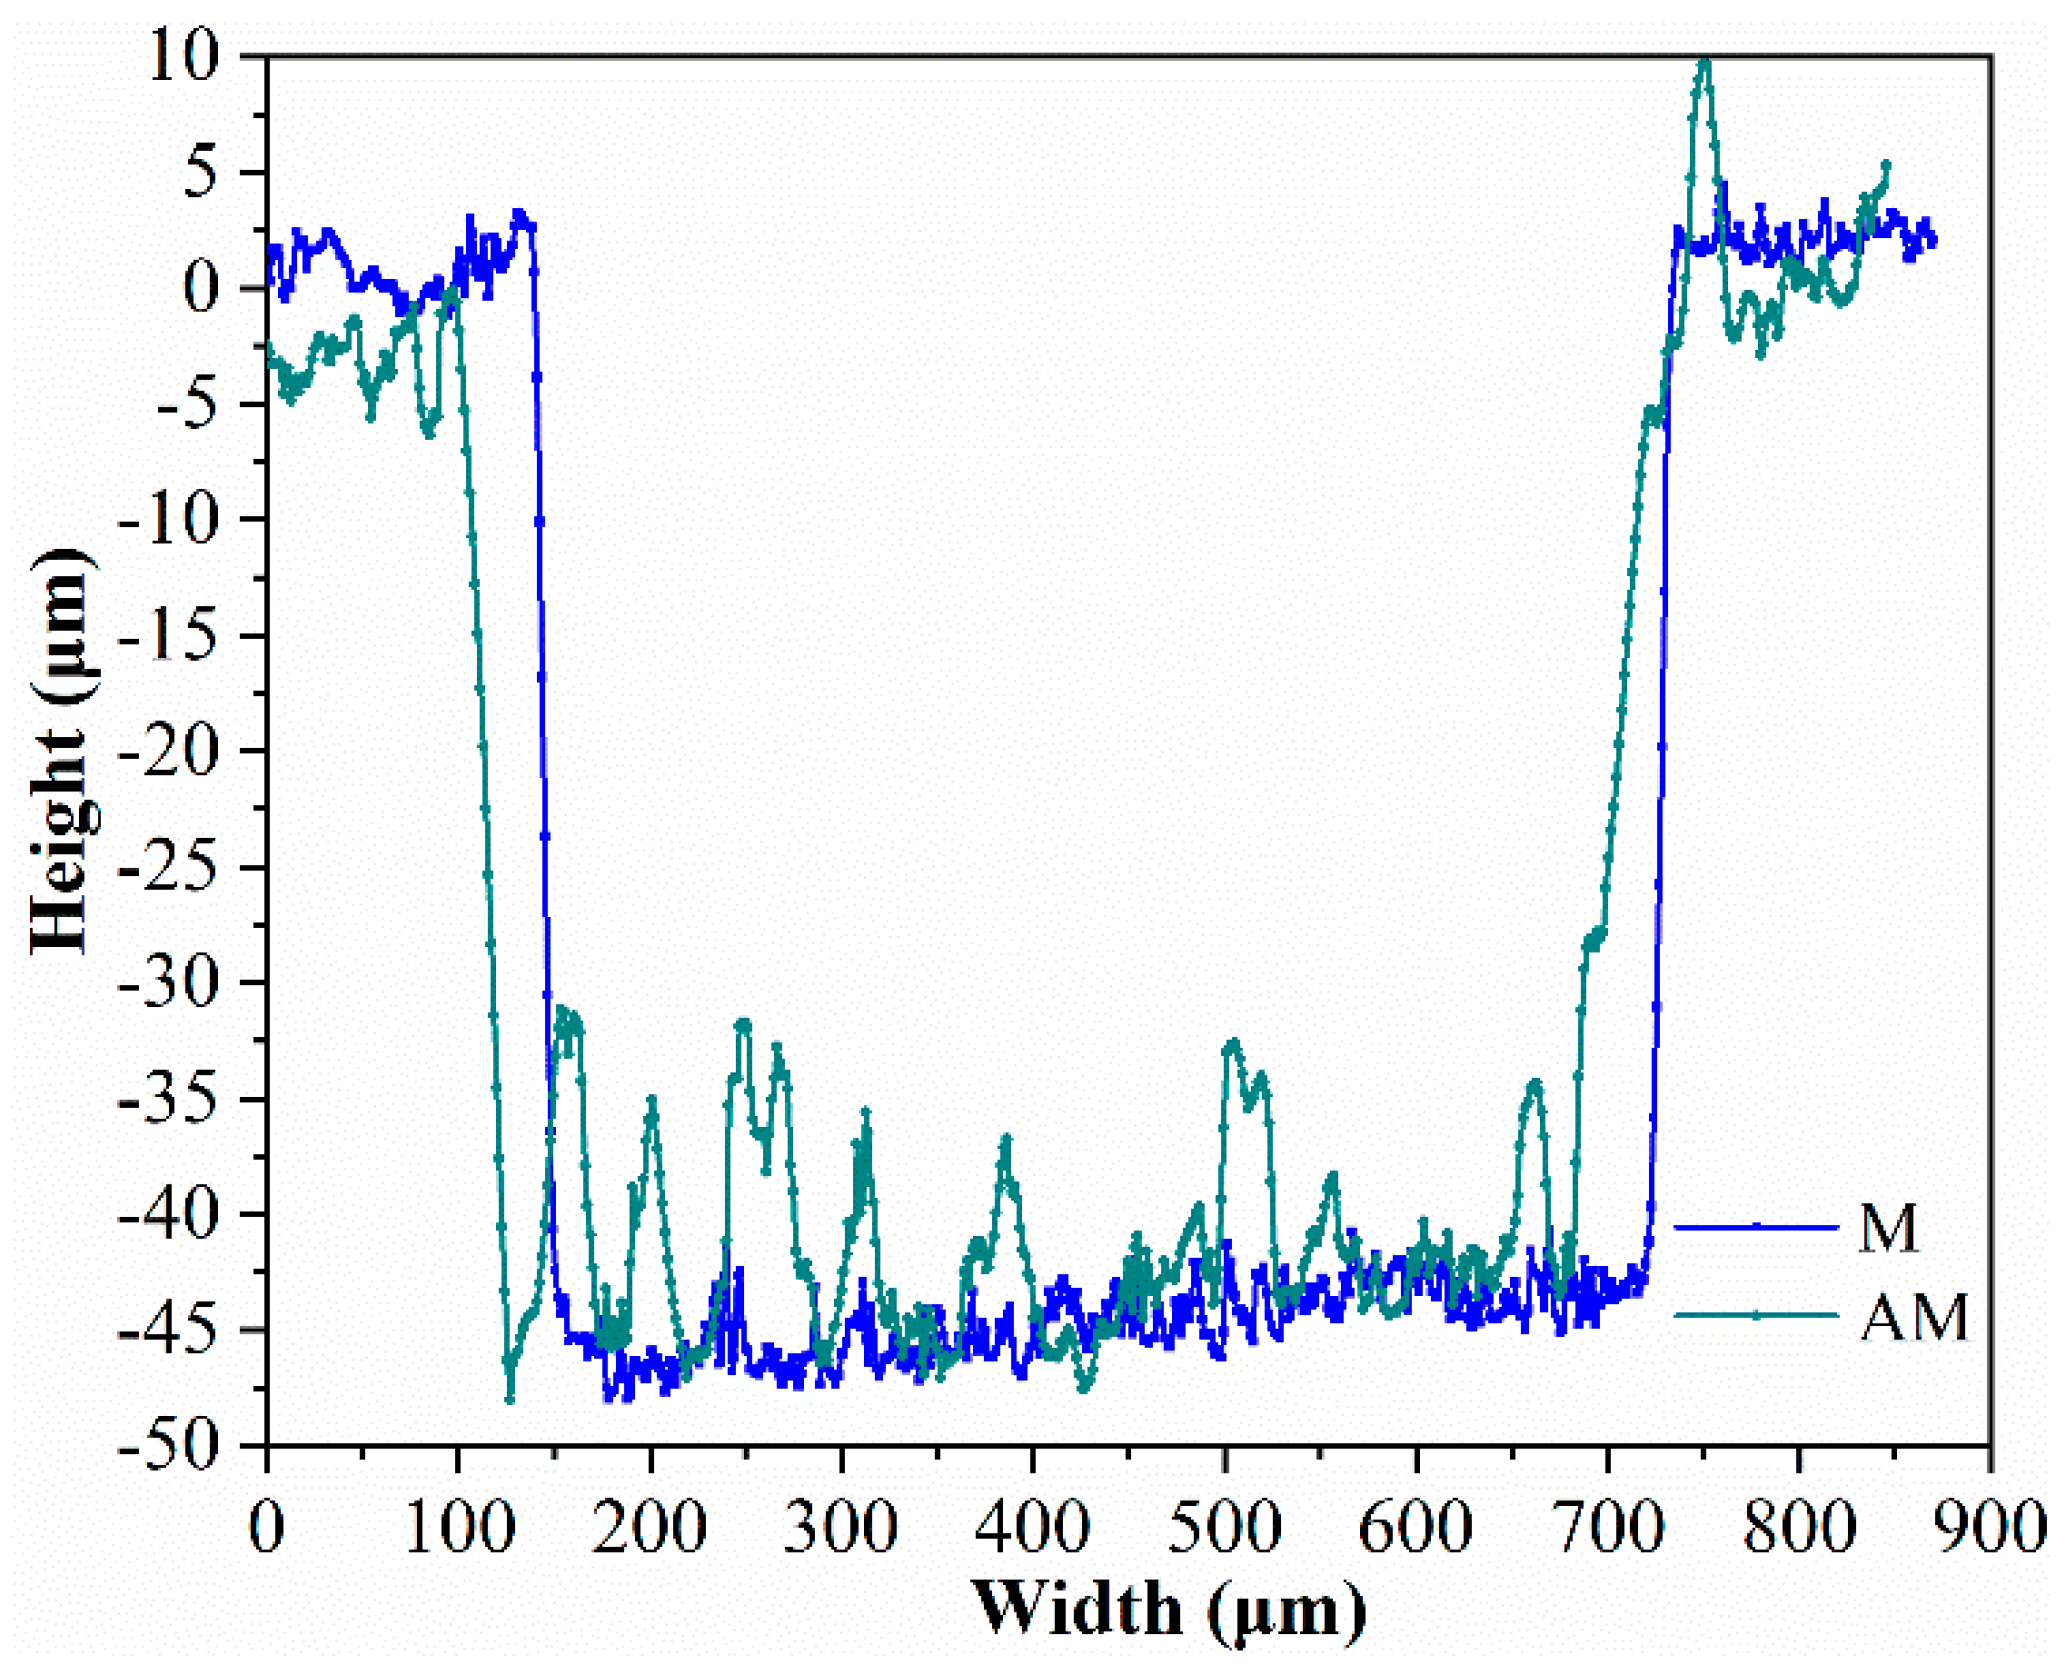
Two-dimensional cross-sectional views of a single micro-texture along the long side are demonstrated in Figure 5. The length, width, and depth of micro-textures before and after anodizing are almost the same. Surface topography of micro-textures is changed through anodizing. The bottom topography of micro-textures after anodizing becomes rough compared with that of micro-textures before anodizing.
3.2. Surface Roughness and Bearing Area Ratio Curve
ISO 13565-2: 1997 defines a set of parameters, based on the linear material ratio curve, to be used for evaluating the valley suppressed roughness profile, which is based on a three-layer surface model, evaluating the peaks, the core, and the valleys separately. They are intended to aid in assessing the operational behavior of highly mechanically stressed surfaces.
The arithmetical mean height (Sa), root mean square height (Sq), skewness (Ssk), kurtosis (Sku), and other parameters for the samples studied in the research are summarized in Table 4. Samples were prepared using micro-milling and anodizing, which resulted in Sa values increased from 0.89 μm to 1.81 μm and different values of other parameters. Variable specimens with similar Ssk and Sku but different Sa and Sq values were prepared to investigate the effect of the Sa and Sq parameters on the tribological behavior of contact surfaces under dry and oil-lubricated conditions.
The bearing area ratio curves of F, M, and AM samples are illustrated in Figure 6. The bearing area ratio curve is the cumulative curve of the distribution. The bearing area ratio curve is counted from the highest point on the surface (where the curve equals 0%) to its lowest point (where the curve reaches 100%). The nomenclature and definition of bearing area ratio parameters are summarized in Table 5.
Bearing area ratio curves of a random rough surface are S-shaped, as illustrated in Figure 6. The reduced peak height Spk is the average height of the protrusion above the roughness core profile, which indicates the area that quickly wears out by relative motion. The reduced valley depth Svk is the average depth of the profile valleys projecting through the roughness core profile, which demonstrates the sub-surface that retains oil for lubrication. The core roughness depth Sk is the roughness profile excluding the fine protruding peaks and deep steep-sided valleys, which is the core depth of the functional surface during the lifetime of the surface. The material component Smr1 is the percentage of the material ratio curve that coincides with the upper limit of the roughness core profile Sk. The material component Smr2 is the percentage of the material ratio curve that coincides with the lower limit of the roughness core profile Sk. The pole height Sxp generally represents the height difference between the material ratio of 2.5% and the material ratio of 50%. The parameters Spk and Svk are each calculated as the height of the right-angle triangle, which is constructed to have the same area as the “peak area” or “valley area”, respectively. The right-angle triangle corresponding to the “peak area Area1” has Smr1 as its base, and that corresponding to the “valley area Area2” has Smr2 as its base.
3.3. Nanoindentation Tests Analysis
The load-unload curve and superficial hardness over different indentation depths for ZL109, nodular cast iron, and aluminum oxide (black, blue, and red lines) are depicted in Figure 7. The phenomenon that the nanoindentation hardness decreases with the increasing maximum displacement is called size effect. The hardness of aluminum oxide increases by anodizing compared with that of ZL109, which is higher than that of nodular cast iron.
3.4. Frictional Coefficient
Figure 8 shows the plot of frictional coefficients varying with running time of 1200 s to elucidate the frictional property of F, M, and AM specimens under dry and oil-lubricated conditions. For sliding friction, both adhesion and ploughing components govern friction under dry sliding, while lubricated sliding can be characterized only by the ploughing component [30,37]. It is obvious that surface roughness controls friction process, since it fundamentally influences friction behavior.
The friction coefficient of dry sliding conditions is illustrated in Figure 8a. Friction process of testing specimens can be divided into running-in and steady stages. Under steady state, the average frictional coefficient of flat specimens is 0.44. The mean friction coefficient of micro-textured samples is 0.43. For the anodizing micro-textured specimens, the friction coefficient is reduced compared with that of flat specimens. The average friction coefficient of AM samples is 0.37.
The friction coefficient of oil-lubricated conditions is shown in Figure 8b. The average friction coefficient of flat samples is 0.13 under steady stage. Moreover, the mean friction coefficient of micro-textured samples is 0.11, lower than that of flat specimens. This indicates that micro-textures enhance the frictional property through serving as lubricant reservoirs to generate secondary lubrication. However, the friction coefficient of anodizing micro-textured samples increases from 0.14 to the value of 0.17, which is higher than that of flat samples, and the mean friction coefficient of micro-textured specimens treated with anodizing is 0.16.
3.5. Discussions
3.5.1. Influence of Bearing Area Ratio Curve and Relevant Roughness Parameters (Sa, Sq, Spk, Svk, Sk, Smr1, Smr2) under Dry Sliding Conditions
The two contributions, which are material property and surface topography, of two interacting specimens affect the frictional behavior under dry sliding tribological tests. In this research, the surface roughness and superficial hardness of micro-textured samples after anodizing increase compared with that of micro-textured specimens. The synergy between surface roughness and high superficial hardness of micro-textured samples after anodizing presents lower friction coefficient than that of merely micro-textured specimens.
Under dry sliding conditions, the frictional resistance can be expressed as the sum of two terms, the shearing and the ploughing process. According to Bowden and Tabor [22], the friction coefficient is given by
where Ar is the real contact area, Ap is the furrow area, τs is the shear strength of a unit area, τp is the furrow force of a unit area, L is the applied normal load, and H is the metallic hardness.
If the ploughing term is neglected, as the shearing term is the most important part which is responsible for metallic friction, the friction coefficient can be presented as:
The friction coefficient is closely related to the real contact area under dry sliding conditions. The real contact area is affected by the surface topography and superficial hardness of contact surfaces.
To investigate the influence of bearing area ratio curves on the tribological performance of testing samples, the bearing area ratio curves and friction real-time curves of flat, micro-textured, and anodizing micro-textured specimens are chosen for comparison, as shown in Figure 6 and Figure 8. A higher surface roughness (Sa, Sq) generally results in lower friction but longer distances to reach steady-state conditions under dry sliding conditions.
According to Zhu et al. [34], the dry sliding friction coefficient has a positive correlation with the bearing area ratio curves and its relative parameters. For the flat and micro-textured samples illustrated in Figure 8a, the smaller Spk and Smr1 are, the faster the friction coefficient increases. In contrast, the larger Spk and Smr1 are, the slower the friction coefficient rises, such as for anodizing micro-textured specimens. Compared with anodizing micro-textured samples, the Sk of flat and micro-textured specimens are the smallest. Consequently, the changes in the friction coefficient of flat and micro-textured samples are accordingly minimal. Therefore, the smaller the value of Sk, the faster the friction coefficient reaches the steady state, and the running time to steady-state conditions tends to become shorter under dry sliding conditions. A smaller ratio of real contact area to nominal contact area is presented with steeper bearing area ratio curve for larger K, Spk, Sk, and Svk values of anodizing micro-textured samples, and the high superficial hardness of anodizing micro-textured samples reduces the real contact area as well. Consequently, anodizing micro-textured samples present the lowest friction coefficient under dry sliding friction.
In the case of dry sliding, friction coefficient curves of anodizing micro-textured samples exhibit a certain degree of oscillations, as seen in Figure 8a. Menezes et al. [37] attribute these oscillations to the stick-slip effect related to friction process development and adhesive component. They report that surface roughness does not affect the amplitude of these oscillations significantly, but that they are mainly influenced by the ploughing component of the friction. Stick-slip phenomenon is also usually related to the transfer of materials in contact.
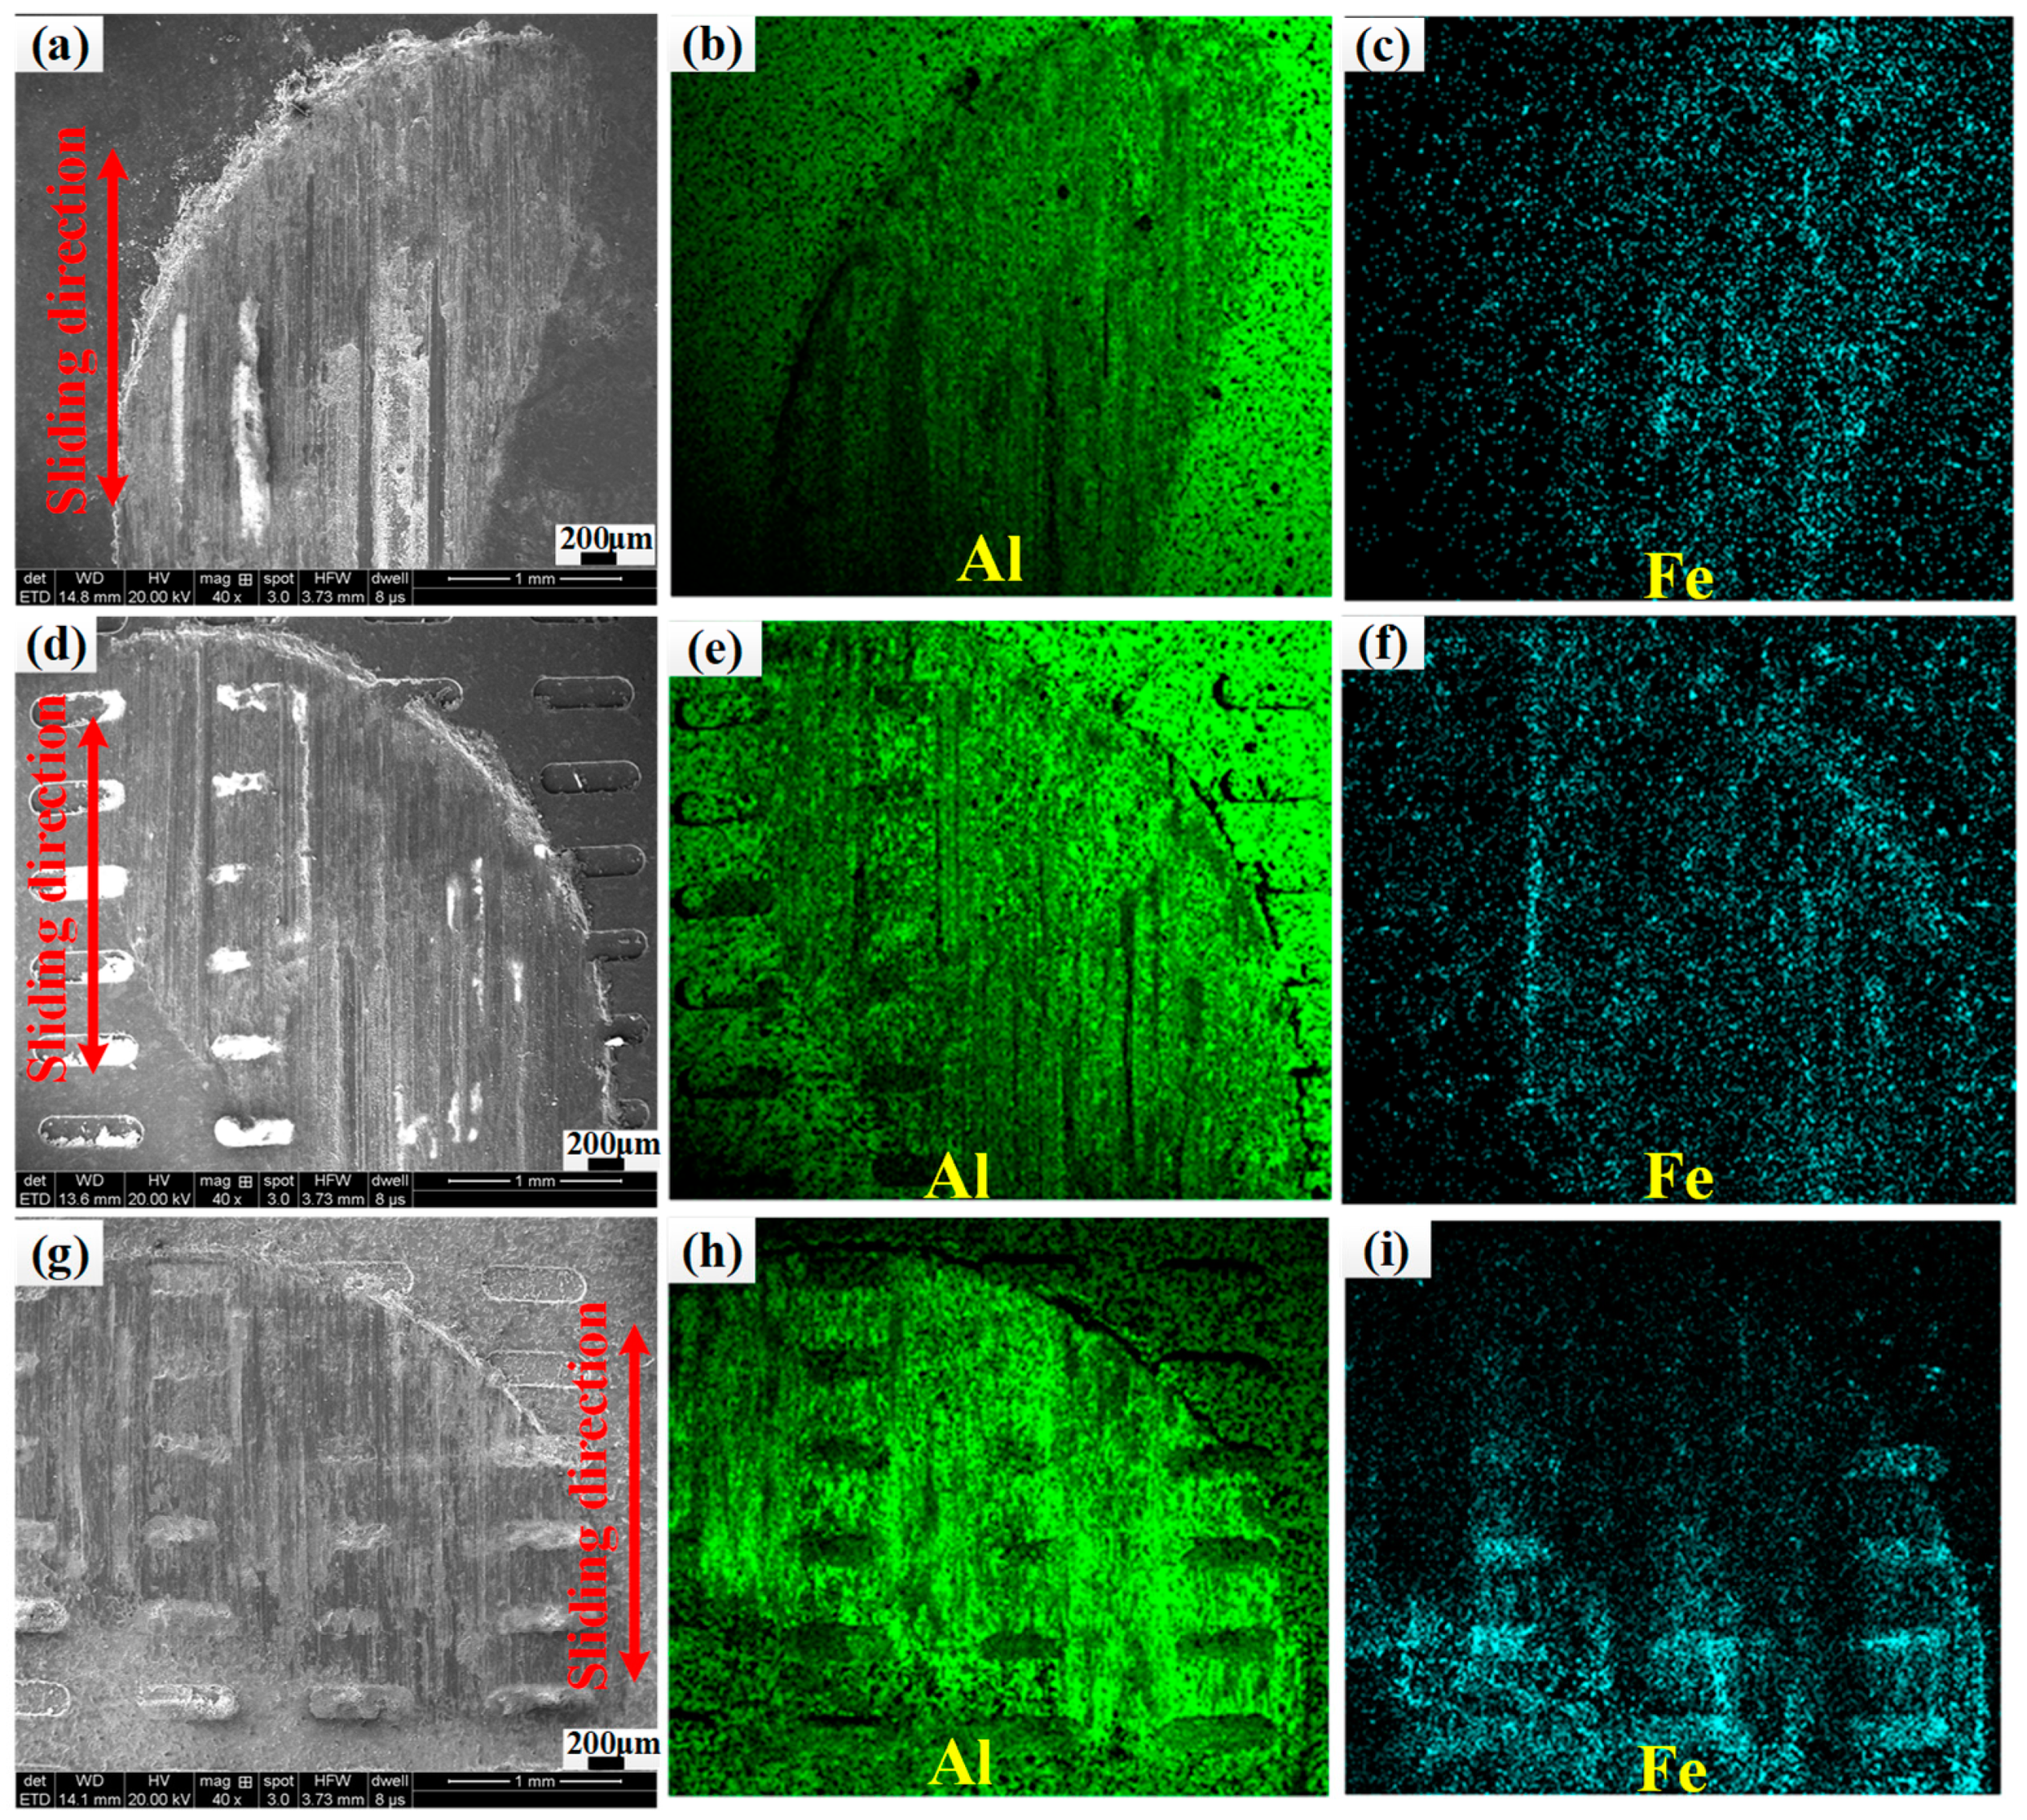
SEM images and the EDS element mapping of worn surfaces (Figure 9) are given to elucidate the element transformation between the two contact surfaces under dry friction conditions. The arrows indicate the sliding direction of the plate relative to the pin. The lime and dark-cyan phases indicate Fe and Al elements, respectively. Noticeable transfer of Fe elements from nodular cast iron samples onto the disc is observed on the anodizing micro-textured samples, which is consistent with the reason why the friction coefficient of anodizing micro-textured samples exhibit high oscillations.
3.5.2. Influence of Bearing Area Ratio Curve and Relevant Roughness Parameters (Sa, Sq, Spk, Svk, Sk, Smr1, Smr2) under Oil-Lubricated Conditions
The three contributions to the friction coefficient are surface roughness, superficial hardness, and lubricant property under oil-lubricated conditions. As concluded in reference [31], the friction coefficient is lower when roughness is low for the lubricated test. Under oil-lubricated conditions, the large surface roughness increases the friction coefficient of micro-textured specimens after anodizing, even the high superficial hardness of alumina films. The large surface roughness presents a negative effect to form oil film to reduce the friction under oil-lubricated conditions.
Under boundary lubrication, the overall friction arises from the metallic contact as well as the shear in the film. The friction coefficient is
where α is the fractional film defect, which is defined as the fraction of real area that is metallic, fm is the friction coefficient for metallic junctions, and fl is the friction coefficient for boundary lubrication.
Under the large normal load and the same sliding speed conditions, the average friction coefficients are several times lower than those of dry friction due to the presence of the lubricant film that bears most of the load. Comparing the surface roughness parameters with the friction coefficient, it can be observed that the lubricated friction coefficient generally increases with the Sa and Sq values, which is the opposite of the case for dry sliding. Moreover, the lubricated sliding distances to steady-state conditions are, in principle, longer for rougher surfaces.
Under oil-lubricated conditions, friction coefficient has a negative correlation with the bearing area ratio curves and its relative parameters. The Spk, Smr1, and Sk values of flat and micro-textured sample are smaller than those of anodizing micro-textured specimens, which results in shorter sliding distance to steady-state friction conditions. Consequently, for lubricated friction, the smaller the Spk, Smr1, and Sk values are, the shorter the running time to steady-state friction conditions.
The macro slope K of the material ratio curve increases with Sa and Sq, as illustrated in Figure 6. The material ratio curve becomes much steeper for larger values of K, Spk, Sk, and Svk, which results in a smaller ratio of real contact area to nominal contact area and a larger average distance between the surfaces. Small ratio of real contact area to nominal contact area is beneficial to reduce friction coefficient under dry sliding conditions. However, the increasing large average distance is harmful to reduce the the friction under oil-lubricated conditions due to the decreasing film thickness ratio hmin/σ. The small film thickness ratio will decrease the lubricated film bearing capacity, increase the load ratio of the interference region, and ultimately result in exacerbated wear and an increased friction coefficient [38,39,40]. The K, Spk, Sk, and Svk values of anodizing micro-textured specimens are larger than those of flat and micro-textured samples, which causes its mean friction coefficient to become the largest due to the lowest bearing capacity of lubricating film. Consequently, for lubricated friction, the larger the Spk, Smr1, and Sk values are, the higher the average friction coefficient is.
4. Conclusions
In this study, the effects of surface roughness on the friction property of flat, micro-textured, and anodizing micro-textured samples were investigated under dry sliding and oil-lubricated conditions. The conclusions can be drawn as follows:
- (1)
- The dry friction coefficient has a positive correlation with the bearing area ratio, which decreases with larger surface roughness parameters of K, Spk, Sk, and Svk. The synergy between surface roughness and high superficial hardness of micro-textured samples after anodizing presents a lower friction coefficient than that of flat and merely micro-textured specimens under dry friction.
- (2)
- The large surface roughness parameters of K, Spk, Sk, and Svk present negative effects on forming oil film to reduce the friction under oil-lubricated conditions. The anodizing micro-textured samples present a larger oil-lubricated friction coefficient than the flat and micro-textured specimens.
- (3)
- The running time to steady-state friction conditions tends to become longer with the increase in surface roughness parameters of Spk, Smr1, and Sk under both dry and oil-lubricated sliding conditions.
Author Contributions
Conceptualization, L.C. (Luanxia Chen) and Z.L.; Methodology, L.C. (Luanxia Chen); Software, L.C. (Luanxia Chen); Validation, L.C. (Luanxia Chen), Z.L. and B.W.; Formal Analysis, L.C. (Luanxia Chen); Investigation, L.C. (Luanxia Chen); Resources, L.C. (Luanxia Chen); Data Curation, L.C. (Luanxia Chen); Writing—Original Draft Preparation, L.C. (Luanxia Chen); Writing—Review & Editing, L.C. (Luanxia Chen), Z.L., B.W., Q.S., Y.W., L.C. (Long Chen); Supervision, Z.L.; Project Administration, Z.L., B.W.; Funding Acquisition, Z.L.
Funding
The authors would like to acknowledge the financial support from the National Science Foundation of China (51425503 and 91860207). This research was also supported by grants from Taishan Scholar Foundation (TS20130922) and Collaborative Innovation Center for Shandong’s Main Crop Production Equipment and Mechanization.
Acknowledgments
The authors are grateful to Yukui Cai for English proofreading.
Conflicts of Interest
The authors declare no conflict of interest.
References
- Prashanth, K.G.; Scudino, S.; Klauss, H.J.; Surreddi, K.B.; Löber, L.; Wang, Z.; Chaubey, A.K.; Kühn, U.; Eckert, J. Microstructure and mechanical properties of Al-12Si produced by selective laser melting: Effect of heat treatment. Mater. Sci. Eng. A 2014, 590, 153–160. [Google Scholar] [CrossRef]
- Ma, P.; Prashanth, K.; Scudino, S.; Jia, Y.; Wang, H.; Zou, C.; Wei, Z.; Eckert, J. Influence of annealing on mechanical properties of Al-20Si processed by selective laser melting. Metals 2014, 4, 28–36. [Google Scholar] [CrossRef]
- Prashanth, K.G.; Debalina, B.; Wang, Z.; Gostin, P.F.; Gebert, A.; Calin, M.; Kühn, U.; Kamaraj, M.; Scudino, S.; Eckert, J. Tribological and corrosion properties of Al-12Si produced by selective laser melting. J. Mater. Res. 2014, 29, 2044–2054. [Google Scholar] [CrossRef]
- Rohatgi, P.K.; Tabandeh-Khorshid, M.; Omrani, E.; Lovell, M.R.; Menezes, P.L. Tribology of metal matrix composites. In Tribology for Scientists and Engineers; Springer: New York, NY, USA, 2013; pp. 233–268. [Google Scholar]
- Shanmughasundaram, P.; Subramanian, R. Wear behavior of eutectic Al-Si alloy-graphite composites fabricated by combined modified two-stage stir casting and squeeze casting methods. Adv. Mater. Sci. Eng. 2013, 2013, 216536. [Google Scholar] [CrossRef]
- Chen, M.; Perry, T.; Alpas, A.T. Ultra-mild wear in eutectic Al-Si alloys. Wear 2007, 263, 552–561. [Google Scholar] [CrossRef]
- Vencl, A.; Bobić, I.; Mišković, Z. Effect of thixocasting and heat treatment on the tribological properties of hypoeutectic Al-Si alloy. Wear 2008, 264, 616–623. [Google Scholar] [CrossRef]
- Chen, L.; Liu, Z.; Li, Y.; Shi, Z. Effects of micro-milled malposed dimple structures on frictional behavior of Al-Si alloy under droplet lubricant condition. Int. J. Adv. Manuf. Tech. 2017, 98, 143–150. [Google Scholar] [CrossRef]
- Zhang, D.; Dong, G.; Chen, Y.; Zeng, Q. Electrophoretic deposition of PTFE particles on porous anodic aluminum oxide film and its tribological properties. Appl. Surf. Sci. 2014, 290, 466–474. [Google Scholar] [CrossRef]
- Escobar, J.; Arurault, L.; Turq, V. Improvement of the tribological behavior of PTFE-anodic film composites prepared on 1050 aluminum substrate. Appl. Surf. Sci. 2012, 258, 8199–8208. [Google Scholar] [CrossRef] [Green Version]
- Sagbas, B.; Durakbasa, M.N. Effect of surface patterning on frictional heating of vitamin E blended UHMWPE. Wear 2013, 303, 313–320. [Google Scholar] [CrossRef]
- Sun, Q.; Hu, T.; Fan, H.; Zhang, Y.; Hu, L. Dry sliding wear behavior of TC11 alloy at 500 °C: Influence of laser surface texturing. Tribol. Int. 2015, 92, 136–145. [Google Scholar] [CrossRef]
- Amanov, A.; Sasaki, S. A study on the tribological characteristics of duplex-treated Ti-6Al-4V alloy under oil-lubricated sliding conditions. Tribol. Int. 2013, 64, 155–163. [Google Scholar] [CrossRef]
- Yamakiri, H.; Sasaki, S.; Kurita, T.; Kasashima, N. Effects of laser surface texturing on friction behavior of silicon nitride under lubrication with water. Tribol. Int. 2011, 44, 579–584. [Google Scholar] [CrossRef]
- Rapoport, L.; Moshkovich, A.; Perfilyev, V.; Lapsker, I.; Halperin, G.; Itovich, Y.; Etsion, I. Friction and wear of MoS2 films on laser textured steel surfaces. Surf. Coat. Technol. 2008, 202, 3332–3340. [Google Scholar] [CrossRef]
- Andersson, P.; Koskinen, J.; Varjus, S.E.; Gerbig, Y.; Haefke, H.; Georgiou, S.; Buss, W. Microlubrication effect by laser-textured steel surfaces. Wear 2007, 262, 369–379. [Google Scholar] [CrossRef]
- Borghi, A.; Gualtieri, E.; Marchetto, D.; Moretti, L.; Valeri, S. Tribological effects of surface texturing on nitriding steel for high-performance engine applications. Wear 2008, 265, 1046–1051. [Google Scholar] [CrossRef]
- Gao, L.; Yang, P.; Dymond, I.; Fisher, J.; Jin, Z. Effect of surface texturing on the elastohydrodynamic lubrication analysis of metal-on-metal hip implants. Tribol. Int. 2010, 43, 1851–1860. [Google Scholar] [CrossRef]
- Gherca, A.; Fatu, A.; Hajjam, M.; Maspeyrot, P. Influence of surface texturing on the hydrodynamic performance of a thrust bearing operating in steady-state and transient lubrication regime. Tribol. Int. 2016, 102, 305–318. [Google Scholar] [CrossRef]
- Houdková, Š.; Šperka, P.; Repka, M.; Martan, J.; Moskal, D. Shifted laser surface texturing for bearings applications. J. Phys. Conf. Ser. 2017, 843, 012076. [Google Scholar] [CrossRef] [Green Version]
- Tillmann, W.; Hagen, L.; Stangier, D.; Laemmerhirt, I.A.; Biermann, D.; Kersting, P.; Krebs, E. Wear behavior of bio-inspired and technologically structured HVOF sprayed NiCrBSiFe coatings. Surf. Coat. Technol. 2015, 280, 16–26. [Google Scholar] [CrossRef]
- Liu, D.; Zhang, Q.; Qin, Z.; Luo, Q.; Wu, Z.; Liu, L. Tribological performance of surfaces enhanced by texturing and nitrogen implantation. Appl. Surf. Sci. 2016, 363, 161–167. [Google Scholar] [CrossRef]
- Mohammadi, I.; Afshar, A.; Ahmadi, S. Al2O3/Si3N4 nanocomposite coating on aluminum alloy by the anodizing route: Fabrication, characterization, mechanical properties and electrochemical behavior. Ceram. Int. 2016, 42, 12105–12114. [Google Scholar] [CrossRef]
- Qin, Y.; Xiong, D.; Li, J.; Jin, Q.; He, Y.; Zhang, R.; Zou, Y. Adaptive-lubricating PEO/Ag/MoS2 multilayered coatings for Ti6Al4V alloy at elevated temperature. Mater. Des. 2016, 107, 311–321. [Google Scholar] [CrossRef]
- Chen, L.; Liu, Z.; Shen, Q. Enhancing tribological performance by anodizing micro-textured surfaces with nano-MoS2 coatings prepared on aluminum-silicon alloys. Tribol. Int. 2018, 122, 84–95. [Google Scholar] [CrossRef]
- Alpay, N.; Benehkohal, N.P.; Côté, M.P.; Demopoulos, G.P.; Brochu, M. Anodized aluminum–silicon alloy counter electrode substrates for next generation solar cell applications. Appl. Surf. Sci. 2015, 356, 317–324. [Google Scholar] [CrossRef]
- Herrera-Hernandez, H.; Vargas-Garcia, J.R.; Hallen-Lopez, J.M.; Mansfeld, F. Evaluation of different sealing methods for anodized aluminum-silicon carbide (Al/SiC) composites using EIS and SEM techniques. Mater. Corros. 2007, 58, 825–832. [Google Scholar] [CrossRef]
- Picas, J.A.; Forn, A.; Rupérez, E.; Baile, M.T.; Martín, E. Hard anodizing of aluminium matrix composite A6061/(Al2O3) p for wear and corrosion resistance improvement. Plasma Process. Polym. 2007, 4, S579–S583. [Google Scholar] [CrossRef]
- Wang, H.; Yi, H.; Wang, H. Analysis and self-lubricating treatment of porous anodic alumina film formed in a compound solution. Appl. Surf. Sci. 2005, 252, 1662–1667. [Google Scholar] [CrossRef]
- Bowden, F.P.; Tabor, D. The Friction and Lubrication of Solids, 2nd ed.; Springer and Qarendon Press: Oxford, UK, 1954. [Google Scholar]
- Gao, J.; Luedtke, W.D.; Gourdon, D.; Ruths, M.; Israelachvili, J.N.; Landman, U. Frictional forces and Amontons’ law: From the molecular to the macroscopic scale. J. Phys. Chem. B 2004, 108, 3410–3425. [Google Scholar] [CrossRef]
- Sedlaček, M.; Podgornik, B.; Vižintin, J. Influence of surface preparation on roughness parameters, friction and wear. Wear 2009, 266, 482–487. [Google Scholar] [CrossRef]
- Sedlaček, M.; Podgornik, B.; Vižintin, J. Correlation between standard roughness parameters skewness and kurtosis and tribological behaviour of contact surfaces. Tribol. Int. 2012, 48, 102–112. [Google Scholar] [CrossRef]
- Zhu, S.; Huang, P. Influence mechanism of morphological parameters on tribological behaviors based on bearing ratio curve. Tribol. Int. 2017, 109, 10–18. [Google Scholar] [CrossRef]
- Kou, Z.; Wan, Y.; Cai, Y.; Liang, X.; Liu, Z. Burr controlling in micro milling with supporting material method. Procedia Manuf. 2015, 1, 501–511. [Google Scholar] [CrossRef]
- Zhang, J.S.; Zhao, X.H.; Zuo, Y.; Xiong, J.P. The bonding strength and corrosion resistance of aluminum alloy by anodizing treatment in a phosphoric acid modified boric acid/sulfuric acid bath. Surf. Coat. Technol. 2008, 202, 3149–3156. [Google Scholar] [CrossRef]
- Menezes, P.L.; Kailas, S.V. Influence of surface texture and roughness parameters on friction and transfer layer formation during sliding of aluminium pin on steel plate. Wear 2009, 267, 1534–1549. [Google Scholar] [CrossRef]
- Wang, W.Z.; Chen, H.; Hu, Y.Z.; Wang, H. Effect of surface roughness parameters on mixed lubrication characteristics. Tribol. Int. 2006, 39, 522–527. [Google Scholar] [CrossRef]
- Wand, S.; Wang, W.Z.; Hu, Y.Z.; Wang, H. Prediction of Sliding Friction Force of Rough Surfaces in Lubricated Point Contacts. Tribology 2007, 27, 152–155. [Google Scholar]
- Bhushan, B. Contact mechanics of rough surfaces in tribology: Multiple asperity contact. Tribol. Lett. 1998, 4, 1–35. [Google Scholar] [CrossRef]
Figure 1.
Framework structure of this study.

Figure 2.
SEM and enlarged morphology of (a,b) flat; (c,d) micro-textured; (e,f) anodizing micro-textured specimens.
Figure 2.
SEM and enlarged morphology of (a,b) flat; (c,d) micro-textured; (e,f) anodizing micro-textured specimens.

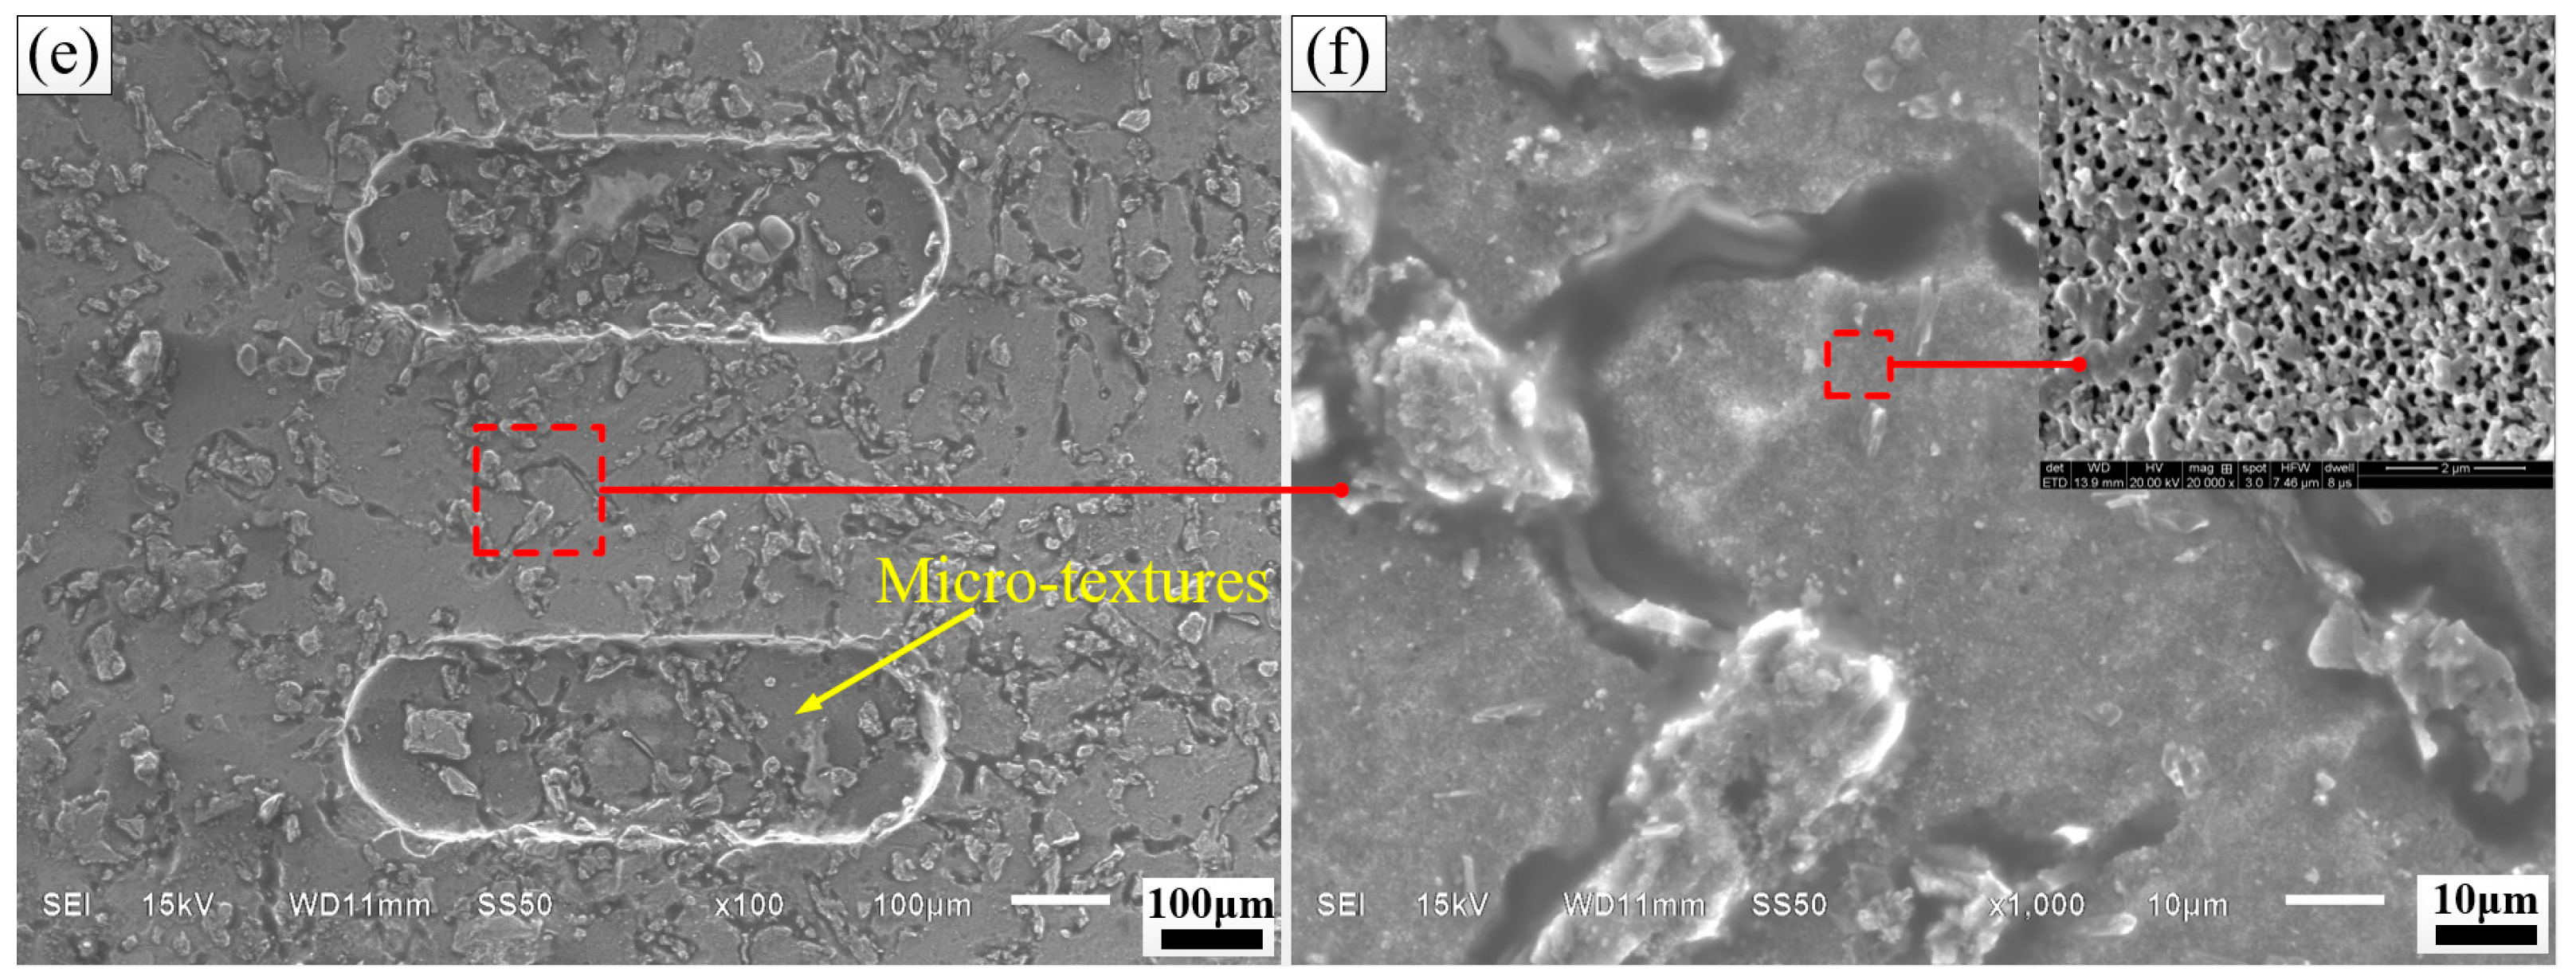
Figure 3.
Cross-sectional SEM morphology of anodized (a) ZL109; and corresponding EDS line scan of (b) Al; (c) O element.
Figure 3.
Cross-sectional SEM morphology of anodized (a) ZL109; and corresponding EDS line scan of (b) Al; (c) O element.

Figure 4.
XRD for ZL109 (a) before; (b) after anodizing.
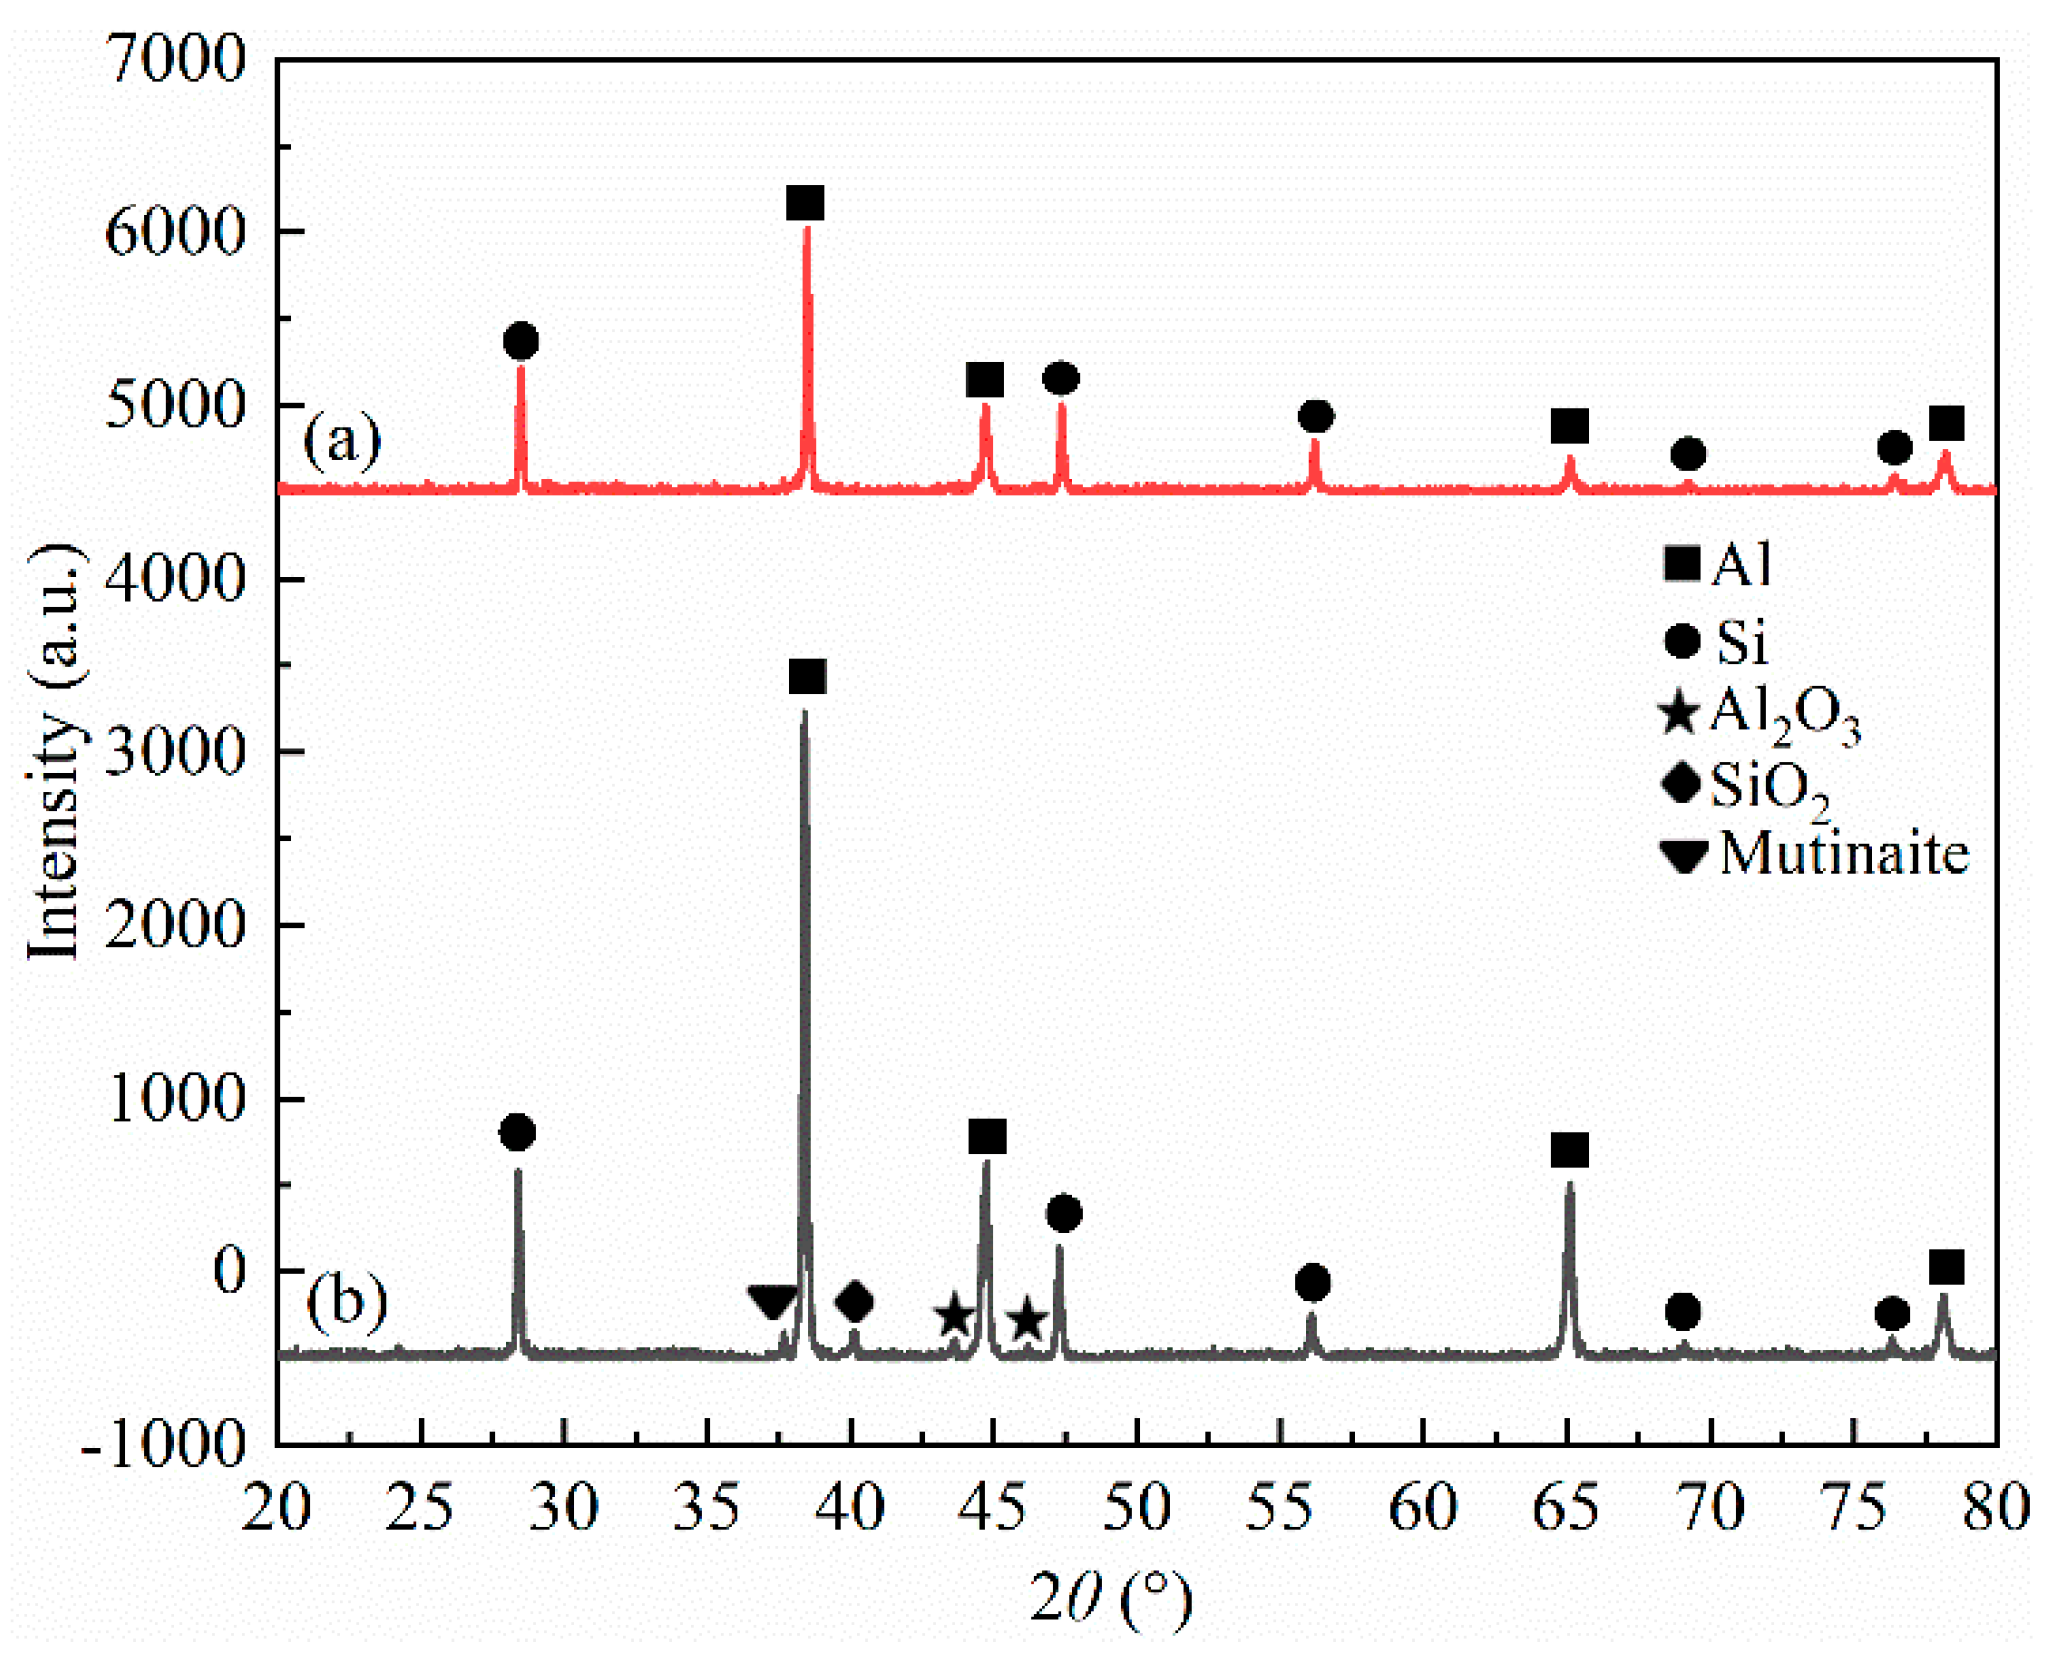
Figure 5.
Cross-sectional view of a single micro-texture before and after anodizing.

Figure 6.
Bearing area curves of (a) flat; (b) micro-textured; (c) anodizing micro-textured samples.
Figure 6.
Bearing area curves of (a) flat; (b) micro-textured; (c) anodizing micro-textured samples.
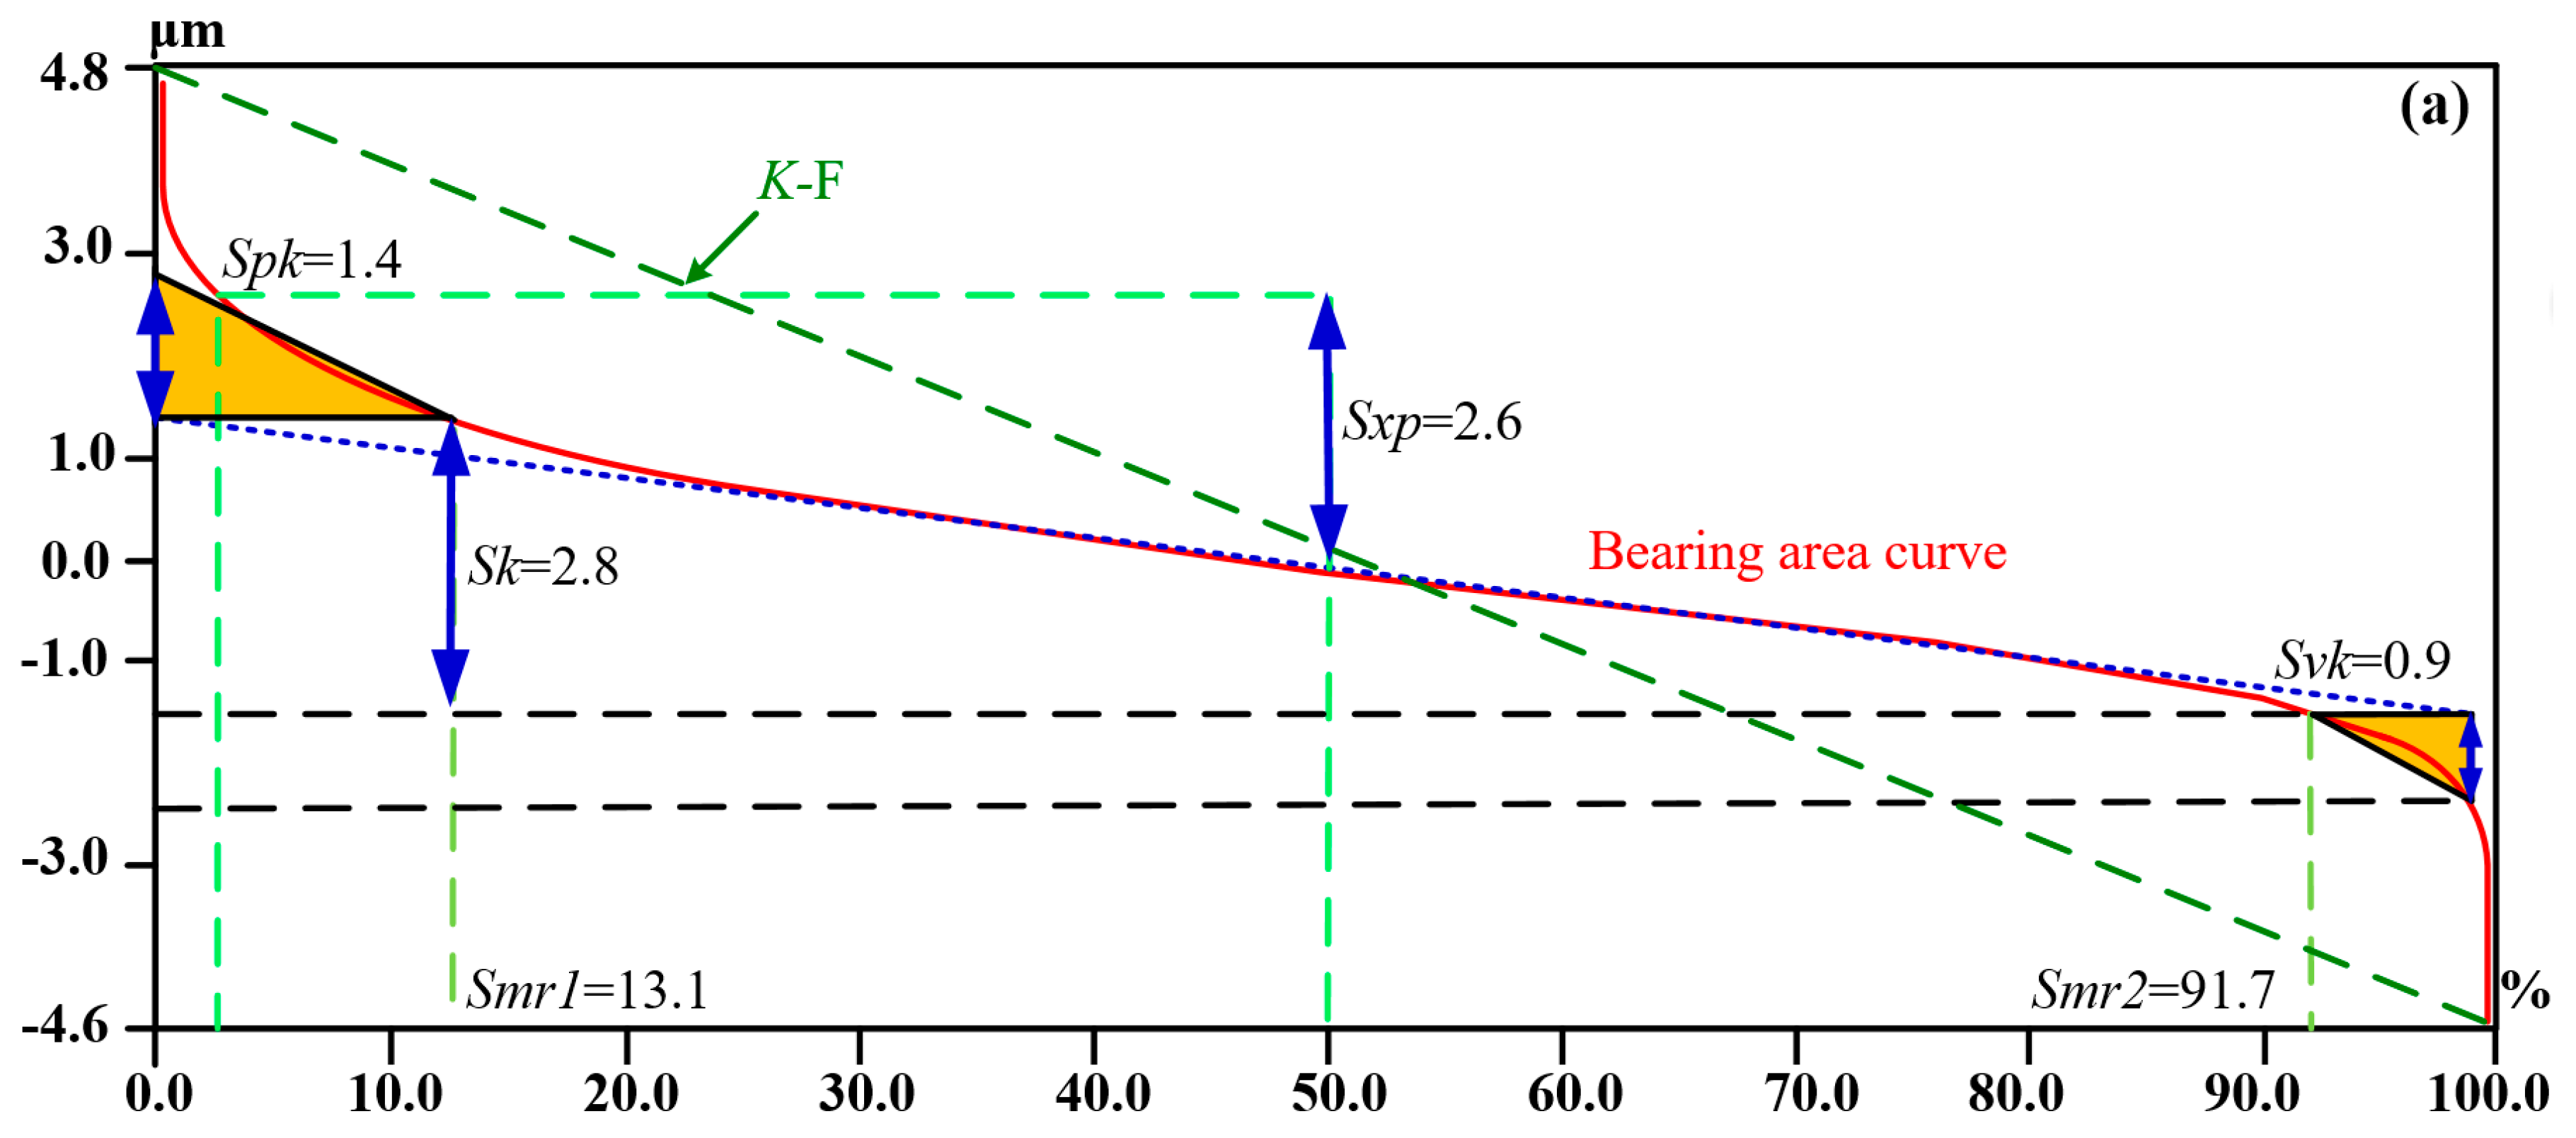

Figure 7.
Load-unload curves dependence on the indentation depth for (a) ZL109; (b) nodular cast iron; and (c) aluminum oxide; (d) nanoindentation hardness.
Figure 7.
Load-unload curves dependence on the indentation depth for (a) ZL109; (b) nodular cast iron; and (c) aluminum oxide; (d) nanoindentation hardness.

Figure 8.
Frictional coefficients varying with running time under (a) dry sliding; (b) oil-lubricated conditions.
Figure 8.
Frictional coefficients varying with running time under (a) dry sliding; (b) oil-lubricated conditions.

Figure 9.
SEM micrographs of flat, micro-textured, and anodizing micro-textured specimens (a,d,g) and EDS element mapping data of (b,e,h) Al, (c,f,i) Fe.
Figure 9.
SEM micrographs of flat, micro-textured, and anodizing micro-textured specimens (a,d,g) and EDS element mapping data of (b,e,h) Al, (c,f,i) Fe.


Table 1.
Chemical composition of ZL019.
| Element | Si | Fe | Cu | Mg | Ni | Al |
|---|---|---|---|---|---|---|
| Content (%) | 11.1 | 0.77 | 0.45 | 0.51 | 0.31 | Residual |
Table 2.
Cutting parameters of fabricating micro-textures.
| Cutting Amount | Spindle Speed (r/min) | Feed Rate (mm/min) | Axial Depth of Cut (μm) |
|---|---|---|---|
| Parameters | 20,000 | 60 | 10 |
Table 3.
Testing parameters of nanoindentation.
| Testing Materials | Maximum Displacement (nm) | Spacing (μm) |
|---|---|---|
| ZL109 | 400, 800, 1000, 1200 | 20 |
| Nodular cast iron | 200, 400, 1000, 1200 | 20 |
| Aluminum oxide | 120, 140, 200, 220, 240 | 10 |
Table 4.
Surface roughness of test samples.
| Surface Roughness (μm) | F | M | AM |
|---|---|---|---|
| Sa | 0.92 ± 0.05 | 0.89 ± 0.05 | 1.81 ± 0.05 |
| Sq | 1.1 ± 0.1 | 1.1 ± 0.1 | 2.5 ± 0.1 |
| Ssk | 0.38 ± 0.05 | 0.09 ± 0.05 | −0.05 ± 0.05 |
| Sku | 3.2 ± 0.1 | 3.5 ± 0.1 | 6.3 ± 0.1 |
| Sk | 2.8 ± 0.1 | 2.7 ± 0.1 | 4.6 ± 0.1 |
| Spk | 1.4 ± 0.1 | 1.3 ± 0.1 | 3.9 ± 0.1 |
| Svk | 0.9 ± 0.1 | 1.1 ± 0.1 | 3.8 ± 0.1 |
| Sp | 4.8 ± 0.4 | 5.0 ± 0.4 | 14.0 ± 0.4 |
| Smr1 | 13.1 ± 1.5 | 10.6 ± 1.5 | 14.2 ± 1.5 |
| Smr2 | 91.7 ± 1.5 | 89.2 ± 1.5 | 88.3 ± 1.5 |
Table 5.
Nomenclature and definition of bearing area ratio parameters.
| Material Ratio Parameters | Definitions |
|---|---|
| Spk | Average height of the protruding peaks above the roughness core profile |
| Svk | Average depth of the profile valleys projecting through the roughness core profile |
| Sk | Depth of the roughness core profile |
| Sxp | The height difference between the load area ratio of 2.5% and the load area ratio of 50% |
| Smr1 | Level, in percent, determined for the intersection line which separates the protruding peaks from the roughness core profile |
| Smr2 | Level, in percent, determined for the intersection line which separates the deep peaks from the roughness core profile |
© 2019 by the authors. Licensee MDPI, Basel, Switzerland. This article is an open access article distributed under the terms and conditions of the Creative Commons Attribution (CC BY) license (http://creativecommons.org/licenses/by/4.0/).
Share and Cite
MDPI and ACS Style
Chen, L.; Liu, Z.; Wang, B.; Song, Q.; Wan, Y.; Chen, L. Surface Characterization and Tribological Performance of Anodizing Micro-Textured Aluminum-Silicon Alloys. Materials 2019, 12, 1862. https://doi.org/10.3390/ma12111862
AMA Style
Chen L, Liu Z, Wang B, Song Q, Wan Y, Chen L. Surface Characterization and Tribological Performance of Anodizing Micro-Textured Aluminum-Silicon Alloys. Materials. 2019; 12(11):1862. https://doi.org/10.3390/ma12111862
Chicago/Turabian StyleChen, Luanxia, Zhanqiang Liu, Bing Wang, Qinghua Song, Yi Wan, and Long Chen. 2019. "Surface Characterization and Tribological Performance of Anodizing Micro-Textured Aluminum-Silicon Alloys" Materials 12, no. 11: 1862. https://doi.org/10.3390/ma12111862
Note that from the first issue of 2016, this journal uses article numbers instead of page numbers. See further details here.