Mechanical and Fire Properties of Multicomponent Flame Retardant EPDM Rubbers Using Aluminum Trihydroxide, Ammonium Polyphosphate, and Polyaniline


Abstract
:1. Introduction
2. Materials and Methods
2.1. Materials
2.2. Preparation of the EPDM Compounds
3. Characterization
4. Results and Discussion
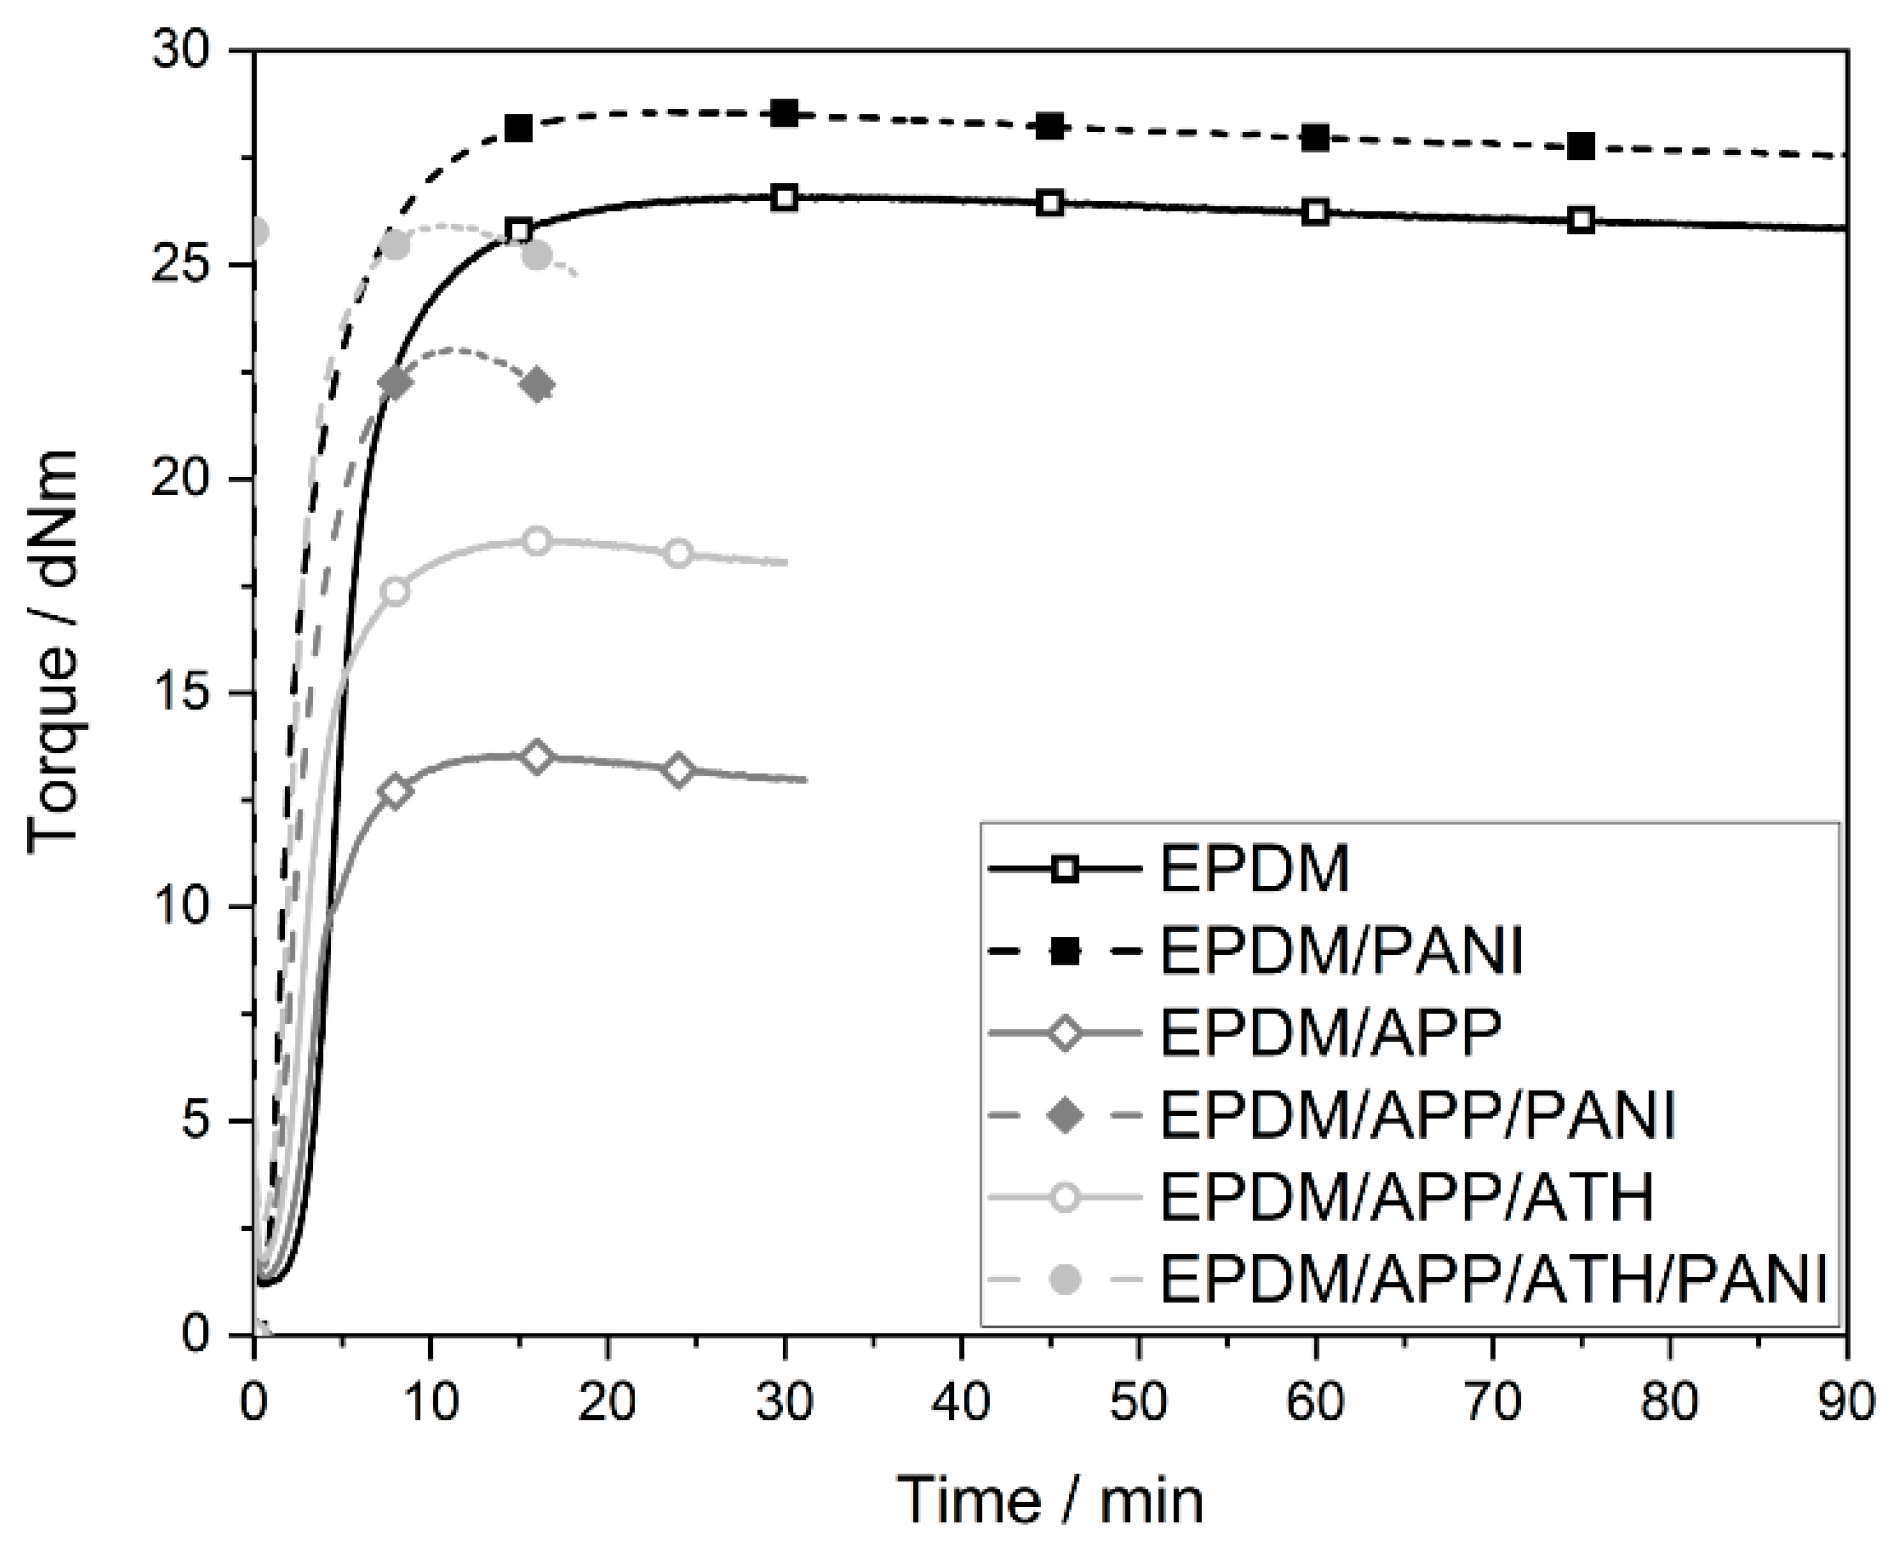
4.1. Curing Properties
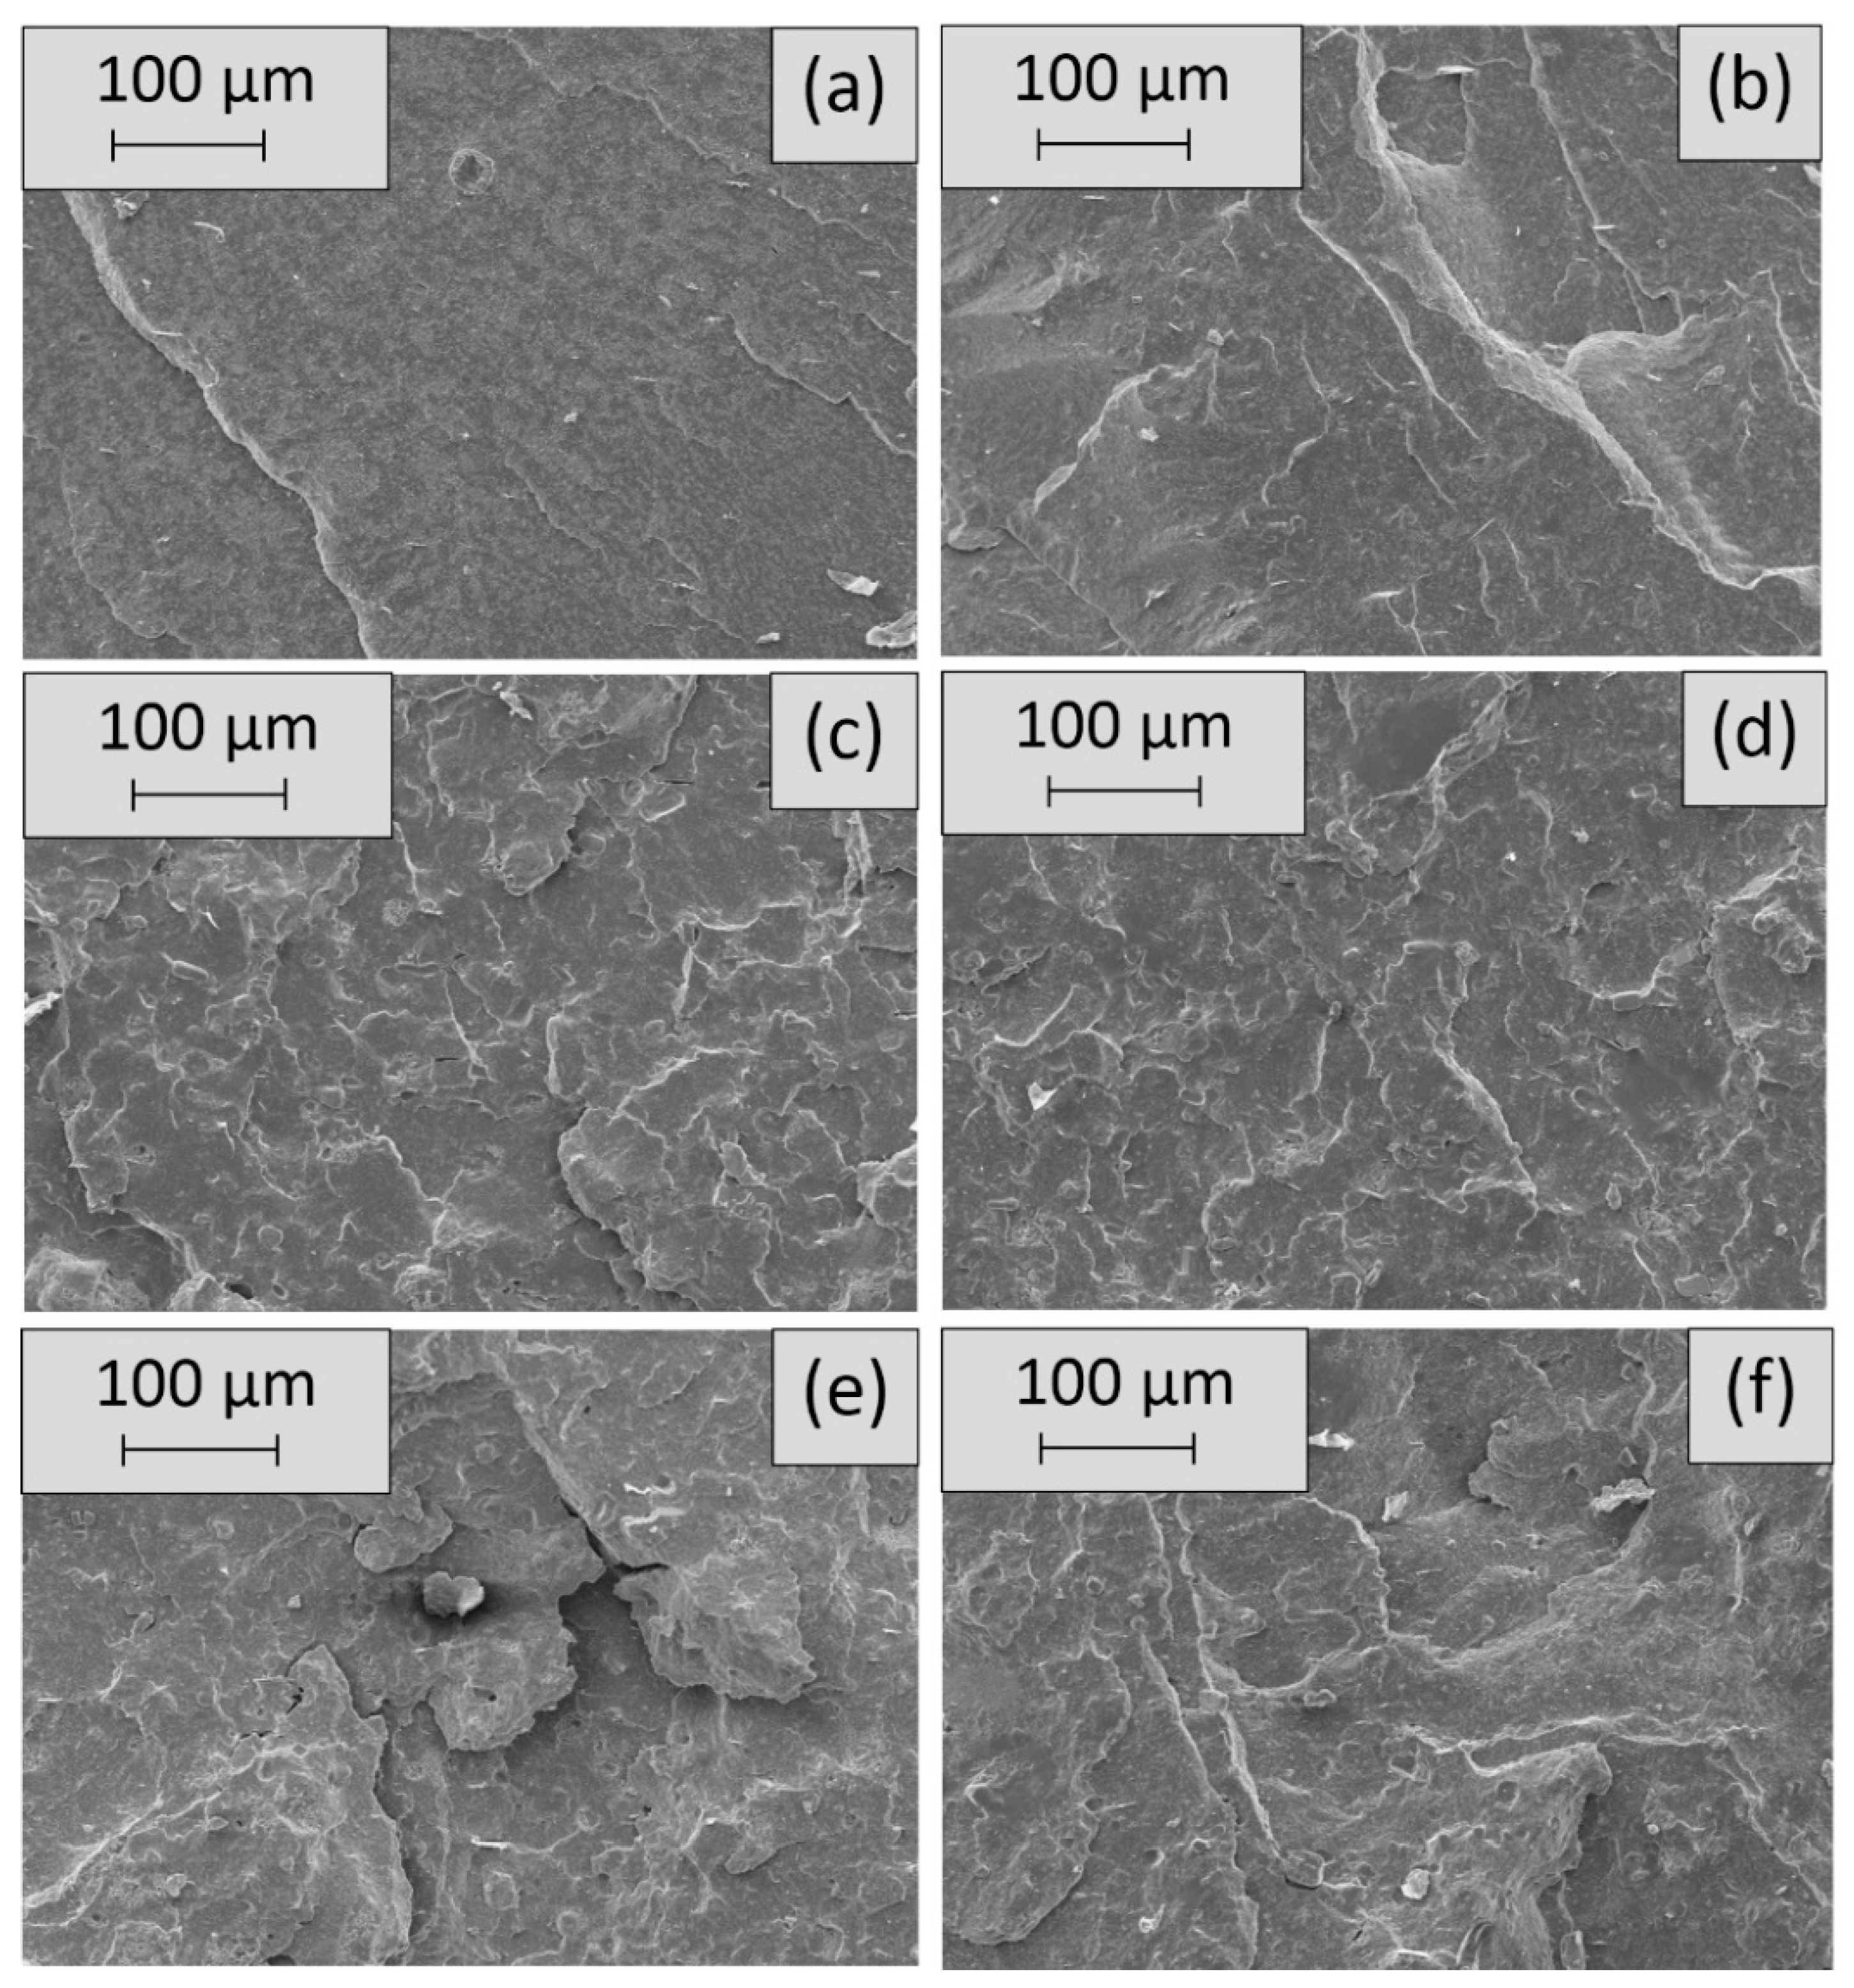
4.2. Scanning Electron Microscopy (SEM)
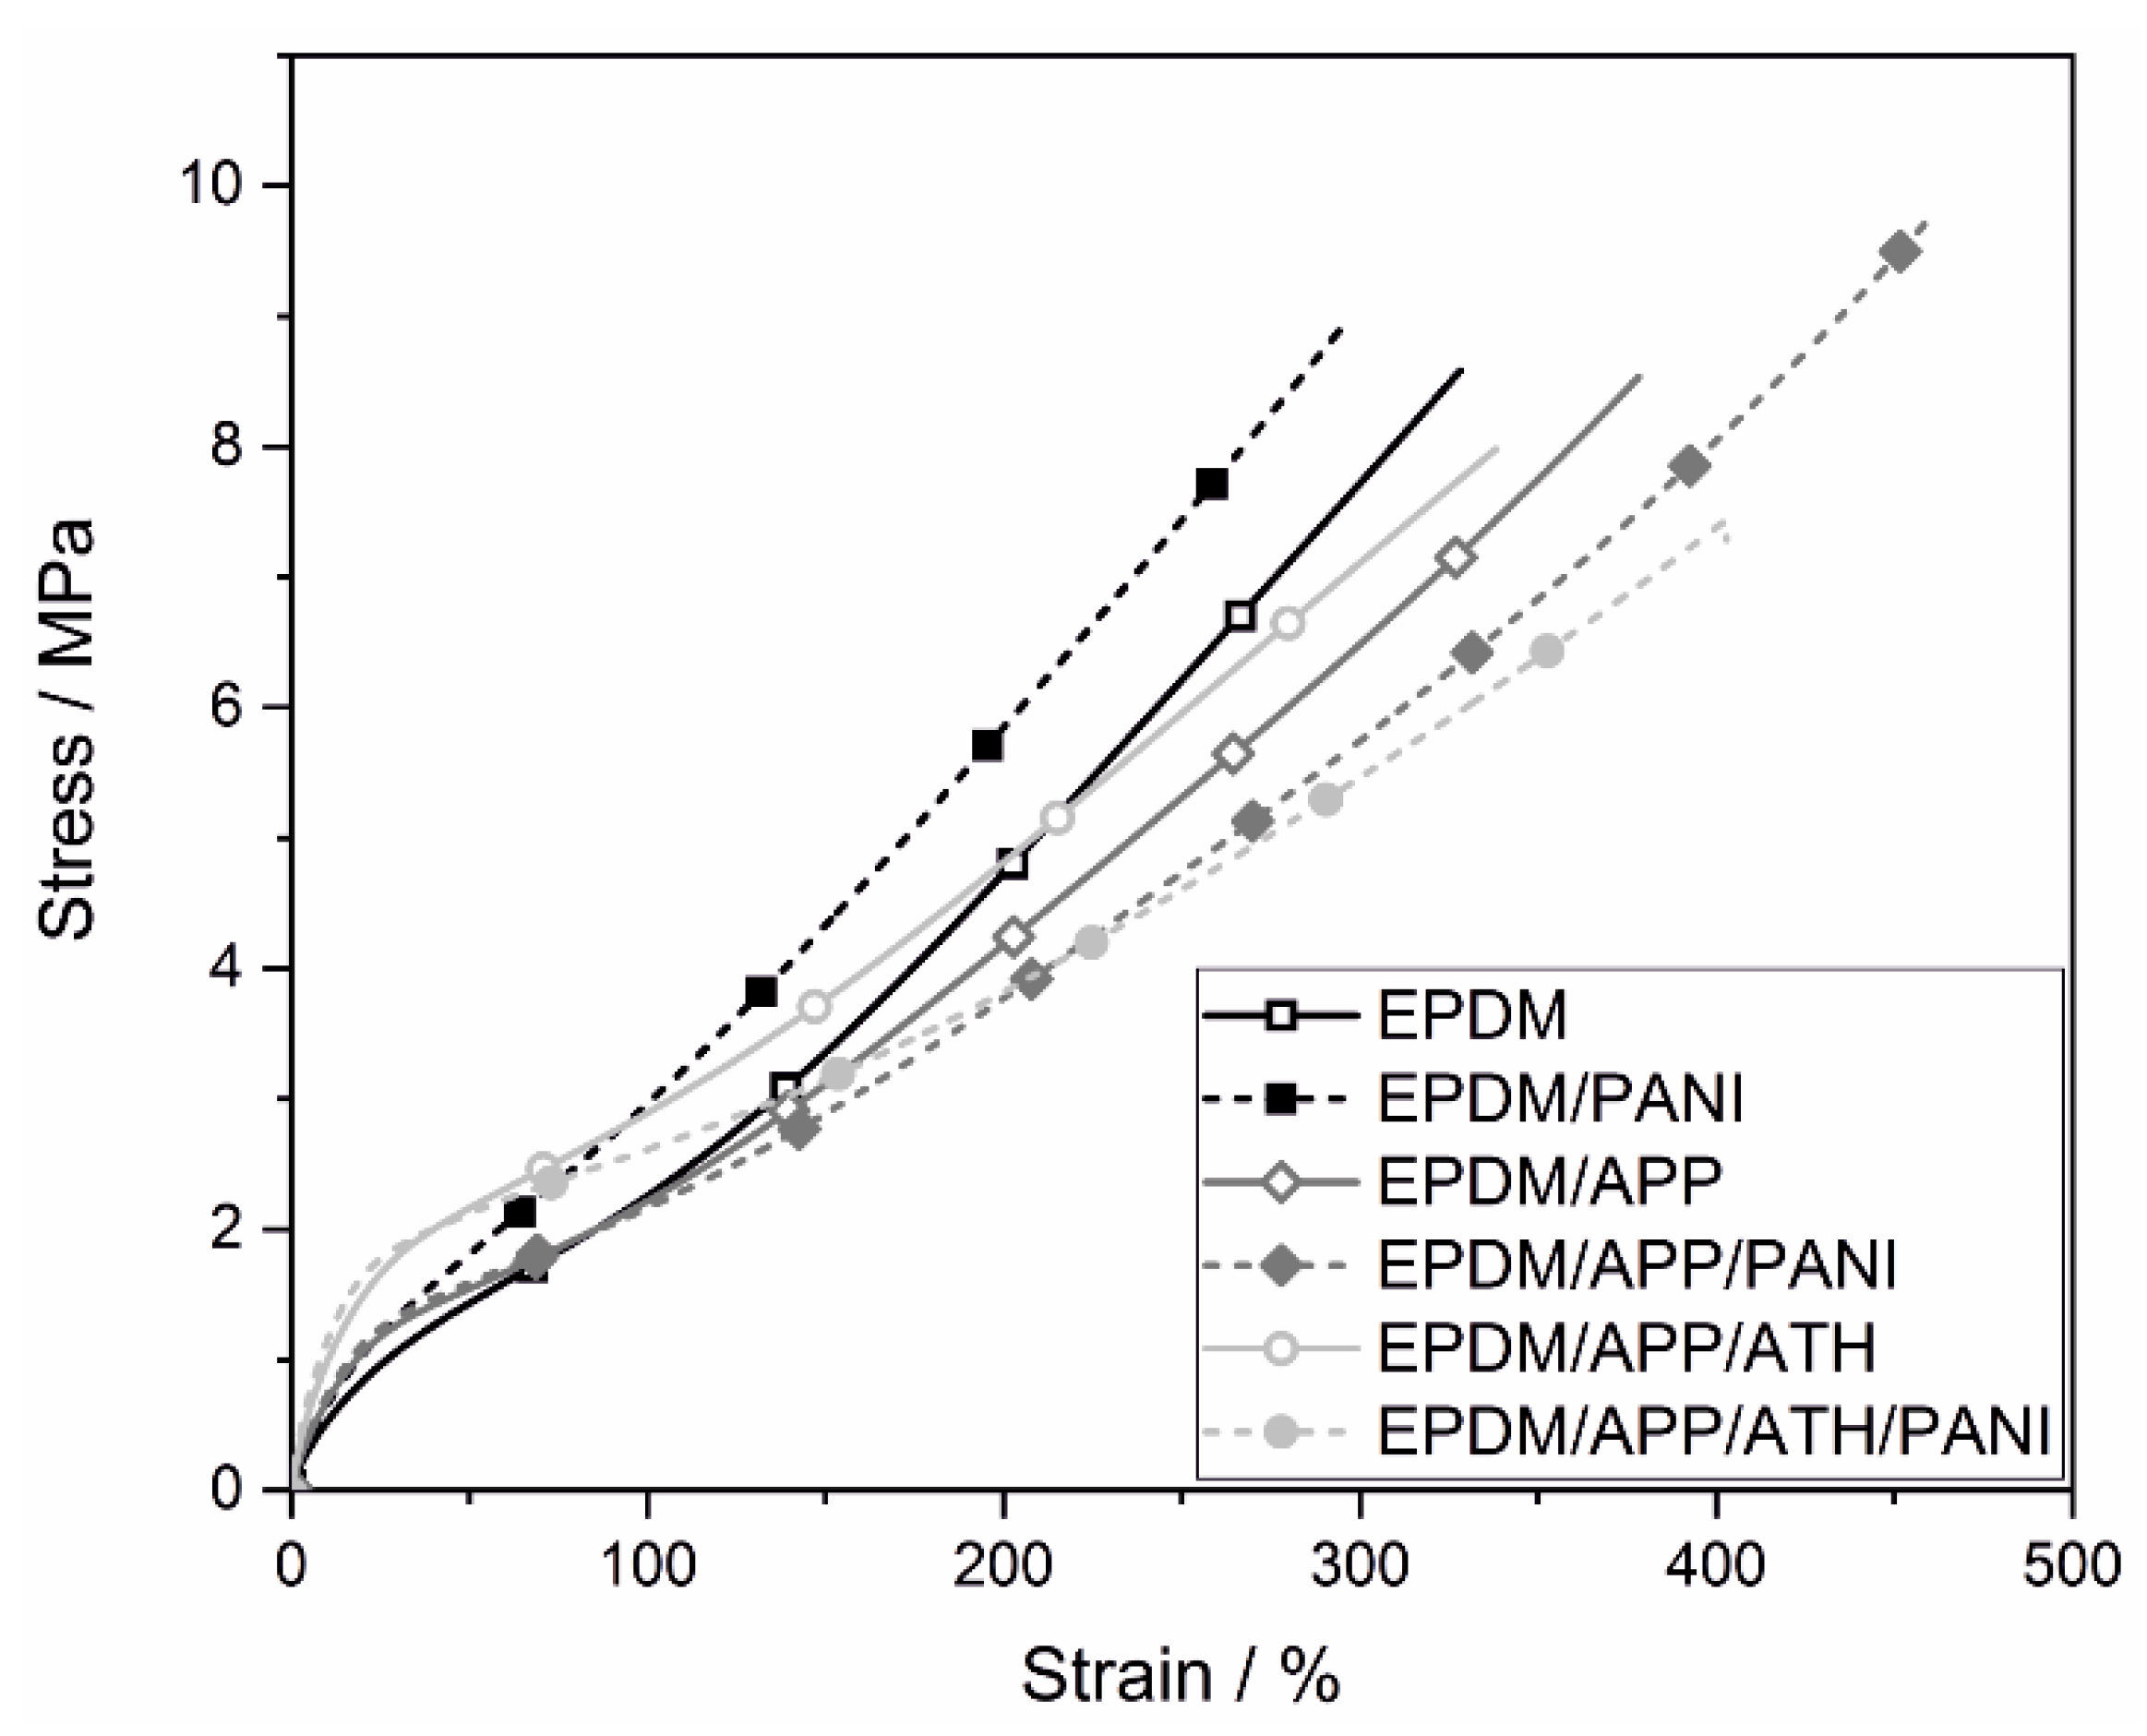
4.3. Mechanical Properties
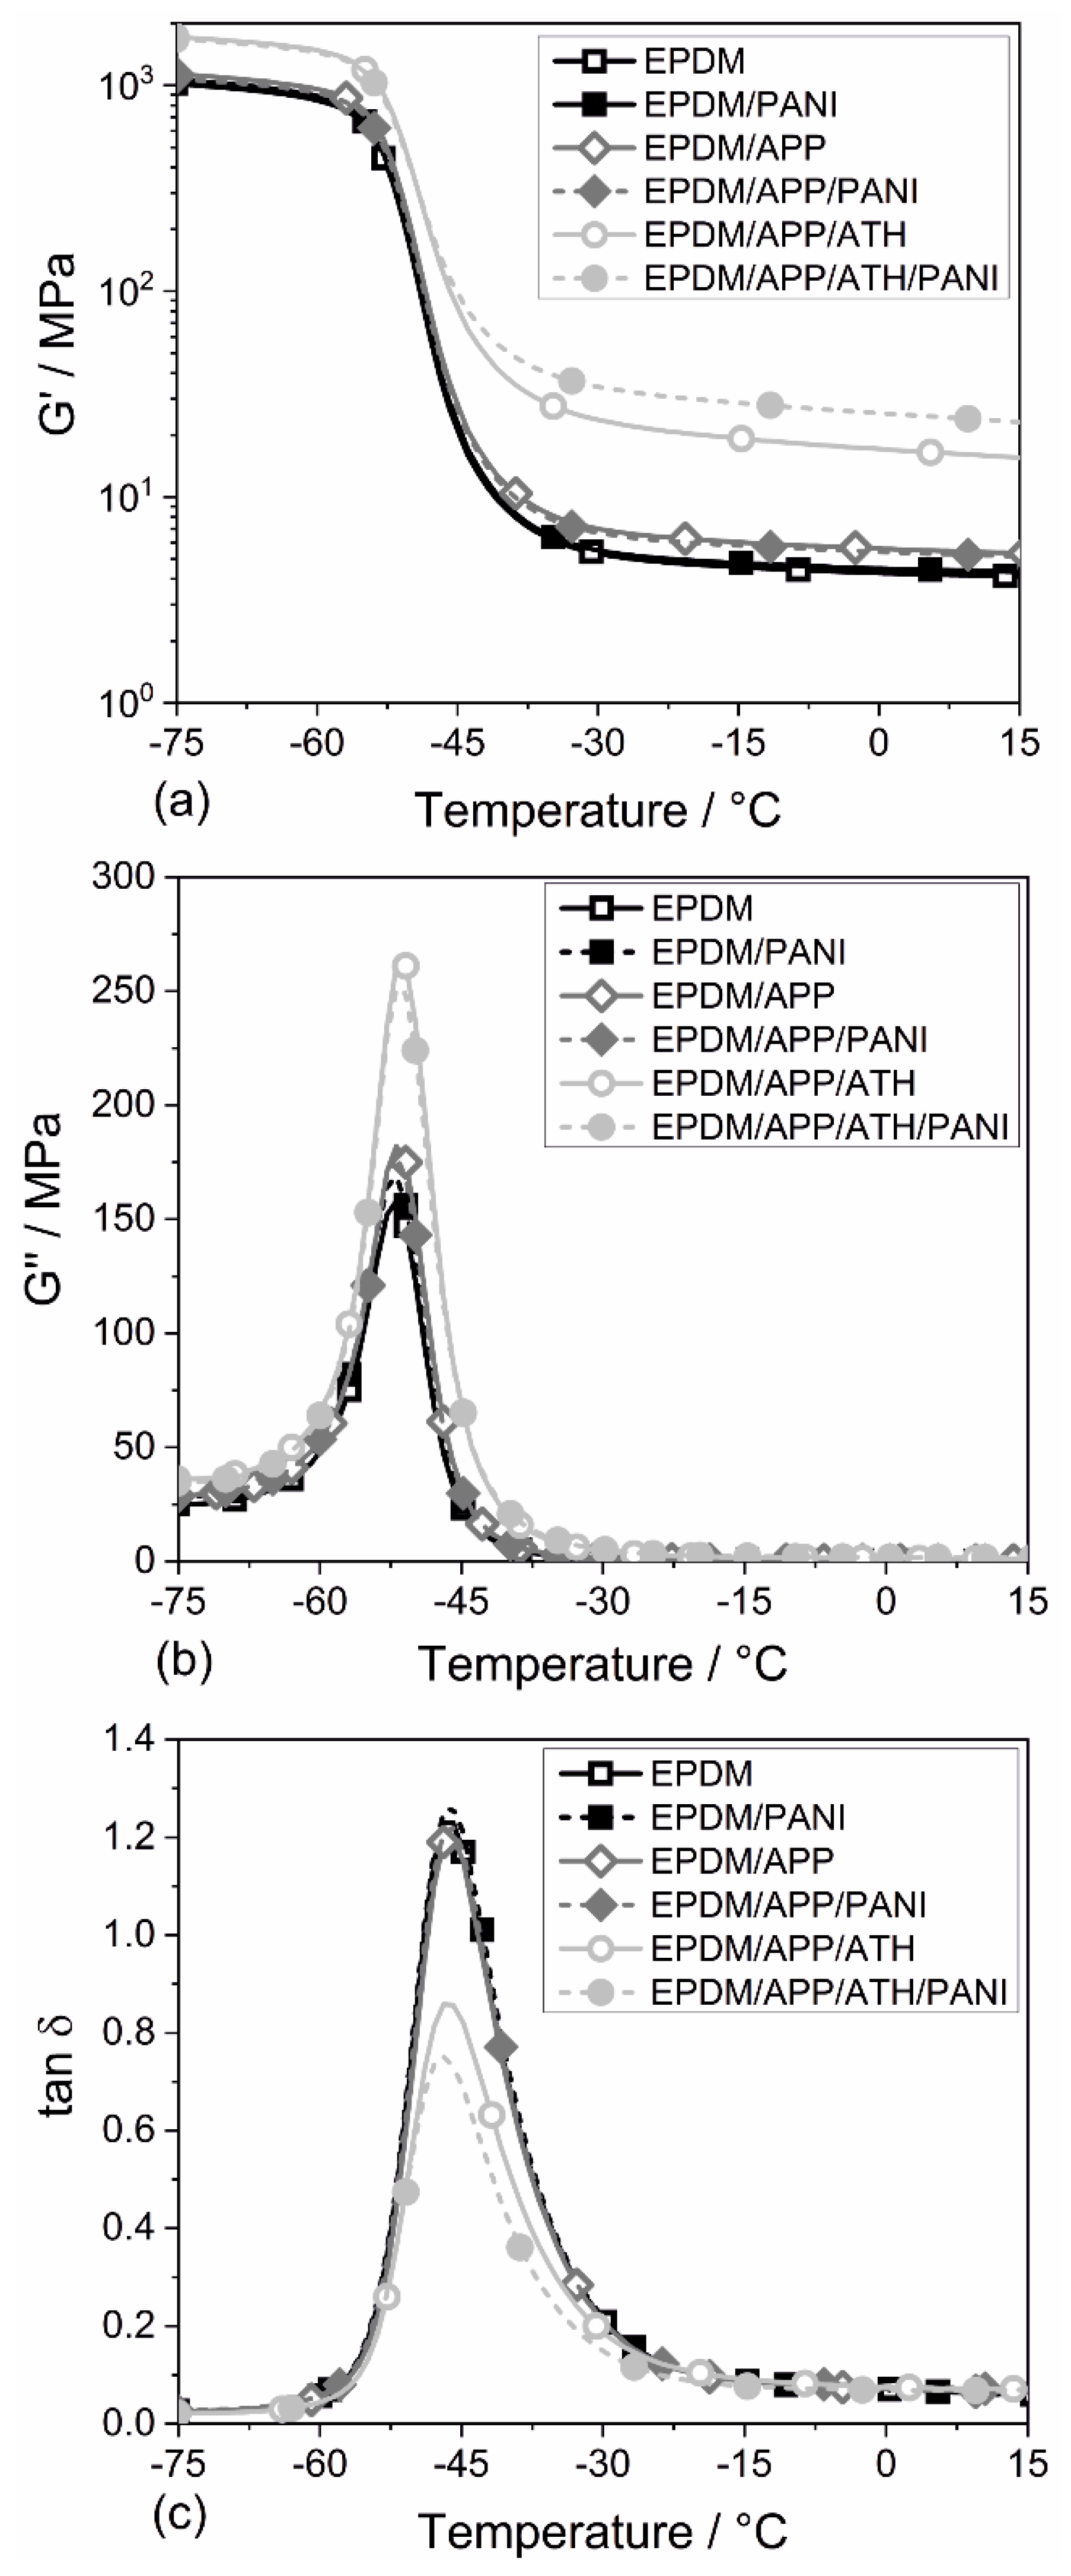
4.4. Dynamic Mechanical Properties
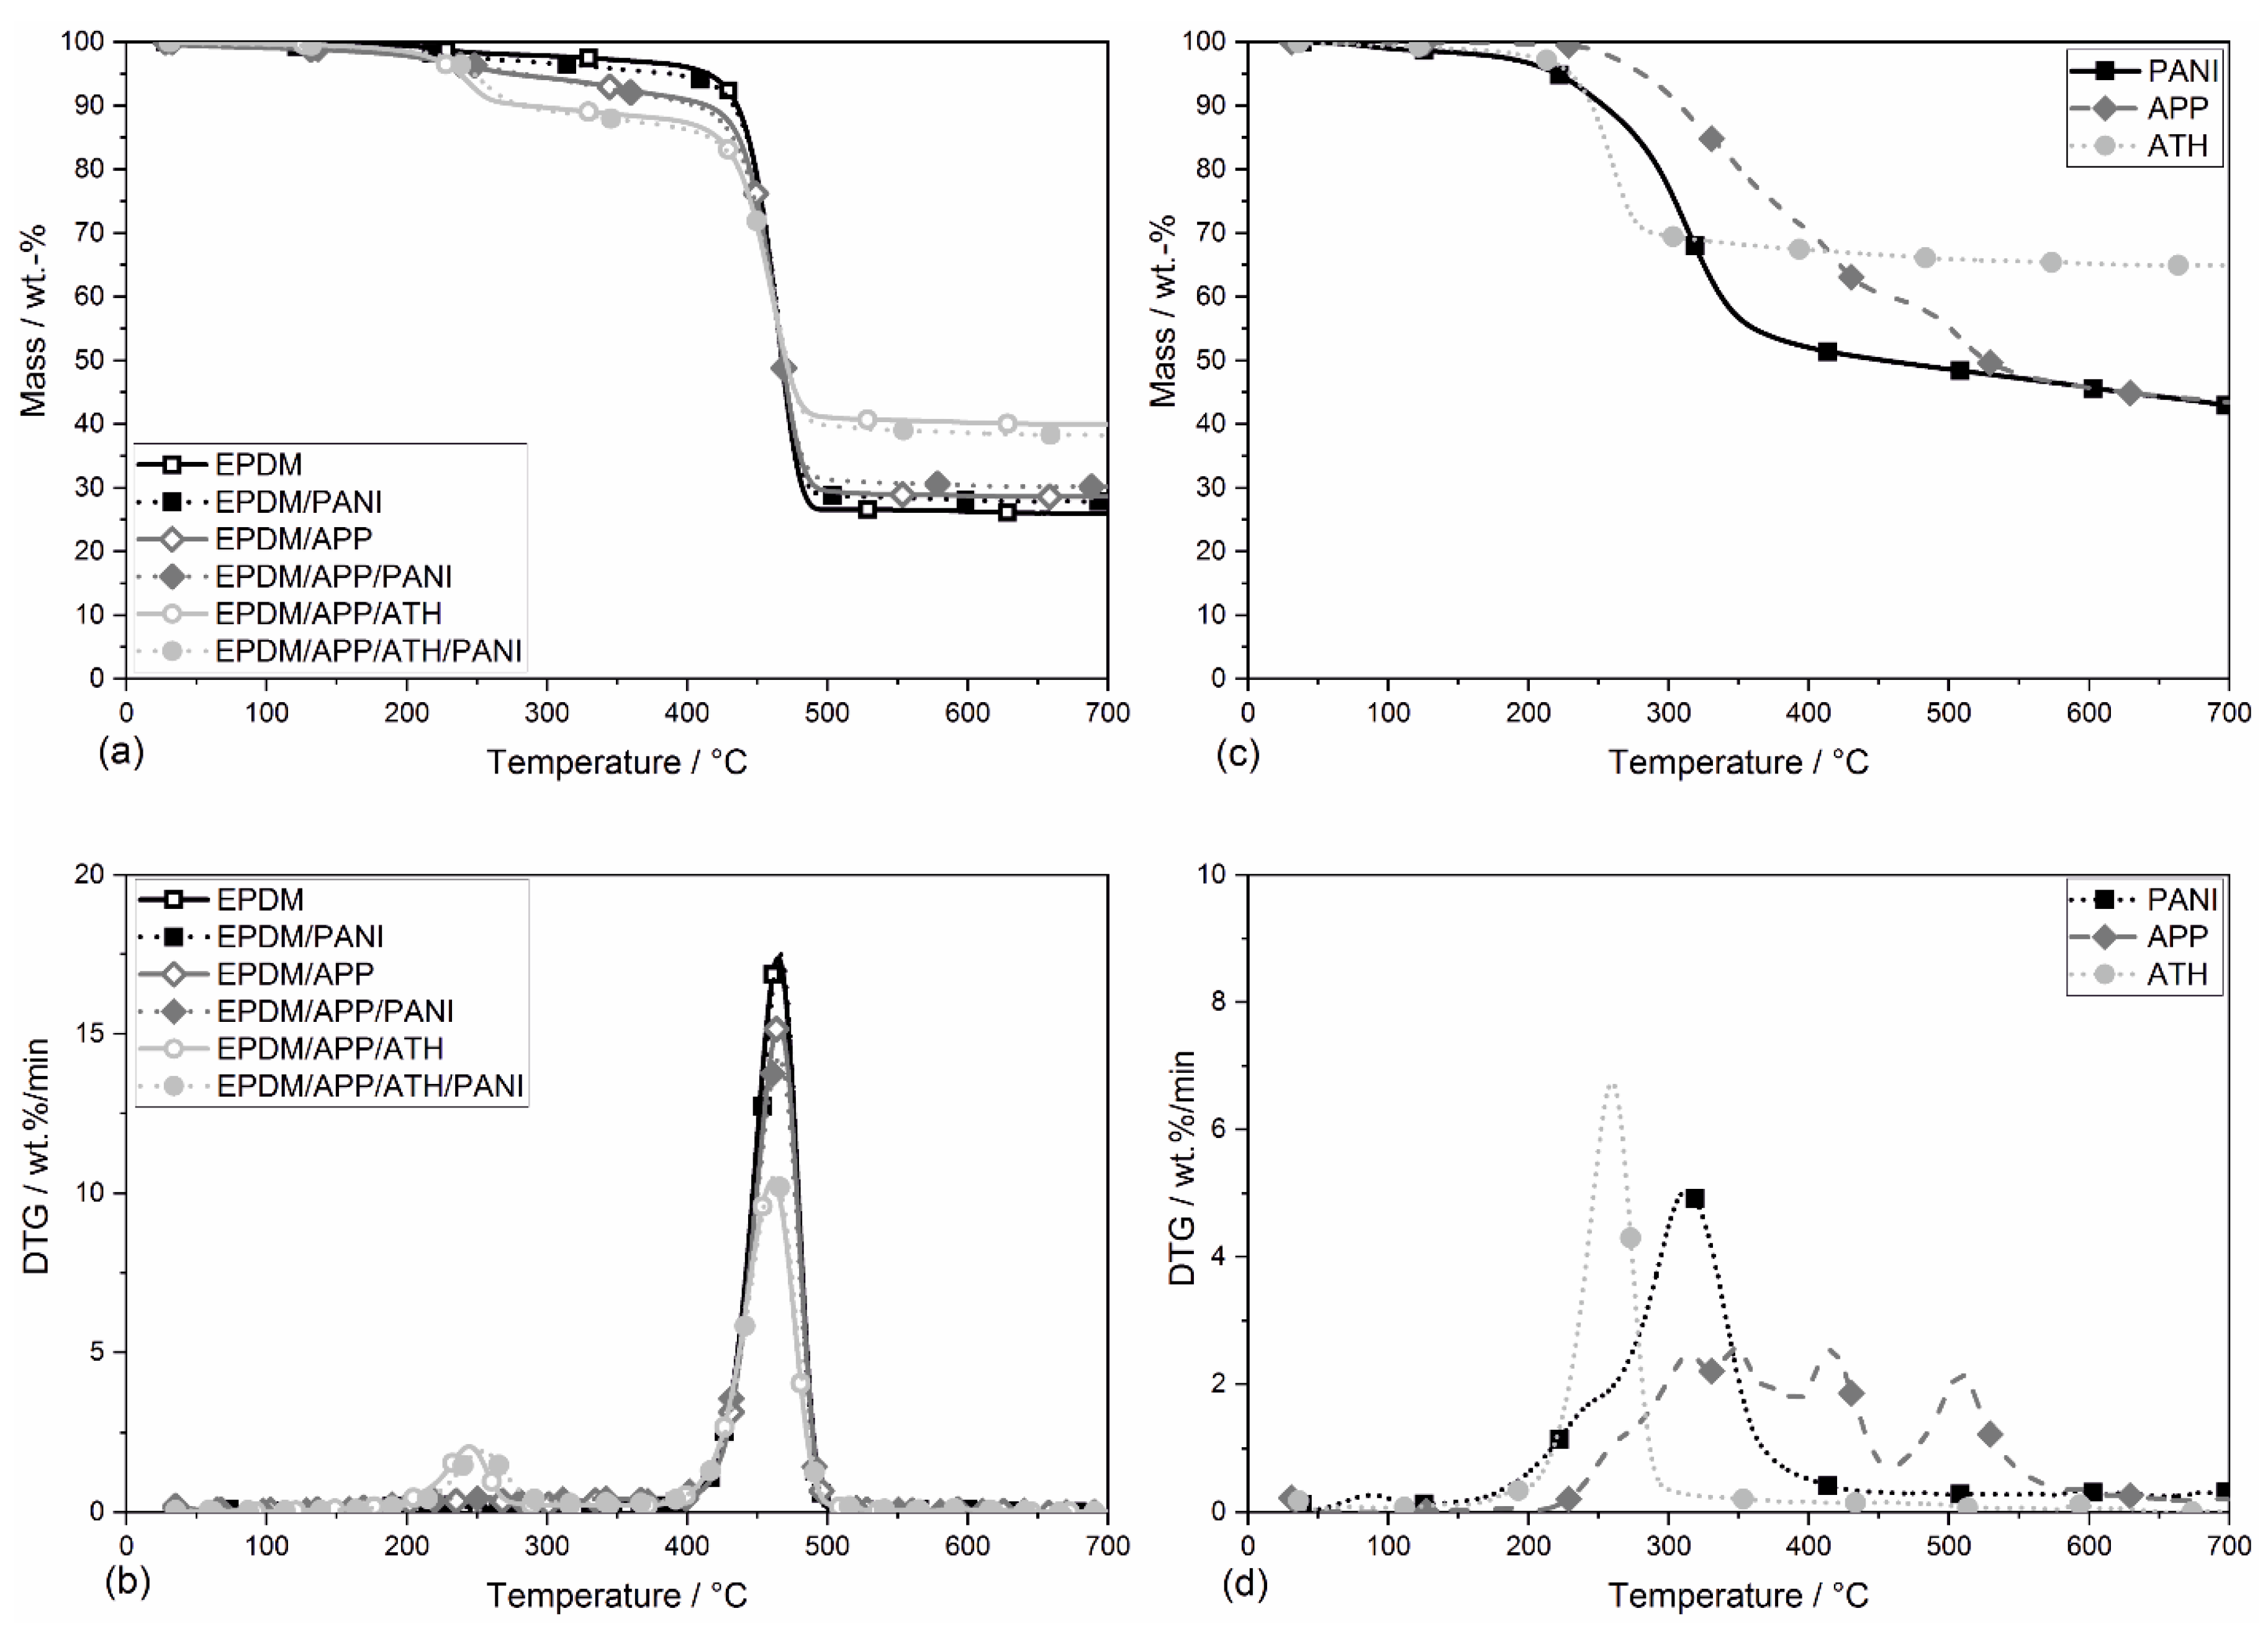
4.5. Thermogravimetric Analysis
4.6. Thermal Conductivity and Heat Capacity
4.7. Flammability
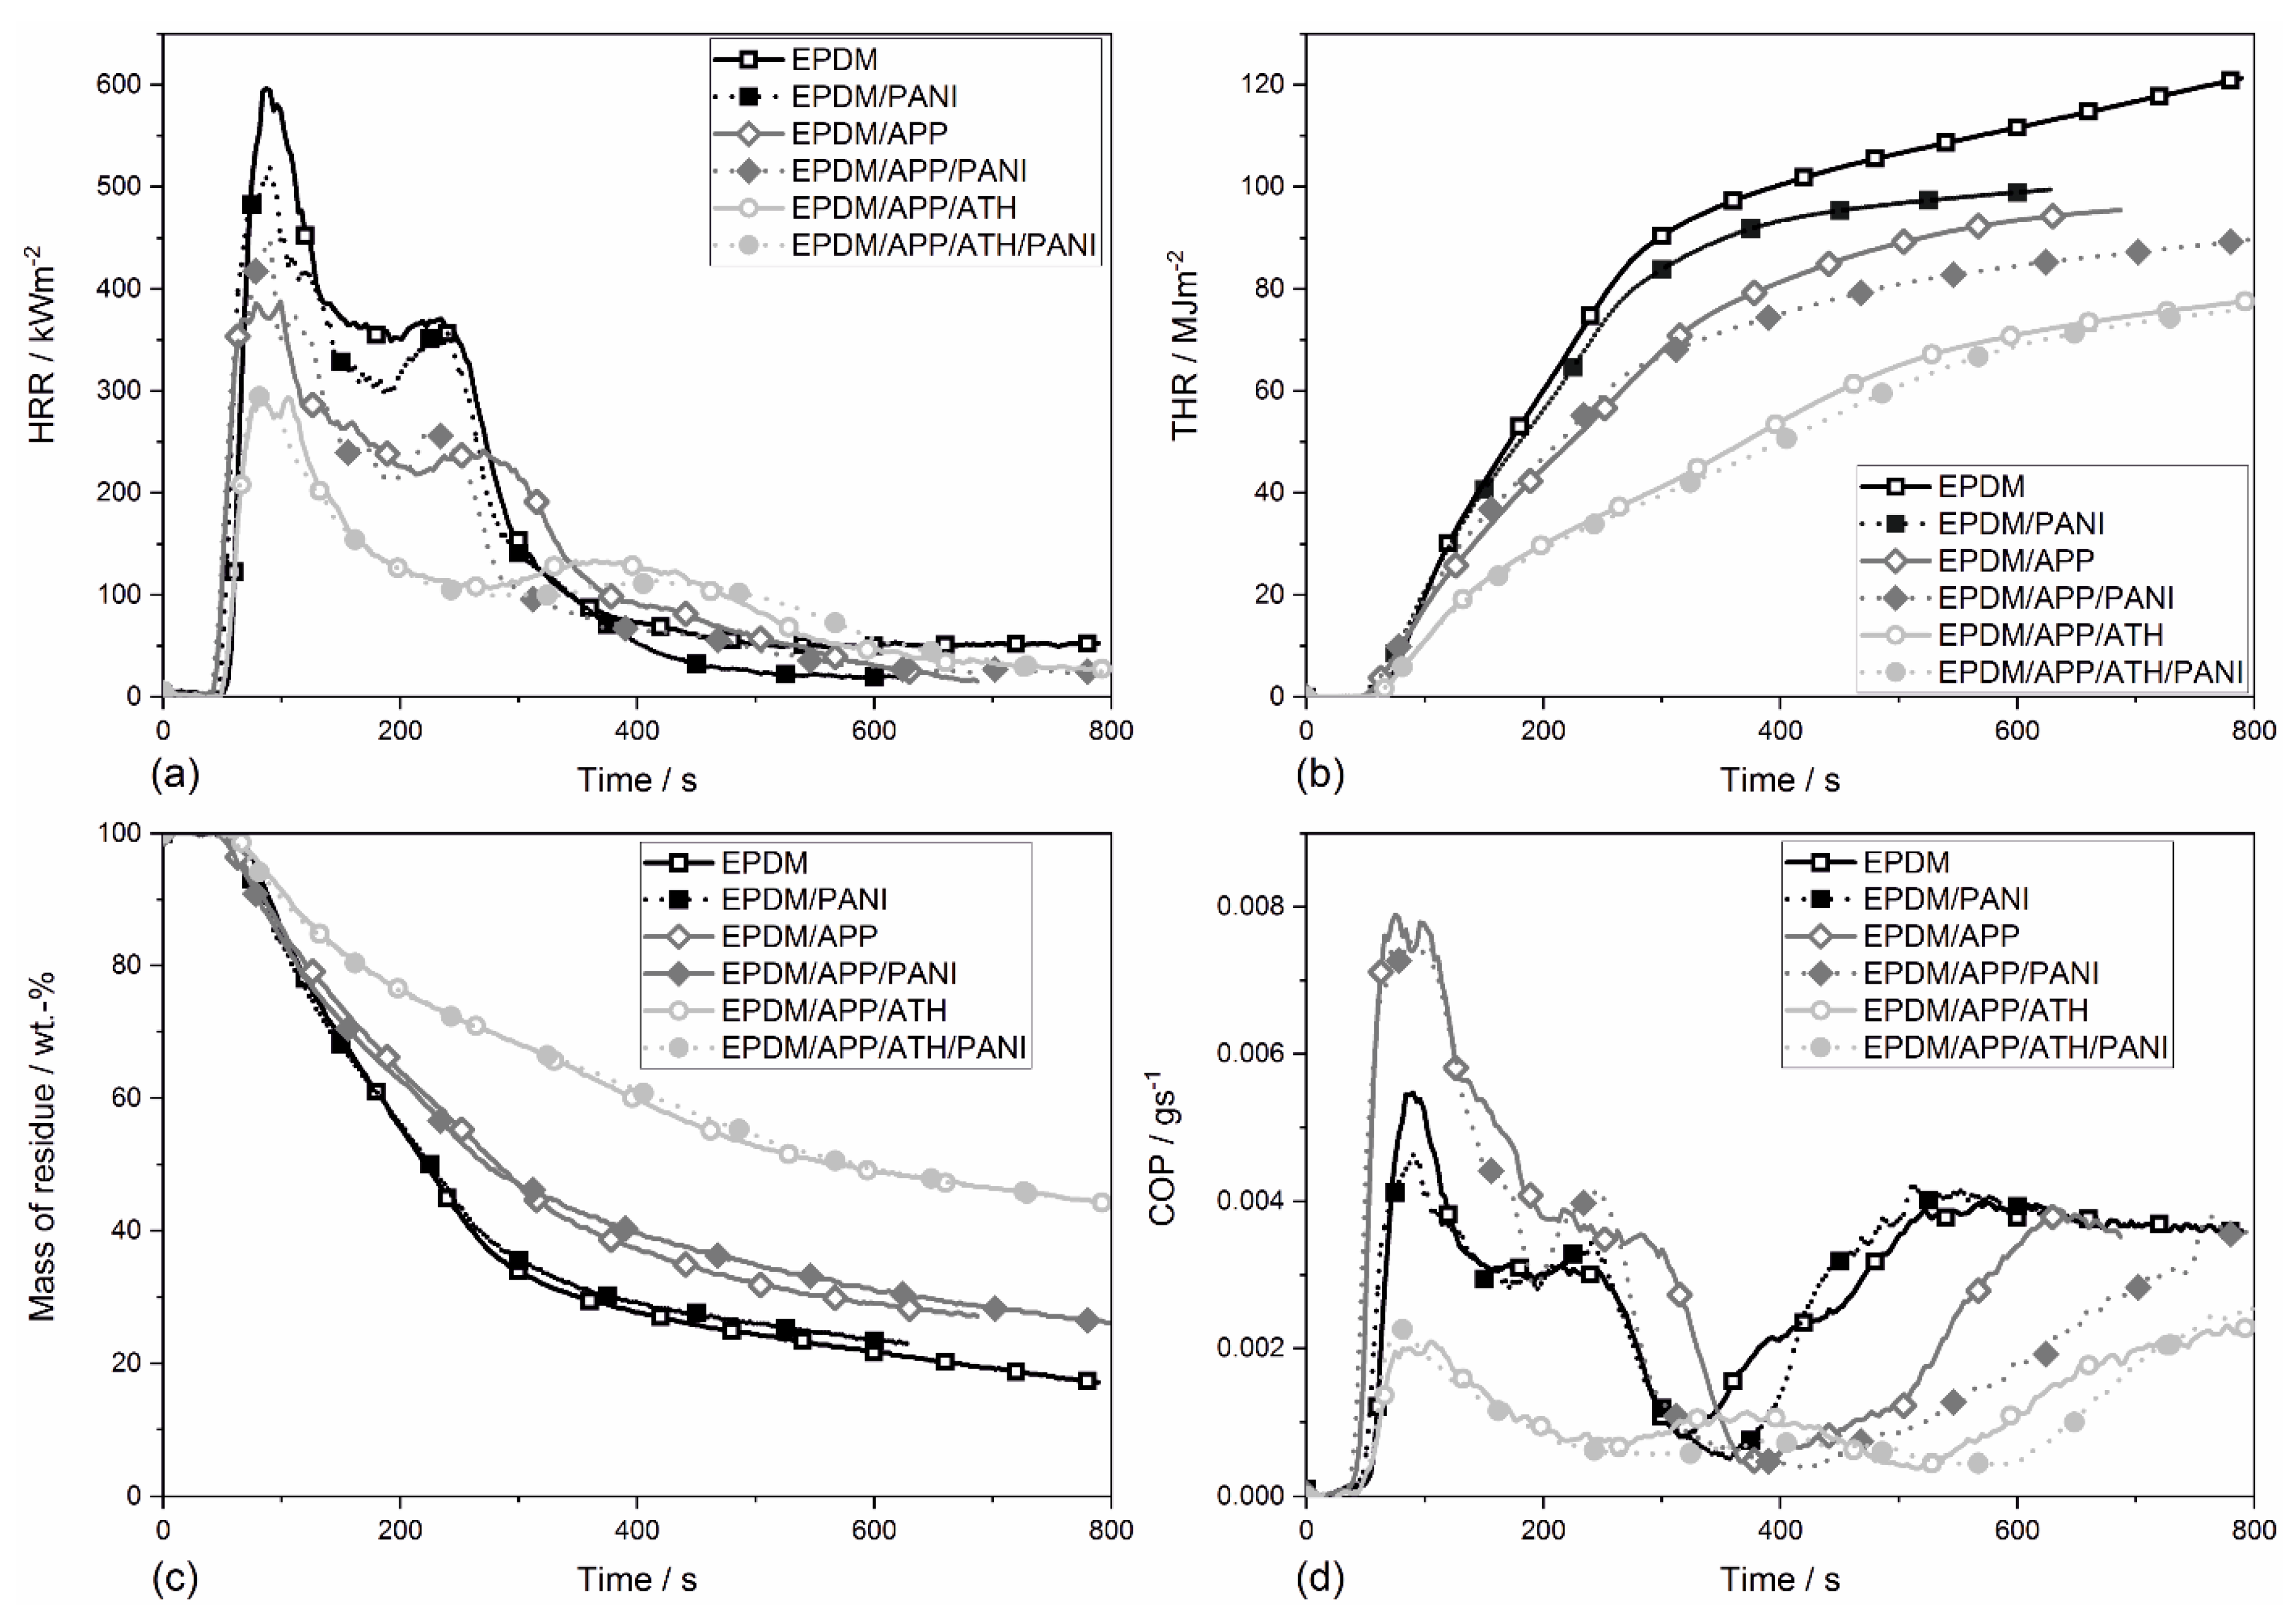
4.8. Fire Behavior
4.9. Phosphorous Flame Retardant Modes of Action
5. Conclusions
Author Contributions
Funding
Acknowledgments
Conflicts of Interest
References
- Yen, Y.-Y.; Wang, H.-T.; Guo, W.-J. Synergistic effect of aluminum hydroxide and nanoclay on flame retardancy and mechanical properties of EPDM composites. J. Appl. Polym. Sci. 2013, 130, 2042–2048. [Google Scholar] [CrossRef]
- Kremers, A.; Krusche, A.; Haberstroh, E. Analysis of the production of sponge rubber profiles. Macromol. Mater. Eng. 2000, 284, 70–75. [Google Scholar] [CrossRef]
- Ibarra, L.; Posadas, P.; Esteban-Martínez, M. A comparative study of the effect of some paraffinic oils on rheological and dynamic properties and behavior at low temperature in EPDM rubber compounds. J. Appl. Polym. Sci. 2005, 97, 1825–1834. [Google Scholar] [CrossRef]
- Weil, E.D.L.; Levchik, S.V. Flame Retardants for Plastics and Textiles. In Practical Application, 2nd ed.; Carl Hansen Verlag: Munich, Germany, 2015; pp. 3–30. [Google Scholar]
- Levchik, S.V.; Weil, E.D. A Review of Recent Progress in Phosphorus-based Flame Retardants. J. Fire Sci. 2016, 24, 345–364. [Google Scholar] [CrossRef]
- Levchik, S.V.; Weil, E.D. 3-Developments in phosphorus flame retardants. In Advances in Fire Retardant Materials; Horrocks, A.R., Price, D., Eds.; Woodhead Publishing: Cambridge, UK, 2008; pp. 41–66. [Google Scholar]
- Kind, D.J.; Hull, T.R. A review of candidate fire retardants for polyisoprene. Polym. Degrad. Stab. 2012, 97, 201–213. [Google Scholar] [CrossRef]
- Zirnstein, B.; Tabaka, W.; Frasca, D.; Schulze, D.; Schartel, B. Graphene/hydrogenated acrylonitrile-butadiene rubber nanocomposites: Dispersion, curing, mechanical reinforcement, multifunctional filler. Polym. Test. 2018, 66, 268–279. [Google Scholar] [CrossRef]
- Horn, W.E. Inorganic Hydroxides and Hydroxycarbonates: Their Function and Use as Flame-Retardant Additives; Fire Retardandancy of Polymeric Materials; Horn, W.E., Ed.; Dekker: New York, NY, USA, 2000; pp. 285–352. [Google Scholar]
- Hornsby, P.R. The application of hydrated mineral fillers as fire retardant and smoke suppressing additives for polymers. Macromol. Symp. 1996, 108, 203–219. [Google Scholar] [CrossRef]
- Hull, T.R.; Witkowski, A.; Hollingbery, L. Fire retardant action of mineral fillers. Polym. Degrad. Stab. 2011, 96, 1462–1469. [Google Scholar] [CrossRef] [Green Version]
- Hornsby, P.R. Fire retardant fillers for polymers. Int. Mater. Rev. 2001, 46, 199–210. [Google Scholar] [CrossRef]
- Braun, U.; Schartel, B. Effect of Red Phosphorus and Melamine Polyphosphate on the Fire Behavior of HIPS. J. Fire Sci. 2016, 23, 5–30. [Google Scholar] [CrossRef]
- Velencoso, M.M.; Battig, A.; Markwart, J.C.; Schartel, B.; Wurm, F.R. Molecular Firefighting—How Modern Phosphorus Chemistry Can Help Solve the Challenge of Flame Retardancy. Angew. Chem. Int. Ed. 2018, 57, 10450–10467. [Google Scholar] [CrossRef] [PubMed]
- Rakotomalala, M.; Wagner, S.; Döring, M. Recent Developments in Halogen Free Flame Retardants for Epoxy Resins for Electrical and Electronic Applications. Materials 2010, 3, 4300–4327. [Google Scholar] [CrossRef] [PubMed] [Green Version]
- Pal, K.; Rastogi, J.N. Development of halogen-free flame-retardant thermoplastic elastomer polymer blend. J. Appl. Polym. Sci. 2004, 94, 407–415. [Google Scholar] [CrossRef]
- Wang, H.; Tian, J. Synergistic antiflaming of expandable graphite on the sealing silicone rubber. J. Wuhan Univ. Technol.-Mater. Sci. Ed. 2013, 28, 706–709. [Google Scholar] [CrossRef]
- Wang, W.; Peng, Y.; Zammarano, M.; Zhang, W.; Li, J. Effect of Ammonium Polyphosphate to Aluminum Hydroxide Mass Ratio on the Properties of Wood-Flour/Polypropylene Composites. Polymers 2017, 9, 615. [Google Scholar] [CrossRef] [PubMed]
- Zheng, Z.; Sun, H.; Li, W.; Zhong, S.; Yan, J.; Cui, X.; Wang, H. Co-microencapsulation of ammonium polyphosphate and aluminum hydroxide in halogen-free and intumescent flame retarding polypropylene. Polym. Compos. 2014, 35, 715–729. [Google Scholar] [CrossRef]
- Qin, Z.; Li, D.; Li, Q.; Yang, R. Effect of nano-aluminum hydroxide on mechanical properties, flame retardancy and combustion behavior of intumescent flame retarded polypropylene. Mater. Des. 2016, 89, 988–995. [Google Scholar] [CrossRef]
- Braun, U.; Schartel, B. Flame Retardant Mechanisms of Red Phosphorus and Magnesium Hydroxide in High Impact Polystyrene. Macromol. Chem. Phys. 2004, 205, 2185–2196. [Google Scholar] [CrossRef]
- Castrovinci, A.; Camino, G.; Drevelle, C.; Duquesne, S.; Magniez, C.; Vouters, M. Ammonium polyphosphate–aluminum trihydroxide antagonism in fire retarded butadiene–styrene block copolymer. Eur. Polym. J. 2005, 41, 2023–2033. [Google Scholar] [CrossRef]
- Moon, S.; Jo, B.; Farris, R.J. Flame resistance and foaming properties of NBR compounds with halogen-free flame retardants. Polym. Compos. 2009, 30, 1732–1742. [Google Scholar] [CrossRef]
- Hapuarachchi, T.D.; Peijs, T. Aluminium trihydroxide in combination with ammonium polyphosphate as flame retardants for unsaturated polyester resin. Express Polym. Lett. 2009, 3, 743–751. [Google Scholar] [CrossRef]
- Levchik, G.F.; Grigoriev, Y.V.; Balabanovich, A.I.; Levchik, S.V.; Klatt, M. Phosphorus–nitrogen containing fire retardants for poly (butylene terephthalate). Polym. Int. 2000, 49, 1095–1100. [Google Scholar] [CrossRef]
- Costa, L.; Camino, G.; di Cortemiglia, L. Fire and Polymers. Hazards Identification and Prevention. In ACS Symposium Series 425, American Chemical Society; Nelson, G.L., Ed.; American Chemical Society: Washington, DC, USA, 1990; p. 21. [Google Scholar]
- Gaan, S.; Sun, G.; Hutches, K.; Engelhard, M.H. Effect of nitrogen additives on flame retardant action of tributyl phosphate: Phosphorus–nitrogen synergism. Polym. Degrad. Stab. 2008, 93, 99–108. [Google Scholar] [CrossRef]
- Frasca, D.; Schulze, D.; Böhning, M.; Krafft, B.; Schartel, B. Multilayer Graphene Chlorine Isobutyl Isoprene Rubber Nanocomposites: Influence of the Multilayer Graphene Concentration on Physical and Flame-Retardant Properties. Rubber Chem. Technol. 2016, 89, 316–334. [Google Scholar] [CrossRef]
- Weil, E.D. Synergists adjuvants and antagonists in flame retardant systems. In Fire Retardancy of Polymeric Materials; Grand, A.F., Wilkie, C.A., Eds.; Marcel Dekker: New York, NY, USA, 1999; pp. 115–145. [Google Scholar]
- Faez, R.; Gazotti, W.A.; de Paoli, M.-A. An elastomeric conductor based on polyaniline prepared by mechanical mixing. Polymer 1999, 40, 5497–5503. [Google Scholar] [CrossRef]
- Soto-Oviedo, M.A.; Araújo, O.A.; Faez, R.; Rezende, M.C.; de Paoli, M.-A. Antistatic coating and electromagnetic shielding properties of a hybrid material based on polyaniline/organoclay nanocomposite and EPDM rubber. Synth. Metals 2006, 156, 1249–1255. [Google Scholar] [CrossRef]
- Pud, A.; Ogurtsov, N.; Korzhenko, A.; Shapoval, G. Some aspects of preparation methods and properties of polyaniline blends and composites with organic polymers. Prog. Polym. Sci. 2003, 28, 1701–1753. [Google Scholar] [CrossRef]
- Zhang, Z.; Han, Y.; Li, T.; Wang, T.; Gao, X.; Liang, Q.; Chen, L. Polyaniline/montmorillonite nanocomposites as an effective flame retardant and smoke suppressant for polystyrene. Synth. Metals 2016, 221, 28–38. [Google Scholar] [CrossRef]
- Zhi, Y.-R.; Yu, B.; Yuen, A.C.Y.; Liang, J.; Wang, L.-Q.; Yang, W.; Lu, H.-D.; Yeoh, G.-H. Surface Manipulation of Thermal-Exfoliated Hexagonal Boron Nitride with Polyaniline for Improving Thermal Stability and Fire Safety Performance of Polymeric Materials. ACS Omega 2018, 3, 14942–14952. [Google Scholar] [CrossRef]
- Wang, J.; Zhan, J.; Mu, X.; Jin, X.; Chu, F.; Kan, Y.; Xing, W. Manganese phytate dotted polyaniline shell enwrapped carbon nanotube: Towards the reinforcements in fire safety and mechanical property of polymer. J. Colloid Interface Sci. 2018, 529, 345–356. [Google Scholar] [CrossRef]
- Zhou, K.; Liu, C.; Gao, R. Polyaniline: A novel bridge to reduce the fire hazards of epoxy composites. Compos. Part A Appl. Sci. Manuf. 2018, 112, 432–443. [Google Scholar] [CrossRef]
- Zhou, Y.; Ding, C.; Qian, X.; An, X. Further improvement of flame retardancy of polyaniline-deposited paper composite through using phytic acid as dopant or co-dopant. Carbohydr. Polym. 2015, 115, 670–676. [Google Scholar] [CrossRef]
- Stejskal, J.; Trchová, M.; Sapurina, I. Flame-retardant effect of polyaniline coating deposited on cellulose fibers. J. Appl. Polym. Sci. 2005, 98, 2347–2354. [Google Scholar] [CrossRef]
- Zhang, X.; He, Q.; Gu, H.; Colorado, H.A.; Wei, S.; Guo, Z. Flame-Retardant Electrical Conductive Nanopolymers Based on Bisphenol F Epoxy Resin Reinforced with Nano Polyanilines. ACS Appl. Mater. Interfaces 2013, 5, 898–910. [Google Scholar] [CrossRef] [PubMed]
- Gu, H.; Guo, J.; He, Q.; Tadakamalla, S.; Zhang, X.; Yan, X.; Huang, Y.; Colorado, H.A.; Wei, S.; Guo, Z. Flame-Retardant Epoxy Resin Nanocomposites Reinforced with Polyaniline-Stabilized Silica Nanoparticles. Ind. Eng. Chem. Res. 2013, 52, 7718–7728. [Google Scholar] [CrossRef]
- Zirnstein, B.; Schulze, D.; Schartel, B. The impact of polyaniline in phosphorus flame retardant ethylene-propylene-diene-rubber (EPDM). Thermochim. Acta 2019, 673, 92–104. [Google Scholar] [CrossRef]
- Schartel, B. Phosphorus-based Flame Retardancy Mechanisms-Old Hat or a Starting Point for Future Development? Materials 2010, 3, 4710–4745. [Google Scholar] [CrossRef] [PubMed]
- Pawlowski, K.H.; Schartel, B. Flame retardancy mechanisms of triphenyl phosphate, resorcinol bis (diphenyl phosphate) and bisphenol A bis (diphenyl phosphate) in polycarbonate/acrylonitrile–butadiene–styrene blends. Polym. Int. 2007, 56, 1404–1414. [Google Scholar] [CrossRef]
- Schartel, B.; Perret, B.; Dittrich, B.; Ciesielski, M.; Krämer, J.; Müller, P.; Altstädt, V.; Zang, L.; Döring, M. Flame Retardancy of Polymers: The Role of Specific Reactions in the Condensed Phase. Macromol. Mater. Eng. 2016, 301, 9–35. [Google Scholar] [CrossRef]
- Reaction-to-Fire Tests–Heat Release, Smoke Production and Mass Loss Rate; Part1: Heat release rate (cone calorimeter method) and smoke production rate (dynamic measurement); ISO: Geneva, Switzerland, ISO 5660-1: 2015-3-15; 2015.
- Schartel, B.; Bartholmai, M.; Knoll, U. Some comments on the use of cone calorimeter data. Polym. Degrad. Stab. 2005, 88, 540–547. [Google Scholar] [CrossRef]
- Horrocks, A.R.; Smart, G.; Hörold, S.; Wanzke, W.; Schlosser, E.; Williams, J. The combined effects of zinc stannate and aluminium diethyl phosphinate on the burning behaviour of glass fibre-reinforced, high temperature polyamide (HTPA). Polym. Degrad. Stab. 2014, 104, 95–103. [Google Scholar] [CrossRef]
- Zailan, F.D.; Chen, R.S.; Shahdan, D.; Ahmad, S. Effect of conductive polyaniline in thermoplastic natural rubber blends on the mechanical, thermal stability, and electrical conductivity properties. J. Appl. Polym. Sci. 2019, 136, 47527. [Google Scholar] [CrossRef]
- Faez, R.; de Paoli, M.-A. A conductive rubber based on EPDM and polyaniline: I. Doping method effect. Eur. Polym. J. 2001, 37, 1139–1143. [Google Scholar] [CrossRef]
- Wang, N.; Mi, L.; Wu, Y.; Zhang, J.; Fang, Q. Double-layered co-microencapsulated ammonium polyphosphate and mesoporous MCM-41 in intumescent flame-retardant natural rubber composites. J. Therm. Anal. Calorim. 2013, 115, 1173–1181. [Google Scholar] [CrossRef]
- Ciullo, P.A.; Hewitt, N. Compounding Materials. In The Rubber Formulary; Elsevier: New York, NY, USA, 1999; pp. 4–49. [Google Scholar]
- Oenslager, G. Organic Accelerators. Ind. Eng. Chem. 1933, 25, 232–237. [Google Scholar] [CrossRef]
- Coran, A.Y. Vulcanization: Conventional and Dynamic. Rubber Chem. Technol. 1995, 68, 351–375. [Google Scholar] [CrossRef]
- Malas, A.; Pal, P.; Das, C.K. Effect of expanded graphite and modified graphite flakes on the physical and thermo-mechanical properties of styrene butadiene rubber/polybutadiene rubber (SBR/BR) blends. Mater. Des. 2014, 55, 664–673. [Google Scholar] [CrossRef]
- Oh, J.; Yoo, Y.H.; Yoo, I.-S.; Huh, Y.-I.; Chaki, T.K.; Nah, C. Effect of plasticizer and curing system on freezing resistance of rubbers. J. Appl. Polym. Sci. 2014, 131, 39795. [Google Scholar] [CrossRef]
- The, P.L.; Ishak, Z.A.M.; Hashim, A.S.; Karger-Kocsis, J.; Ishiaku, U.S. Effects of epoxidized natural rubber as a compatibilizer in melt compounded natural rubber–organoclay nanocomposites. Eur. Polym. J. 2004, 40, 2513–2521. [Google Scholar] [CrossRef]
- Thomas, R.S.S. Rubber Nanocomposites: Preparation, Properties and Applications; John Wiley & Sons (Asia) Pte Ltd.: Singapore, 2010; pp. 368–390. [Google Scholar]
- Faez, R.; Schuster, R.H.; de Paoli, M.-A. A conductive elastomer based on EPDM and polyaniline: II. Effect of the crosslinking method. Eur. Polym. J. 2002, 38, 2459–2463. [Google Scholar] [CrossRef]
- Ansorge, S.; Papailiou, K. Mechanical properties of silicone rubber under high loadings of alumina trihydrate filler. J. Elastom. Plast. 2015, 48, 354–382. [Google Scholar] [CrossRef]
- Salvatore, P. Intumescent Flame Retarded Polypropylene Systems Containing Sepiolite Clays: Properties and Synergic Effects. Ph.D. Thesis, Università degli Studi di Napoli Federico II, Naples, Italy, 2016. [Google Scholar]
- Fröhlich, J.; Niedermeier, W.; Luginsland, H.D. The effect of filler–filler and filler–elastomer interaction on rubber reinforcement. Compos. Part A Appl. Sci. Manuf. 2005, 36, 449–460. [Google Scholar] [CrossRef]
- He, X.L.; Guo, W.H.; Wu, C.F. Effects of filler–rubber interaction on dynamic mechanical properties and reinforcement of NR vulcanisates AU-Han, J.J. Plast. Rubber Compos. 2007, 36, 149–154. [Google Scholar] [CrossRef]
- Carlsson DJ, W.D. Encyclopedia of Polymer Science and Engineering; Mark, Bikales, Overberger, and Menges, Interscience: New York, NY, USA, 1986. [Google Scholar]
- Hollingbery, L.A.; Hull, T.R. The fire retardant behaviour of huntite and hydromagnesite–A review. Polym. Degrad. Stab. 2010, 95, 2213–2225. [Google Scholar] [CrossRef]
- Dittrich, B.; Wartig, K.-A.; Hofmann, D.; Mülhaupt, R.; Schartel, B. The influence of layered, spherical, and tubular carbon nanomaterials’ concentration on the flame retardancy of polypropylene. Polym. Compos. 2015, 36, 1230–1241. [Google Scholar] [CrossRef]
- Sim, L.C.; Ramanan, S.R.; Ismail, H.; Seetharamu, K.N.; Goh, T.J. Thermal characterization of Al2O3 and ZnO reinforced silicone rubber as thermal pads for heat dissipation purposes. Thermochim. Acta 2005, 430, 155–165. [Google Scholar] [CrossRef]
- Babrauskas, V.; Grayson, S.J. Heat Release in Fires; Elsevier: London, UK, 1992. [Google Scholar]
- Schartel, B.; Hull, T.R. Development of fire-retarded materials-Interpretation of cone calorimeter data. Fire Mater. 2007, 31, 327–354. [Google Scholar] [CrossRef]
- Brehme, S.; Schartel, B.; Goebbels, J.; Fischer, O.; Pospiech, D.; Bykov, Y.; Döring, M. Phosphorus polyester versus aluminium phosphinate in poly (butylene terephthalate) (PBT): Flame retardancy performance and mechanisms. Polym. Degrad. Stab. 2011, 96, 875–884. [Google Scholar] [CrossRef]
- Schartel, B.; Bartholmai, M.; Knoll, U. Some comments on the main fire retardancy mechanisms in polymer nanocomposites. Polym. Adv. Technol. 2006, 17, 772–777. [Google Scholar] [CrossRef]
- Sut, A.; Greiser, S.; Jäger, C.; Schartel, B. Aluminium diethylphosphinate versus ammonium polyphosphate: A comprehensive comparison of the chemical interactions during pyrolysis in flame-retarded polyolefine/poly (phenylene oxide). Thermochim. Acta 2016, 640, 74–84. [Google Scholar] [CrossRef]
- Gallo, E.; Schartel, B.; Schmaucks, G.; von der Ehe, K.; Bohning, M. Effect of well dispersed amorphous silicon dioxide in flame retarded styrene butadiene rubber. Plast. Rubber Compos. 2013, 42, 34–42. [Google Scholar] [CrossRef]
- Rabe, S.; Chuenban, Y.; Schartel, B. Exploring the Modes of Action of Phosphorus-Based Flame Retardants in Polymeric Systems. Materials 2017, 10, 455–478. [Google Scholar] [CrossRef] [PubMed]
- Brehme, S.; Köppl, T.; Schartel, B.; Fischer, O.; Altstädt, V.; Pospiech, D.; Döring, M. Phosphorus Polyester-an Alternative to Low-Molecular-Weight Flame Retardants in Poly (Butylene Terephthalate)? Macromol. Chem. Phys. 2012, 213, 2386–2397. [Google Scholar] [CrossRef]
- Pappalardo, S.; Russo, P.; Acierno, D.; Rabe, S.; Schartel, B. The synergistic effect of organically modified sepiolite in intumescent flame retardant polypropylene. Eur. Polym. J. 2016, 76, 196–207. [Google Scholar] [CrossRef]


| Fillers | EPDM | EPDM/PANI | EPDM/APP | EPDM/APP/PANI | EPDM/APP/ATH | EPDM/APP/ATH/PANI |
|---|---|---|---|---|---|---|
| EPDM | 100 | 100 | 100 | 100 | 100 | 100 |
| APP | - | - | 21 | 21 | 21 | 21 |
| PANI | - | 7.0 | - | 7.0 | - | 7.0 |
| ATH | - | - | - | - | 50 | 50 |
| Antioxidant | 0.5 | 0.5 | 0.5 | 0.5 | 0.5 | 0.5 |
| Zinc oxide | 5.0 | 5.0 | 5.0 | 5.0 | 5.0 | 5.0 |
| Stearic acid | 1.0 | 1.0 | 1.0 | 1.0 | 1.0 | 1.0 |
| CB | 30 | 30 | 30 | 30 | 30 | 30 |
| CZ | 1.0 | 1.0 | 1.0 | 1.0 | 1.0 | 1.0 |
| Thiuram MS | 2.0 | 2.0 | 2.0 | 2.0 | 2.0 | 2.0 |
| Sulfur | 1.5 | 1.5 | 1.5 | 1.5 | 1.5 | 1.5 |
| Parameters | EPDM | EPDM/PANI | EPDM/APP | EPDM/APP/PANI | EPDM/APP/ATH | EPDM/APP/ATH/PANI |
|---|---|---|---|---|---|---|
| Scorch time (±0.4)/min | 2.88 | 0.88 | 1.88 | 1.14 | 1.43 | 1.21 |
| t90 (±1.3)/min | 9.77 | 7.74 | 7.11 | 6.07 | 6.65 | 5.04 |
| MH (±1.5)/dN·m | 26.6 | 28.6 | 13. 6 | 23.0 | 18.6 | 25.9 |
| ML (±0.1)/dN·m | 1.17 | 1.28 | 1.35 | 1.60 | 1.77 | 2.57 |
| MH–ML | 25.4 | 27.3 | 12.3 | 21.4 | 16.8 | 23.4 |
| Variation in the MH–ML/% | 100 | 107 | 48 | 84 | 66 | 92 |
| Parameter | EPDM | EPDM/PANI | EPDM/APP | EPDM/APP/PANI | EPDM/APP/ATH | EPDM/APP/ATH/PANI |
|---|---|---|---|---|---|---|
| Elongation at break (±21)/% | 330 | 326 | 378 | 446 | 338 | 422 |
| Young’s modulus (±1.0)/MPa | 6.73 | 8.63 | 10.0 | 10.9 | 23.2 | 28.5 |
| Tensile strength (±0.59)/MPa | 8.61 | 9.91 | 8.51 | 9.12 | 8.18 | 7.86 |
| Stress at 100% (±0.1)/MPa | 2.26 | 2.97 | 2.16 | 2.01 | 2.89 | 2.60 |
| Hardness (±0.6)/Shore A | 66.9 | 69.9 | 68.3 | 69.0 | 76.3 | 77.1 |
| Material | T5 wt.% (±2)/°C | TDTG(1) (±2)/°C | Mass Loss at TDTG(1) (±0.5)/wt.% | TDTGmax (±2)/°C | Residue (±1)/wt.% |
|---|---|---|---|---|---|
| PANI | 212 | - | - | 312 | 43.9 |
| APP | 277 | - | - | 347 | 45.7 |
| ATH | 230 | - | - | 260 | 65.2 |
| EPDM | 412 | - | - | 464 | 24.6 |
| EPDM/PANI | 389 | - | - | 466 | 28.0 |
| EPDM/APP | 210 | - | - | 465 | 28.7 |
| EPDM/APP/PANI | 215 | - | - | 465 | 30.4 |
| EPDM/APP/ATH | 238 | 246 | 8.1 | 461 | 40.2 |
| EPDM/APP/ATH/PANI | 248 | 254 | 8.1 | 463 | 38.6 |
| Rubber | Residue (±1)/wt.% | Calc. Residue | Residue of EPDM | Residue of PANI | Residue of APP | Residue of ATH |
|---|---|---|---|---|---|---|
| EPDM | 24.6 | - | 24.6 | 0.0 | 0.0 | 0.0 |
| EPDM/PANI | 28.0 | 25.6 | 23.4 | 2.1 | 0.0 | 0.0 |
| EPDM/APP | 28.7 | 27.3 | 21.4 | 0.0 | 5.9 | 0.0 |
| EPDM/APP/PANI | 30.4 | 28.0 | 20.5 | 1.8 | 5.7 | 0.0 |
| EPDM/APP/ATH | 40.2 | 36.3 | 16.4 | 0.0 | 4.5 | 15.4 |
| EPDM/APP/ATH/PANI | 38.6 | 36.5 | 15.8 | 1.4 | 4.4 | 14.9 |
| Parameter | EPDM | EPDM/PANI | EPDM/APP | EPDM/APP/PANI | EPDM/APP/ATH | EPDM/APP/ATH/PANI |
|---|---|---|---|---|---|---|
| Thermal conductivity (±0.01)/W·m−1·K−1 | 0.29 | 0.29 | 0.31 | 0.31 | 0.44 | 0.44 |
| Heat capacity (±0.02)/MJ·m−3·K−1 | 1.71 | 1.74 | 1.75 | 1.76 | 1.75 | 1.74 |
| Parameter | EPDM | EPDM/PANI | EPDM/APP | EPDM/APP/PANI | EPDM/APP/ATH | EPDM/APP/ATH/PANI |
|---|---|---|---|---|---|---|
| LOI (±0.2)/vol% | 20.6 | 22.2 | 25.0 | 24.0 | 25.1 | 26.6 |
| GWIT (±25)/°C | 700 | 750 | 700 | 700 | 800 | 825 |
| GWFI (±25)/°C | 775 | 800 | 900 | 960 | 960 | 960 |
| UL94 | HB | HB | HB | HB | HB | HB |
| UL 94/mm·min−1 | 18.2 | 12.4 | 0.5 | 3.9 | 2.4 | 0 |
| FMVSS 302/mm·min−1 | 27.5 | 13.8 | 0 | 0 | 0 | 0 |
| Parameter | EPDM | EPDM/PANI | EPDM/APP | EPDM/APP/PANI | EPDM/APP/ATH | EPDM/APP/ATH/PANI |
|---|---|---|---|---|---|---|
| tig (±2)/s | 50 | 45 | 43 | 37 | 51 | 48 |
| PHRR (±5)/kW·m−2 | 598 | 531 | 399 | 440 | 295 | 294 |
| Flameout (±5)/s | 315 | 348 | 366 | 408 | 516 | 546 |
| Residue (±1)/wt.% | 30 | 32 | 40 | 39 | 52 | 51 |
| TSR (±40)/m2·m−2 | 1562 | 1595 | 1795 | 1612 | 852 | 714 |
| THE (±4)/MJ·m−2 | 93 | 90 | 78 | 76 | 65 | 65 |
| EHC (±2)/MJ·kg−1 | 41.6 | 38.0 | 35.6 | 33.7 | 32.5 | 31.9 |
| PHRR (±0.4)/tig/kW·m−2·s−2 | 12.1 | 11.9 | 9.4 | 11.7 | 5.5 | 6.1 |
| FIGRA (±0.2)/kW·m−2·s−1 | 7.1 | 6.8 | 5.7 | 6.0 | 3.6 | 3.9 |
| MARHE (±5)/kW·m−2 | 314 | 301 | 231 | 238 | 154 | 142 |
| Parameter | EPDM | EPDM/PANI | EPDM/APP | EPDM/APP/PANI | EPDM/APP/ATH | EPDM/APP/ATH/PANI |
|---|---|---|---|---|---|---|
| wt.% P (sample) | - | - | 3.24 | 3.11 | 2.47 | 2.39 |
| wt.% P (residue) | - | - | 8.46 | 8.45 | 6.80 | 6.21 |
| Phosphorus in the condensed phase/% | - | - | 100 | 100 | 100 | 100 |
| Phosphorus in the gas phase/% | - | - | 0 | 0 | 0 | 0 |
| Material | (1 − μ) | · | m0 | Cal. THE | THE | Cal. PHRR | PHRR | Prot. Layer |
|---|---|---|---|---|---|---|---|---|
| % | % | % | % | % | % | % | % | |
| EPDM | 100.0 | 100.0 | 100.0 | 100.0 | 100.0 | 100.0 | 100.0 | 0.0 |
| EPDM/PANI | 98.0 | 91.2 | 105 | 93.7 | 96.8 | 89.4 | 88.8 | 0.7 |
| EPDM/APP | 90.0 | 85.6 | 110 | 84.8 | 83.9 | 77.0 | 66.7 | 13.4 |
| EPDM/APP/PANI | 91.0 | 80.9 | 112 | 82.4 | 81.7 | 73.7 | 73.6 | 0.1 |
| EPDM/APP/ATH | 78.0 | 78.0 | 127 | 77.3 | 69.9 | 60.9 | 49.3 | 19.0 |
| EPDM/APP/ATH/PANI | 79.0 | 76.6 | 128 | 77.3 | 69.9 | 60.5 | 49.2 | 18.8 |
© 2019 by the authors. Licensee MDPI, Basel, Switzerland. This article is an open access article distributed under the terms and conditions of the Creative Commons Attribution (CC BY) license (http://creativecommons.org/licenses/by/4.0/).
Share and Cite
Zirnstein, B.; Schulze, D.; Schartel, B. Mechanical and Fire Properties of Multicomponent Flame Retardant EPDM Rubbers Using Aluminum Trihydroxide, Ammonium Polyphosphate, and Polyaniline. Materials 2019, 12, 1932. https://doi.org/10.3390/ma12121932
Zirnstein B, Schulze D, Schartel B. Mechanical and Fire Properties of Multicomponent Flame Retardant EPDM Rubbers Using Aluminum Trihydroxide, Ammonium Polyphosphate, and Polyaniline. Materials. 2019; 12(12):1932. https://doi.org/10.3390/ma12121932
Chicago/Turabian StyleZirnstein, Benjamin, Dietmar Schulze, and Bernhard Schartel. 2019. "Mechanical and Fire Properties of Multicomponent Flame Retardant EPDM Rubbers Using Aluminum Trihydroxide, Ammonium Polyphosphate, and Polyaniline" Materials 12, no. 12: 1932. https://doi.org/10.3390/ma12121932