Microwave Hydrothermal Carbonization of Rice Straw: Optimization of Process Parameters and Upgrading of Chemical, Fuel, Structural and Thermal Properties

 ,
,
Abstract
:1. Introduction
2. Materials and Methods
2.1. Rice Straw
2.2. Microwave-Assisted Hydrothermal Carbonization Process
2.3. Hydrochar Yield (%)
2.4. Optimization of Process Parameters Using CCD
2.5. Characterization of Rice Straw and Optimized Hydrochar
3. Results and Discussion
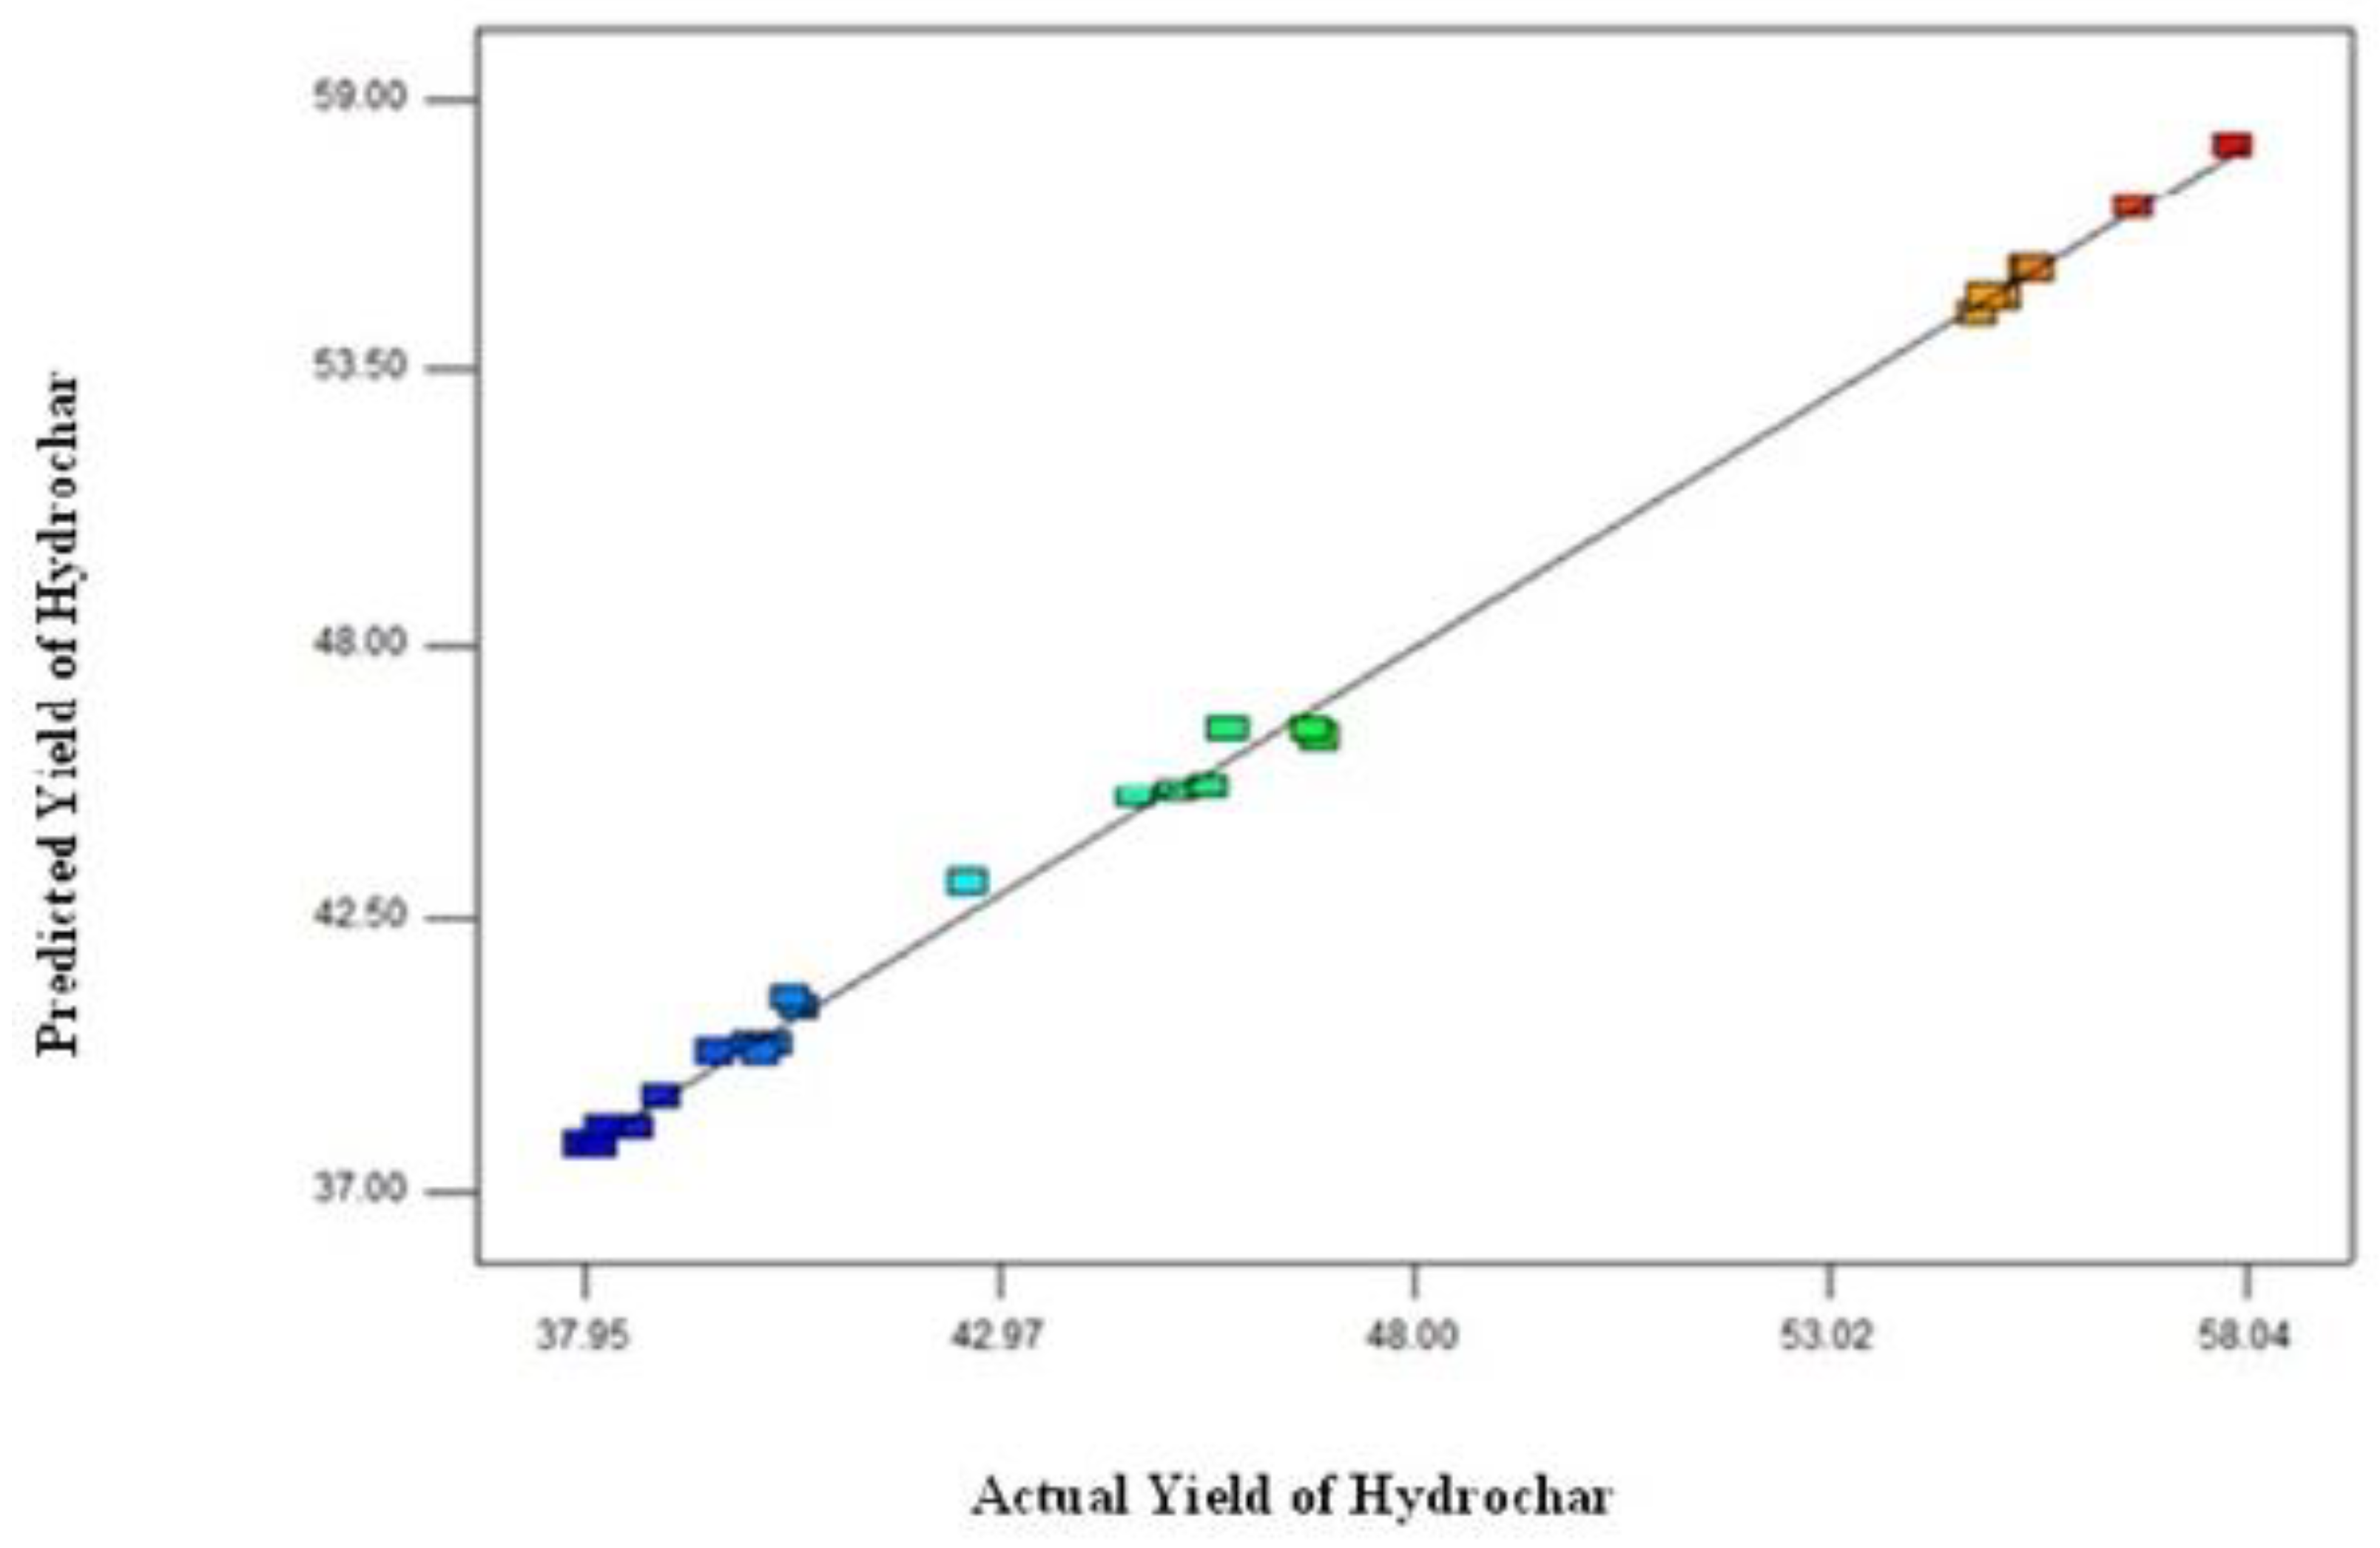
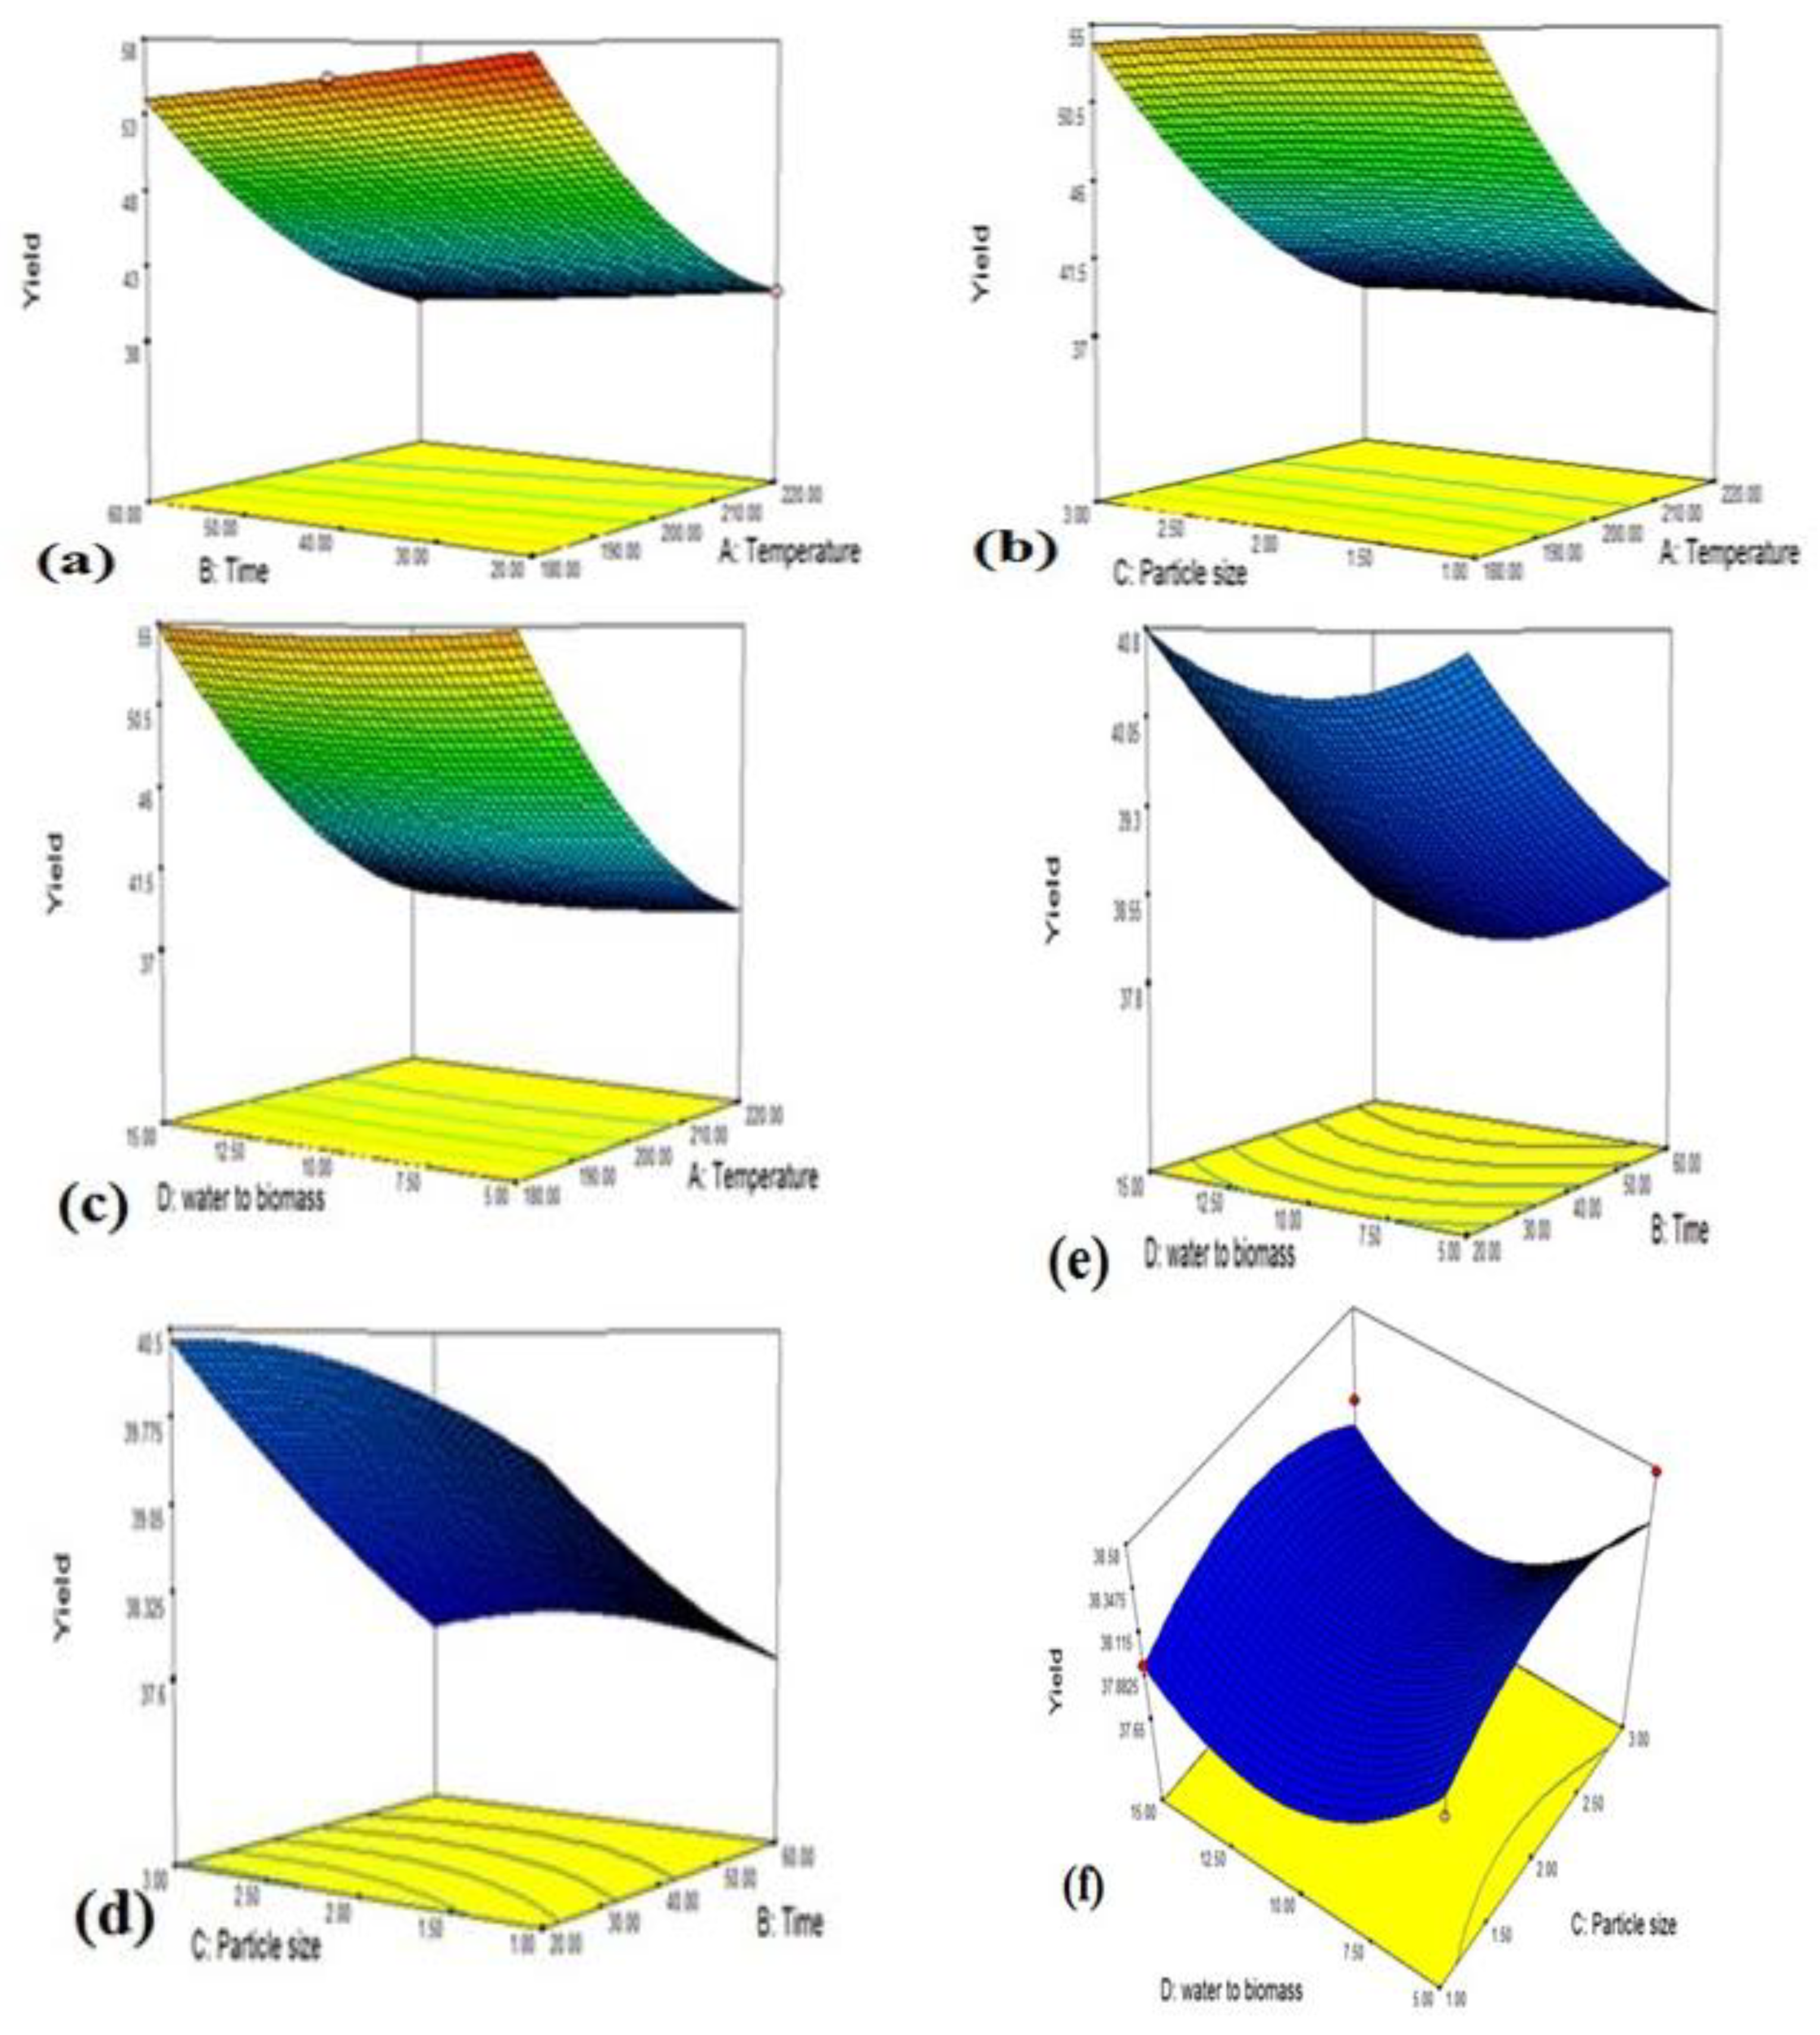
3.1. Optimization of Process Parameters for Hydrochar Synthesis
3.2. Characterization of Rice Straw and Optimized Hydrochar
3.2.1. HHV and Energy Density
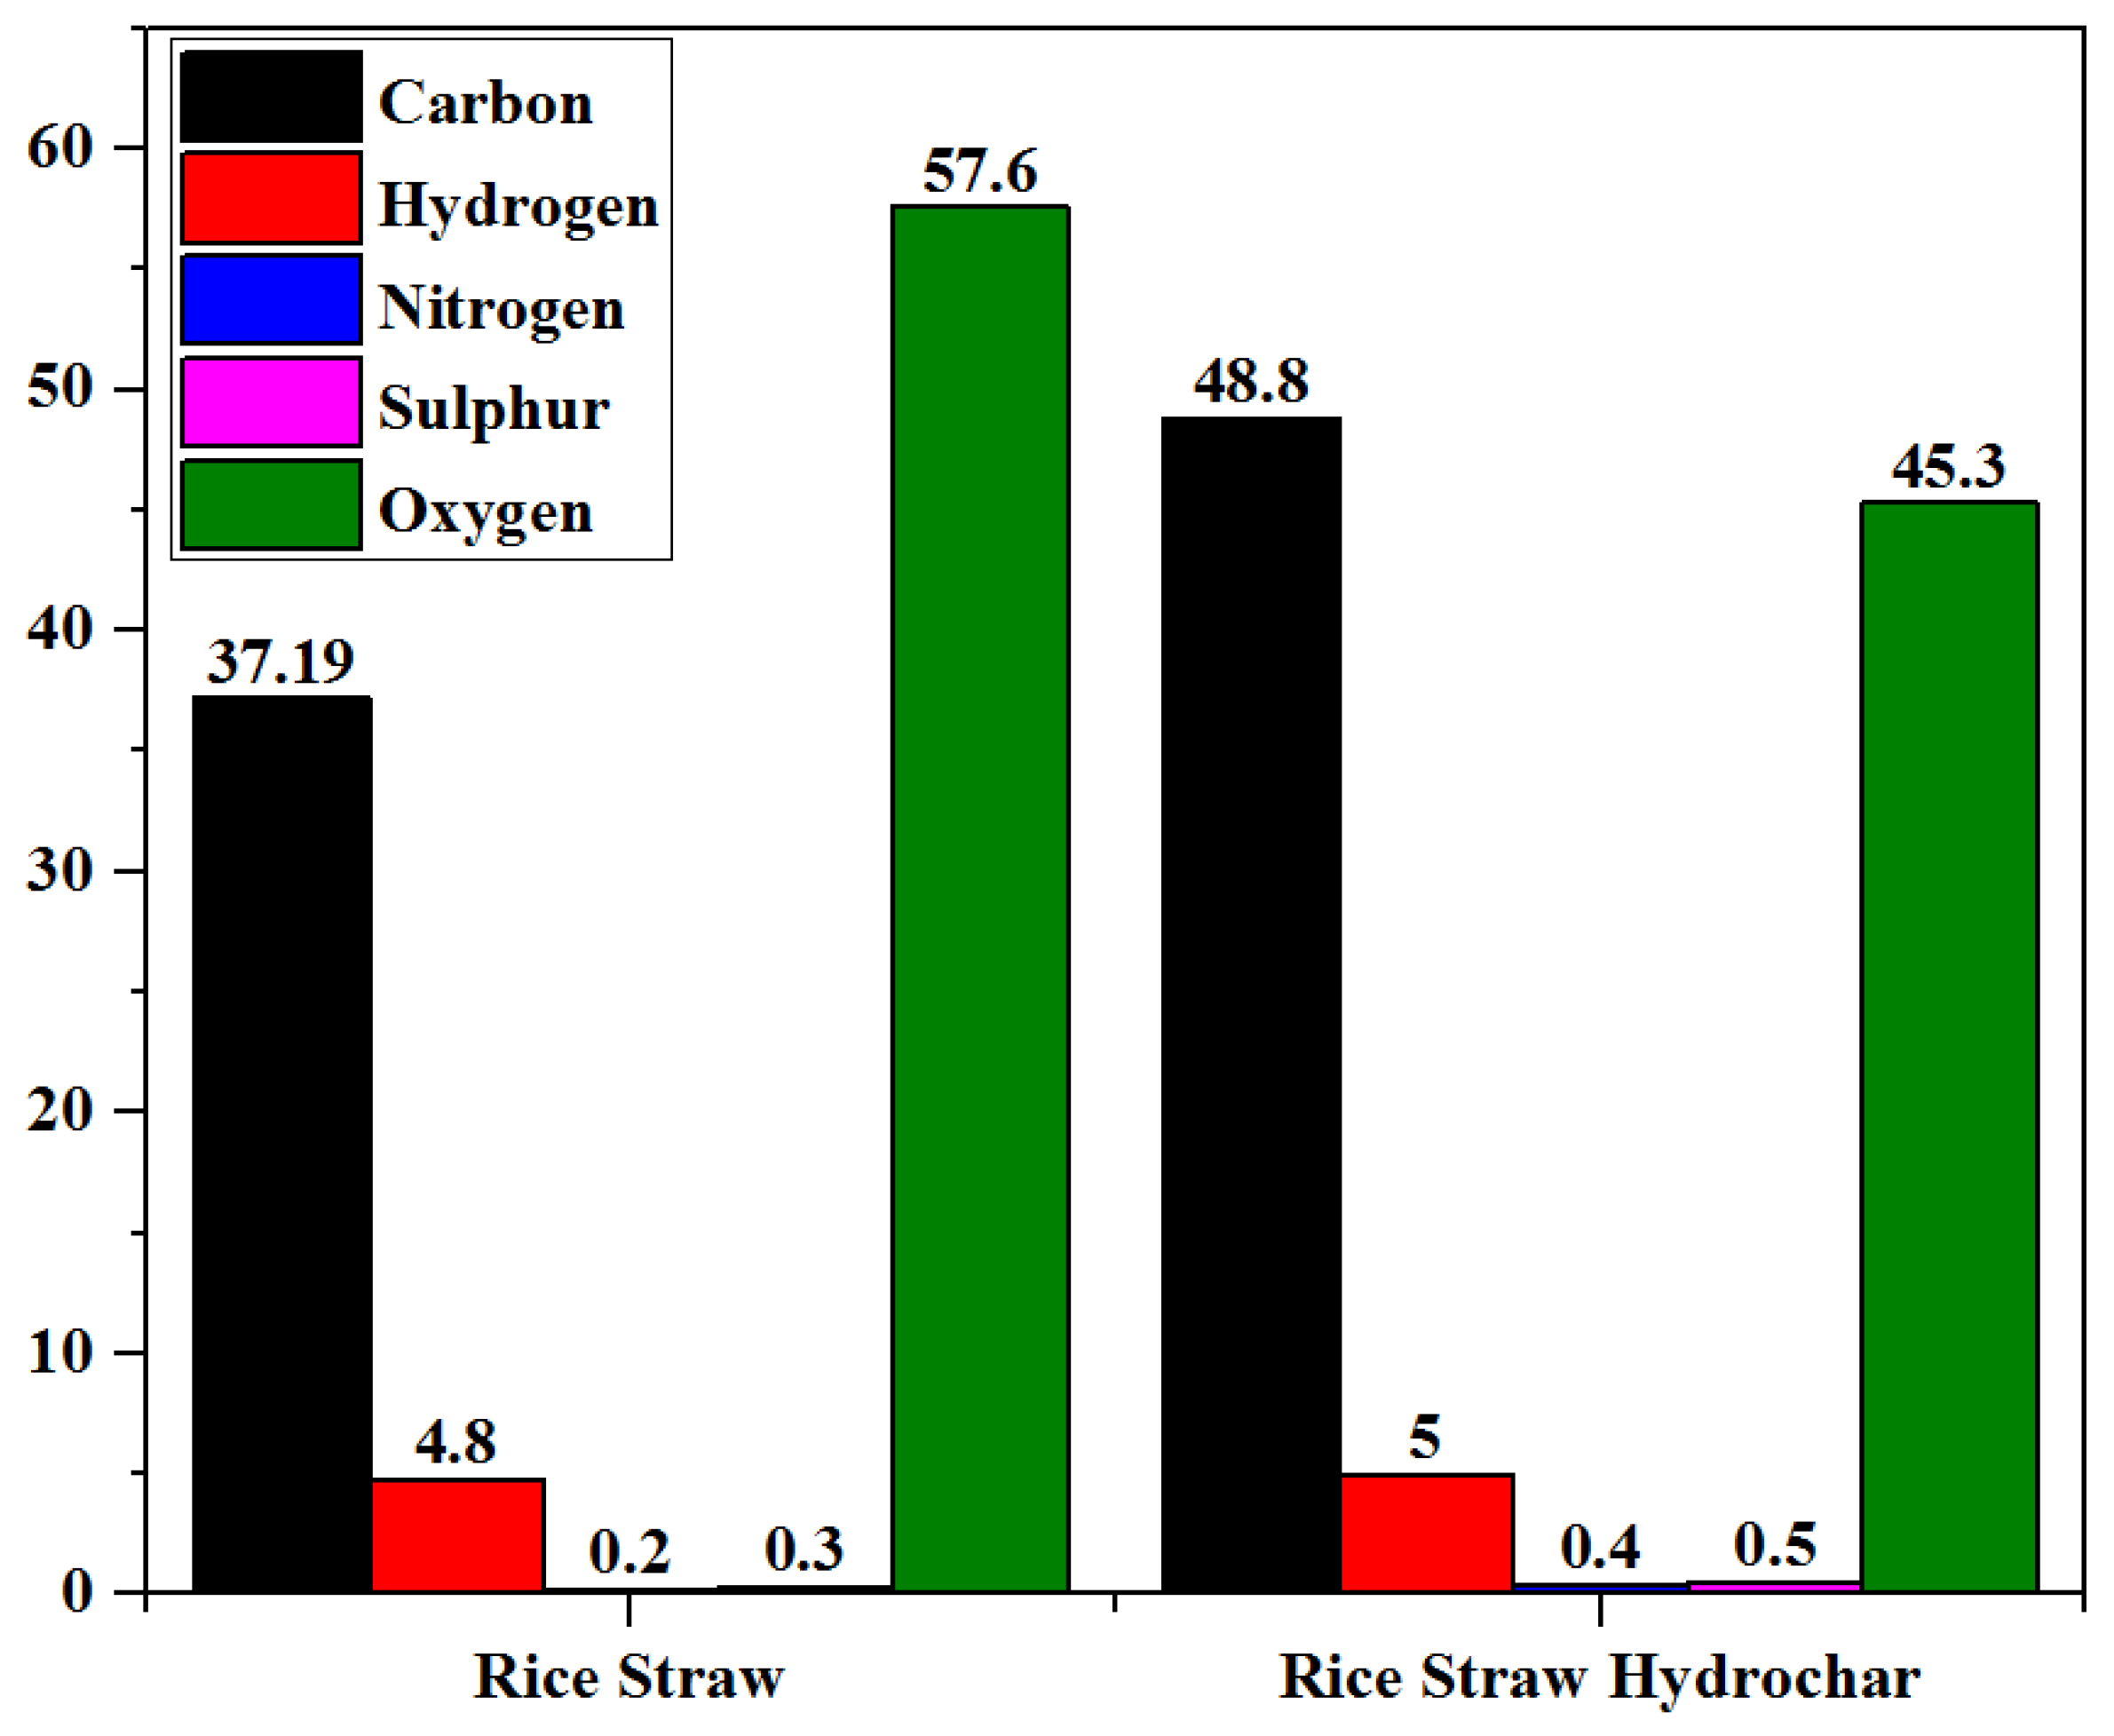
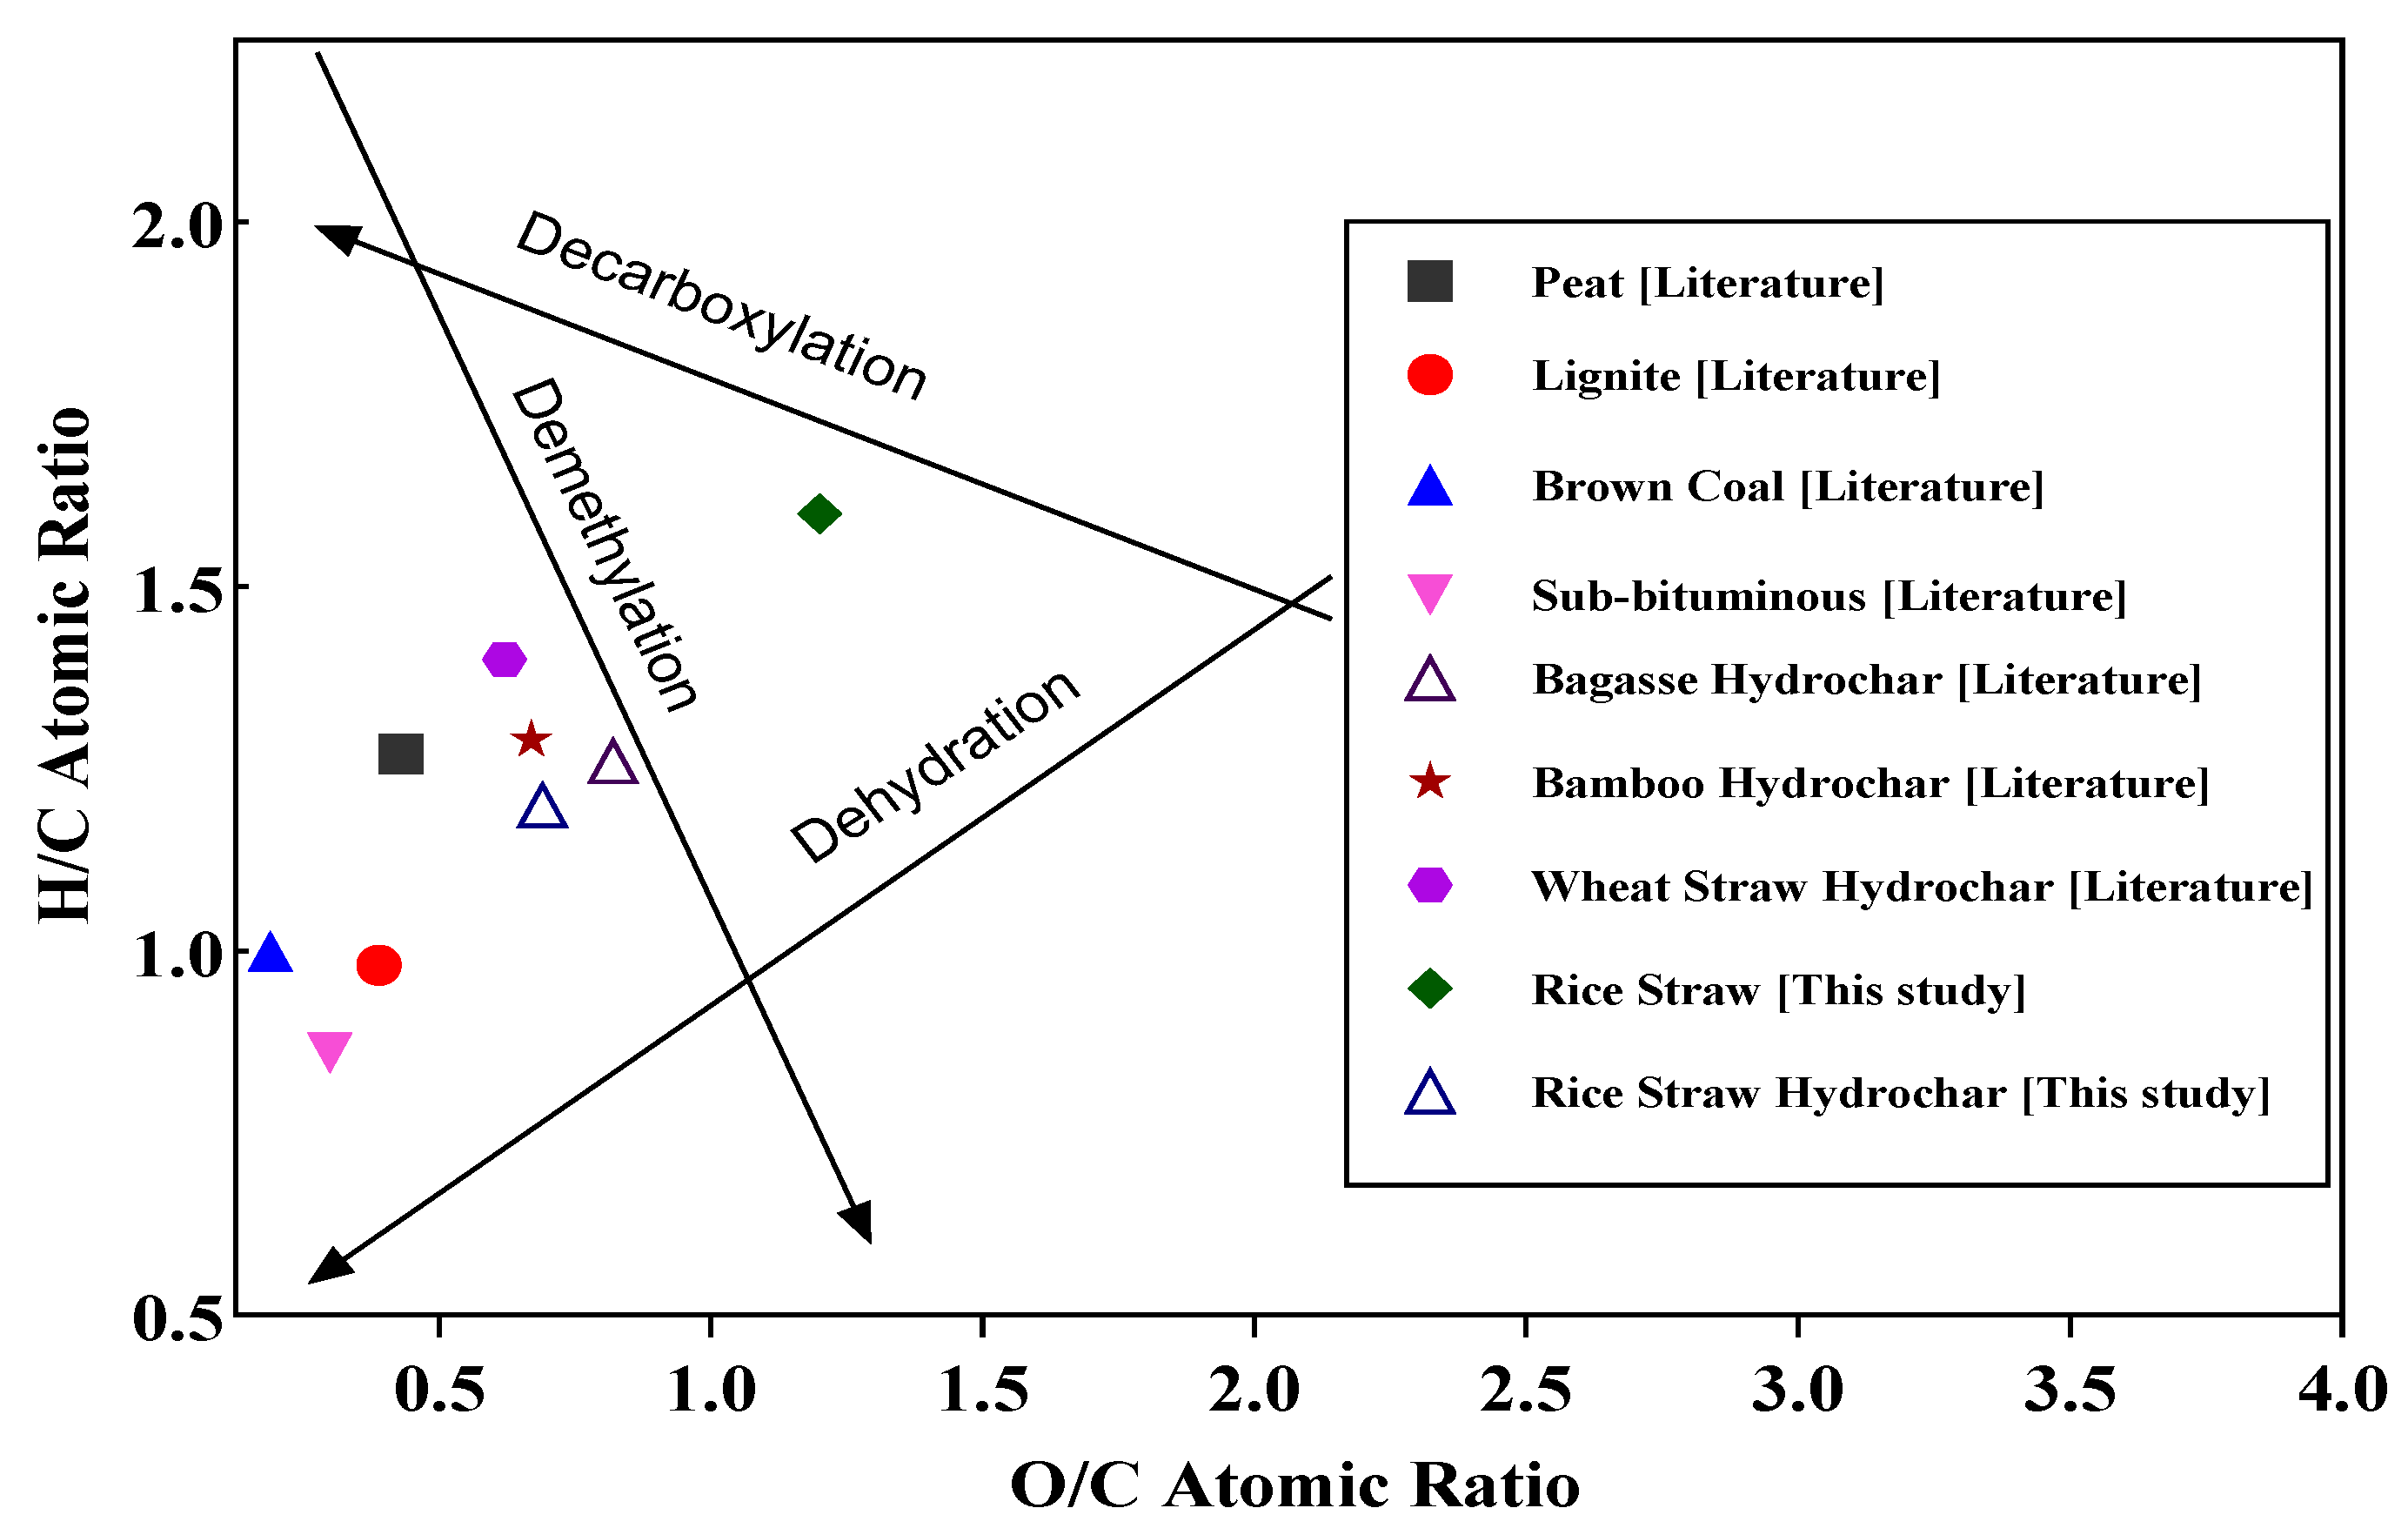
3.2.2. Ultimate Analysis
3.2.3. Proximate Analysis
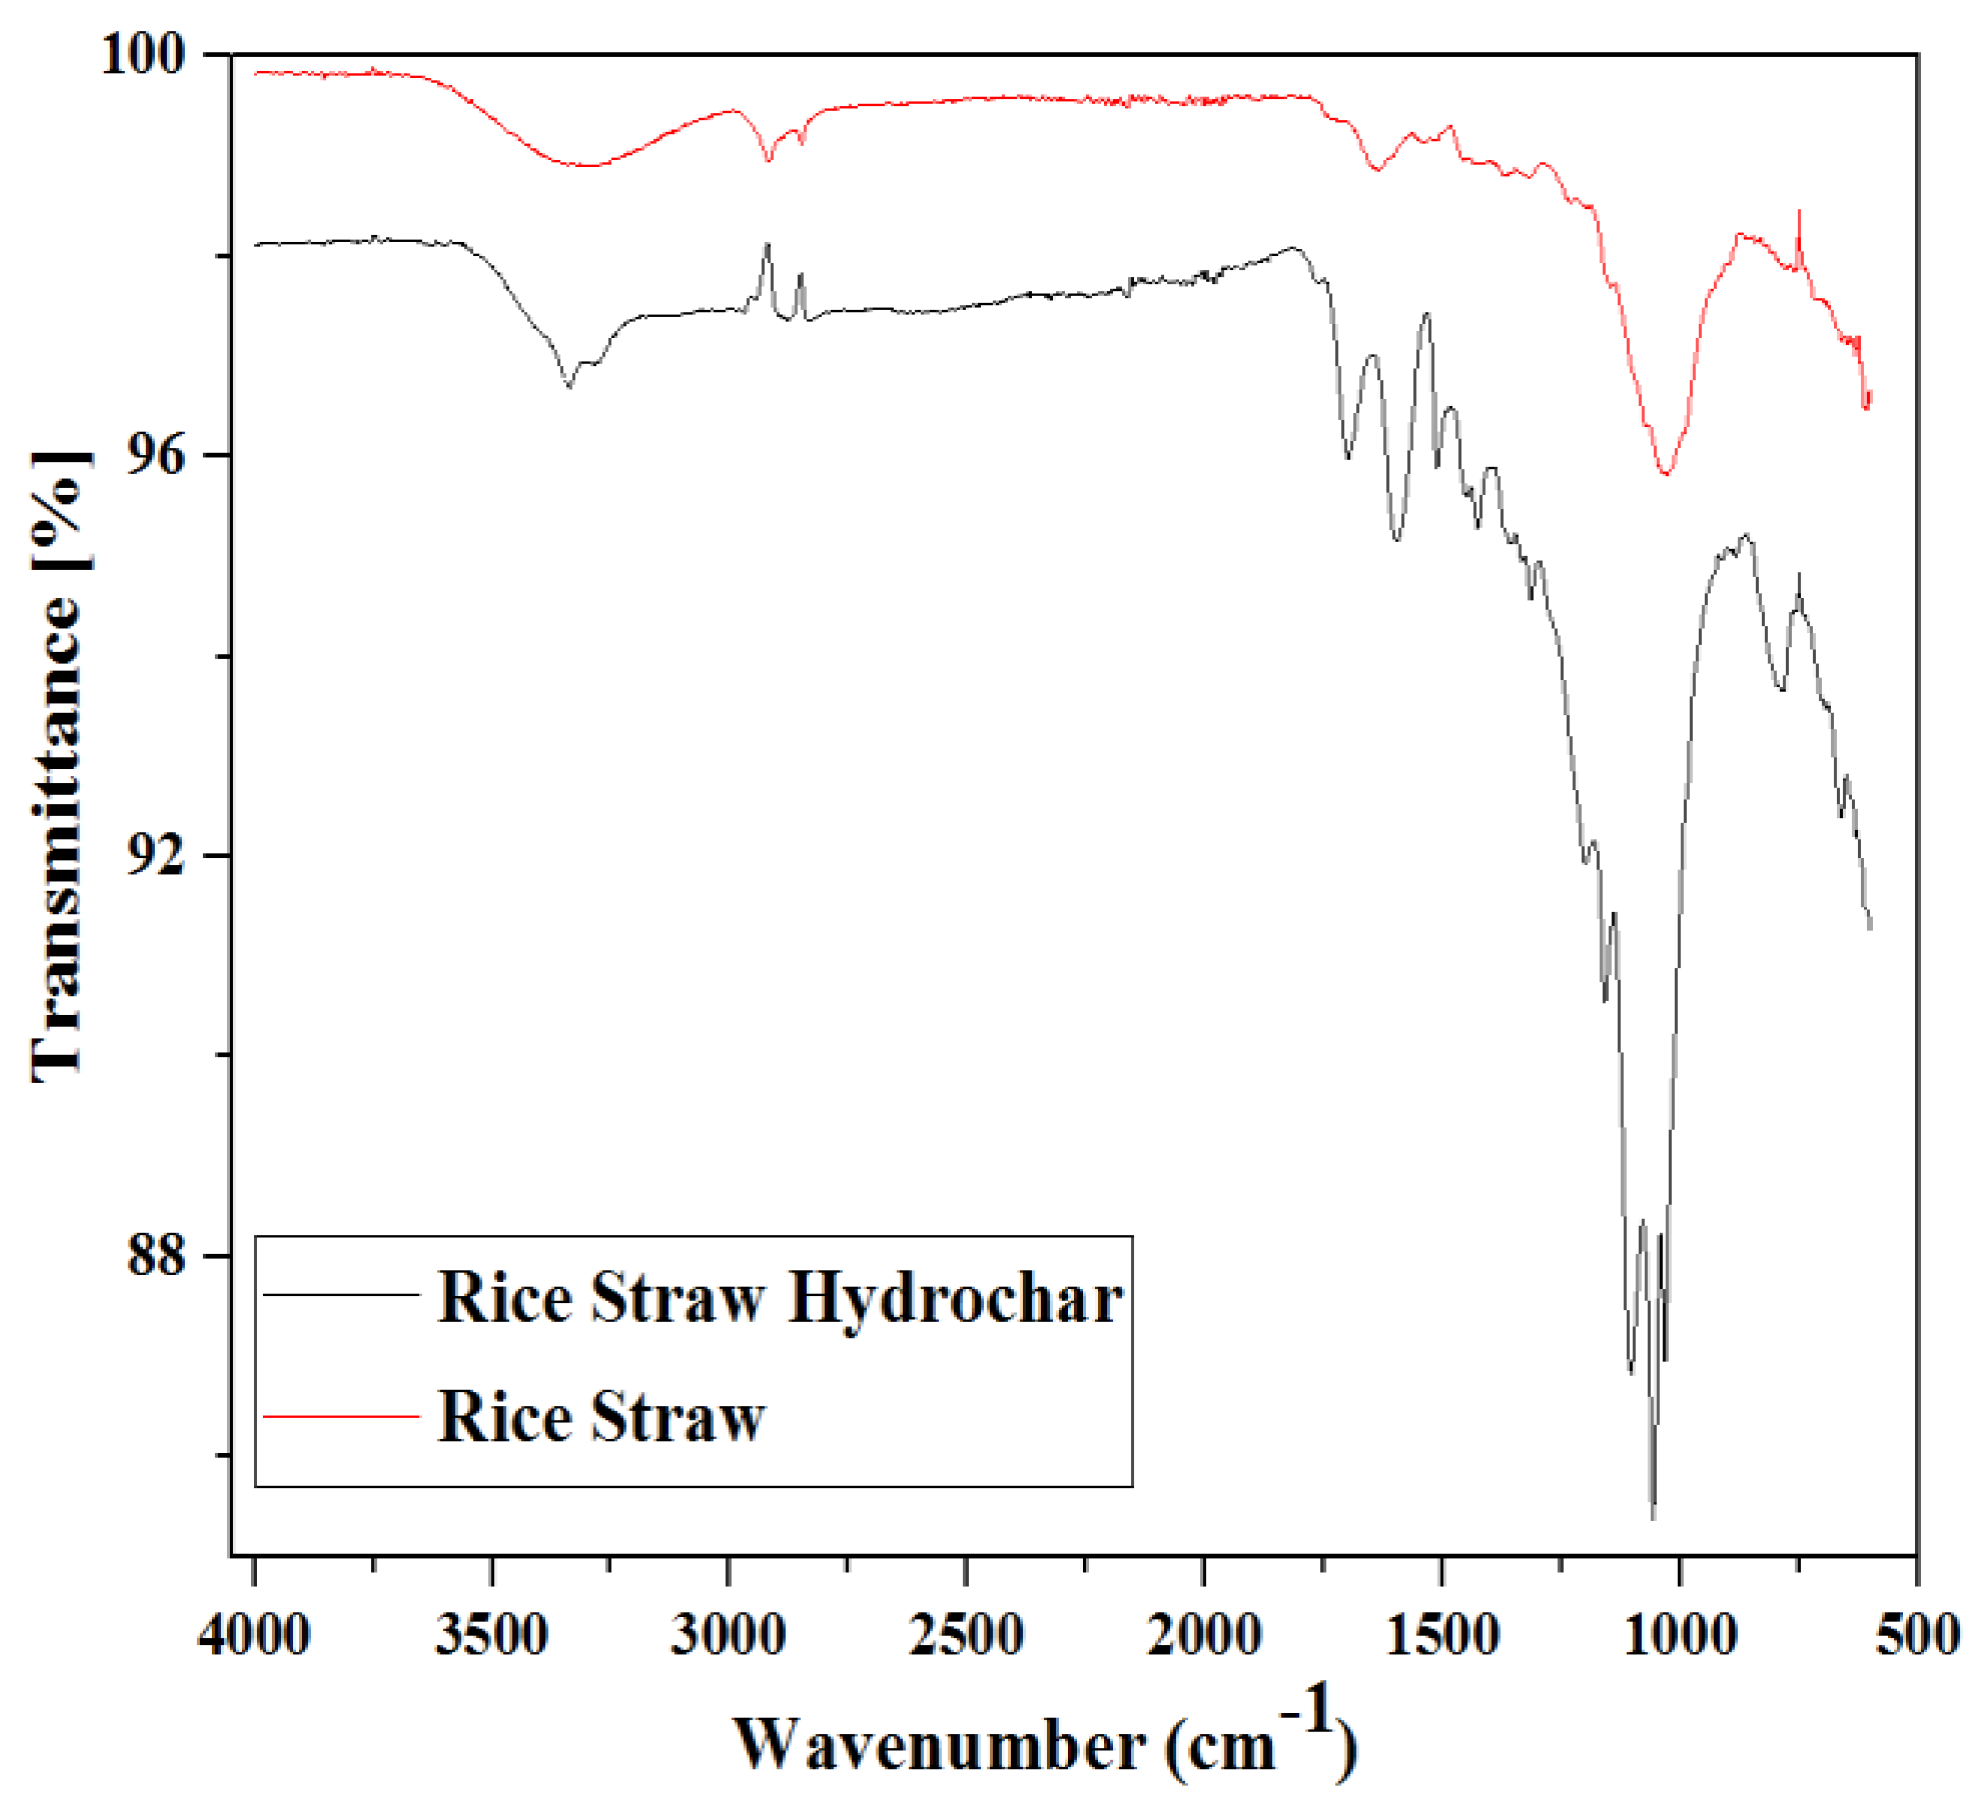
3.2.4. FTIR Analysis
3.2.5. SEM Analysis
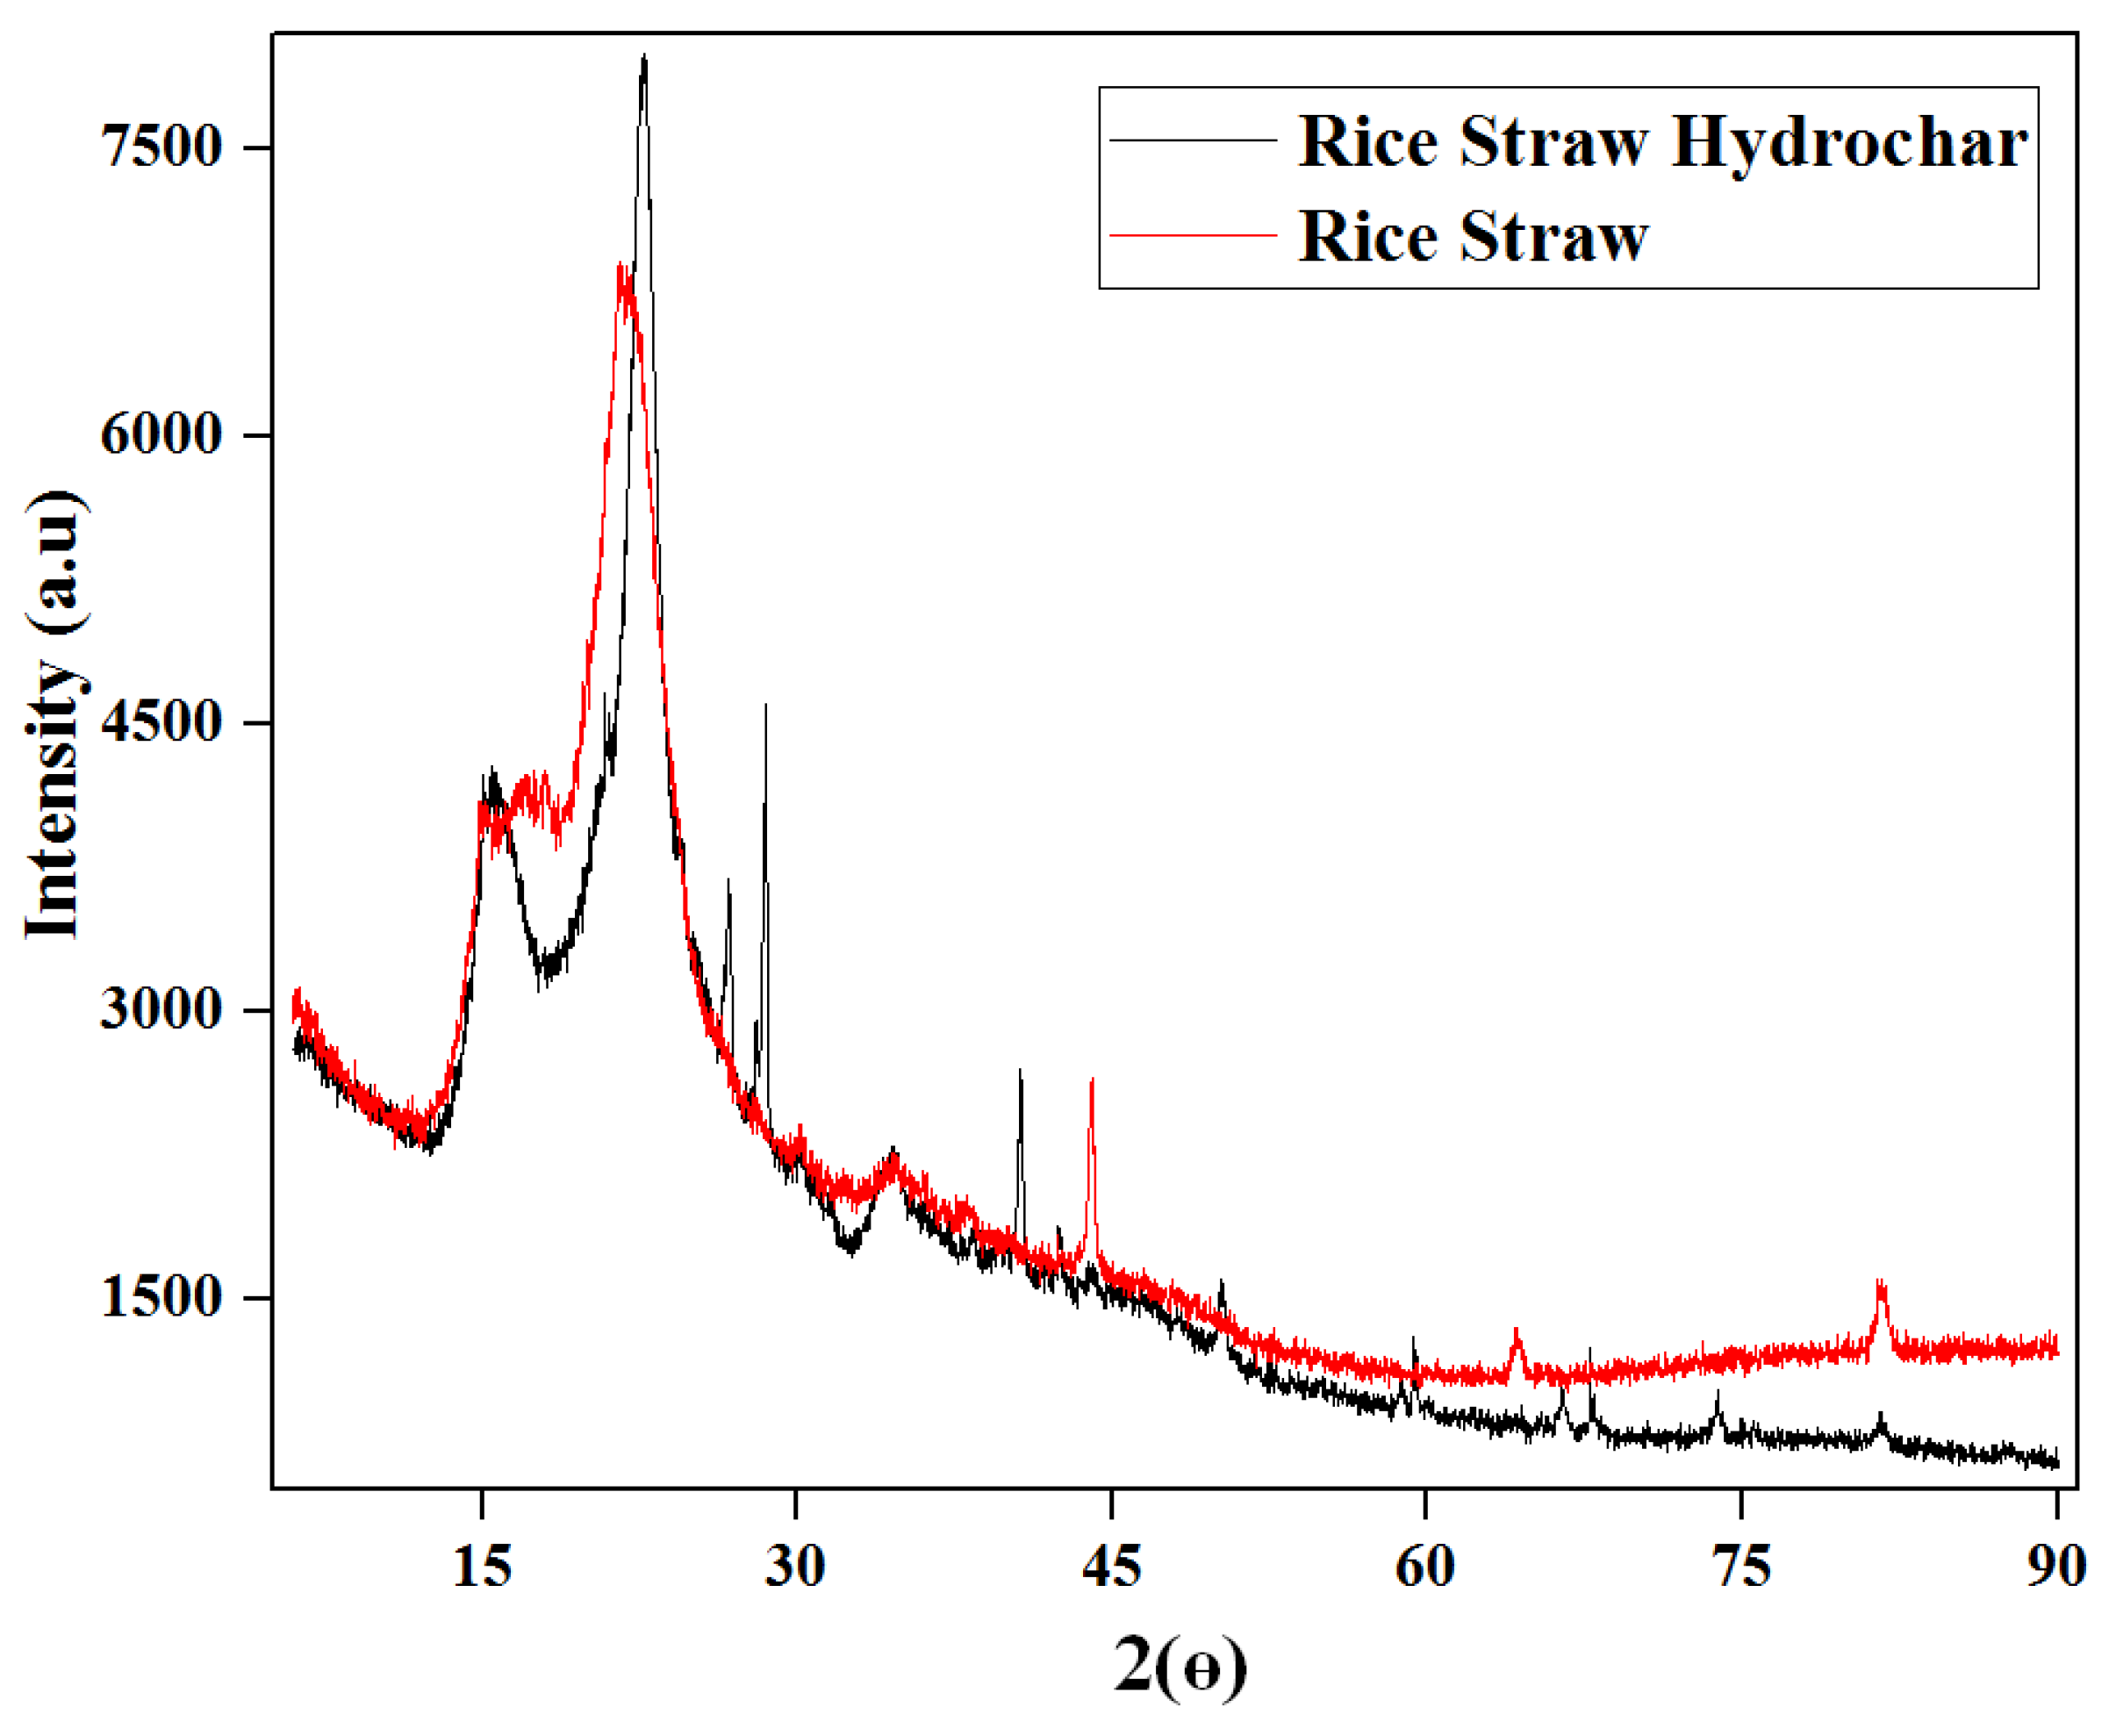
3.2.6. XRD Analysis
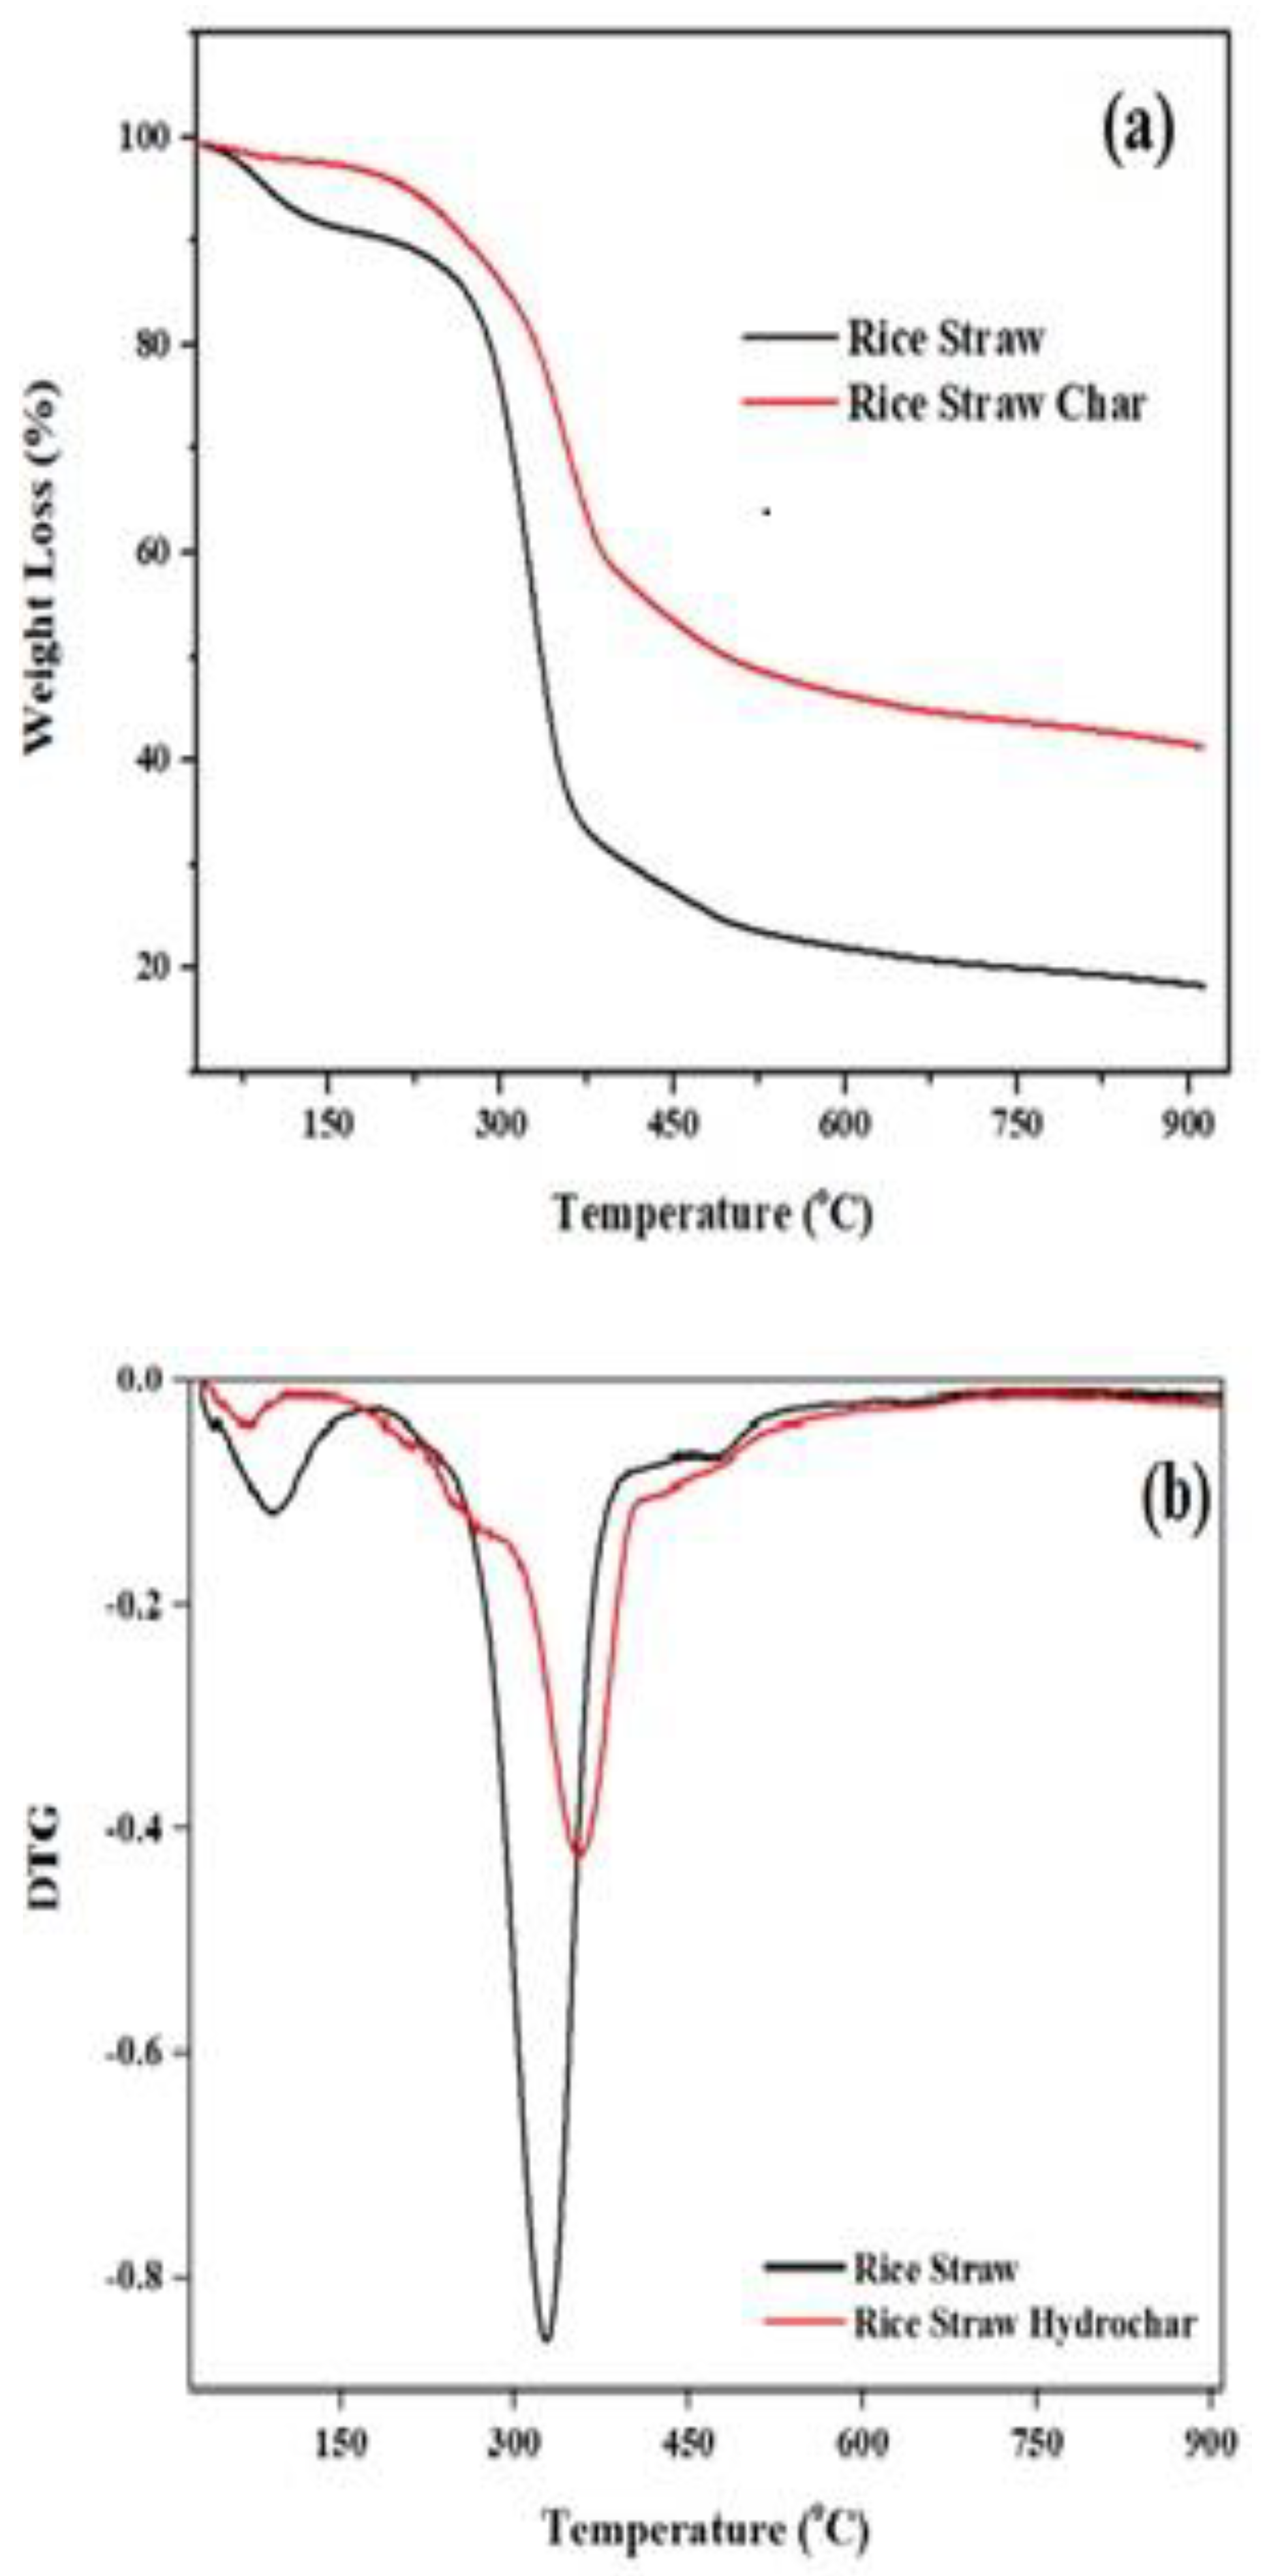
3.2.7. TGA/DTG Analysis
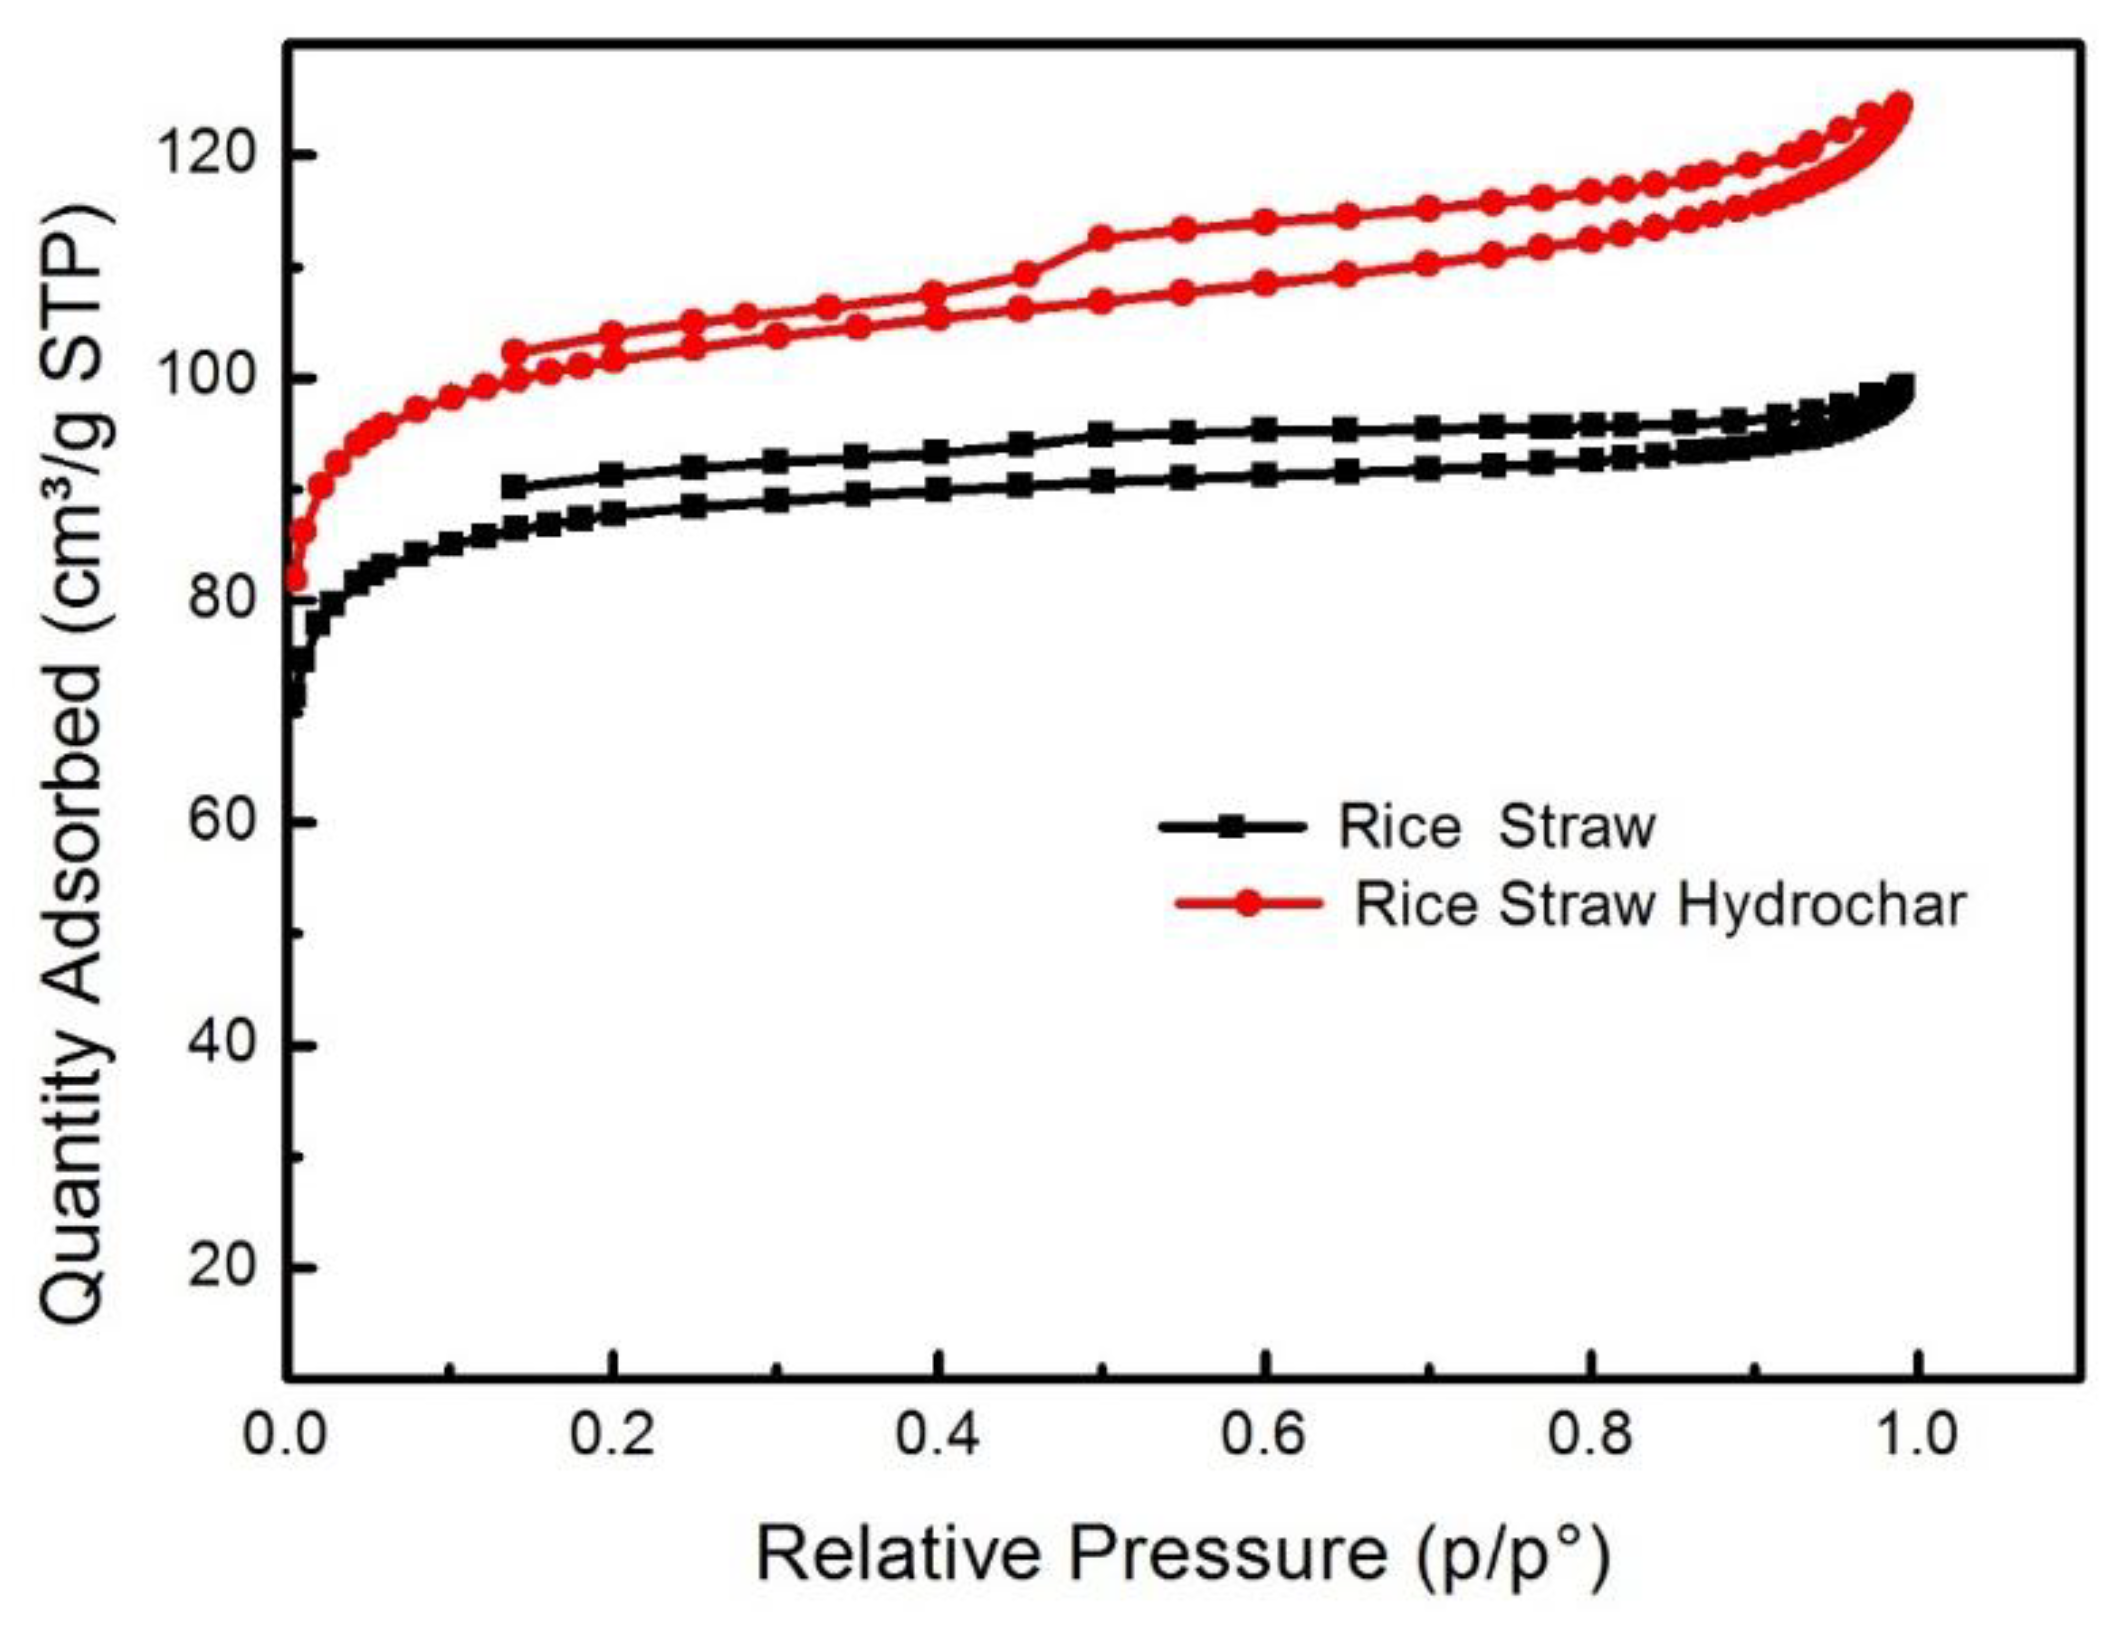
3.2.8. N2 Adsorption/Desorption Isotherm
4. Conclusions
Author Contributions
Funding
Conflicts of Interest
References
- Huang, Y.F.; Kuan, W.; Lo, S.; Lin, C. Total recovery of resources and energy from rice straw using microwave-induced pyrolysis. Bioresour. Technol. 2008, 99, 8252–8258. [Google Scholar] [CrossRef] [PubMed]
- Kadam, K.L.; Forrest, L.H.; Jacobson, W.A. Rice straw as a lignocellulosic resource: Collection, processing, transportation, and environmental aspects. Biomass Bioenergy 2000, 18, 369–389. [Google Scholar] [CrossRef]
- Momayez, F.; Karimi, K.; Karimi, S.; Horváth, I.S. Efficient hydrolysis and ethanol production from rice straw by pretreatment with organic acids and effluent of biogas plant. RSC Adv. 2017, 7, 50537–50545. [Google Scholar] [CrossRef] [Green Version]
- Lehmann, J.; Joseph, S. Biochar for Environmental Management: Science, Technology and Implementation; Routledge: Abingdon, UK, 2015. [Google Scholar]
- Xue, Y.; Gao, B.; Yao, Y.; Inyang, M.; Zhang, M.; Zimmerman, A.R.; Ro, K.S. Hydrogen peroxide modification enhances the ability of biochar (hydrochar) produced from hydrothermal carbonization of peanut hull to remove aqueous heavy metals: Batch and column tests. Chem. Eng. J. 2012, 200, 673–680. [Google Scholar] [CrossRef]
- Gronwald, M.; Don, A.; Tiemeyer, B.; Helfrich, M. Effects of fresh and aged chars from pyrolysis and hydrothermal carbonization on nutrient sorption in agricultural soils. Soil 2015, 1, 475. [Google Scholar] [CrossRef]
- Kang, S.; Ye, J.; Zhang, Y.; Chang, J. Preparation of biomass hydrochar derived sulfonated catalysts and their catalytic effects for 5-hydroxymethylfurfural production. RSC Adv. 2013, 3, 7360–7366. [Google Scholar] [CrossRef]
- Sevilla, M.; Fuertes, A.B. Sustainable porous carbons with a superior performance for CO2 capture. Energy Environ. Sci. 2011, 4, 1765–1771. [Google Scholar] [CrossRef]
- Luz, F.C.; Volpe, M.; Fiori, L.; Manni, A.; Cordiner, S.; Mulone, V.; Rocco, V. Spent coffee enhanced biomethane potential via an integrated hydrothermal carbonization-anaerobic digestion process. Bioresour. Technol. 2018, 256, 102–109. [Google Scholar]
- Brown, A.; McKeogh, B.; Tompsett, G.; Lewis, R.; Deskins, N.; Timko, M. Structural analysis of hydrothermal char and its models by density functional theory simulation of vibrational spectroscopy. Carbon 2017, 125, 614–629. [Google Scholar] [CrossRef]
- Kambo, H.S.; Dutta, A. A comparative review of biochar and hydrochar in terms of production, physico-chemical properties and applications. Renew. Sustain. Energy Rev. 2015, 45, 359–378. [Google Scholar] [CrossRef]
- Mumme, J.; Eckervogt, L.; Pielert, J.; Diakité, M.; Rupp, F.; Kern, J. Hydrothermal carbonization of anaerobically digested maize silage. Bioresour. Technol. 2011, 102, 9255–9260. [Google Scholar] [CrossRef] [PubMed]
- Lin, Y.-C.; Wu, T.-Y.; Liu, W.-Y.; Hsiao, Y.-H. Production of hydrogen from rice straw using microwave-induced pyrolysis. Fuel 2014, 119, 21–26. [Google Scholar] [CrossRef]
- Kannan, S.; Gariepy, Y.; Raghavan, G.V. Optimization and Characterization of Hydrochar Derived from Shrimp Waste. Energy Fuels 2017, 31, 4068–4077. [Google Scholar] [CrossRef]
- Kannan, S.; Gariepy, Y.; Raghavan, G.V. Optimization and characterization of hydrochar produced from microwave hydrothermal carbonization of fish waste. Waste Manag. 2017, 65, 159–168. [Google Scholar] [CrossRef] [PubMed]
- Elaigwu, S.E.; Greenway, G.M. Chemical, structural and energy properties of hydrochars from microwave-assisted hydrothermal carbonization of glucose. Int. J. Ind. Chem. 2016, 7, 449–456. [Google Scholar] [CrossRef] [Green Version]
- Elaigwu, S.E.; Greenway, G.M. Microwave-assisted and conventional hydrothermal carbonization of lignocellulosic waste material: Comparison of the chemical and structural properties of the hydrochars. J. Anal. Appl. Pyrolysis 2016, 118, 1–8. [Google Scholar] [CrossRef]
- Guiotoku, M.; Rambo, C.R.; Hotza, D. Charcoal produced from cellulosic raw materials by microwave-assisted hydrothermal carbonization. J. Therm. Anal. Calorim. 2014, 117, 269–275. [Google Scholar] [CrossRef]
- Afolabi, O.O.; Sohail, M.; Thomas, C. Characterization of solid fuel chars recovered from microwave hydrothermal carbonization of human biowaste. Energy 2017, 134, 74–89. [Google Scholar] [CrossRef] [Green Version]
- Guiotoku, M.; Rambo, C.; Hansel, F.; Magalhaes, W.; Hotza, D. Microwave-assisted hydrothermal carbonization of lignocellulosic materials. Mater. Lett. 2009, 63, 2707–2709. [Google Scholar] [CrossRef]
- Elaigwu, S.E.; Greenway, G.M. Microwave-assisted hydrothermal carbonization of rapeseed husk: A strategy for improving its solid fuel properties. Fuel Process. Technol. 2016, 149, 305–312. [Google Scholar] [CrossRef]
- Afolabi, O.O.; Sohail, M.; Thomas, C. Microwave hydrothermal carbonization of human biowastes. Waste Biomass Valorization 2015, 6, 147–157. [Google Scholar] [CrossRef]
- Nizamuddin, S.; Siddiqui, M.T.H.; Baloch, H.A.; Mubarak, N.M.; Griffin, G.; Madapusi, S.; Tanksale, A. Upgradation of chemical, fuel, thermal, and structural properties of rice husk through microwave-assisted hydrothermal carbonization. Environ. Sci. Pollut. Res. 2018, 25, 17529–17539. [Google Scholar] [CrossRef] [PubMed]
- Nizamuddin, S.; Baloch, H.A.; Siddiqui, M.; Mubarak, N.; Tunio, M.; Bhutto, A.; Jatoi, A.S.; Griffin, G.; Srinivasan, M. An overview of microwave hydrothermal carbonization and microwave pyrolysis of biomass. Rev. Environ. Sci. Bio/Technol. 2018, 17, 813–837. [Google Scholar] [CrossRef]
- Worasuwannarak, N.; Sonobe, T.; Tanthapanichakoon, W. Pyrolysis behaviors of rice straw, rice husk, and corncob by TG-MS technique. J. Anal. Appl. Pyrolysis 2007, 78, 265–271. [Google Scholar] [CrossRef]
- Volpe, M.; Wüst, D.; Merzari, F.; Lucian, M.; Andreottola, G.; Kruse, A.; Fiori, L. One stage olive mill waste streams valorisation via hydrothermal carbonisation. Waste Manag. 2018, 80, 224–234. [Google Scholar] [CrossRef]
- Du, Y.; Schuur, B.; Samorì, C.; Tagliavini, E.; Brilman, D.W.F. Secondary amines as switchable solvents for lipid extraction from non-broken microalgae. Bioresour. Technol. 2013, 149, 253–260. [Google Scholar] [CrossRef]
- Tripathi, M.; Sahu, J.; Ganesan, P.; Jewaratnam, J. Thermophysical characterization of oil palm shell (OPS) and OPS char synthesized by the microwave pyrolysis of OPS. Appl. Therm. Eng. 2016, 105, 605–612. [Google Scholar] [CrossRef]
- Nizamuddin, S.; Mubarak, N.; Tiripathi, M.; Jayakumar, N.; Sahu, J.; Ganesan, P. Chemical, dielectric and structural characterization of optimized hydrochar produced from hydrothermal carbonization of palm shell. Fuel 2016, 163, 88–97. [Google Scholar] [CrossRef]
- Li, M.-F.; Shen, Y.; Sun, J.-K.; Bian, J.; Chen, C.-Z.; Sun, R.-C. Wet torrefaction of bamboo in hydrochloric acid solution by microwave heating. ACS Sustain. Chem. Eng. 2015, 3, 2022–2029. [Google Scholar] [CrossRef]
- Satpathy, S.K.; Tabil, L.G.; Meda, V.; Naik, S.N.; Prasad, R. Torrefaction of wheat and barley straw after microwave heating. Fuel 2014, 124, 269–278. [Google Scholar] [CrossRef]
- Haykiri-Açma, H.; Ersoy-Meriçboyu, A.; Küçükbayrak, S. Combustion reactivity of different rank coals. Energy Convers. Manag. 2002, 43, 459–465. [Google Scholar] [CrossRef]
- Zhao, P.; Shen, Y.; Ge, S.; Yoshikawa, K. Energy recycling from sewage sludge by producing solid biofuel with hydrothermal carbonization. Energy Convers. Manag. 2014, 78, 815–821. [Google Scholar] [CrossRef] [Green Version]
- DEMİRBAŞ, A. Fuel and combustion properties of bio-wastes. Energy Sources 2005, 27, 451–462. [Google Scholar] [CrossRef]
- Khan, A.; De Jong, W.; Jansens, P.; Spliethoff, H. Biomass combustion in fluidized bed boilers: Potential problems and remedies. Fuel Process. Technol. 2009, 90, 21–50. [Google Scholar] [CrossRef]
- Nakason, K.; Panyapinyopol, B.; Kanokkantapong, V.; Viriya-empikul, N.; Kraithong, W.; Pavasant, P. Hydrothermal carbonization of unwanted biomass materials: Effect of process temperature and retention time on hydrochar and liquid fraction. J. Energy Inst. 2018, 91, 786–796. [Google Scholar] [CrossRef]
- Chang, S.H. An overview of empty fruit bunch from oil palm as feedstock for bio-oil production. Biomass Bioenergy 2014, 62, 174–181. [Google Scholar] [CrossRef]
- Lu, Q.; Li, W.-Z.; Zhu, X.-F. Overview of fuel properties of biomass fast pyrolysis oils. Energy Convers. Manag. 2009, 50, 1376–1383. [Google Scholar] [CrossRef]
- Sevilla, M.; Maciá-Agulló, J.A.; Fuertes, A.B. Hydrothermal carbonization of biomass as a route for the sequestration of CO2: Chemical and structural properties of the carbonized products. Biomass Bioenergy 2011, 35, 3152–3159. [Google Scholar] [CrossRef]
- Kang, S.; Li, X.; Fan, J.; Chang, J. Characterization of hydrochars produced by hydrothermal carbonization of lignin, cellulose, D-xylose, and wood meal. Ind. Eng. Chem. Res. 2012, 51, 9023–9031. [Google Scholar] [CrossRef]
- Liu, Z.; Quek, A.; Kent Hoekman, S.; Balasubramanian, R. Production of solid biochar fuel from waste biomass by hydrothermal carbonization. Fuel 2013, 103, 943–949. [Google Scholar] [CrossRef]
- Hoekman, S.K.; Broch, A.; Robbins, C.; Zielinska, B.; Felix, L. Hydrothermal carbonization (HTC) of selected woody and herbaceous biomass feedstocks. Biomass Convers. Biorefinery 2013, 3, 113–126. [Google Scholar] [CrossRef]
- Funke, A.; Ziegler, F. Hydrothermal carbonization of biomass: A summary and discussion of chemical mechanisms for process engineering. Biofuels Bioprod. Biorefin. 2010, 4, 160–177. [Google Scholar] [CrossRef]
- Hoekman, S.K.; Broch, A.; Robbins, C. Hydrothermal carbonization (HTC) of lignocellulosic biomass. Energy Fuels 2011, 25, 1802–1810. [Google Scholar] [CrossRef]
- Ibarra, J.; Munoz, E.; Moliner, R. FTIR study of the evolution of coal structure during the coalification process. Org. Geochem. 1996, 24, 725–735. [Google Scholar] [CrossRef]
- Lin, H.; Wang, S.; Zhang, L.; Ru, B.; Zhou, J.; Luo, Z. Structural evolution of chars from biomass components pyrolysis in a xenon lamp radiation reactor. Chin. J. Chem. Eng. 2017, 25, 232–237. [Google Scholar] [CrossRef]
- Elaigwu, S.E.; Greenway, G.M. Characterization of Energy-Rich Hydrochars from Microwave-Assisted Hydrothermal Carbonization of Coconut Shell. Waste Biomass Valorization 2018, 1–9. [Google Scholar] [CrossRef]
- Liu, Y.; Yuan, X.-Z.; Huang, H.-J.; Wang, X.-L.; Wang, H.; Zeng, G.-M. Thermochemical liquefaction of rice husk for bio-oil production in mixed solvent (ethanol–water). Fuel Process. Technol. 2013, 112, 93–99. [Google Scholar] [CrossRef]
- Pala, M.; Kantarli, I.C.; Buyukisik, H.B.; Yanik, J. Hydrothermal carbonization and torrefaction of grape pomace: A comparative evaluation. Bioresour. Technol. 2014, 161, 255–262. [Google Scholar] [CrossRef] [PubMed]
- Gao, L.; Volpe, M.; Lucian, M.; Fiori, L.; Goldfarb, J.L. Does hydrothermal carbonization as a biomass pretreatment reduce fuel segregation of coal-biomass blends during oxidation? Energy Convers. Manag. 2019, 181, 93–104. [Google Scholar] [CrossRef]
- Nizamuddin, S.; Baloch, H.A.; Mubarak, N.M.; Riaz, S.; Siddiqui, M.; Takkalkar, P.; Tunio, M.; Mazari, S.; Bhutto, A.W. Solvothermal Liquefaction of Corn Stalk: Physico-Chemical Properties of Bio-oil and Biochar. Waste Biomass Valorization 2018, 1–12. [Google Scholar] [CrossRef]
- Smith, A.M.; Singh, S.; Ross, A.B. Fate of inorganic material during hydrothermal carbonisation of biomass: Influence of feedstock on combustion behaviour of hydrochar. Fuel 2016, 169, 135–145. [Google Scholar] [CrossRef] [Green Version]
- Reza, M.T.; Lynam, J.G.; Uddin, M.H.; Coronella, C.J. Hydrothermal carbonization: Fate of inorganics. Biomass Bioenergy 2013, 49, 86–94. [Google Scholar] [CrossRef]
- Vhathvarothai, N.; Ness, J.; Yu, Q.J. An investigation of thermal behaviour of biomass and coal during copyrolysis using thermogravimetric analysis. Int. J. Energy Res. 2014, 38, 1145–1154. [Google Scholar] [CrossRef]
- Buratti, C.; Barbanera, M.; Bartocci, P.; Fantozzi, F. Thermogravimetric analysis of the behavior of sub-bituminous coal and cellulosic ethanol residue during co-combustion. Bioresour. Technol. 2015, 186, 154–162. [Google Scholar] [CrossRef] [PubMed]
- Fu, J.; Wang, J. Enhanced slurryability and rheological behaviors of two low-rank coals by thermal and hydrothermal pretreatments. Powder Technol. 2014, 266, 183–190. [Google Scholar] [CrossRef]
- Becker, A.; Schiemann, M.; Heuer, S.; Vorobiev, N.; Scherer, V.; Haxter, D. A standardized method for the characterization of coal ignition under oxyfuel conditions. In Proceedings of the 32nd Pittsburgh Coal Conference, Pittsburgh, PA, USA, 5–8 October 2015; pp. 1–12. [Google Scholar]
- Ofori-Boateng, C.; Lee, K.T.; Saad, B. A biorefinery concept for simultaneous recovery of cellulosic ethanol and phenolic compounds from oil palm fronds: Process optimization. Energy Convers. Manag. 2014, 81, 192–200. [Google Scholar] [CrossRef]
- Chadwick, D.T.; McDonnell, K.P.; Brennan, L.P.; Fagan, C.C.; Everard, C.D. Evaluation of infrared techniques for the assessment of biomass and biofuel quality parameters and conversion technology processes: A review. Renew. Sustain. Energy Rev. 2014, 30, 672–681. [Google Scholar] [CrossRef]
- Gao, Y.; Wang, X.; Wang, J.; Li, X.; Cheng, J.; Yang, H.; Chen, H. Effect of residence time on chemical and structural properties of hydrochar obtained by hydrothermal carbonization of water hyacinth. Energy 2013, 58, 376–383. [Google Scholar] [CrossRef]
- Asadieraghi, M.; Wan Daud, W.M.A. Characterization of lignocellulosic biomass thermal degradation and physiochemical structure: Effects of demineralization by diverse acid solutions. Energy Convers. Manag. 2014, 82, 71–82. [Google Scholar] [CrossRef]
- Shin, S.; Jang, J.; Yoon, S.-H.; Mochida, I. A study on the effect of heat treatment on functional groups of pitch based activated carbon fiber using FTIR. Carbon 1997, 35, 1739–1743. [Google Scholar] [CrossRef]
- Mäkelä, M.; Volpe, M.; Volpe, R.; Fiori, L.; Dahl, O. Spatially resolved spectral determination of polysaccharides in hydrothermally carbonized biomass. Green Chem. 2018, 20, 1114–1120. [Google Scholar] [CrossRef] [Green Version]
- Marx, S.; Chiyanzu, I.; Piyo, N. Influence of reaction atmosphere and solvent on biochar yield and characteristics. Bioresour. Technol. 2014, 164, 177–183. [Google Scholar] [CrossRef] [PubMed]
- Titirici, M.-M. Hydrothermal carbons: Synthesis, characterization, and applications. In Novel Carbon Adsorbents; Elsevier: New York, NY, USA, 2012; pp. 351–399. [Google Scholar]
- Zhang, L.; Wang, Q.; Wang, B.; Yang, G.; Lucia, L.A.; Chen, J. Hydrothermal carbonization of corncob residues for hydrochar production. Energy Fuels 2015, 29, 872–876. [Google Scholar] [CrossRef]
- Maeda, R.N.; Serpa, V.I.; Rocha, V.A.L.; Mesquita, R.A.A.; Santa Anna, L.M.M.; De Castro, A.M.; Driemeier, C.E.; Pereira, N.; Polikarpov, I. Enzymatic hydrolysis of pretreated sugar cane bagasse using Penicillium funiculosum and Trichoderma harzianum cellulases. Process Biochem. 2011, 46, 1196–1201. [Google Scholar] [CrossRef] [Green Version]
- Liu, F.; Yu, R.; Guo, M. Hydrothermal carbonization of forestry residues: Influence of reaction temperature on holocellulose-derived hydrochar properties. J. Mater. Sci. 2017, 52, 1736–1746. [Google Scholar] [CrossRef]
- Li, W.; Yang, K.; Peng, J.; Zhang, L.; Guo, S.; Xia, H. Effects of carbonization temperatures on characteristics of porosity in coconut shell chars and activated carbons derived from carbonized coconut shell chars. Ind. Crops Prod. 2008, 28, 190–198. [Google Scholar] [CrossRef]
- Álvarez-Murillo, A.; Ledesma, B.; Román, S.; Sabio, E.; Gañán, J. Biomass pyrolysis toward hydrocarbonization. Influence on subsequent steam gasification processes. J. Anal. Appl. Pyrolysis 2015, 113, 380–389. [Google Scholar] [CrossRef]
- Islam, M.A.; Kabir, G.; Asif, M.; Hameed, B. Combustion kinetics of hydrochar produced from hydrothermal carbonisation of Karanj (Pongamia pinnata) fruit hulls via thermogravimetric analysis. Bioresour. Technol. 2015, 194, 14–20. [Google Scholar] [CrossRef]


| Factor | Unit | High Coded | Low Coded | High | Low |
|---|---|---|---|---|---|
| Temperature (A) | °C | 1 | −1 | 220 | 180 |
| Time (B) | min | 1 | −1 | 60 | 20 |
| Particle Size (C) | mm | 1 | −1 | 3 | 1 |
| Biomass to Water Ratio (D) | w/v | 1 | −1 | 1:15 | 1:5 |
| Std | Run | Factor (A) | Factor (B) | Factor (C) | Factor (D) | Response (Yield%) |
|---|---|---|---|---|---|---|
| 24 | 1 | 220 | 20 | 1 | 1:5 | 40.1 |
| 5 | 2 | 180 | 60 | 2 | 1:15 | 55.1 |
| 10 | 3 | 220 | 20 | 1 | 1:5 | 39.55 |
| 21 | 4 | 180 | 40 | 3 | 1:5 | 55.5 |
| 8 | 5 | 180 | 40 | 3 | 1:5 | 55.43 |
| 14 | 6 | 220 | 20 | 3 | 1:5 | 40.56 |
| 15 | 7 | 200 | 40 | 1 | 1:15 | 44.63 |
| 16 | 8 | 220 | 60 | 1 | 1:5 | 38.2 |
| 13 | 9 | 200 | 20 | 2 | 1:5 | 45.74 |
| 18 | 10 | 200 | 40 | 3 | 1:15 | 45.5 |
| 17 | 11 | 200 | 40 | 2 | 1:5 | 45.12 |
| 12 | 12 | 180 | 20 | 1 | 1:10 | 56.7 |
| 3 | 13 | 180 | 60 | 1 | 1:5 | 54.8 |
| 11 | 14 | 220 | 40 | 2 | 1:10 | 38.9 |
| 19 | 15 | 200 | 20 | 3 | 1:10 | 46.86 |
| 1 | 16 | 220 | 60 | 3 | 1:5 | 38.56 |
| 6 | 17 | 220 | 20 | 1 | 1:15 | 39.98 |
| 7 | 18 | 180 | 20 | 3 | 1:15 | 57.89 |
| 9 | 19 | 220 | 60 | 3 | 1:15 | 38.12 |
| 25 | 20 | 180 | 60 | 2 | 1:15 | 54.93 |
| 22 | 21 | 200 | 20 | 2 | 1:5 | 46.73 |
| 23 | 22 | 220 | 20 | 1 | 1:15 | 40.21 |
| 4 | 23 | 200 | 60 | 3 | 1:10 | 42.6 |
| 2 | 24 | 220 | 60 | 1 | 1:15 | 37.95 |
| 20 | 25 | 220 | 20 | 3 | 1:15 | 40.45 |
| Source | Sum of Squares | DF | Mean Square | F Value | Prob > F | Status |
|---|---|---|---|---|---|---|
| Model | 1184.857 | 14 | 84.63266 | 396.0004 | <0.0001 | significant |
| (A) Temperature | 1032.732 | 1 | 1032.732 | 4832.204 | <0.0001 | |
| (B) Time | 23.87823 | 1 | 23.87823 | 111.7274 | <0.0001 | |
| (C) Particle Size | 0.148824 | 1 | 0.148824 | 0.696356 | 0.4235 | |
| (D) Water to Biomass | 0.291942 | 1 | 0.291942 | 1.366012 | 0.2696 | |
| AB | 0.350942 | 1 | 0.350942 | 1.642077 | 0.2290 | |
| AC | 0.180202 | 1 | 0.180202 | 0.843175 | 0.3801 | |
| AD | 0.327317 | 1 | 0.327317 | 1.531533 | 0.2442 | |
| BC | 0.645949 | 1 | 0.645949 | 3.022428 | 0.1128 | |
| BD | 0.202082 | 1 | 0.202082 | 0.945552 | 0.3538 | |
| CD | 0.00162 | 1 | 0.00162 | 0.007578 | 0.9323 | |
| A2 | 24.85305 | 1 | 24.85305 | 116.2886 | <0.0001 | |
| B2 | 0.054034 | 1 | 0.054034 | 0.252827 | 0.6260 | |
| C2 | 0.210648 | 1 | 0.210648 | 0.985632 | 0.3442 | |
| D2 | 0.583457 | 1 | 0.583457 | 2.730023 | 0.1295 | |
| Residual | 2.137186 | 10 | 0.213719 | |||
| Lack of Fit | 1.452536 | 5 | 0.290507 | 2.121575 | 0.2143 | not significant |
| Pure Error | 0.68465 | 5 | 0.13693 | |||
| Cor Total | 1186.994 | 24 | ||||
| Materials | HHV (MJ/kg) | References |
|---|---|---|
| Rice Straw | 12.3 | This Study |
| Rice Straw Hydrochar | 17.6 | This Study |
| Bamboo Hydrochar | 17.2 | [30] |
| Barley Straw Hydrochar | 17.8 | [31] |
| Wheat Straw Hydrochar | 17.9 | [31] |
| Rapeseed Husk Hydrochar | 21.6 | [21] |
| Lignite Coal | 16.9 | [32] |
| Peat | 15.4 | [32] |
| Materials | Moisture (%) | Fixed Carbon (%) | Volatile Matters (%) | Ash (%) | References |
|---|---|---|---|---|---|
| Rice Straw | 8.53 | 14.37 | 70.20 | 6.9 | This study |
| Rice Straw Hydrochar | 2.5 | 35.4 | 45.6 | 16.5 | This study |
| Australian Bituminous Coal | 3.8 | 33.0 | 39.6 | 23.6 | [54] |
| Indonesian Subbituminous Coal | - | 46.8 | 50.2 | 28.7 | [55] |
| Chinese Lignite Coal | 8.1 | 26.7 | 50.1 | 23.2 | [56] |
| Chinese Bituminous Coal | 13.5 | 59.7 | 31.4 | 8.9 | [56] |
| South African Coal | - | 56.1 | 25.8 | 18.0 | [57] |
© 2019 by the authors. Licensee MDPI, Basel, Switzerland. This article is an open access article distributed under the terms and conditions of the Creative Commons Attribution (CC BY) license (http://creativecommons.org/licenses/by/4.0/).
Share and Cite
Nizamuddin, S.; Qureshi, S.S.; Baloch, H.A.; Siddiqui, M.T.H.; Takkalkar, P.; Mubarak, N.M.; Dumbre, D.K.; Griffin, G.J.; Madapusi, S.; Tanksale, A. Microwave Hydrothermal Carbonization of Rice Straw: Optimization of Process Parameters and Upgrading of Chemical, Fuel, Structural and Thermal Properties. Materials 2019, 12, 403. https://doi.org/10.3390/ma12030403
Nizamuddin S, Qureshi SS, Baloch HA, Siddiqui MTH, Takkalkar P, Mubarak NM, Dumbre DK, Griffin GJ, Madapusi S, Tanksale A. Microwave Hydrothermal Carbonization of Rice Straw: Optimization of Process Parameters and Upgrading of Chemical, Fuel, Structural and Thermal Properties. Materials. 2019; 12(3):403. https://doi.org/10.3390/ma12030403
Chicago/Turabian StyleNizamuddin, Sabzoi, Sundus Saeed Qureshi, Humair Ahmed Baloch, Muhammad Tahir Hussain Siddiqui, Pooja Takkalkar, Nabisab Mujawar Mubarak, Deepa K. Dumbre, Gregory J. Griffin, Srinivasan Madapusi, and Akshat Tanksale. 2019. "Microwave Hydrothermal Carbonization of Rice Straw: Optimization of Process Parameters and Upgrading of Chemical, Fuel, Structural and Thermal Properties" Materials 12, no. 3: 403. https://doi.org/10.3390/ma12030403