Application of a New, Energy-Based ΔS* Crack Driving Force for Fatigue Crack Growth Rate Description


Faculty of Mechanical Engineering, Department of Mechanics, Materials Science and Engineering, Wroclaw University of Science and Technology, PL-50370 Wrocław, Poland
Materials 2019, 12(3), 518; https://doi.org/10.3390/ma12030518
Submission received: 31 December 2018
/
Revised: 4 February 2019
/
Accepted: 7 February 2019
/
Published: 9 February 2019
(This article belongs to the Special Issue Advanced Approaches Applied to Materials Development and Design Predictions)
Abstract
:This paper presents the problem of the description of fatigue cracking development in metallic constructional materials. Fatigue crack growth models (mostly empirical) are usually constructed using a stress intensity factor ΔK in linear-elastic fracture mechanics. Contrary to the kinetic fatigue fracture diagrams (KFFDs) based on stress intensity factor K, new energy KFFDs show no sensitivity to mean stress effect expressed by the stress ratio R. However, in the literature there is a lack of analytical description and interpretation of this parameter in order to promote this approach in engineering practice. Therefore, based on a dimensional analysis approach, ΔH is replaced by elastic-plastic fracture mechanics parameter—the ΔJ-integral range. In this case, the invariance from stress is not clear. Hence, the main goal of this paper is the application of the new averaged (geometrically) strain energy density parameter ΔS* based on the relationship of the maximal value of J integral and its range ΔJ. The usefulness and invariance of this parameter have been confirmed for three different metallic materials, 10HNAP, 18G2A, and 19th century puddle iron from the Eiffel bridge.
1. Introduction
Fatigue and fatigue cracking are the two main (more than 70% of all failures) phenomena responsible for the process of destroying steel structures. The fatigue crack growth phase is an essential process for the long-term operating structures subjected to cyclic loading. A fatigue crack may be formed either as a result of the accumulation of fatigue damage (intrusions and extrusions) or as a result of manufacturing processes. The appearance of fatigue cracks can also be the result of unfavorable operating conditions. The mere fact that a crack exists does not necessarily (anymore) mean that such an element (still referred to as metallic construction materials) has to be eliminated from service. The period of precritical fatigue crack growth can be expressed in a general way using an integral:
where: Ncr is precritical fatigue crack growth period, ao is the crack length, acr is the critical crack length, σext is the external load, Pfc is the fracture mechanics parameter, the so-called crack driving force (CDF), Y is the geometric constraint, and R (σmin/σmax) is the stress ratio.
In the case of static loads, it is crucial to determine the critical load that triggers the avalanche development of the crack or to look for the critical length of the crack at which the element will continue to carry the assumed load. For safety reasons, an important issue is to determine the subcritical time of fatigue crack development under cyclic loading condition. According to the above, it is necessary to solve Equation (1) with known boundary conditions. However, in this case, it is crucial to provide a fatigue crack growth law that is as robust as possible. In the 1960s, Paris [1] correlated a quantity derived from classical fracture mechanics—ΔK stress intensity factor range (SIF)—with the fatigue crack growth rate from experimental data. Paris proposed this relationship in the form of a power-law function—known in the literature as the Paris law:
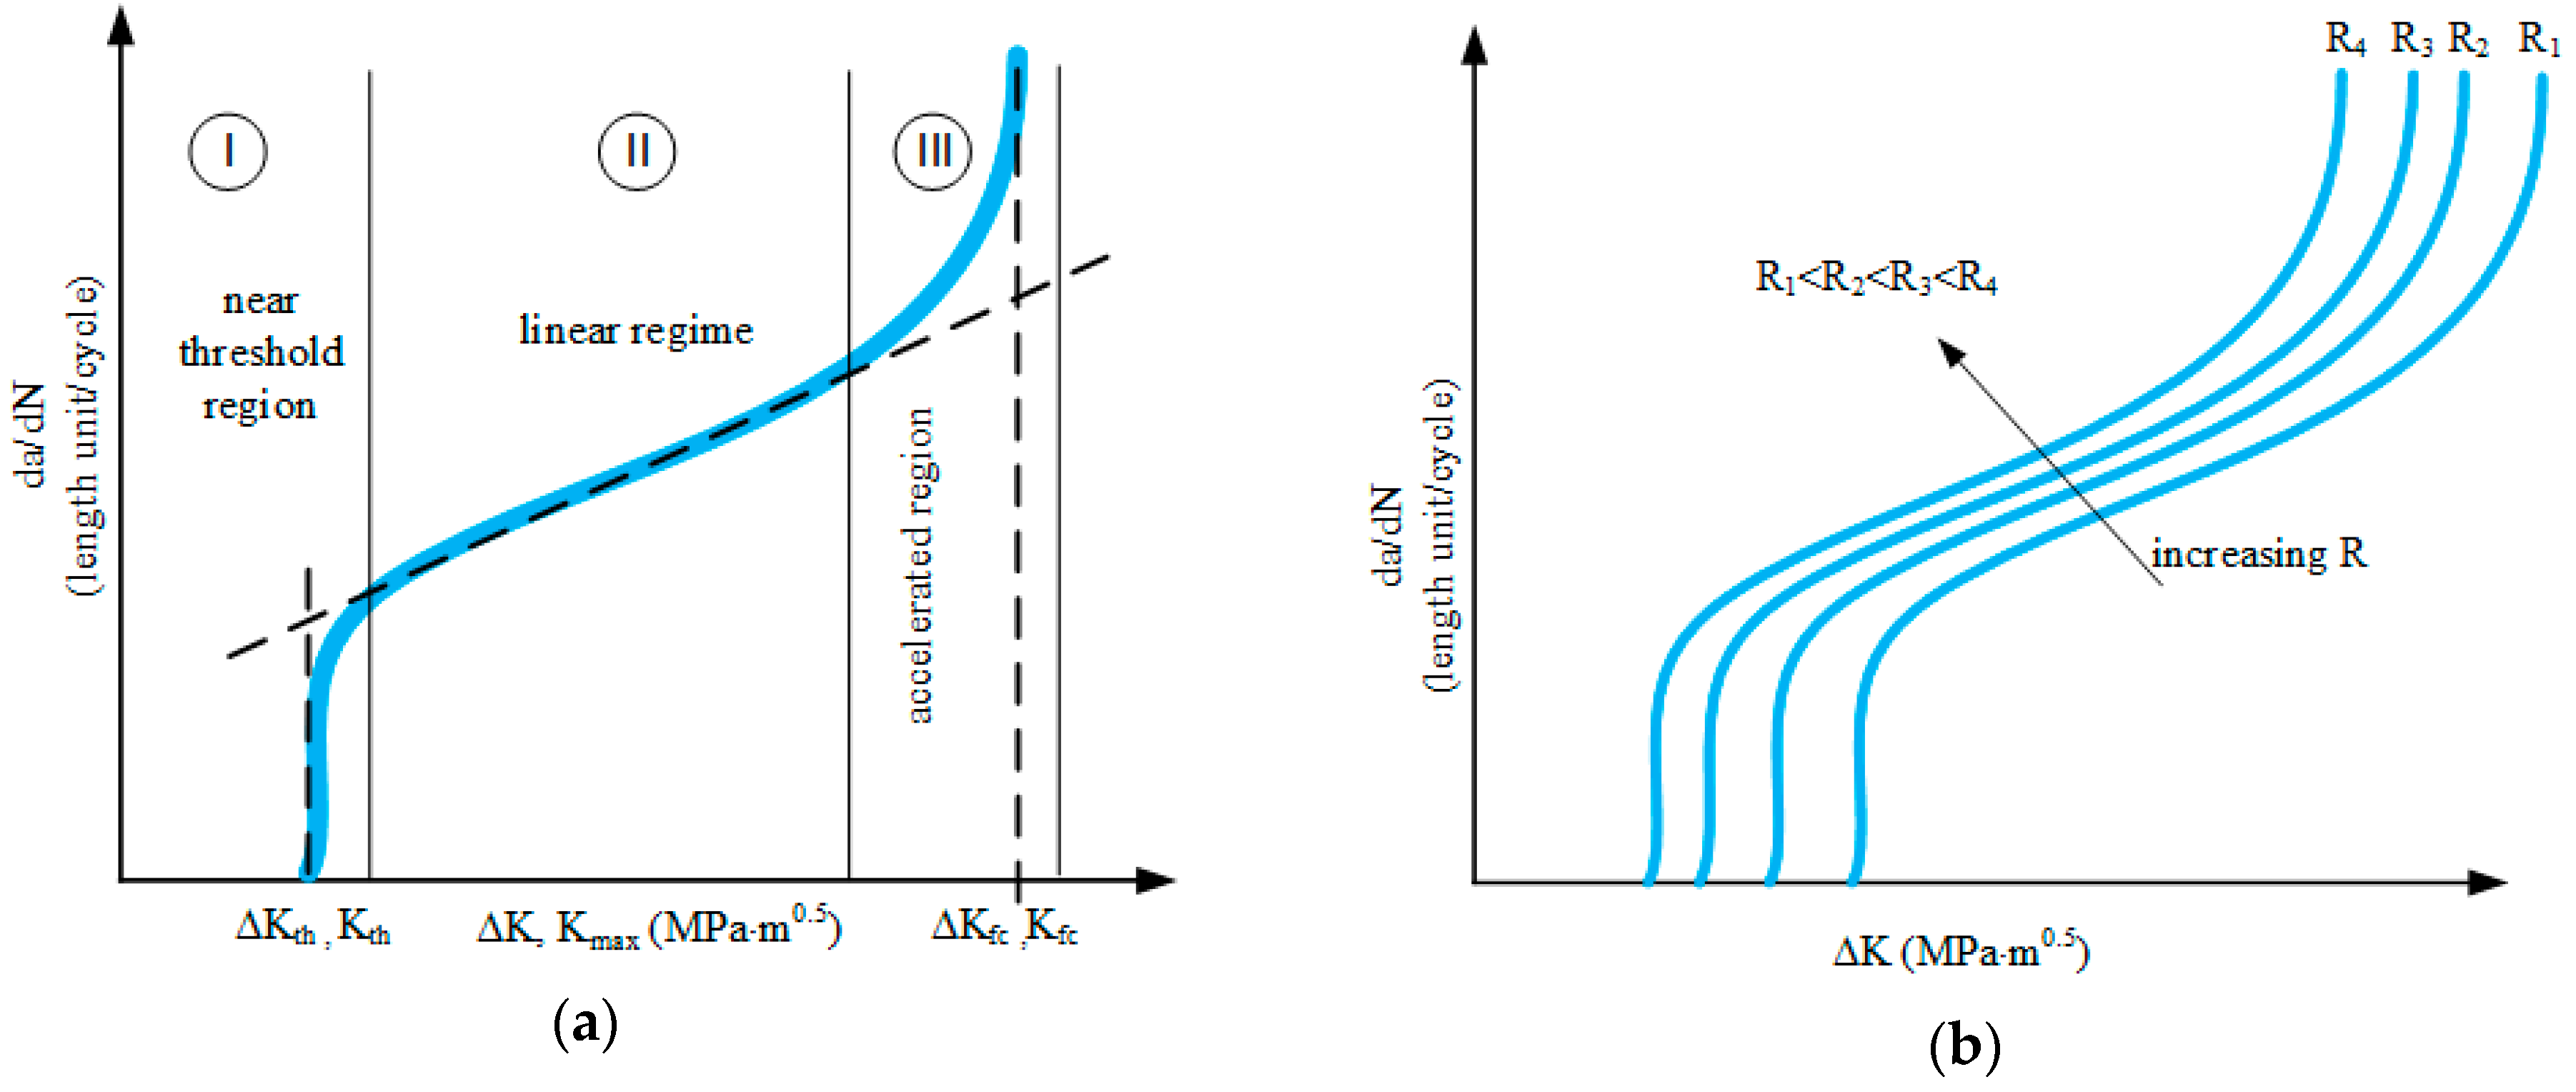
Engineers are predicting the life of an element with a defect using various analytical and numerical techniques (including FEM and BEM). In Equation (2) C, m are constants determined from the Kinetic Fatigue Fracture Diagram (KFFD) presented in Figure 1. ΔK is related to the range of load changes ΔK = Kmax − Kmin, corresponding successively to the range of external load changes.
The constant m in the Paris’ law model is related to the angle of inclination of the experimental data straight line (Figure 1a), while the constant C is the ordinate at the intersection of the extension straight line from Area II. Generally speaking, the typical graph of fatigue cracking kinetics is divided into three areas (Figure 1a). Area I is the domain of the so-called low crack growth rate, i.e., from 0 to approximately 10−9 m/cycle, while Area II corresponds to the straight line of average fatigue crack growth rate in the range 10−9–10−6 m/cycle—so called Paris regime. Area III is the domain of high fatigue crack growth rate, i.e., above 10−5 m/cycle. These ranges are contractually accepted as they depend on the material, its properties, the environment, and the load itself. The range (I) is limited on the left by the asymptote corresponding to the threshold ΔKth value—the threshold range of stress intensity coefficient below which fracture does not propagate or propagates at an insignificantly low speed. The development of cracking ends when the stress factor reaches the critical value ΔKfc, above which cracking propagates unstable. The effect of the stress ratio R factor is schematically represented as in Figure 1b. For higher R-factors, the ΔKth threshold value, which triggers the fatigue cracking process, is lower, and all da/dN-ΔK curves are shifted. Therefore, the adaptation of Equation (2), taking into account the effect of the cycle asymmetry coefficient, is a major topic in Fatigue Fracture Mechanics (FFM). One of the well known is the solution proposed by Forman [2]:
The Kc quantity in Equation (3) is the fatigue fracture toughness (or critical stress intensity factor) for the given load conditions. In the event of difficulties in its establishment, it is very often replaced by known KIC. Accurate determination of constants m and C requires knowledge of crack speed courses for different cycle asymmetry coefficients. Another proposal is well-known as Walker's law [3]:
The constant Cw is determined here experimentally for different values of R. For R = 0 this constant is equivalent to the Paris’ constant C. The exponent mr is treated as a constant, similarly nw—is obtained from experimental data. It is also determined by the extrapolation of data from kinetic fatigue fracture diagrams constructed for different R-ratios.
The influence of the cycle asymmetry coefficient strongly determines the analytical description of the fatigue gap closing process noticed by Wolf Elber [4]. The model covering the above issues is the model known in the literature on the subject of Forman-Mettu [5]:
In the Forman-Mettu model expressed in Equation (5), c, n, p, and q are experimentally determined constants, and f is associated with the function of crack opening. The form of this function can be determined based on, e.g., FITNET procedures [6]. However, the application of this model is not easy—mainly due to a large number of experimentally determined constants.
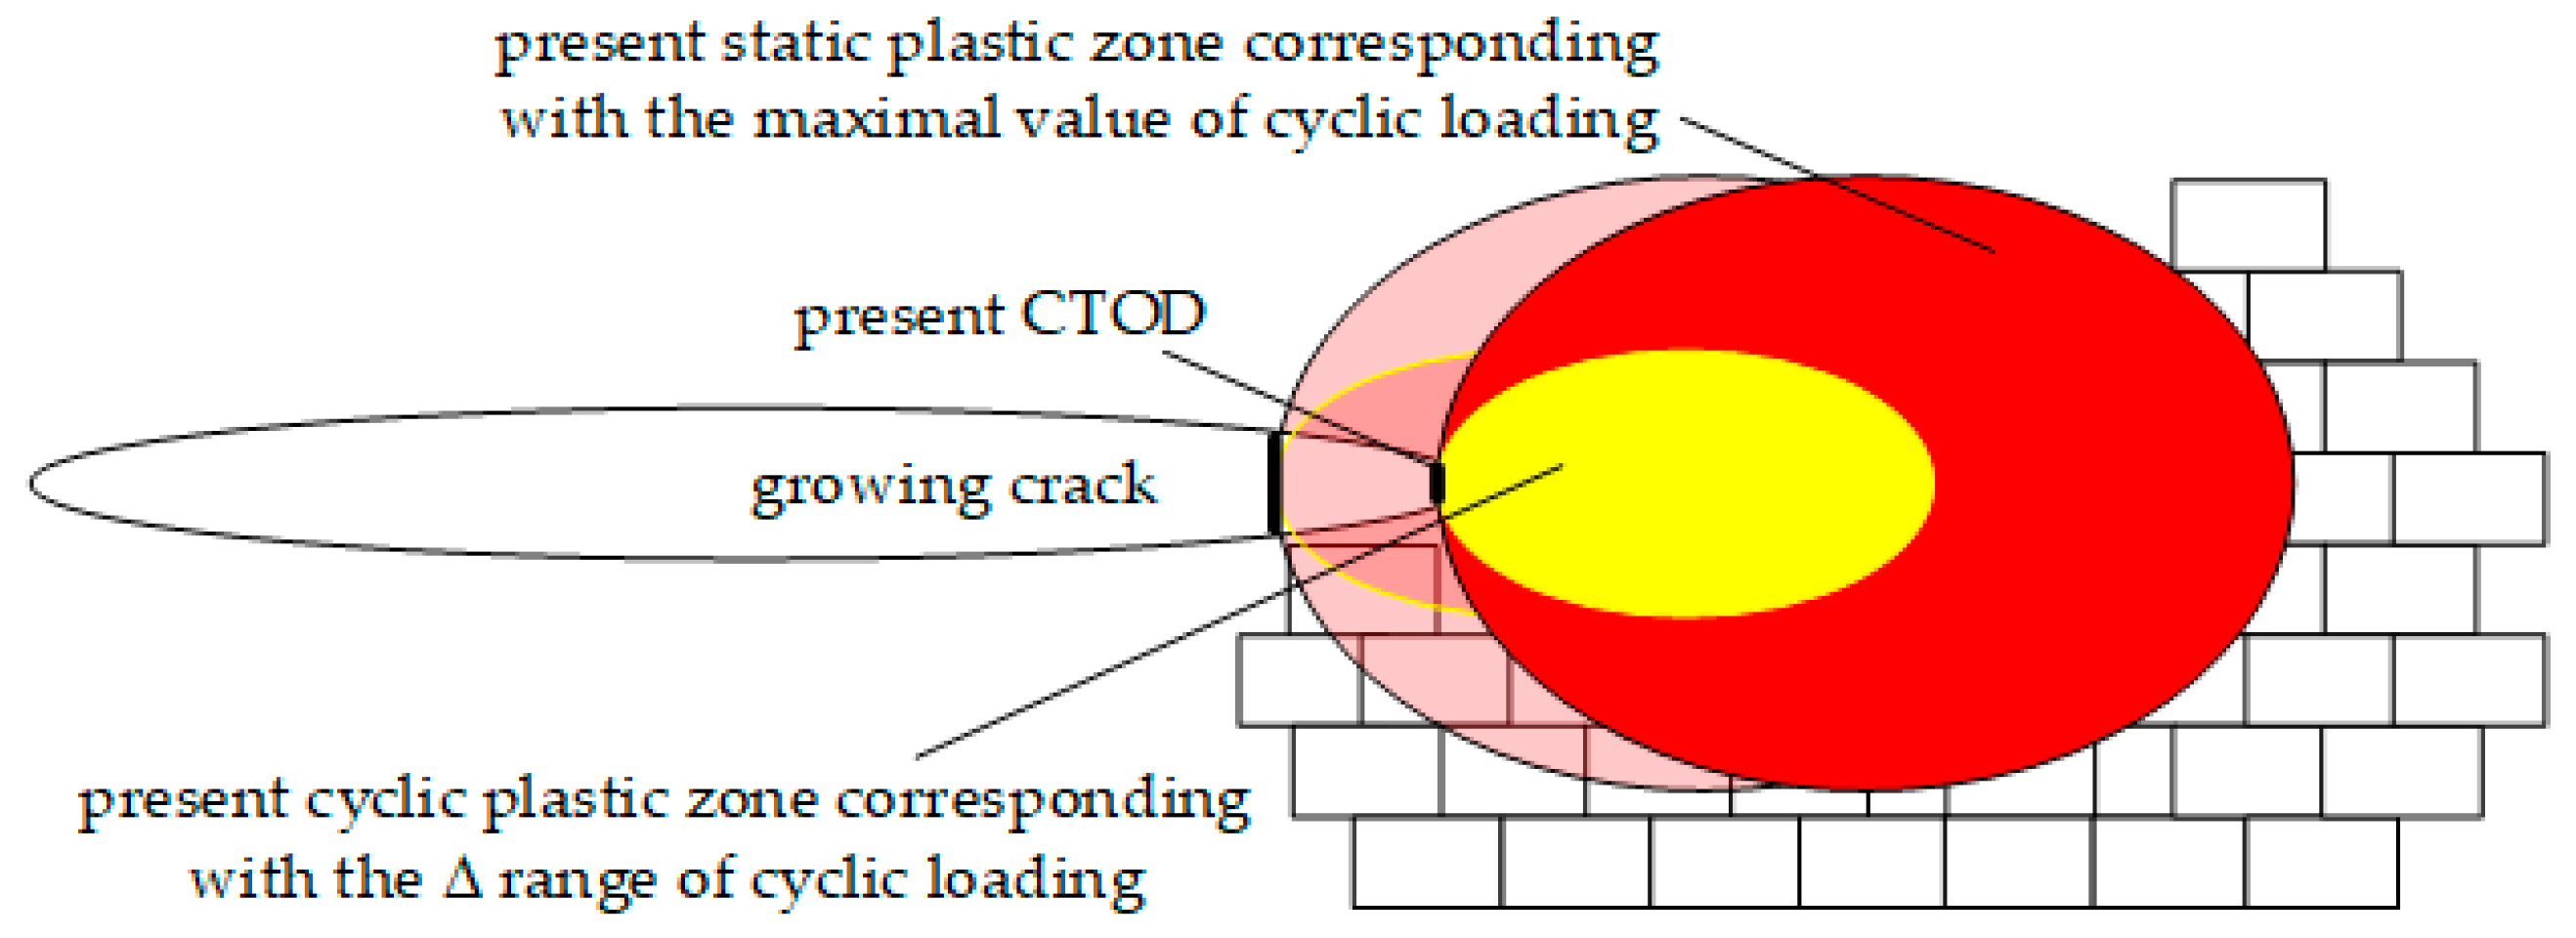
A different group of attractive fatigue fracture models are the mathematical models based on the relationship of low cycle fatigue (LCF) parameters with the fatigue crack propagation rate. Fatigue crack growth is considered an elementary act in the local plastic zone of fracture including two different areas: static, corresponding to the maximum value of load in the cycle, and cyclic, corresponding to the amplitude of load. This concept is presented in Figure 2. Several authors [7,8,9,10,11,12,13,14] proposed excellent relationships between LFC (Low Cycle Fatigue) and FCGR (Fatigue Crack Growth Rate) data. However, in all cases, the presented models work well for the maintained R-ratio. It is more likely that the main reason of the mathematical collapse in R-ratio invariance of the fatigue crack growth description is associated with the fact that the crack driving force still depends only on the ΔK range or on the maximum value of K.
Kujawski [15,16] proposed a new, crack driving force for a ΔK description of FCGR—the geometrical mean value of positive ΔK and Kmax. The next development of the proposed model was the introduction of the weighting exponent α [17,18]:
According to the above, it is worth underlining an excellent contribution of Kujawski’s model into the force approach combaning positive part of the stress intensity factor range ΔK-ΔK+ and Kmax. However, the meaning of the α parameter (ranged from 0 to 1) is debatable and in each case should be calibrated from da/dN-ΔK curves.
Therefore, the main aim of this work is to propose a new, crack driving force parameter with a good physical interpretation responsible for the fatigue fracture process without R-ratio influence.
Alternative methods of describing the kinetics of fatigue cracking are also being searched in order to eliminate the problem of avoiding the R-ratio effect. Research conducted by the author shows that it is possible to obtain such a dimensional base for KFFD, in which the description of fatigue cracking kinetics will not depend on the stress ratio. Energy as a dimensional quantity combining the dimensions of “force” and “displacement” seems to be naturally predestined to describe the kinetics of cracking. Many of the hypotheses concerning both fatigue and the description of fatigue cracking are based on energy irreversibly dissipated in each cycle of the load spectrum [19,20]. The dissipated energy accumulated in the material can be recorded as a hysteresis loop during the test. Determination of the subcritical period of fatigue crack growth requires the application of the first principle of thermodynamics. Assuming an infinite solid body model subjected to sinusoidal alternating external loads with a central part-thru, this balance can be formulated as follows [21,22,23,24]:
In Equation (7), A represents the work of external loads after N cycles, Q represents the heat supplied to the body during loading, and W is the deformation energy after N cycles. The kinetic energy of the body is marked as Ke. Γ is the damage energy necessary for fatigue crack growth increment. When formulating the energy balance expressed in Equation (7), according to [23], the quantities A, Q, W, and Ke, are referred to unit of thickness. It is also assumed that the fatigue crack will grow slowly during each cycle so that the kinetic energy and heat exchanged during this process can be disregarded (i.e., for low loading frequencies). After the differentiation of Equation (7) and simplifications, the energy balance can be represented by
However, damage energy Γ can be expressed as a sum of static and cyclic components:
The energy of the static (monotonic) component of cyclic plastic deformations Ws, corresponding to the maximal value of external loading, is considered as the maximum value of the dissipation of the static energy activating the fracture process without the energy of cyclic deformation changes (Wc = 0) [24]. Wc corresponds to the dissipated energy during cyclic loading. For fatigue crack growth, both quantities are equally important. Hence, the final form of the fatigue crack growth surface can be expressed as
Thus, the proposed crack driving force ΔH (expressed in J/m2) is equal:
The Paris-like model can be represented by
In the above equations, α is a constant dimensionless factor, S is the fatigue crack area, σplf is the cyclic yield point, εfc is the critical strain value under cyclic conditions, and ΔH is the new energy parameter—the crack-driving force. In Equation (13), k should be equal to 1 (based on dimensional analysis approach). However, it is also reported in [22] that k varies from 0.87 to 1.38 for different ductility levels of the tested materials. On the other hand, in the original approach [24], this parameter strongly depends on the hysteresis loop area measured in the load line. It is more likely that this approach seems to be correct from a physical point of view but strongly depends on the experimental techniques of the registered dissipated energy. The problem of measuring dissipated energy regarding the global-local energy approach is widely discussed in [19]. There are no doubts that the energy approach supported by numerical methods is a powerful tool in a proper description of FCGR and residual lifetime estimation based on a rather physical not an empirical model. So far, no attempts have been made to analyze the ΔH characterization of the parameter, to link it with well-known parameters from classical fracture mechanics, i.e., CTOD or J-integral. This fact explains, among other reasons, the relatively low acceptance of energetic models in engineering practice. From the physical point of view, the other well interpretable quantity with this physical dimension ΔH is the integral J. Moreover, contemporary numerical and full field experimental methods allow determining the integral J for advanced materials and loading cases in an efficient way. Many times in the range of linear fracture mechanics, integral J allows one to determine stress intensity factors where there are no closed-form analytical solutions. This has been demonstrated in the author’s and co-author’s works [25,26,27,28] devoted to mixed mode fatigue crack growth description. However, it is worth noting that the number of kinetic energy models based on integral J is still negligible. Dowling and Begley [29] were the pioneers in describing the kinetics of fatigue cracking [29] using the cyclic J integral concept. At a later stage, Dowling [30] demonstrated the independence of integral J as a CDF (Crack Driving Force) from the geometry of samples, which encouraged the stability of this size in the description of the kinetics of fatigue curing. The path independence in applications to fatigue crack growth problems is also proven in many papers [31,32,33,34]. However, also in this case, the full invariability with respect to the R-ratio coefficient is not always obtained by substitution of the crack driving force from ΔK to the integral ΔJ. As evidence, the experimental data for 18G2A and 10HNAP steels (according to standard Polish nomenclature) recorded in papers [35,36,37,38,39] using bended specimens in FCGR experiment in a linear and nonlinear fracture mechanics validity range.
Independently from Rozumek’s results [36,37,38,39], Joyce et al. [40] reported for cast stainless steel equivalent to ASME SA-351CF8M a similar impact of R-ratio in elastic-plastic cyclic ΔJ-crack driving obtained from standardised compact tension (CT) specimens. On the other hand, there are no doubts that the J-integral crack driving force can be applied where the validity of the linear elastic fracture mechanics is limited, so the ΔK approach is debatable. However, experimental observations [29,30,31,32,33,34,35,36,37,38,39,40] have confirmed the fact that the J-integral approach does not entirely solve the problem of the mean stress effect in the description of the FCGR. On the other hand, many analytical models seem to confirm the fact that the solution in the unification of the fatigue cracking process should be sought not so much in the amplitude of the force driving the crack but in the mutual combination of maximum CDF values and CDF amplitude.
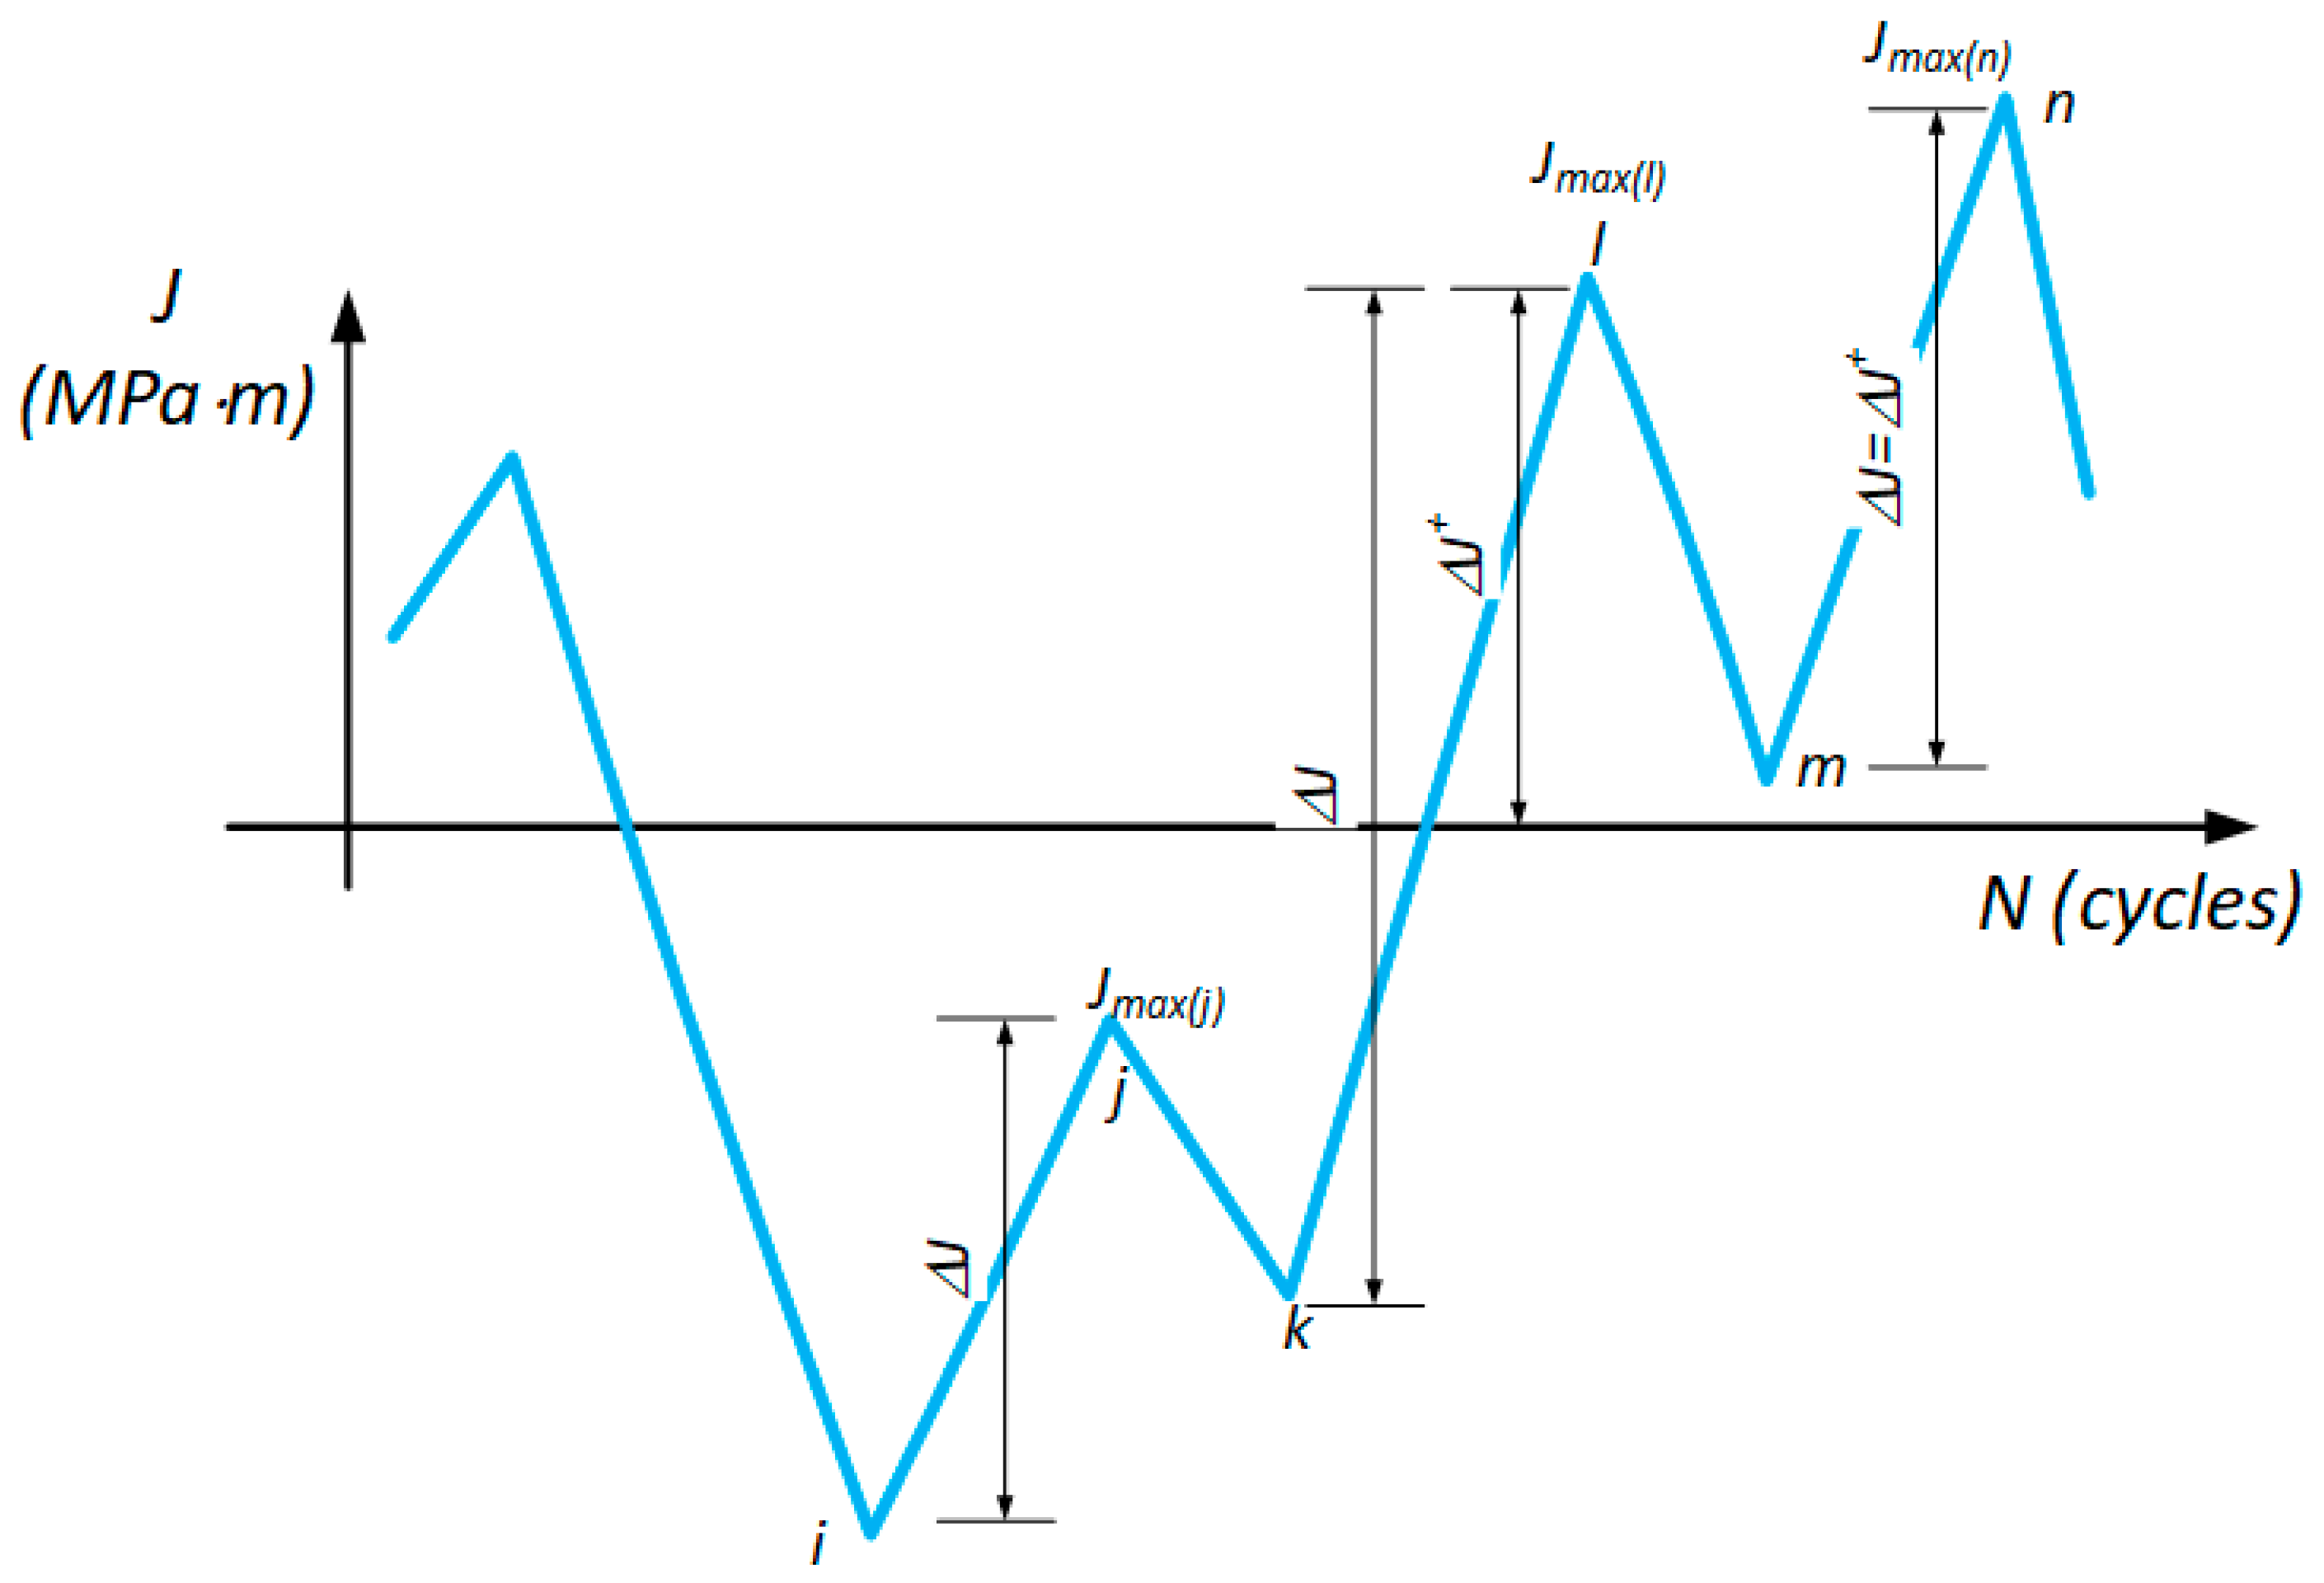
Considering the above, the previously formulated basics of energy modeling allowed for the determination of the relation between fatigue fracture rate and energy parameters. Details of the dimensional analysis modeling [41,42] are available in [21,22,23,24,43,44]. In these works, it was demonstrated that the required energetic parameter with the physical dimension (J/m2) is responsible for the fatigue fracture process. As it is based on the energy measured in the form of a local hysteresis loop, the ambiguities with multi-axis loads and geometries of the specimens did not allow for its proper application. On the other hand, the concept initiated by Kujawski [16] for the elastic parameter ΔK seems to be worth considering when applying for elastic-plastic states. From experimental works and methods of energy accumulation [45], it can be indicated that schematically variable average load connects ΔJ and Jmax. During fatigue crack growth, as is shown in Figure 3, under a different load ratio R, in the case of load paths from point i to j (negative maximal load value), the damage accumulation cannot cause crack growth (no crack opening means that ΔJ+ is zero). For the load case from k to l (negative stress ratios), the crack is partially open (excluding the Elber crack closure phenomenon) in the positive part of the loading (ΔJ+ < ΔJ). For the positive R-ratios (load path from m to n), the ΔJ+ is equal to ΔJ. It is worth noting that, during a cyclic load, Jmax and ΔJ are the values that bind the local stress intensity in front of the crack front—J plays the same role as K in the elastic-plastic fracture mechanics. Therefore, the geometric mean of ΔJ+ and Jmax is proposed as a new crack driving force candidate:
2. Kinetic Fatigue Fracture Diagrams for 10HNAP, 18G2A, and the Eiffel bridge 19th-Century Puddle Iron
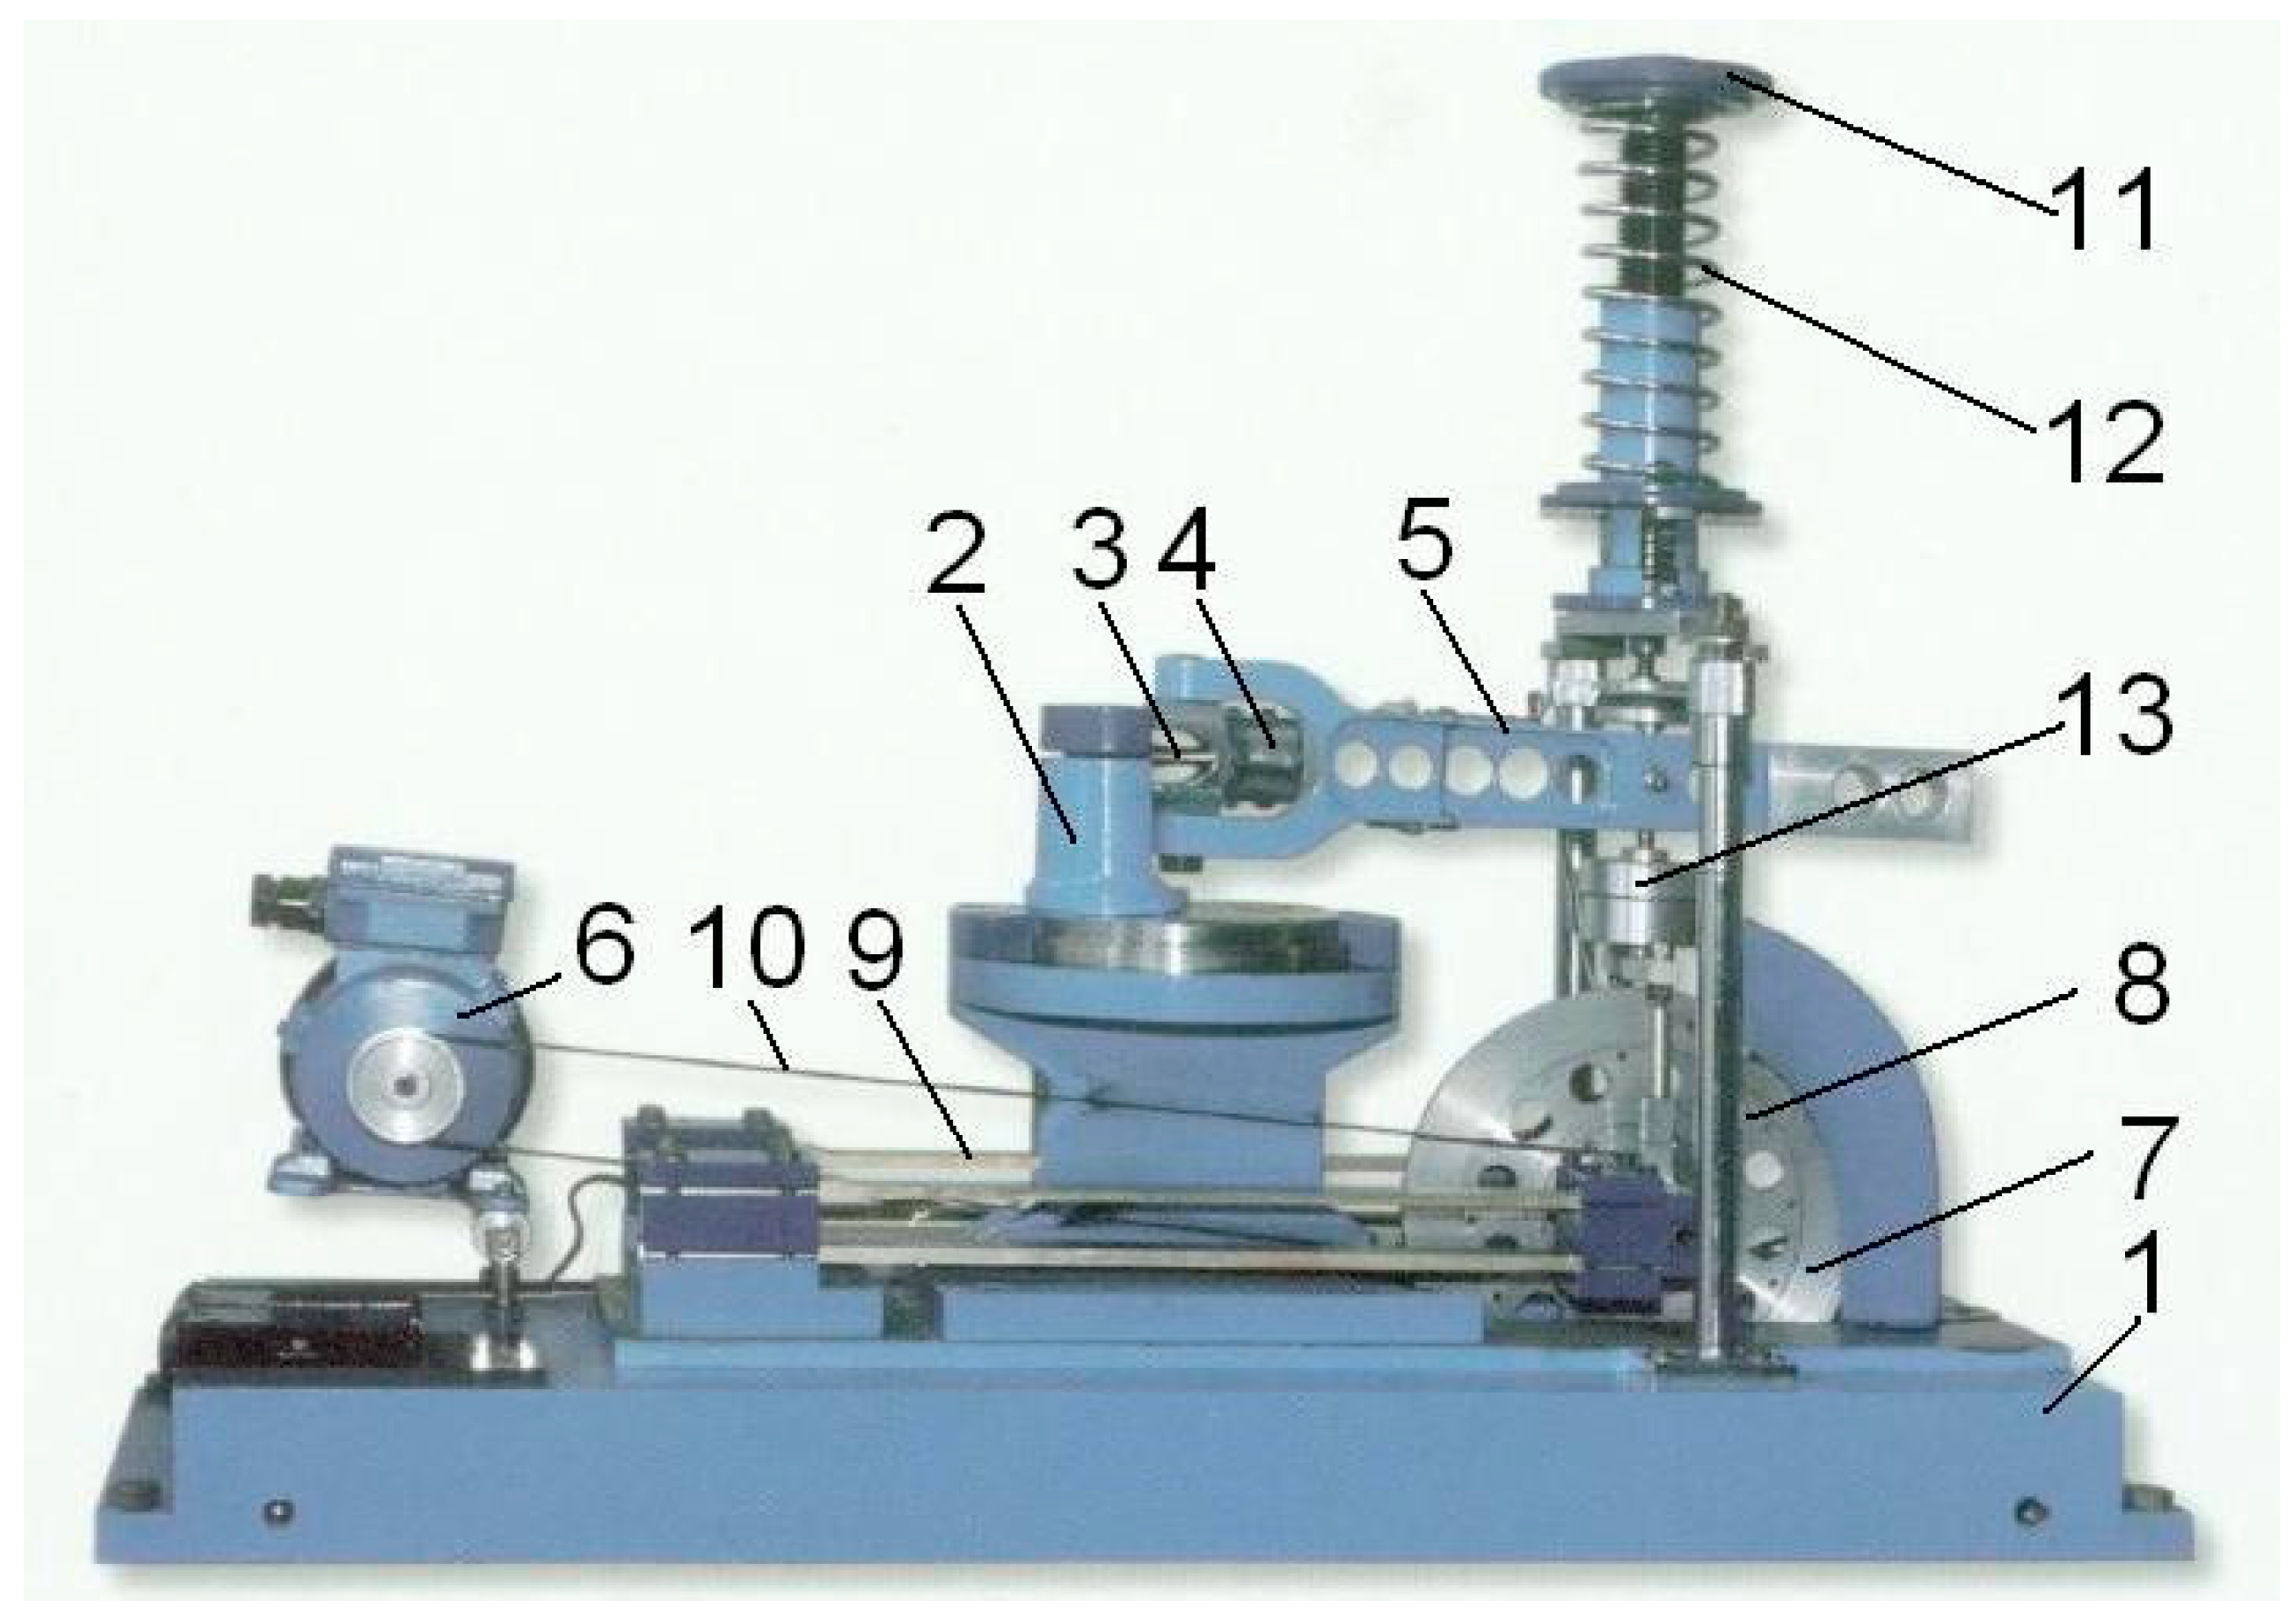
For experimental verification, the published fatigue crack growth data (for steel 10HNAP and 18G2A) based on the ΔJ integral range [35,36,37,38] was used. In Rozumek’s papers [35,36,37,38], the test fatigue crack growth experiment based on elastic-plastic fracture mechanics was performed on the fatigue test stand MZGS-100 (Figure 4), enabling cyclically variable and static (mean) loading.
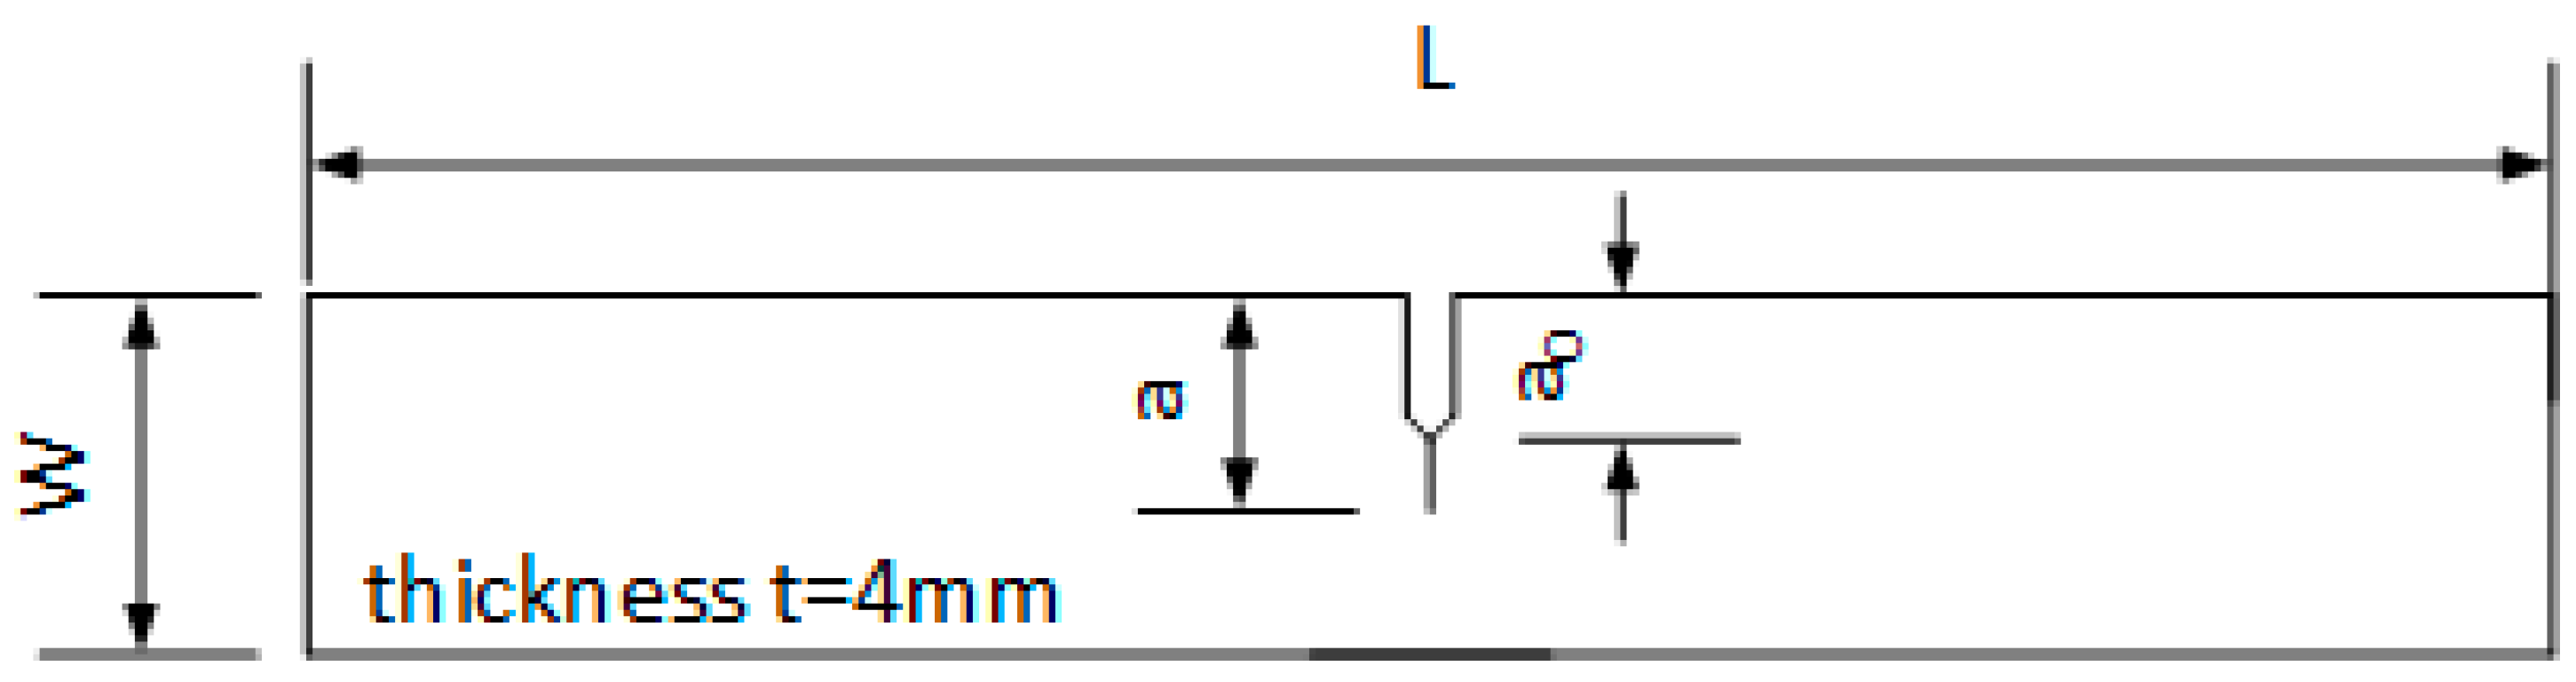
In an experimental campaign (based on ΔJ parameter as a crack driving force), a bent beam (Figure 5) made from 10HNAP and 18G2A steel was used. The specimens subjected to bending had an external unilateral sharp notch of 5 mm in depth, with the rounding radius ρ = 0.5 mm. The specimen dimensions were length L = 120 mm, width W = 20 mm, and thickness t = 4 mm. The scheme of the specimen is presented in Figure 5.
In the cited experimental campaign, the total ΔJ parameter [24,35,36] was considered as a sum of the elastic and plastic components of the cyclic ΔJ parameter [24]:
In Equation (15) ΔJe represents elastic part of ΔJ integral range, ΔJp – plastic part, Y—geometric constraint, εe—elastic strains, εp—plastic strains measured in the vicinity of a crack tip. The tests were performed on the fatigue test stand MZGS-100 (Figure 3) with the loading frequency 29 Hz and the maximal bending moment was equal: Ma = 15.64 nm under the Mode I condition. Three different R-ratios were considered; R = 0, R = −0.5, R = −1. During the experiments, the crack length was observed using optical methods. All experimental details can be found in Rozumek’s papers [36,37,38,39]. After experiments, the elastic-plastic J integral was calculated using boundary element methods (BEM) and FRANC3D software for fracture mechanics analysis. The detailed experimental-numerical procedure is described in [36,37,38,39]. Finally, the elastic-plastic, kinetic fatigue fracture diagrams were constructed based on the J-parameter.
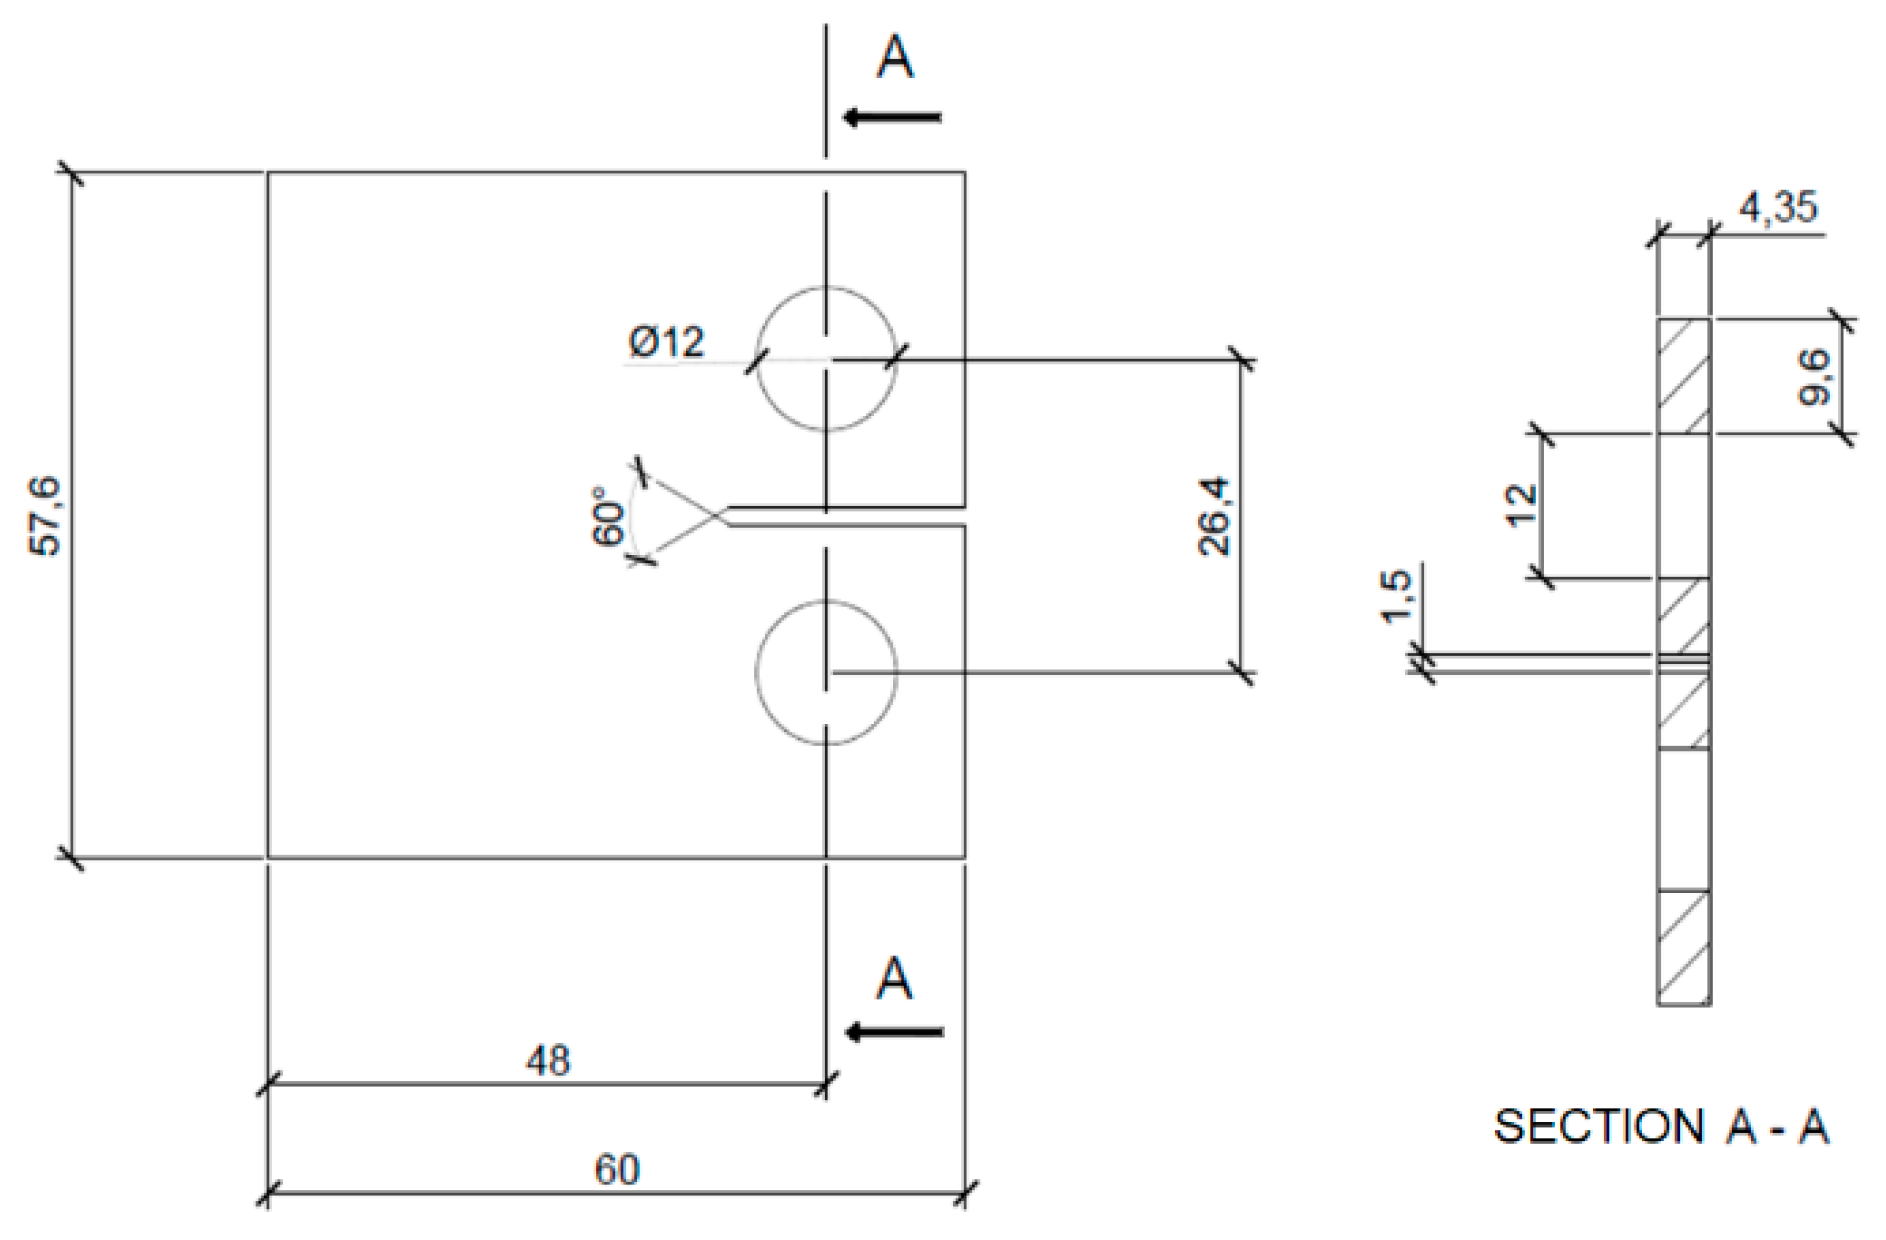
As an alternative, for the ΔS* crack driving force, the kinetic fatigue fracture diagrams were parallel-constructed. The FCGR experiment for the Eiffel bridge [46] puddle iron was designed and performed in accordance with the American standard ASTM E647 [47]. Scheme of the specimen is presented in Figure 6. The stress intensity factor (SIF) for the standardized Compact Tension (CT) specimen is described by [47]
where α is the normalized crack length referred to the specimen width (α = a/W), B is the thickness of the specimen, W represents the specimen width, and ∆F is the applied force range. The crack length was monitored using compliance methods from the clip-gage mounted on additional knives on the front side of the specimen—CMOD (crack mouth opening displacement).
For the energy fatigue crack growth description (puddle iron from the Eiffel bridge), only the elastic part of the ΔJ-integral range was analyzed using a well-known relationship from linear-elastic fracture mechanics (with assumed plane stress conditions):
The chemical composition of analyzed materials is presented in Table 1. Table 2 and Table 3 include both static and cyclic mechanical properties of the considered materials. Kinetic fatigue fracture diagrams for all materials are shown in Figure 7, Figure 8 and Figure 9.
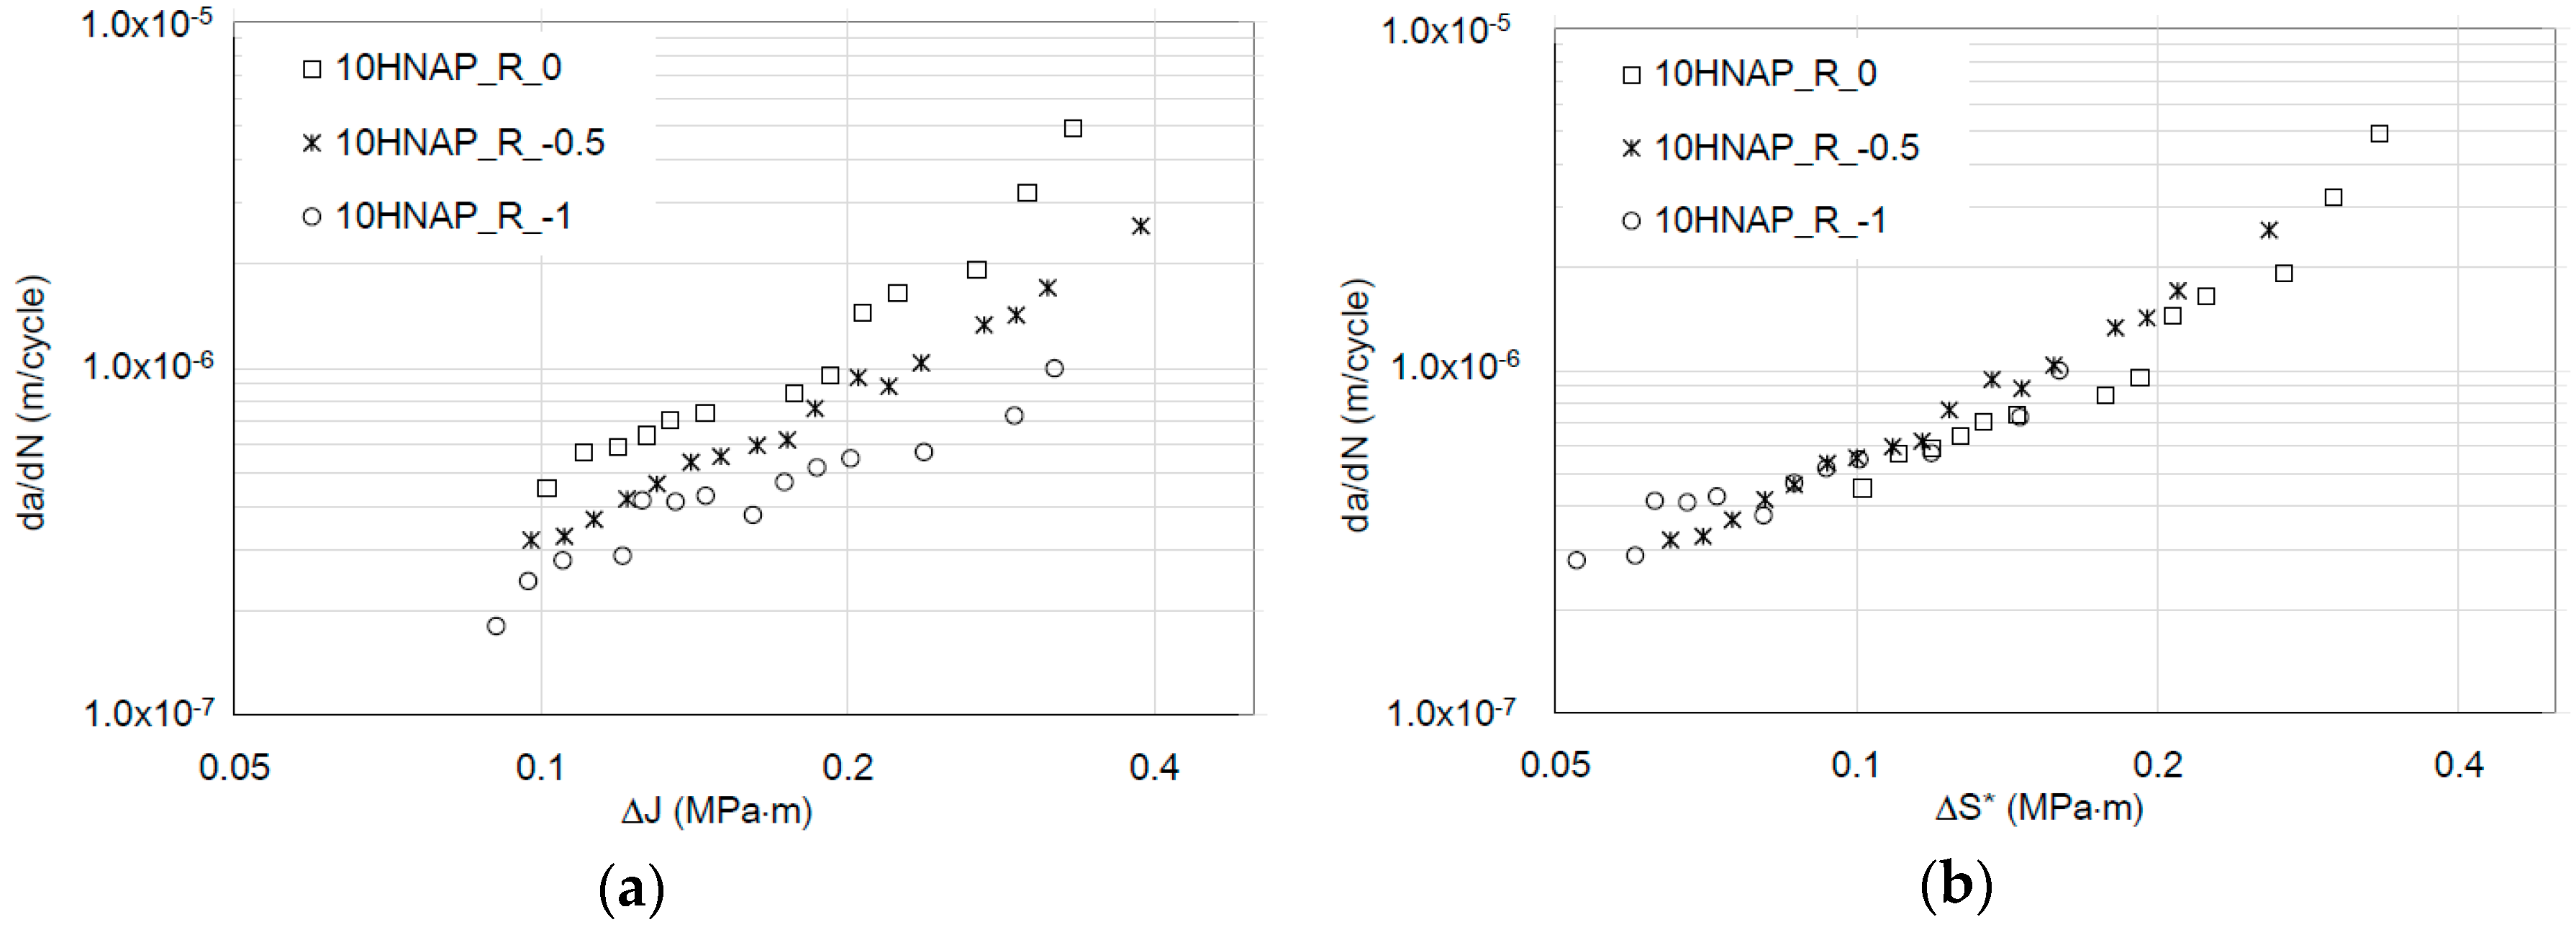
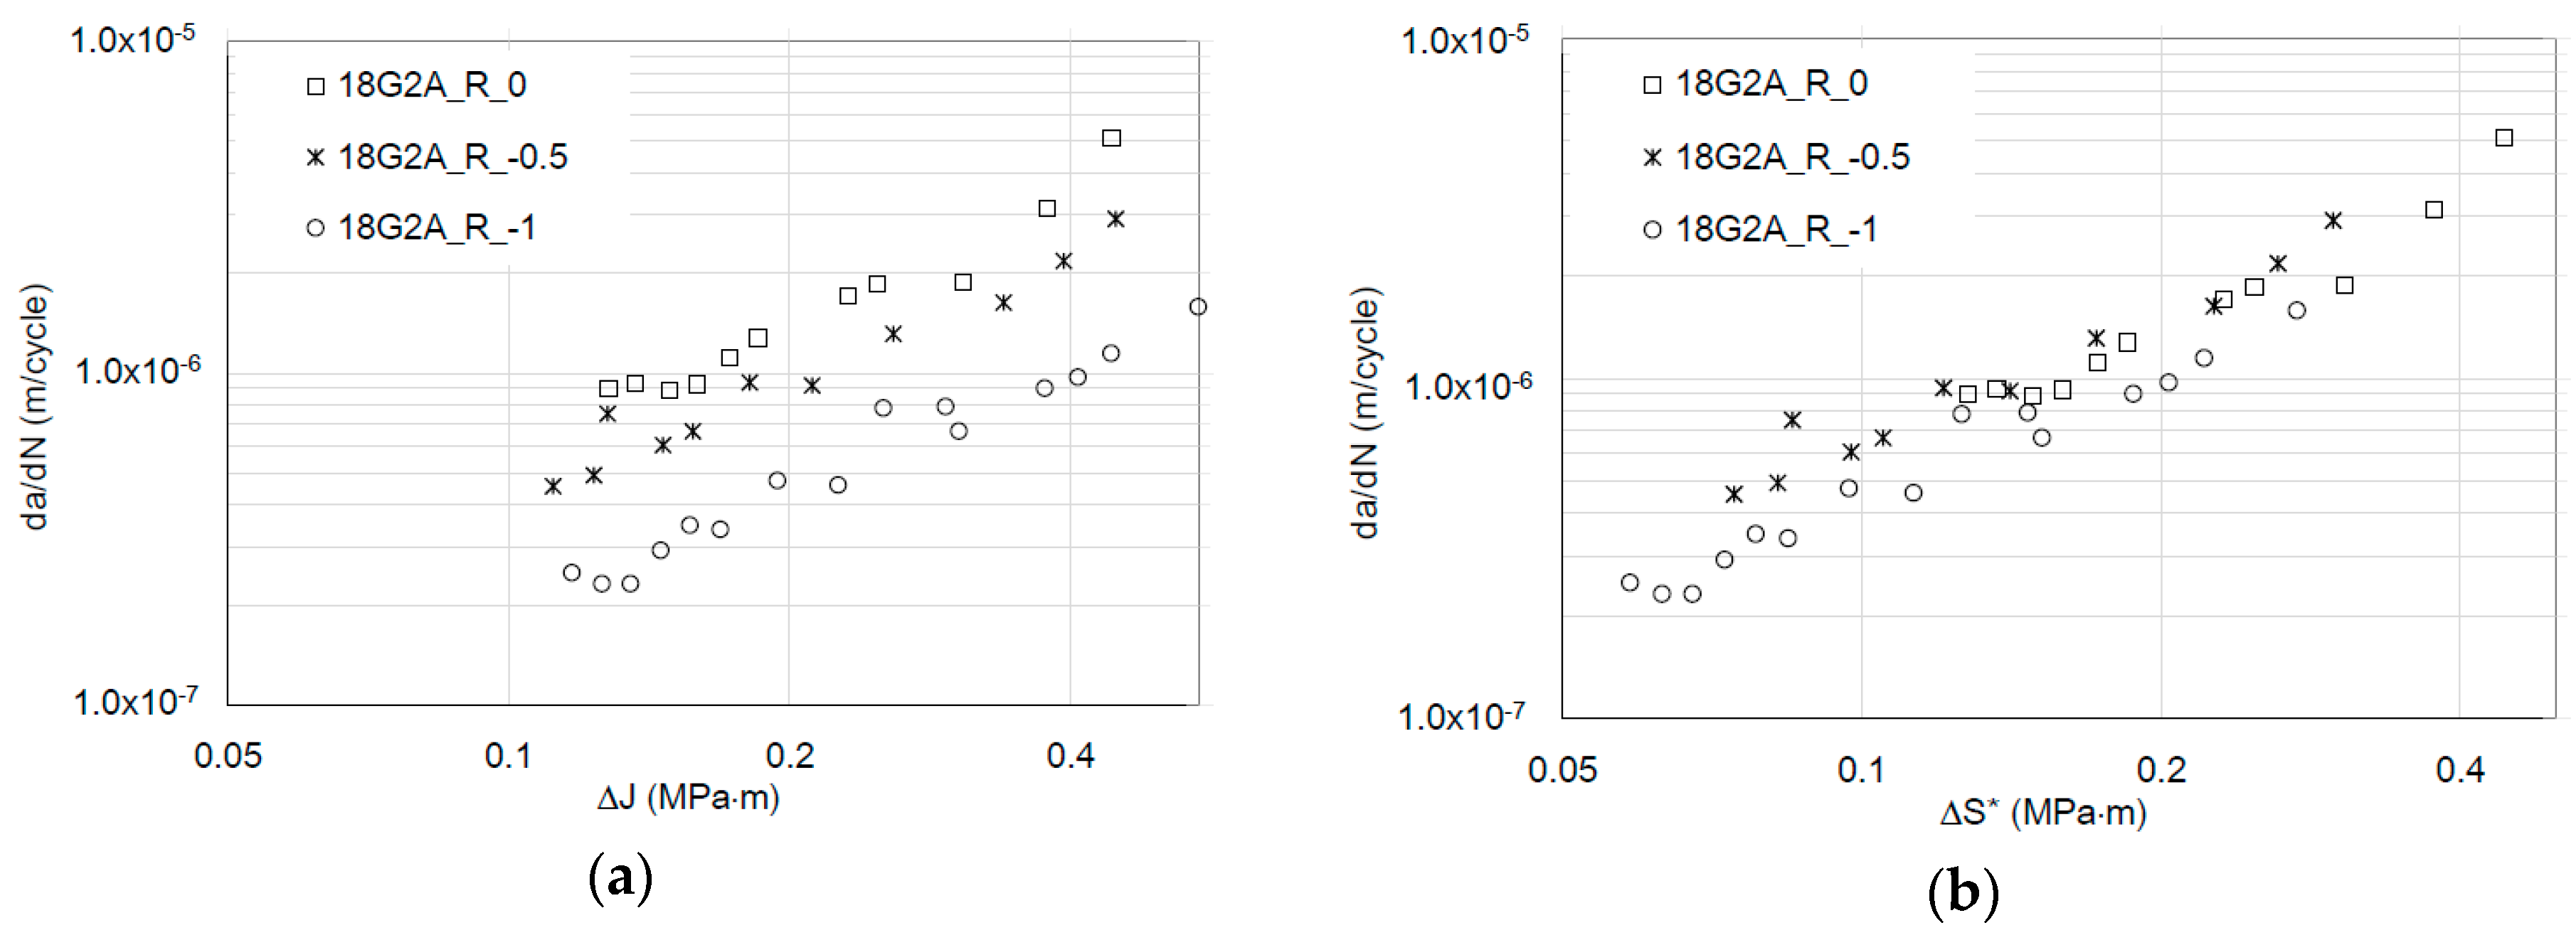
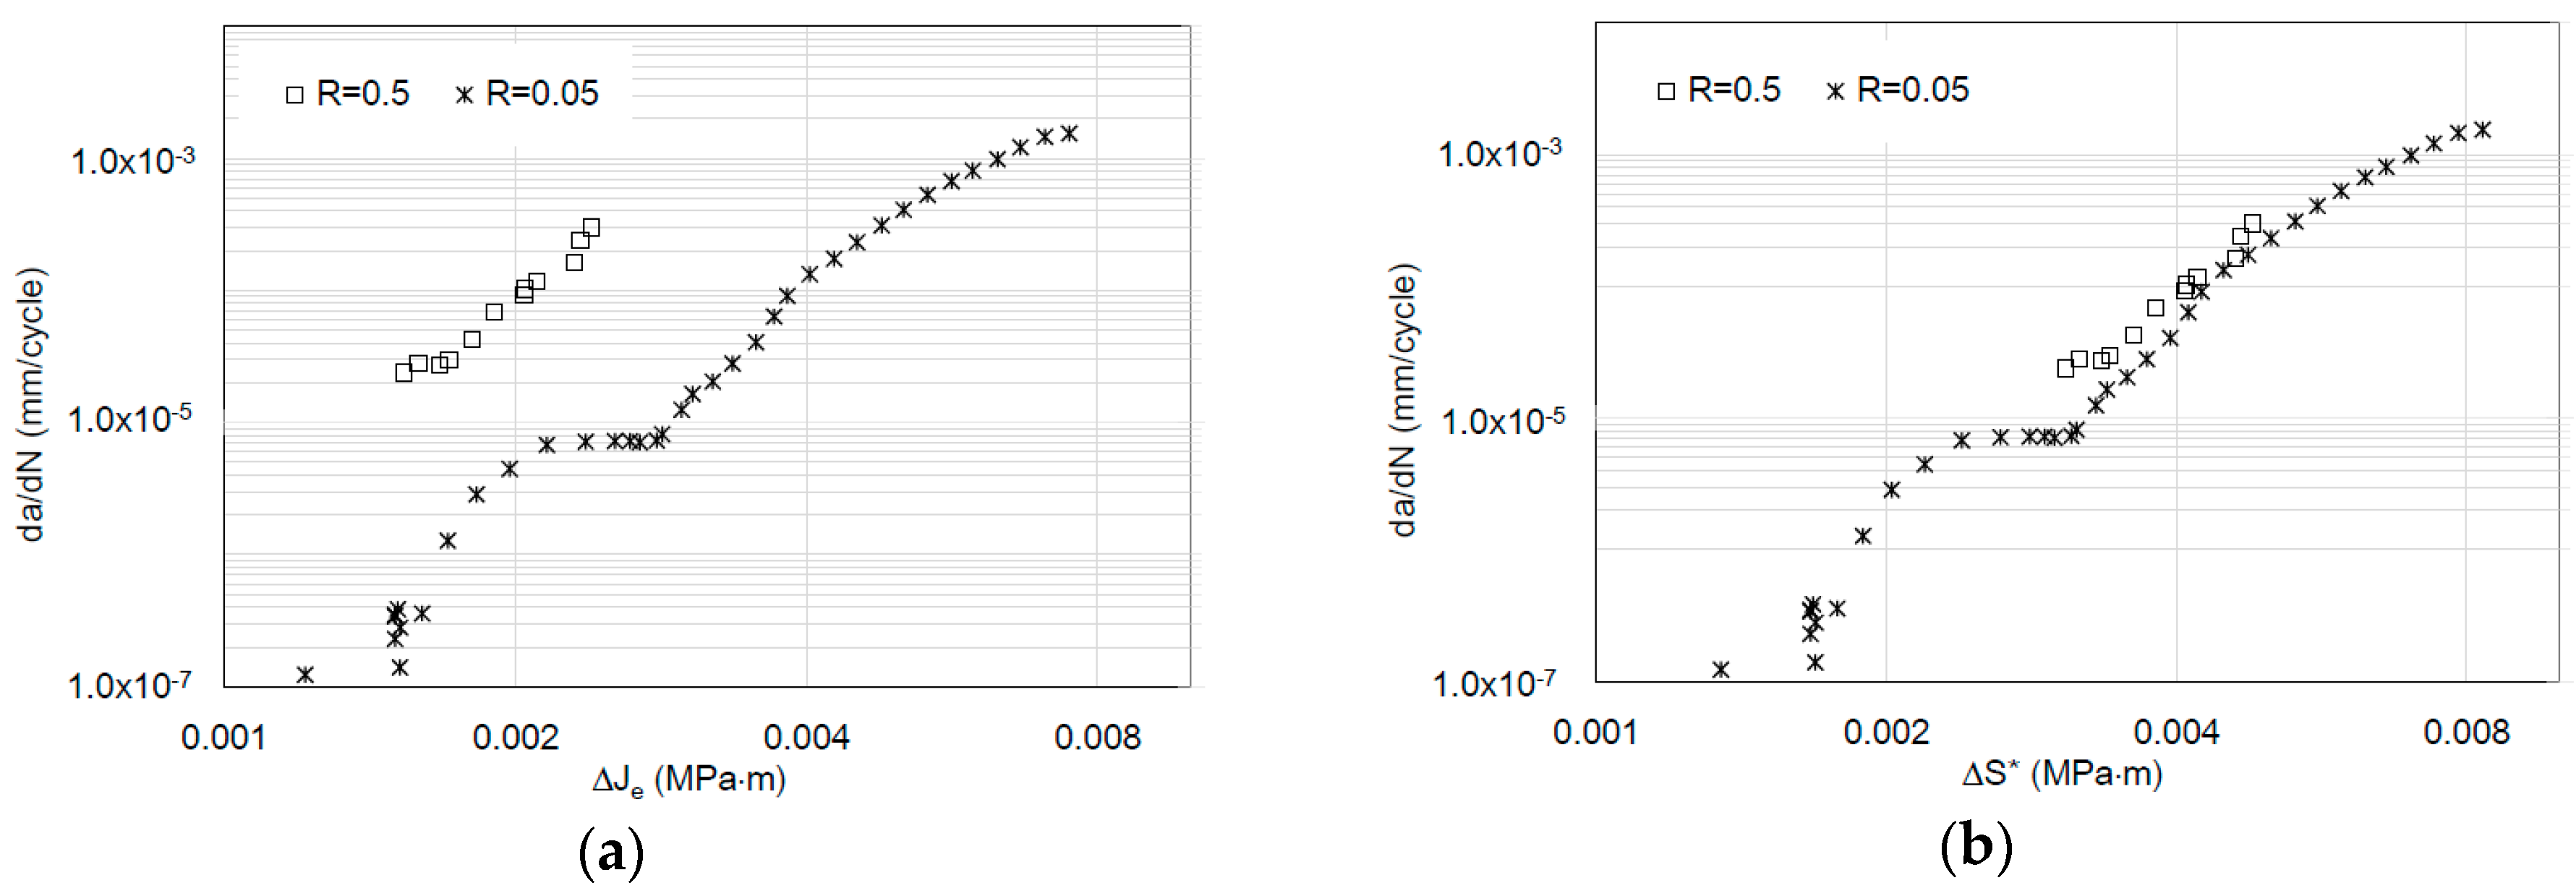
As observed, the impact of R is noticeable in the case of the ΔJ description in the FCGR diagrams. In the same way, a similar tendency in the case of the da/dN-Jmax description using the relationship between Jmax and ΔJ can be demonstrated. However, in the case of an energy approach, the main concept assumed the representation of the fatigue crack growth rate using invariant kinetic fatigue fracture diagrams based on a new, crack driving force—ΔS*. ΔS* involves both ΔJ and Jmax parameters. However, ΔJ should be limited only for ΔJ+. Of course, possible corrections can be done using an effective ΔJ+ range based on crack closure measurements. Recently, in [48,49], an efficient experimental method was described for in-situ J-integral calculation using DIC—digital image correlation. In the presented case, in order to analyze the invariance ability from stress ratio R, the crack driving force was examined by the simple statistical R2 data fitting using a Paris-like relationship, for ΔJ and ΔS* crack driving forces:
As was expected in each case, the new ΔS* crack driving force consolidated all experimental results for different R-ratios into one straight line in the Paris regime. Moreover, the Paris-like law data fitting is better in the case of the description of the FCGR curves using the newly proposed crack driving force. Statistical outputs of the R-square data fitting to the Equations (19) and (20) are presented in Table 4. According to the statistical analysis, in each case, the introduction of the ΔS* parameter caused a significant increase in data fitting for the Paris-like model expressed in Equation (20) in comparison to the model expressed in Equation (19).
3. Conclusions
This article presents an understanding of dimensional analysis identifying the energy force driving the crack. In the course of this work, it was established that this value is the parameter of ΔH (J/m2) proposed by Szata [24]. In the absence of an unambiguous analytical interpretation of this parameter, it was replaced by the integral J, which did not allow avoiding the influence of average load in the form of R. A new CDF—ΔS*—based on the geometric mean of the maximum value of cyclic J-integral and its range ΔJ has been proposed to describe the kinetics of fatigue cracking. Its suitability for three different engineering materials (10HNAP and 18G2A steels and puddle iron) has been tested. On the basis of the above considerations, the following conclusions may be formulated:
- In contrast to J, S* unambiguously describes the fatigue crack kinetics for 10HNAP and 18G2A steels in the range of non-positive stress ratio R (considering elastic-plastic conditions).
- In contrast to J, S* unambiguously describes the fatigue crack kinetics for 19th-century puddle iron from the Eiffel bridge in the range of positive stress ratio R (considering linear elastic fracture mechanics conditions).
- In each case, the description of KFFD including S* resulted in higher values of R2 data fitting coefficient for the power-law description of the FCGR in the Paris regime.
- A good physical interpretation of S* as opposed to H allows for its easy implementation into the numerical environment.
Funding
This research was funded by Wroclaw University of Science and Technology, grant number 0402/0084/18.
Conflicts of Interest
The funders had no role in the design of the study; in the collection, analyses, or interpretation of data; in the writing of the manuscript; or in the decision to publish the results.
References
- Paris, P.C.; Erdogan, F. A critical analysis of crack propagation laws. J. Basic Eng. 1963, 85, 528–533. [Google Scholar] [CrossRef]
- Forman, R.G.; Kearney, V.E.; Engle, R.M. Numerical analysis of crack propagation in cyclic loaded structures. J. Basic Eng. 1967, 89, 459–463. [Google Scholar] [CrossRef]
- Walker, K. The effect of stress ratio during crack propagation and fatigue for 2024-T3 and 7075-TO Aluminum. ASTM Int. 1970, 462, 1–14. [Google Scholar]
- Elber, W. Fatigue crack closure under cyclic tension. Eng. Fract. Mech. 1970, 2, 37–45. [Google Scholar]
- Forman, R.G.; Mettu, S.R. Behavior of Surface and Corner Cracks Subjected to Tensile and Bending Loads in Ti–6Al–4V Alloy. In Fracture Mechanics: 22nd Symposium; Ernst, H.A., Saxena, A., McDowell, D.L., Eds.; American Society for Testing and Materials: Philadelphia, PA, USA, 1992; Volume 1, pp. 519–546. [Google Scholar]
- Koçak, M. FITNET fitness-for-service procedure: An overview. Weld. World 2007, 51, 94–105. [Google Scholar] [CrossRef]
- Huffman, P.J.; Ferreira, J.; Correia, J.A.F.O.; De Jesus, A.M.P.; Lesiuk, G.; Berto, F.; Glinka, G. Fatigue crack propagation prediction of a pressure vessel mild steel based on a strain energy density model. Frat. Struct. Integrity 2017, 11, 74–84. [Google Scholar] [CrossRef]
- Shi, K.K.; Cai, L.X.; Chen, L.; Wu, S.C.; Bao, C. Prediction of fatigue crack growth based on low cycle fatigue properties. Int. J. Fatigue 2014, 61, 220–225. [Google Scholar] [CrossRef]
- Chen, L.; Cai, L.; Yao, D. A new method to predict fatigue crack growth rate of materials based on average cyclic plasticity strain damage accumulation. Chin. J. Aeronaut. 2013, 26, 130–135. [Google Scholar] [CrossRef] [Green Version]
- Boljanović, S.; Maksimović, S.; Djurić, M. Analysis of crack propagation using the strain energy density method. Sci. Tech. Rev. 2009, 59, 12–17. [Google Scholar]
- Khelil, F.; Aour, B.; Belhouari, M.; Benseddiq, N. Modeling of fatigue crack propagation in aluminum alloys using an energy based approach. Eng. Tech. Appl. Sci. Res. 2013, 3, 488–496. [Google Scholar]
- Hadi Hafezi, M.; Nik Abdullah, N.; Correia, J.F.; De Jesus, A.M. An assessment of a strain-life approach for fatigue crack growth. Int. J. Struct. Integrity 2012, 3, 344–376. [Google Scholar] [CrossRef]
- Correia, J.A.; Jesus, A.M.D.; Ribeiro, A.S.; Fernandes, A.A. Strain-based approach for fatigue crack propagation simulation of the 6061-T651 Aluminium alloy. Int. J. Mater. Struct. Integrity 2017, 11, 1–15. [Google Scholar] [CrossRef]
- Zhu, S.P.; Liu, Y.; Liu, Q.; Yu, Z.Y. Strain energy gradient-based LCF life prediction of turbine discs using critical distance concept. Int. J. Fatigue 2018, 113, 33–42. [Google Scholar] [CrossRef]
- Kujawski, D. A fatigue crack driving force parameter with load ratio effects. Int. J. Fatigue 2001, 23, 239–246. [Google Scholar] [CrossRef]
- Kujawski, D. A new (ΔK + Kmax) 0.5 driving force parameter for crack growth in Aluminum alloys. Int. J. Fatigue 2001, 23, 733–740. [Google Scholar] [CrossRef]
- Stoychev, S.; Kujawski, D. Analysis of crack propagation using ΔK and Kmax. Int. J. Fatigue 2005, 27, 1425–1431. [Google Scholar] [CrossRef]
- Dinda, S.; Kujawski, D. Correlation and prediction of fatigue crack growth for different R-ratios using Kmax and ΔK+ parameters. Eng. Fract. Mech. 2004, 71, 1779–1790. [Google Scholar] [CrossRef]
- Ranganathan, N.; Chalon, F.; Méo, S. Some aspects of the energy based approach to fatigue crack propagation. Int. J. Fatigue 2008, 30, 1921–1929. [Google Scholar] [CrossRef]
- Mazari, M.; Benguediab, M.; Zemri, M.; Bouchouicha, B. Influence of Structural Parameters on the Resistance on the Crack of Aluminium Alloy. In Aluminium Alloys-New Trends in Fabrication and Applications; InTech: London, UK, 2012. [Google Scholar] [Green Version]
- Szata, M.; Lesiuk, G. A new method of constructing the kinetic fatigue fracture diagrams - crack propagation equation based on energy approach. FME Trans. 2008, 36, 74–80. [Google Scholar]
- Szata, M.; Lesiuk, G. Algorithms for the estimation of fatigue crack growth using energy method. Arch. Civ. Mech. Eng. 2009, 9, 118–134. [Google Scholar] [CrossRef]
- Szata, M. Description of the Fatigue Fracture Development in Terms of Energy Approach; Oficyna Wydawnicza PWr: Wrocław, Poland, 2002. (In Polish) [Google Scholar]
- Lesiuk, G.; Szata, M.; Rozumek, D.; Marciniak, Z.; Correia, J.; De Jesus, A. Energy response of S355 and 41Cr4 steel during fatigue crack growth process. J. Strain Anal. Eng. Des. 2018, 53, 663–675. [Google Scholar] [CrossRef]
- Ferreira, J.; Correia, J.A.; Lesiuk, G.; González, S.B.; Gonzalez, M.C.R.; de Jesus, A.M.; Fernández-Canteli, A. Pre-Strain Effects on Mixed-Mode Fatigue Crack Propagation Behaviour of the P355NL1 Pressure Vessels Steel. In ASME 2018 Pressure Vessels and Piping Conference, Prague, Czech Republic, 15–20 July 2018; American Society of Mechanical Engineers: New York, NY, USA, 2018; p. V06AT06A027. [Google Scholar]
- Lesiuk, G.; Katkowski, M.; Correia, J.; Jesus, A.M.D.; Błażejewski, W. Fatigue crack growth rate in CFRP reinforced constructional old steel. Int. J. Struct. Integr. 2018, 9, 381–395. [Google Scholar] [CrossRef]
- Rozumek, D.; Marciniak, Z.; Lesiuk, G.; Correia, J.A.; de Jesus, A.M. Experimental and numerical investigation of mixed mode I+ II and I+ III fatigue crack growth in S355J0 steel. Int. J. Fatigue 2018, 113, 160–170. [Google Scholar] [CrossRef]
- Lesiuk, G.; Kucharski, P.; Correia, J.A.; de Jesus, A.M.P.; Rebelo, C.; da Silva, L.S. Mixed mode (I + II) fatigue crack growth in puddle iron. Eng. Fract. Mech. 2017, 185, 175–192. [Google Scholar] [CrossRef]
- Dowling, N.E.; Begley, J.A. Fatigue crack growth during gross yielding and the J-integral. In Mechanics of Crack Growth; ASTM STP 590; American Society for Testing and Materials: Philadelphia, PA, USA, 1976; pp. 82–103. [Google Scholar]
- Dowling, N.E. Geometry effects and the J-integral approach to elasticplastic fatigue crack growth. In Cracks and Fracture; ASTM STP 601; American Society for Testing and Materials: Philadelphia, PA, USA, 1976; pp. 19–32. [Google Scholar]
- Lamba, H.S. The J-integral approach applied to cyclic loading. Eng. Fract. Mech. 1975, 7, 693–703. [Google Scholar] [CrossRef]
- Wüthrich, C. The extension of the J-integral concept to fatigue cracks. Int. J. Fract. 1982, 20, 35–37. [Google Scholar] [CrossRef]
- Wüthrich, C.; Hoffelner, W. Fatigue crack growth at high strain amplitudes. Mech. Behav. Mater. 1984, 911–917. [Google Scholar]
- Tanaka, K. The cyclic J-integral as a criterion for fatigue crack growth. Int. J. Fract. 1983, 22, 91–104. [Google Scholar] [CrossRef]
- Gasiak, G.; Rozumek, D. ΔJ-integral range estimation for fatigue crack growth rate description. Int. J. Fatigue 2004, 26, 135–140. [Google Scholar] [CrossRef]
- Rozumek, D.; Macha, E. Elastic–plastic fatigue crack growth in 18G2A steel under proportional bending with torsion loading. Fatigue Fract. Eng. Mater. Struct. 2006, 29, 135–144. [Google Scholar] [CrossRef]
- Rozumek, D.; Macha, E. Description of the Fatigue Crack Development in Elastic-Plastic Materials with Proportional Torsion-Bending Load; Oficyna Wydawnicza Politechniki Opolskiej: Opole, Poland, 2006. (In Polish) [Google Scholar]
- Rozumek, D. Mixed Mode Fatigue Cracks of Constructional Materials, Studies and Monographs; Oficyna Wydawnicza Politechniki Opolskiej: Opole, Poland, 2009; p. 152. (In Polish) [Google Scholar]
- Rozumek, D. Survey of formulas used to describe the fatigue crack growth rate. Mater. Sci. 2014, 49, 723–733. [Google Scholar] [CrossRef]
- Joyce, J.A.; Hackett, E.M.; Roe, C. Effects of cyclic loading on the deformation and elastic-plastic fracture behaviour of a cast stainless steel. In Fracture Mechanics; Landes, J.D., McCabe, D.E., Boulet, J.A., Eds.; American Society for Testing and Materials: Philadelphia, PA, USA, 1994; Volume 24, pp. 722–741. [Google Scholar]
- Kasprzak, W.; Lysik, B.; Rybaczk, M. Measurement, Dimensions, Invariant Models and Fractals; Spolom: Lviv, Ukraine, 2004. [Google Scholar]
- Rybaczuk, M. Geometrical methods of dimensional analysis in problems of mechanics. Scientific Papers of the Institute of Materials Science and Applied Mechanics of the Technical University of Wroclaw, Wrocław, Poland, 1993. (In Polish) [Google Scholar]
- Lesiuk, G.; Szata, M.; Correia, J.A.; De Jesus, A.M.P.; Berto, F. Kinetics of fatigue crack growth and crack closure effect in long term operating steel manufactured at the turn of the 19th and 20th centuries. Eng. Fract. Mech. 2017, 185, 160–174. [Google Scholar] [CrossRef]
- Lesiuk, G. Mixed mode (I + II, I + III) fatigue crack growth rate description in P355NL1 and 18G2A steel using new energy parameter based on j-integral approach. Eng. Fail. Anal. 2019. submitted for publication. [Google Scholar]
- Breitbarth, E.; Besel, M. Energy based analysis of crack tip plastic zone of AA2024-T3 under cyclic loading. Int. J. Fatigue 2017, 100, 263–273. [Google Scholar] [CrossRef]
- De Oliveira Correia, J.A.F. An integral probabilistic approach for fatigue lifetime prediction of mechanical and structural components. Ph.D. Thesis, Universidade do Porto, Porto, Portugal, 2015. [Google Scholar]
- ASTM E647: Standard Test Method for Measurement of Fatigue Crack Growth Rates. In Annual Book of ASTM Standards; ASTM: West Conshohocken, PA, USA, 2011.
- Becker, T.H.; Mostafavi, M.; Tait, R.B.; Marrow, T.J. An approach to calculate the J-integral by digital image correlation displacement field measurement. Fatigue Fract. Eng. Mater. Struct. 2012, 35, 971–984. [Google Scholar] [CrossRef]
- Vavrik, D.; Jandejsek, I. Experimental evaluation of contour J integral and energy dissipated in the fracture process zone. Eng. Fract. Mech. 2014, 129, 14–25. [Google Scholar] [CrossRef] [Green Version]
Figure 1.
Schematic Kinetic Fatigue Fracture Diagram (KFFD): (a) sigmoidal shape of the fatigue crack growth rate (FCGR) curve; (b) the scheme of the stress R-ratio impact on the FCGR curves (R4 > R3 > R2 > R1).
Figure 1.
Schematic Kinetic Fatigue Fracture Diagram (KFFD): (a) sigmoidal shape of the fatigue crack growth rate (FCGR) curve; (b) the scheme of the stress R-ratio impact on the FCGR curves (R4 > R3 > R2 > R1).

Figure 2.
Schematic representation of plastic zones ahead of a fatigue crack tip with the marked Crack Tip Opening Displacement CTOD—δ.
Figure 2.
Schematic representation of plastic zones ahead of a fatigue crack tip with the marked Crack Tip Opening Displacement CTOD—δ.

Figure 3.
Schematic representation of the ΔS* components during cyclic loading.

Figure 4.
Fatigue testing machine MZGS-100: 1—bed, 2—rotational head with a holder, 3—specimen, 4—holder, 5—lever (effective length = 0.2 m), 6—motor, 7—rotating disk, 8—unbalanced mass, 9—flat springs, 10—driving belt, 11—spring actuator, 12—spring, 13—hydraulic connector [36].
Figure 4.
Fatigue testing machine MZGS-100: 1—bed, 2—rotational head with a holder, 3—specimen, 4—holder, 5—lever (effective length = 0.2 m), 6—motor, 7—rotating disk, 8—unbalanced mass, 9—flat springs, 10—driving belt, 11—spring actuator, 12—spring, 13—hydraulic connector [36].

Figure 5.
Scheme of the specimen subjected for the bending test in Gasiak & Rozumek [35] experiment, L = 120 mm, W = 20 mm, notch length a0 = 5 mm (notch tip angle 60°, root radius ρ = 5 mm), a—fatigue crack length.
Figure 5.
Scheme of the specimen subjected for the bending test in Gasiak & Rozumek [35] experiment, L = 120 mm, W = 20 mm, notch length a0 = 5 mm (notch tip angle 60°, root radius ρ = 5 mm), a—fatigue crack length.

Figure 6.
Compact Tension (CT) specimen scheme and dimensions for the Mode I FCGR experiment (puddle iron, all dimensions in mm).
Figure 6.
Compact Tension (CT) specimen scheme and dimensions for the Mode I FCGR experiment (puddle iron, all dimensions in mm).

Figure 7.
Fatigue crack growth curves for 10HNAP steel (a) based on the ΔJ crack driving force (based on data from [37]) and (b) based on the new, averaged ΔS* crack driving force.
Figure 7.
Fatigue crack growth curves for 10HNAP steel (a) based on the ΔJ crack driving force (based on data from [37]) and (b) based on the new, averaged ΔS* crack driving force.

Figure 8.
Fatigue crack growth curves for 18G2A steel (a) based on the ΔJ crack driving force (based on data from [37] and (b) based on the new, averaged ΔS* crack driving force.
Figure 8.
Fatigue crack growth curves for 18G2A steel (a) based on the ΔJ crack driving force (based on data from [37] and (b) based on the new, averaged ΔS* crack driving force.

Figure 9.
Fatigue crack growth curves for the puddle iron from the Eiffel bridge (a) based on the ΔJ crack driving force and (b) based on the new, averaged ΔS* crack driving force.
Figure 9.
Fatigue crack growth curves for the puddle iron from the Eiffel bridge (a) based on the ΔJ crack driving force and (b) based on the new, averaged ΔS* crack driving force.


Table 1.
Chemical composition (in % by weight) of the tested materials.
| Material | C | Mn | Si | P | S | Cr | Ni | Cu | Fe |
|---|---|---|---|---|---|---|---|---|---|
| 10HNAP [37] | 0.14 | 0.88 | 0.31 | 0.066 | 0.027 | 0.73 | 0.30 | 0.345 | bal. |
| 18G2A [36] | 0.20 | 1.49 | 0.33 | 0.023 | 0.024 | 0.01 | 0.01 | 0.035 | bal. |
| tested puddle iron | 0.01 | 0.01 | 0.07 | 0.354 | 0.045 | - | - | - | bal. |
Table 2.
Static mechanical properties of the analyzed metallic materials.
| Material | Ultimate Tensile Strength UTS (MPa) | Yield Strength σpl/σ0.2 (MPa) | Young Modulus E (GPa) | Poisson Ratio ν (-) | Fracture Toughness JIC (MPa·m) |
|---|---|---|---|---|---|
| 10HNAP [37] | 566 | 418 | 215 | 0.29 | 0.178 |
| 18G2A [36] | 535 | 357 | 210 | 0.3 | 0.320 |
| Eiffel Bridge puddle iron [46] | 342 | 292 | 193 | 0.3 | n/a |
Table 3.
Low cycle fatigue properties of the analyzed materials.
| Material | Fatigue Strength Coefficient σf’ (MPa) | Fatigue Ductility Coefficient εf’ (-) | Fatigue Strength Exponent b (-) | Fatigue Ductility Exponent c (-) |
|---|---|---|---|---|
| 10HNAP [37] | 746 | 0.442 | −0.080 | −0.601 |
| 18G2A [36] | 782 | 0.693 | −0.118 | −0.410 |
| Puddle Iron Eiffel Bridge [46] | 603 | 0.160 | −0.078 | −0.797 |
Table 4.
Statistical analysis of data fitting for the Kinetic Fatigue Fracture Diagram (KFFD) based on ΔJ and ΔS* (all R-ratios).
Table 4.
Statistical analysis of data fitting for the Kinetic Fatigue Fracture Diagram (KFFD) based on ΔJ and ΔS* (all R-ratios).
| All Data from FCGR Tests | R2 da/dN-(ΔJ) Equation (19) | R2 da/dN-(ΔS*) Equation (20) |
|---|---|---|
| 10HNAP | 0.73 | 0.94 |
| 18G2A | 0.54 | 0.91 |
| Puddle Iron from the Eiffel Bridge | 0.64 | 0.97 |
© 2019 by the author. Licensee MDPI, Basel, Switzerland. This article is an open access article distributed under the terms and conditions of the Creative Commons Attribution (CC BY) license (http://creativecommons.org/licenses/by/4.0/).
Share and Cite
MDPI and ACS Style
Lesiuk, G. Application of a New, Energy-Based ΔS* Crack Driving Force for Fatigue Crack Growth Rate Description. Materials 2019, 12, 518. https://doi.org/10.3390/ma12030518
AMA Style
Lesiuk G. Application of a New, Energy-Based ΔS* Crack Driving Force for Fatigue Crack Growth Rate Description. Materials. 2019; 12(3):518. https://doi.org/10.3390/ma12030518
Chicago/Turabian StyleLesiuk, Grzegorz. 2019. "Application of a New, Energy-Based ΔS* Crack Driving Force for Fatigue Crack Growth Rate Description" Materials 12, no. 3: 518. https://doi.org/10.3390/ma12030518
Note that from the first issue of 2016, this journal uses article numbers instead of page numbers. See further details here.