Temperature Field Numerical Analysis Mode and Verification of Quenching Heat Treatment Using Carbon Steel in Rotating Laser Scanning


Abstract
:1. Introduction
2. Finite Element Analysis Modelling
2.1. Laser Heat Source Modeling
2.2. FE Model for Circular Scanning of Moving Heat Source
3. Experimental Setup
4. Results and Discussion
4.1. Results of Finite Element Analysis and Experimental Results
4.2. Finite Element Prediction: Parametric Study
5. Conclusions
Author Contributions
Funding
Acknowledgments
Conflicts of Interest
References
- Martínez, S.; Lamikiz, A.; Ukar, E.; Calleja, A.; Arrizubieta, J.A.; de Lacalle, L.N.L. Analysis of the regimes in the scanner-based laser hardening process. Opt. Lasers Eng. 2017, 90, 72–80. [Google Scholar] [CrossRef]
- Martínez, S.; Lamikiz, A.; Ukar, E.; Tabernero, I.; Arrizubieta, I. Control loop tuning by thermal simulation applied to the laser transformation hardening with scanning optics process. Appl. Therm. Eng. 2016, 98, 49–60. [Google Scholar] [CrossRef]
- Martínez, S.; Lamikiz, A.; Tabernero, I.; Ukar, E. Laser Hardening Process with 2D Scanning Optics. Phys. Procedia 2012, 39, 309–317. [Google Scholar] [CrossRef] [Green Version]
- Sun, P.; Li, S.; Yu, G.; He, X.; Zheng, C.; Ning, W. Laser surface hardening of 42CrMo cast steel for obtaining a wide and uniform hardened layer by shaped beams. Int. J. Adv. Manuf. Technol. 2014, 70, 787–796. [Google Scholar] [CrossRef]
- Barka, N.; El Ouafi, A. Effects of Laser Hardening Process Parameters on Case Depth of 4340 Steel Cylindrical Specimen-A Statistical Analysis. J. Surf. Eng. Mater. Adv. Technol. 2015, 5, 124–135. [Google Scholar] [CrossRef]
- Orazi, L.; Liverani, E.; Ascari, A.; Fortunato, A.; Tomesani, L. Laser surface hardening of large cylindrical components utilizing ring spot geometry. Manuf. Technol. 2014, 63, 233–236. [Google Scholar] [CrossRef]
- Liverania, E.; Sorgenteb, D.; Ascaria, A.; Scintillac, L.D.; Palumboc, G.; Fortunatoa, A. Development of a model for the simulation of laser surface heattreatments with use of a physical simulator. J. Manuf. Process. 2017, 26, 262–268. [Google Scholar] [CrossRef]
- Tricarico, L.; Ancona, A.; Palumbo, G.; Sorgente, D.; Spina, R.; Lugarà, P.M. Discrete spot laser hardening and remelting with a high-brilliance source for surface structuring of a hypereutectoid steel. Mater. Des. 2017, 115, 194–202. [Google Scholar] [CrossRef]
- Li, R.; Jin, Y.; Li, Z.; Qi, K. A Comparative Study of High-Power Diode Laser and CO2 Laser Surface Hardening of AISI 1045 Steel. J. Mater. Eng. Perform. 2014, 23, 3085–3091. [Google Scholar] [CrossRef]
- Lakhkar, R.S.; Shin, Y.C.; Krane, J.M. Predictive Modeling of Muti-track Laser Hardening of AISI 4140 Steel. Mater. Sci. Eng. 2008, 480, 209–217. [Google Scholar] [CrossRef]
- Kusuhara, T.; Morimoto, J.; Abe, N.; Tsukamoto, M. 3-D Finite Element Temperature Field Modeling for Direct Diode Laser Hardening of Carbon Steel. In Proceedings of the IEEE 2011 4th International Conference on Modeling, Simulation and Applied Optimization (ICMSAO), Kuala Lumpur, Malaysia, 19–21 April 2011. [Google Scholar]
- Wiedenmann, R.; Zaeh, M.F. Laser-Assisted Milling—Process Modeling and Experimental Validation. CIRP J. Manuf. Sci. Technol. 2015, 8, 70–77. [Google Scholar] [CrossRef]
- Woo, W.S.; Lee, C.M. A Study of the Machining Characteristics of AISI 1045 Steel and Inconel 718 with A Cylindrical Shape in Laser-Assisted Milling. Appl. Therm. Eng. 2015, 91, 33–42. [Google Scholar] [CrossRef]
- Skvarenina, S.; Shin, Y.C. Predictive Modeling and Experimental Results for Laser Hardening of AISI 1536 Steel with Complex Geometric Features by a High Power Diode Laser. Surf. Coat. Technol. 2006, 201, 2256–2269. [Google Scholar] [CrossRef]
- Kim, D.H.; Lee, C.M. A Study of Cutting Force and Preheating-Temperature Prediction for Laser-Assisted Milling of Inconel 718 and AISI 1045 Steel. Int. J. Heat Mass Transf. 2014, 71, 264–274. [Google Scholar] [CrossRef]
- Pan, Z.; Feng, Y.; Hung, T.P.; Jiang, Y.C.; Hsu, F.C.; Wu, L.T.; Lin, C.F.; Lu, Y.C.; Liang, S.Y. Heat affected zone in the laser-assisted milling of Inconel 718. J. Manuf. Process. 2017, 30, 141–147. [Google Scholar] [CrossRef]
- Hung, T.P.; Shi, H.E.; Kuang, J.H. Temperature Modeling of AISI 1045 Steel during Surface Hardening Processes. Materials 2018, 11, 1815. [Google Scholar] [CrossRef] [PubMed]
- Ding, H.T.; Yung, C.S. A Metallo-Thermo mechanically Coupled Analysis of Orthogonal Cutting of AISI 1045 Steel. J. Manuf. Sci. Eng. 2012, 134, 051014. [Google Scholar] [CrossRef]
- Sainte-Catherine, C.; Jeandin, M.; Kechemair, D.; Ricaud, J.P.; Sabatier, L. Study of Dynamic Absorptivity at 10.6µm (CO2) and 1.06µm (Nd-YAG) Wavelengths as a Function of Temperature. Le J. De Phys. IV 1991, 1, 151–157. [Google Scholar]
- DeKock, J. Laser Heat Treating Advances for the Gear Industry; Gear Solutions, Media Solutions, Inc.: Pelham, AL, USA, 2004. [Google Scholar]
- Lusquinos, F.; Conde, J.C.; Bonss, S.; Riveiro, A.; Quintero, F.; Comesana, R.; Pou, J. Theoretical and Experimental Analysis of High Power Diode Laser (HPDL) Hardening of AISI 1045 Steel. Appl. Surf. Sci. 2007, 254, 948–954. [Google Scholar] [CrossRef]
- MSC Software Corporation. Marc Product Documentation Volume A: Theory and User Information; MSC Software Corporation: Glen Rock, NJ, USA, 2010. [Google Scholar]
- Brecher, C.; Emonts, M.; Rosen, C.-J.; Hermani, J.-P. Laser-assisted milling of advanced materials. Phys. Procedia 2011, 12, 599–606. [Google Scholar] [CrossRef]
- Abbaschian, R.; Reed-Hill, R.E. Physical Metallurgy Principles; Cengage Learning: Boston, MA, USA, 2009; pp. 562–602. ISBN 978-0-45-08254-5. [Google Scholar]


| Property | Values |
|---|---|
| Density (kg/m3) | 7870 |
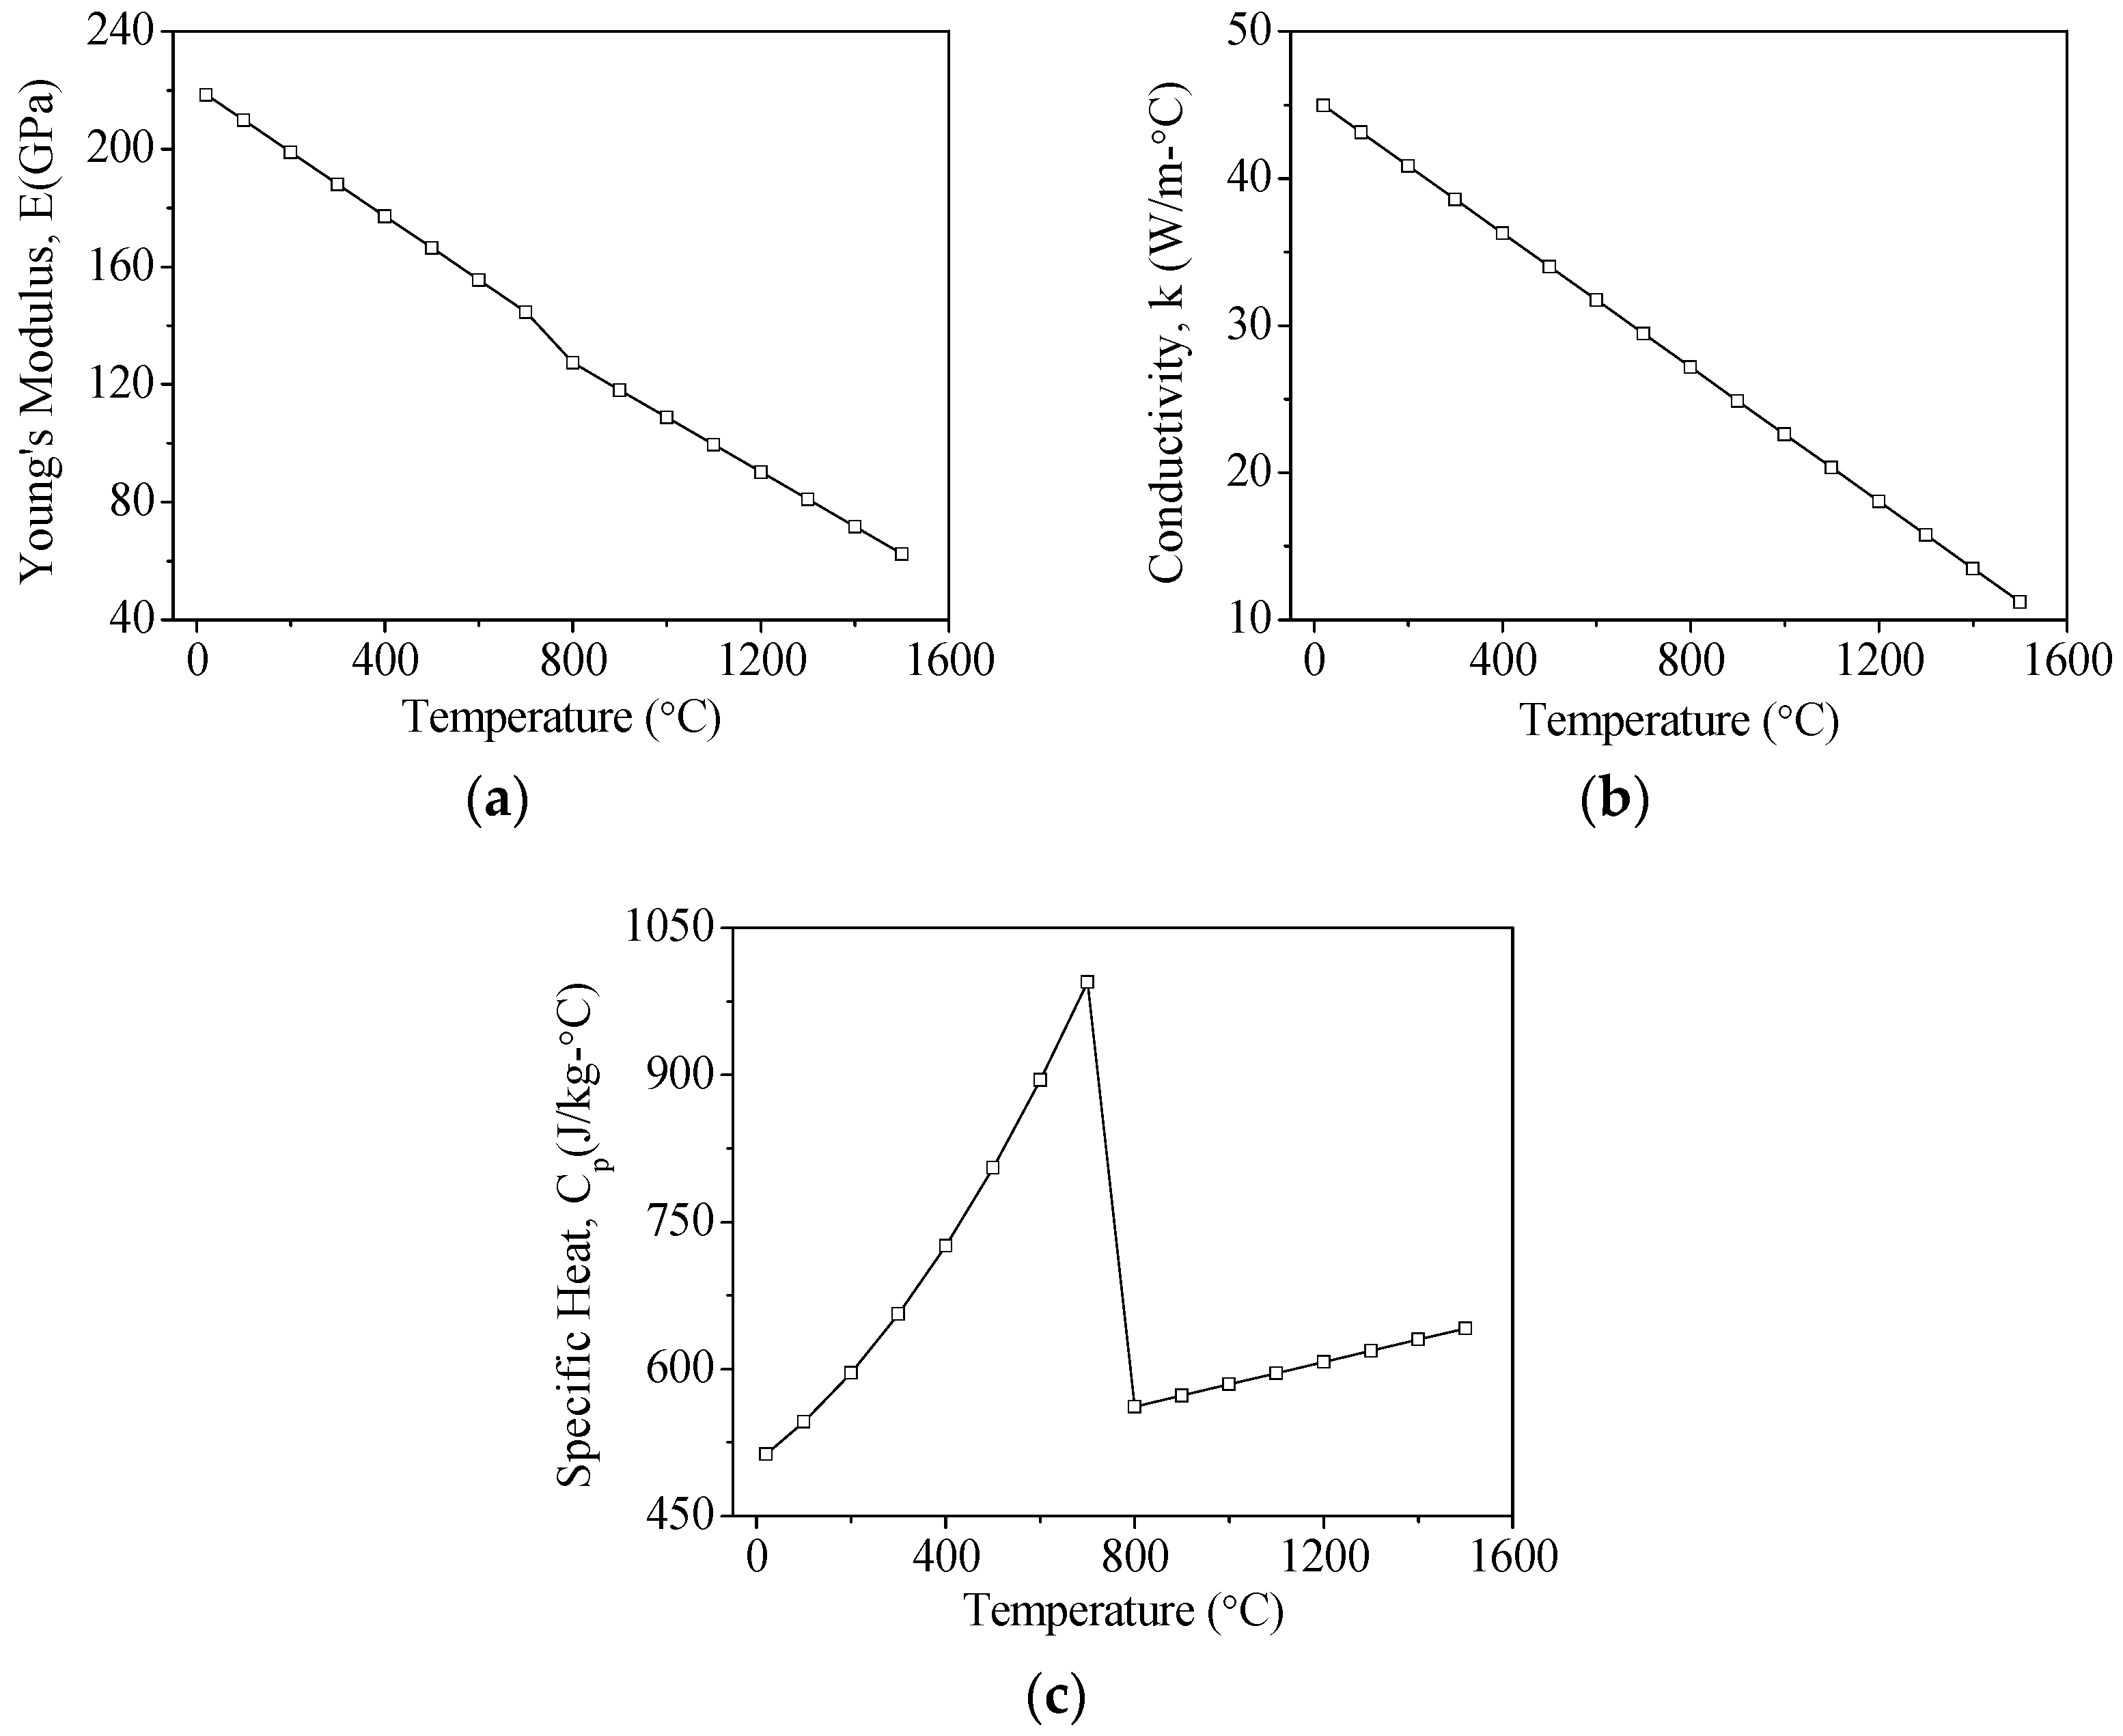
| Thermal Conductivity (W/m·°C) | Figure 2 |
| Specific Heat (J/kg·°C) | Figure 2 |
| Young’s Modulus (GPa) | Figure 2 |
| Yield Strength (MPa) | 310 |
| Coefficient of Thermal Expansion (CTE, μm/m·°C) | 15 |
| Poisson’s Ratio | 0.27 |
| Hardening Temperature (°C) | 760 |
| Melting Temperature (°C) | 1520 |
| Tempering Temperature (°C) | 400 |
| S = 100 rpm, F = 100 mm/min | ||||
|---|---|---|---|---|
| EXP. No. | Laser Power (W) | Non-Heat-Treatment Hardness (HV) | After Quenching Hardness (HV) | Hardness Increase or Decrease Rate (%) |
| 1 | 400 | 317.3 | 222.2 | −29.97 |
| 2 | 500 | 767.2 | 141.79 | |
| 3 | 600 | 363.2 | 14.47 | |
| 4 | 900 | 407.9 | 28.55 | |
| S = 100 rpm, F = 100 mm/min | |||||
|---|---|---|---|---|---|
| EXP. No. | Laser Power (W) | Experimental Hardness Depth (μm) | Min. Hardness at Cross Section (HV) | Max. Hardness at Cross Section (HV) | FEM Hardness Depth (μm) |
| 1 | 400 | 0 | 165 | 191 | 0 |
| 2 | 500 | 100 | 171 | 534 | 118.55 |
| 3 | 600 | 153 | 161 | 226 | 181.38 |
| 4 | 900 | 0 | 168 | 232 | 0 |
| Laser Power (W) | Feed Rate (mm/min) | FEM Max. Temperature (°C) (at P1) | EXP. Max. Temperature (°C) (at P4) | FEM Max. Temperature (°C) (at P4) | Prediction Error (%) (at P4) |
|---|---|---|---|---|---|
| 500 | 100 | 803.9 | 370.8 | 392.29 | 5.8 |
| 200 | 774.4 | 164.9 | 165.49 | 0.36 | |
| 300 | 758.5 | 85.1 | 90.49 | 6.33 | |
| 600 | 100 | 994.4 | 298.3 | 292.52 | −1.94 |
| 200 | 922.1 | 254.1 | 262.84 | 3.44 | |
| 300 | 898.9 | 186.4 | 182.35 | −2.17 | |
| 700 | 100 | 1228 | 352.5 | 354.84 | 0.66 |
| 200 | 1118 | 341.3 | 344.64 | 0.98 | |
| 300 | 1082 | 225.8 | 223.44 | −1.05 |
© 2019 by the authors. Licensee MDPI, Basel, Switzerland. This article is an open access article distributed under the terms and conditions of the Creative Commons Attribution (CC BY) license (http://creativecommons.org/licenses/by/4.0/).
Share and Cite
Hung, T.-P.; Hsu, C.-M.; Tsai, H.-A.; Chen, S.-C.; Liu, Z.-R. Temperature Field Numerical Analysis Mode and Verification of Quenching Heat Treatment Using Carbon Steel in Rotating Laser Scanning. Materials 2019, 12, 534. https://doi.org/10.3390/ma12030534
Hung T-P, Hsu C-M, Tsai H-A, Chen S-C, Liu Z-R. Temperature Field Numerical Analysis Mode and Verification of Quenching Heat Treatment Using Carbon Steel in Rotating Laser Scanning. Materials. 2019; 12(3):534. https://doi.org/10.3390/ma12030534
Chicago/Turabian StyleHung, Tsung-Pin, Chao-Ming Hsu, Hsiu-An Tsai, Shuo-Ching Chen, and Zong-Rong Liu. 2019. "Temperature Field Numerical Analysis Mode and Verification of Quenching Heat Treatment Using Carbon Steel in Rotating Laser Scanning" Materials 12, no. 3: 534. https://doi.org/10.3390/ma12030534