Article

Enhanced Electrochemical Performances of Cobalt-Doped Li2MoO3 Cathode Materials

1
State Key Laboratory of Advanced Technology for Materials Synthesis and Processing, Wuhan University of Technology, Wuhan 430070, China
2
School of Materials Science and Engineering, Wuhan University of Technology, Wuhan 430070, China
3
International School of Materials Science and Engineering, Wuhan University of Technology, Wuhan 430070, China
*
Authors to whom correspondence should be addressed.
Materials 2019, 12(6), 843; https://doi.org/10.3390/ma12060843
Submission received: 7 February 2019 / Revised: 7 March 2019 / Accepted: 9 March 2019 / Published: 13 March 2019
(This article belongs to the Special Issue Advances in Electrochemical Energy Materials)

Abstract

:
Co-doped Li2MoO3 was successfully synthesized via a solid phase method. The impacts of Co-doping on Li2MoO3 have been analyzed by X-ray photoelectron spectroscopy (XPS), X-ray powder diffraction (XRD), scanning electron microscope (SEM), and Fourier transform infrared spectroscopy (FTIR) measurements. The results show that an appropriate amount of Co ions can be introduced into the Li2MoO3 lattices, and they can reduce the particle sizes of the cathode materials. Electrochemical tests reveal that Co-doping can significantly improve the electrochemical performances of the Li2MoO3 materials. Li2Mo0.90Co0.10O3 presents a first-discharge capacity of 220 mAh·g−1, with a capacity retention of 63.6% after 50 cycles at 5 mA·g−1, which is much better than the pristine samples (181 mAh·g−1, 47.5%). The enhanced electrochemical performances could be due to the enhancement of the structural stability, and the reduction in impedance, due to the Co-doping.

1. Introduction

Recently, the development of high-capacity cathode materials has become a hot topic in the field of Li-ion batteries. Mn-based Li-rich layer oxides xLi2MnO3·(1 − x)LiMO2 (0 < x < 1.0, M = Mn, Ni, Co, etc.) were proposed as potential cathode materials, due to their high discharge capacities of above 280 mAh·g−1, and thus, the structure stability of the Li2MnO3 component [1,2,3,4,5,6,7,8]. Unfortunately, numerous reports have indicated that the drawbacks of Li2MnO3-based composites, such as low initial Coulombic efficiency, a fast decline in capacity, and potential safety hazards, were difficult to overcome, which severely restricted their practice applications [9,10,11]. Thus, much attention has been paid to find other transition metals instead of Mn, to build new Li2MO3 (M = Ru, Ir, Mo, etc.)-based materials for next generation Li–ion batteries in recent years [12,13,14,15].
Li2MoO3 as a type of Li–rich layer cathode material with alternating Li layers and randomly distributed [Li1/3Mo2/3] layers, has attracted much research interest [15,16,17,18,19,20,21]. The previous studies verified that Li2MoO3 promised a high theoretical capacity of up to 339 mAh·g−1, and a near-absence of oxygen evolution [17,18], which supported Li2MoO3 as a candidate to replace Li2MnO3 in constructing Li-rich cathode materials. However, the poor cycling stability and rate capability of the Li2MoO3 material, owing to its low conductivity and irreversible phase transition, hinders its practical application. Hence, it is necessary to find a suitable modification method to improve the performance of the Li2MoO3 material.
At present, only a few studies about on modifying Li2MoO3 have been reported [19,20,21]. Ceder’s group constructed a solid solution between Li2MoO3 and LiCrO2 for cathode materials [19]. The Li2MoO3–LiCrO2 cathode materials presented not only high-discharge capacities, but also great cycling stabilities over the 10 cycles. In our previous study, carbon-coated Li2MoO3 composites were successfully prepared, and they achieved much lower impedances and better electrochemical performances than bare Li2MoO3 [21]. Cobalt doping has been considered to be a facile and effective method in enhancing the electrochemical performances, since it can improve structure stability and reduce the impedance of cathode materials [22,23,24,25,26]. In this paper, cobalt was selected to improve the electrochemical performances of Li2MoO3 for the first time. The structural characteristics and electrochemical performances of Li2Mo1−xCoxO3 are presented here.

2. Materials and Methods

2.1. Preparation of the Li2Mo1−xCoxO3 Powder

The pristine and Co-doped Li2MoO3 powders were synthesized via a solid reaction method, as shown in Figure 1. Firstly, stoichiometric amounts of Li2CO3 (>99.7%, Sinopahrm Medicine, Shanghai, China), MoO3 (>99.5%, Aldrich, Shanghai, China), and 2CoCO3·3Co(OH)2 (>99.5%, Aldrich, Shanghai, China) were homogeneously mixed by ball milling, and then calcinated at 873 K for 24 h under air, to obtain the precursor. Li2CO3 was added in at 10% excess to compensate Li volatilization. After that, the obtained precursor was reduced in a stream of flowing 5%H2/95%N2 at 973 K for 48 h to prepare Li2Mo1−xCoxO3.

2.2. Physical Characterization

X-ray powder diffraction (XRD) was carried out by using a PhilipsX’ Pert PW3050/60 diffractometer (PANalytical. B. V, Lelyweg, the Netherlands), with a scan rate of 0.02° per second, by Cu–Kα radiation (λ = 1.5406 Å). X’pert Highscor software (PANalytical. B. V, Lelyweg, the Netherlands) was used for Rietveld refinement. The morphologies of the samples was determined by a HITACHI S-4800 field-emission high-resolution scanning electron microscope (SEM) (Hitachi, Tokyo, Japan). X-ray photoelectron spectroscopy (XPS) was detected on a ESCALAB250Xi (ThermoFisher, Waltham, America). Fourier transform infrared spectroscopy (FTIR) was detected on Nicolet6700 (ThermoFisher, Waltham, America) in the wave range of 4000–400 cm−1 with a high resolution of 4 cm−1.

2.3. Electrochemical Tests

The electrochemical performances were tested through CR2032-type coin cells (HF-Kejing, Hefei, China). Cathodes were prepared by mixing 70 wt % Li2Mo1−xCoxO3, 20 wt % acetylene carbon black and 10 wt % polyvinylidene fluoride (PVDF) in N-methyl-2-pyrrolidone (NMP) solution. The slurry was cast evenly onto a stainless steel sheet, and dried in a vacuum oven (Suopuyiqi, Shanghai, China) at 120 °C for 12 h. Lithium metal and Celgard 2400 were used as the anode and separator, respectively. A concentration of 1 mol·L−1 LiPF6 in ethylene carbonate (EC)/dimethyl carbonate (DMC) (volume ratio: 1:1) solution was adopted as the electrolyte. The coin cells were assembled in an argon-filled glove box, and measured on a Land CT2001A system (LANHE, Wuhan, China) in galvanostatic mode at 30 °C. Electrochemical impedance spectroscopy (EIS) was tested using an electrochemical station (CHI660B) (Chenhua, Shanghai, China) in 10−2 Hz–10 MHz, with a voltage amplitude of 5 mV. Cycliation at a scanning speed of 10−1 mVc voltammetry (CV) was performed with the same electrochemical st s−1.

3. Results and Discussion

3.1. Characteristics of the as-Prepared Li2Mo1−xCoxO3

Figure 2a and b shows the XPS spectra of Co 2p3/2 in Li2Mo0.90Co0.10O3, and the corresponding precursor. The peak of Co 2p3/2 in the precursor is at 779.8 eV (Figure 2a) with a weak satellite at 789.9 eV. This satellite peak is 10.1 eV above Co 2p3/2, corresponding diamagnetic Co3+ (S = 0), which is very consistent with the XPS result reported for LiCoO2 [27]. After the reduction by hydrogen at a high temperature, the original satellite disappears, and a new intense satellite appears at 784.4 eV, as shown in Figure 2b. Compared with the original satellite, the new satellite is 4.1 eV higher than the core level line (780.3 eV), corresponding to high-spin Co2+ (S = 3/2) compounds, indicating that the valence state of the Co element will be reduced from Co3+ to Co2+ after reduction processing under hydrogen [28]. Figure 2c and d show that the XPS spectra of Mo in Li2MoO3 and Li2Mo0.90Co0.10O3. The peak at around 230.1 eV is assigned to Mo4+ 3d5/2, and the peak at around 232.6 eV is assigned to Mo6+ 3d5/2. Obviously, after cobalt doping, the peak intensity of Mo6+ 3d5/2 rises, and the peak intensity of Mo4+ 3d5/2 decreases, indicating an increased amount of Mo6+.
Figure 3a shows the XRD patterns of the synthesized Li2Mo1−xCoxO3 (x = 0, 0.05, 0.10, 0.15). Except the sample with x = 0.15, all samples match well with the α-NaFeO2 structure, which could be indexed to Li2MoO3 (see Figure 3a). When the Co content adds up to 0.15, the characteristic peaks of the impurity phase Li4MoO5 and Co appear. The splitting of the (006)/(101) peaks at 36°, reflecting that the layer structure weakens with the increase of Co content, indicating that Co-doping increases the disorder of the cations. Rietveld refinements for Li2Mo1−xCoxO3 were carried out, to obtain more information from XRD (see Figure 3b,c). The a(b)-parameters are increased, and c-parameters are decreased, with a rise of Co-doping content. Notably, the variations of cell parameters are negligible while x is higher than 0.10 considering the fitting error, which indicates that the solubility limit of Co is around x = 0.10. Moreover, the values of c/a drop with the increase of the Co-doping content, which indicates that Co-doping increases the disorder of Li2MoO3 materials. As indicated in the above XPS results, the valence of cobalt should be +2 in the samples. Its radius (0.745 Å) is very similar to that of Li+ (0.76 Å), which may result in the increase of disorder. Figure 3d exhibits the unit cell volume of the pristine and the Co-doped Li2MoO3. Clearly, the unit cell volume increases with the rise of the Co-doping contents, which could be related to the replacement of Mo4+ (0.65 Å) by Co2+ (0.745 Å).
In order to observe the impacts of Co-doping on the particle morphologies of the samples, the SEM images of Li2Mo1−xCoxO3 (x = 0, 0.05, 0.10) were examined (see Figure 4). The particle sizes of the pristine Li2MoO3 present a wide distribution range from 1 to 3 µm (see Figure 4a), whereas the doped samples show smaller particles with more uniform distributions in the range of 200–300 nm (see Figure 4b,c). The results suggest that the addition of Co affects the morphology, and decreases the particle size of cathode materials. Particle growth may be restricted by lattice distortion of Li2MoO3 due to the replacement of Mo by Co. Similar phenomena have also been observed by some other groups [29,30]. Ma, J. et al. studied the stability of Li2MoO3 in air [16]. Their results verified that Li2MoO3 easily adsorbed O2 and thus was partially oxidized to Li2MoO4. Meanwhile, the CO2 in air also reacted with Li2MoO3 to produce Li2CO3, which consumed the Li ions near the surface and produced MoO3 [16]. In order to investigate the effects of Co-doping on the stability of Li2Mo1−xCoxO3 in air, FTIR spectra of Li2MoO3 and Li2Mo0.90Co0.10O3 were carried out (see Figure 5). The samples were stored in the air for 7 days before the FTIR test. Obviously, both samples present a similar FTIR spectra. The peaks at 446, 497, 559 and 698 cm−1 are assigned to Li2MoO3, which is consistent with the previous study [16]. While the peaks at 1480, 1420, 830 and 817 cm−1 could be attributed to Li2CO3 and Li2MoO4, respectively. These species are believed to be the reaction products between of Li2MoO3, CO2 and O2, revealing that both samples are partially decomposed in air. No peaks related MoO3 are detected in the FTIR spectra, which may contribute to the shorter storage time compared with the previous report [16].

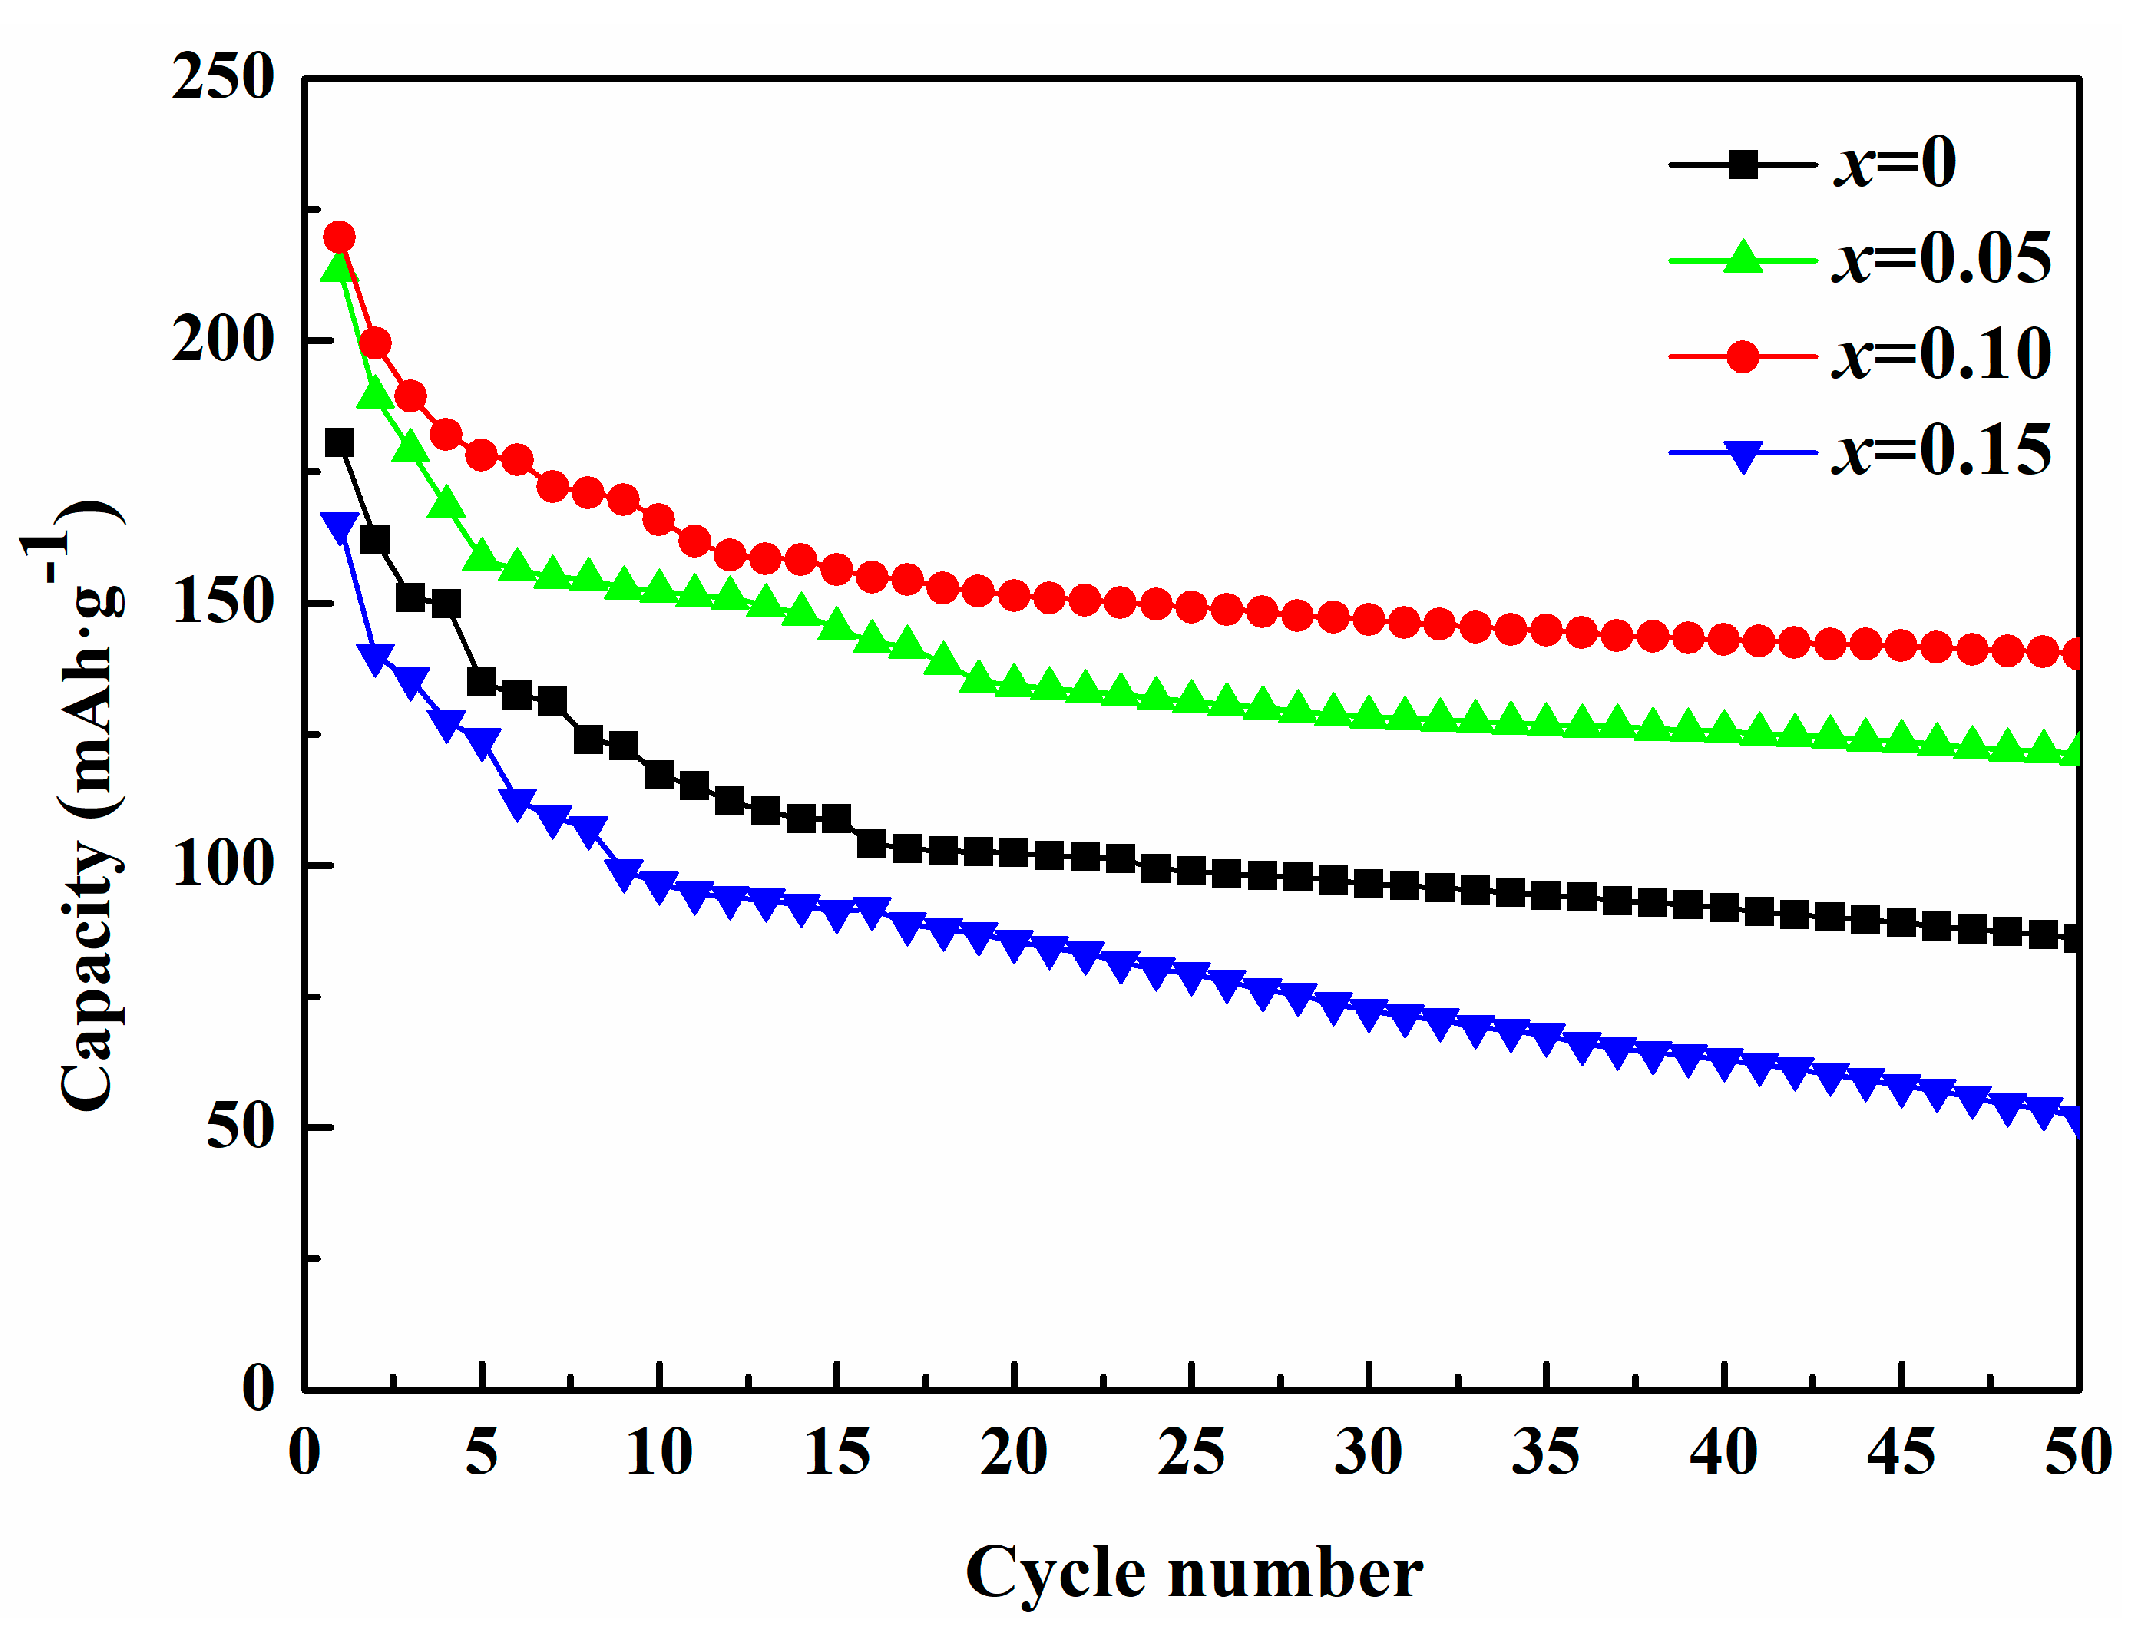
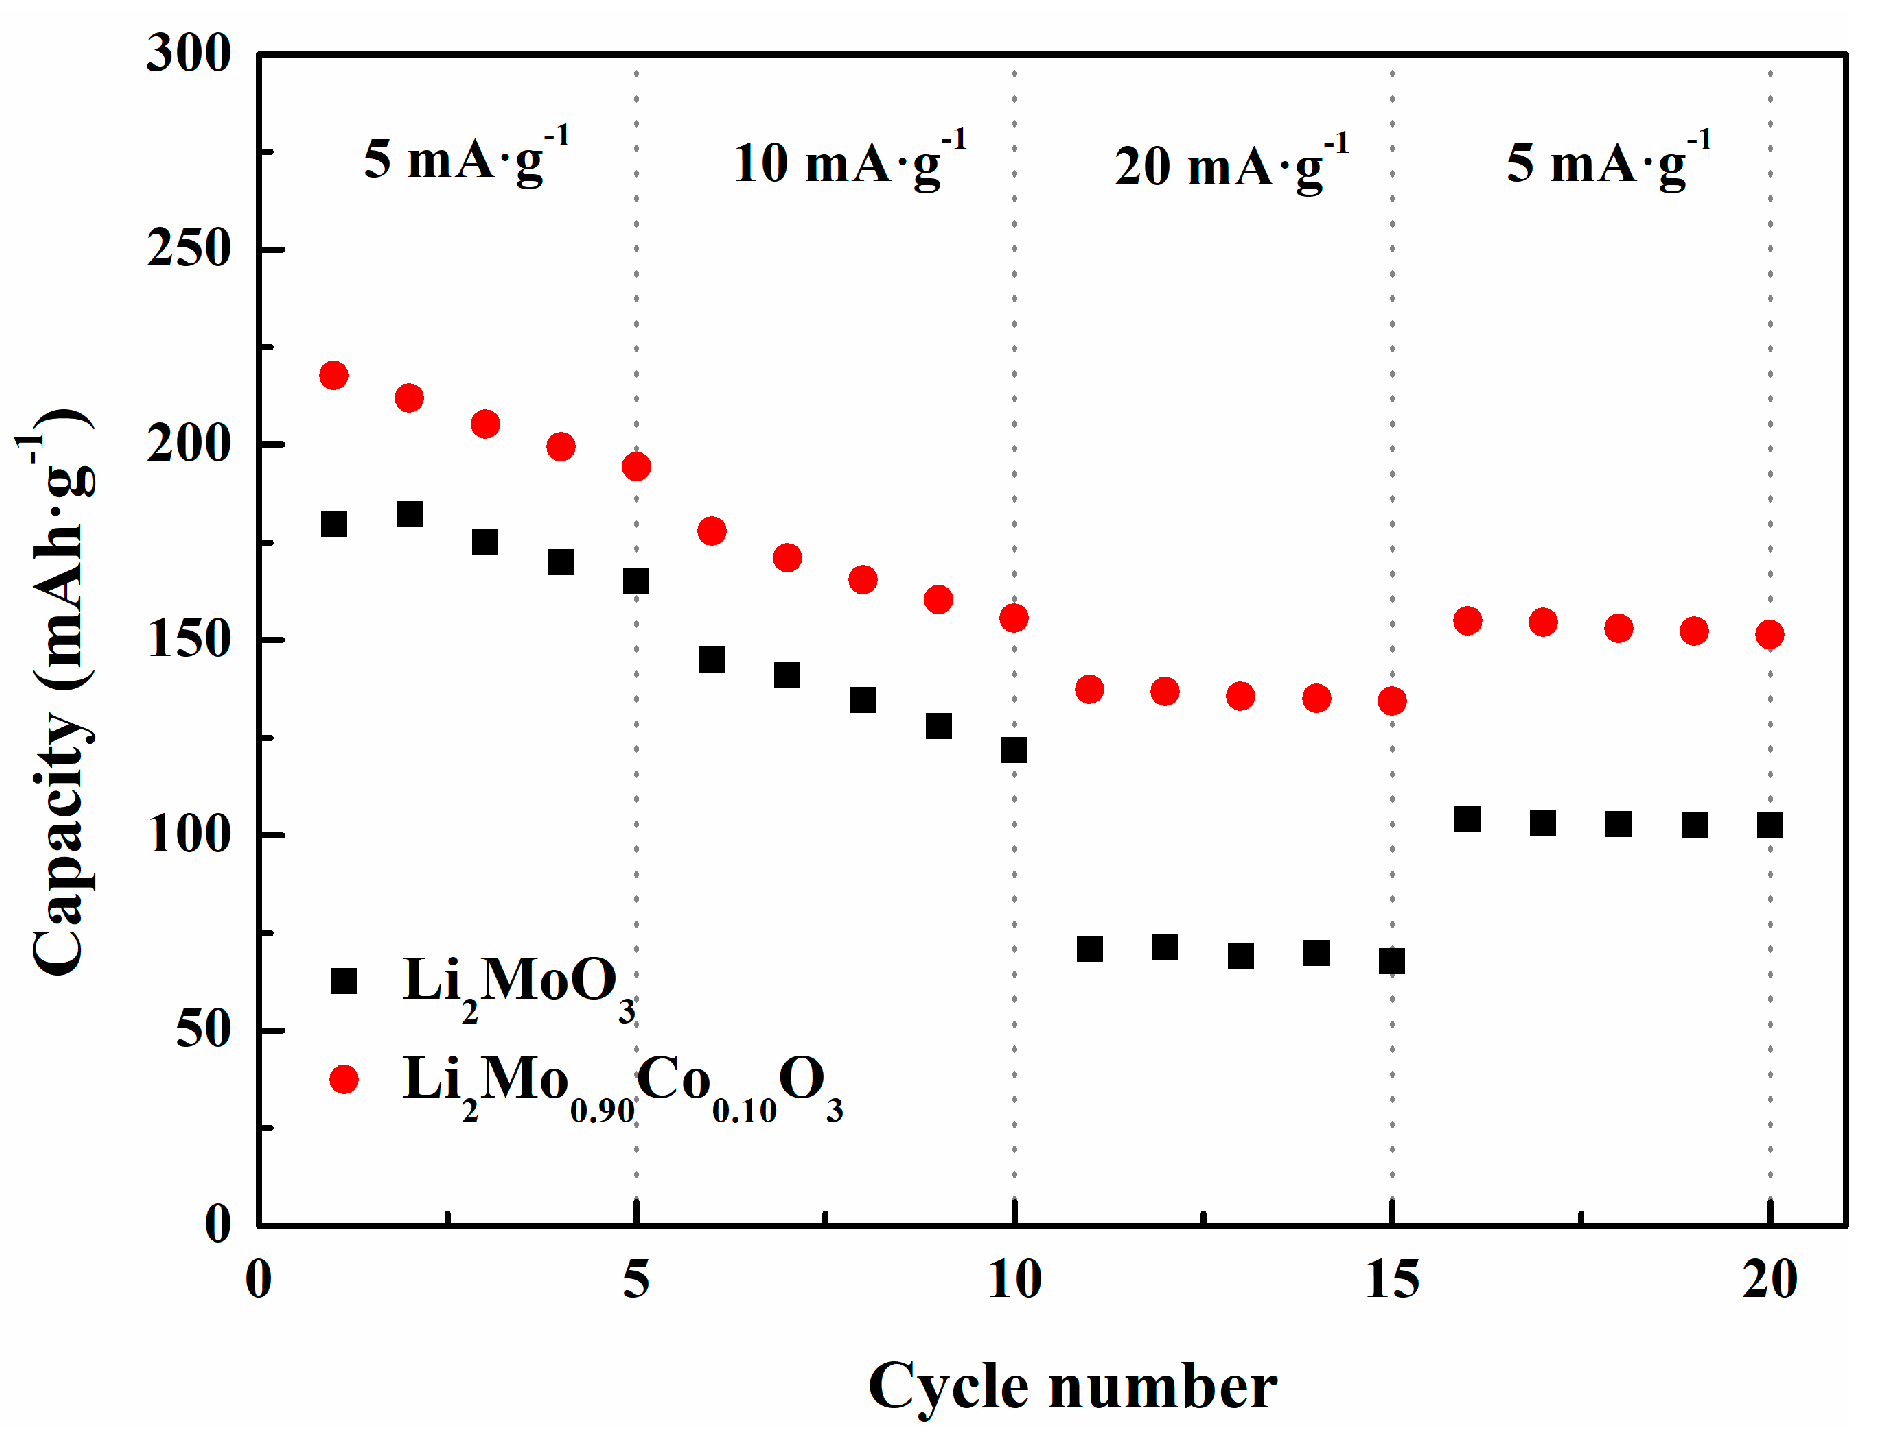
3.2. Electrochemical Performances

Figure 6 compares the initial charge-discharge profiles of pristine and Co-doped samples in the voltage range of 1.5–4.5 V at 5 mA·g−1. The samples present initial discharge capacities of 181, 213, 220 and 165 mAh·g−1, respectively. When the doping content is 0.05 and 0.10, the first discharge capacities of Co-doped samples are higher than that of the pristine sample. It also can be found the first discharge capacity decreases obviously while x = 0.15. What’s more, voltage difference between charge and discharge profiles of Li2Mo0.90Co0.10O3 is much smaller than that of pristine Li2MoO3, indicating that Co-doping can effectively suppress the polarization and enhance reversibility of Li2MoO3 materials. Notable that the charge behaviors with two regions for Co-doped Li2MoO3 cathode materials are similar to that for the pristine sample in the first charge-discharge process, which may relate to the delithiation reaction corresponding to the oxidation of the Mo ions in the 1.5–3.7 V region and a Li2MoO3-Li0.91MoO3 two phase reaction in the 3.7–4.5 V region [17].
Figure 7 shows the cycling performances of pristine and Co-doped samples between 1.5 and 4.5 V at 5 mA·g−1. It is clearly seen that Li2Mo0.95Co0.05O3 and Li2Mo0.90Co0.10O3 deliver much higher discharge capacity than that of pristine sample. After 50 cycles, pristine and Co-doped sample present the discharge capacities of 86, 121, 140 and 52 mAh·g−1 with the capacity retentions of 47.5%, 56.8%, 63.6% and 31.5%, respectively. Clearly, the cycling stability of pristine is poor. However, while increasing cobalt content to 0.05 and 0.10, the discharge capacity and cycling stability are significantly improved. With a further increase of Co content, the discharge capacity and cycling stability reduce, which may be attributed to the rise of inert impurities of Li4MoO5 and Co. Li4MoO5 delivers poor electrochemical performances because of its low electron conduction, low Coulombic efficiency and critical irreversible phase transition [31]. In addition, Co shows ignorable specific capacity above 1.5 V [32]. Therefore, the appearance of Co and Li4MoO5 in the sample has negative effects on the electrochemical performance of Li2MoO3. Li2Mo0.90Co0.10O3 possesses the highest discharge capacity and the best capacity retention, which indicates the amounts of dopant will be important for the electrochemical performances of Li2MoO3.
The comparison of rate capabilities between the pristine and Co-doped Li2MoO3 with current density from 5 mA·g−1 to 20 mA·g−1 is evaluated in Figure 8. The Li2Mo0.90Co0.10O3 possesses a higher discharge capacity of 218 mAh·g−1 at 5 mA·g−1 and 137 mAh·g−1 at 20 mA·g−1 than pristine Li2MoO3 material (180 mAh·g−1 at 5 mA·g−1 and 71 mAh·g−1 at 20 mA·g−1). The difference of discharge capacities between Li2MoO3 and Li2Mo0.90Co0.10O3 increases from 38 mAh·g−1 to 66 mAh·g−1 with a rise of current density from 5 mA·g−1 to 20 mA·g−1. When the current density returns to 5 mA·g−1, the discharge capacity of Li2Mo0.90Co0.10O3 could reach up 155 mAh·g−1, while that of pristine Li2MoO3 only lefts 104 mAh·g−1. The above results suggest that Co-doping significantly enhances the rate capability of Li2MoO3.
Figure 9 illustrates CV curves of Li2MoO3 and Li2Mo0.90Co0.10O3 between 1.5 and 4.5 V. The redox peaks of Li2MoO3 in CV curve are located at 2.965 V and 1.978 V, which are respectively related to the delithiation/lithiation processes corresponding to the oxidation/reduction of Mo4+/Mo6+ couple [18]. The oxidation peak of the Li2Mo0.90Co0.10O3 at 2.863 V is lower than that of Li2MoO3 and the reduction peak of the Li2Mo0.90Co0.10O3 at 2.136 V is above that of the pristine sample. Therefore, Li2Mo0.90Co0.10O3 possesses a smaller difference of the redox peak potential (∆E, 0.727 V) than Li2MoO3 (0.987 V). It is well known that difference of the redox peaks potential is highly correlated with electrode polarization. Hence, the conclusion can be drawn that Co-doping can reduce the polarization of Li2MoO3, which are coincident with the improvement in electrochemical performances.
To further analyze the kinetic behaviors of the pristine and Co-doped samples, EIS measurements of Li2MoO3 and Li2Mo0.90Co0.10O3 were carried out and the results are presented in Figure 10. Both EIS plots display similar shapes (see Figure 10a), which are fitted through the equivalent circuit (see Figure 10c) and the fitting results are listed in Table 1. In the equivalent circuit, Rf is related to Li+ diffusion in the SEI film, Rct is corresponding to the charge transfer resistance at electrolyte-electrode interface and Rs is considered to be ohmic resistance. As can be seen from Table 1, the Rs and Rf of both samples change slightly. In contrast, the Rct of Li2MoO3 is significantly reduced duo to the Co-doping. The Li2Mo0.90Co0.10O3 presents the Rct of 105.70 Ω, which is far below the pristine Li2MoO3 (478.75 Ω). The Rct is major part to the total electrode impedance, and its reduction reveals that Co-doping is very beneficial to enhance the kinetic behaviors of Li2MoO3. In addition, The Li+ ion diffusion coefficients (DLi+) were estimated by the following formula:
D L i + = R 2 T 2 2 A 2 F 4 C L i + 2 σ 2
R, T, A, F and CLi+ are the gas constant, the absolute temperature, the area of the electrode surface, the Faraday’s constant and the molar concentration of Li ions, respectively [7]. The σ corresponding to the Warburg factor could be calculated by the Z′/ω−0.5 (see Figure 10b) and the following formula:
Z = R f + R c t + σ ω 0.5
The improving trend in the values of DLi+ is very similar to the reducing trend in the values of Rct. The pristine and Co-doped Li2MoO3 deliver the Li+ ion diffusion coefficients of 3.89 × 10⁻¹⁷ and 1.94 × 10⁻¹⁶ cm2·s−1, respectively. As we can see, the Li+ ion diffusion coefficients of Li2MoO3 have an obvious growth due to the Co-doping. These results clearly indicate that Co-doping significantly improves the kinetics behavior of Li+ and reduces the impedance of Li2MoO3, which is responsible for the better rate capability and cycling stability of Li2Mo0.90Co0.10O3.
To investigate the structural transformation of the samples during charge-discharge process, XRD patterns of Li2MoO3 and Li2Mo0.90Co0.10O3 after 20 cycles are exhibited in Figure 11. There are notable differences in the structure of Li2MoO3 before and after cycling. For pristine Li2MoO3 material, the strongest diffraction peak transfers from (003) to (104) and ratio of (003)/(104) drops to 0.65 after cycling, which could be indexed into the Li-insufficient structure [17]. This Li-insufficient structure contributes to the partially reversible migration of the Mo ions and the partial recovery of the Mo3O13 clusters during charge-discharge processes, leading to irreversible capacity loss and poor cycling stability. In contrast, ratio of (003)/(104) of Li2Mo0.90Co0.10O3 after cycling can maintain at 0.83, which is much better than the pristine Li2MoO3 after cycling. It indicates that Co-doping can effectively enhance the structural stability during charge-discharge process.

4. Conclusions

Co-doped Li2MoO3 was successfully synthesized via a solid phase method. The influences of Co-doping on the structural and electrochemical characteristics of Li2MoO3 are analyzed. The results show that the addition of Co affects the morphology and decreases the particle size of cathode materials. Electrochemical measurements confirm that Co-doping can effectively improve the electrochemical performances of Li2MoO3 materials. The Li2Mo0.90Co0.10O3 presents an initial discharge capacity of 220 mAh·g−1 with the capacity retention of 63.6% after 50 cycles at 5 mA·g−1, which is much better than the pristine samples (181 mAh·g−1, 47.5%). Additionally, the rate capability of Li2MoO3 is also enhanced by Co-doping. It is found that the Li2Mo0.90Co0.10O3 delivers a much lower Rct and a higher Li+ ion diffusion coefficients than pristine Li2MoO3. What is more, the irreversible structural transformation is also suppressed by Co-doping. The enhanced electrochemical performances could be attributed to the improvement in structural stability and reduction in impedance due to the Co-doping. Our work reveals that doping modification will be a promising method for improving the electrochemical performances of Li2MoO3 material, and thus benefit for its application.

Author Contributions

Conceptualization, Z.Y. and H.L.; methodology, J.H. and W.L.; formal analysis, J.H. and W.L.; writing-original draft preparation, J.H.; supervision, writing-review and editing, Z.Y.

Funding

This research was funded by Natural Science Foundation of China, grant number 51372191 and National Basic Research Program of China, grant number 2015CB656401.

Conflicts of Interest

The authors declare no conflict of interest.

References

  1. Wang, Y.; Gu, H.T.; Song, J.H.; Feng, Z.; Zhou, X.; Zhou, Y.N.; Wang, K.; Xie, J. Suppressing Mn reduction of Li-rich Mn-based cathodes by F-doping for advanced lithium-ion batteries. J. Phys. Chem. C 2018, 122, 27836–27842. [Google Scholar] [CrossRef]
  2. Ma, J.; Zhou, Y.N.; Gao, Y.; Kong, Q.; Wang, Z.; Yang, X.Q.; Chen, L. Molybdenum substitution for improving the charge compensation and activity of Li2MnO3. Chem. Eur. J. 2014, 20, 8723–8730. [Google Scholar] [CrossRef] [PubMed]
  3. Zhao, W.; Xiong, L.; Xu, Y.; Xiao, X.; Wang, J.; Ren, Z. Magnesium substitution to improve the electrochemical performance of layered Li2MnO3 positive-electrode material. J. Power Sources 2016, 330, 37–44. [Google Scholar] [CrossRef]
  4. Bareño, J.; Balasubramanian, M.; Kang, S.H.; Wen, J.G.; Lei, C.H.; Pol, S.V.; Petrov, I.; Abraham, D.P. Long-range and local structure in the layered oxide Li1.2Co0.4Mn0.4O2. Chem. Mater. 2011, 23, 2039–2050. [Google Scholar] [CrossRef]
  5. Zhang, Q.; Peng, T.; Zhan, D.; Hu, X. Synthesis and electrochemical property of xLi2MnO3·(1 − x)LiMnO2 composite cathode materials derived from partially reduced Li2MnO3. J. Power Sources 2014, 250, 40–49. [Google Scholar] [CrossRef]
  6. Lanz, P.; Sommer, H.; Schulz, D.M.; Novák, P. Oxygen Release from high-energy xLi2MnO3·(1 − x)LiMO2 (M = Mn, Ni, Co): Electrochemical, differential electrochemical mass spectrometric, in situ pressure, and in situ temperature characterization. Electrochim. Acta 2013, 93, 114–119. [Google Scholar] [CrossRef]
  7. Kim, S.J.; Kim, M.C.; Kwak, D.H.; Kim, D.M.; Lee, G.H.; Choe, H.S.; Park, K.W. Highly stable TiO2 coated Li2MnO3 cathode materials for lithium-ion batteries. J. Power Sources 2016, 304, 119–127. [Google Scholar] [CrossRef]
  8. Wang, F.; Xiao, S.; Li, M.; Wang, X.; Zhu, Y.; Wu, Y.; Shirakawa, A.; Pe, J. A nanocomposite of Li2MnO3 coated by FePO4 as cathode material for lithium ion batteries. J. Power Sources 2015, 287, 416–421. [Google Scholar] [CrossRef]
  9. Xiao, R.; Li, H.; Chen, L. Density functional investigation on Li2MnO3. Chem. Mater. 2012, 24, 4242–4251. [Google Scholar] [CrossRef]
  10. Zheng, J.; Gu, M.; Xiao, J.; Zuo, P.; Wang, C.; Zhang, J.G. Corrosion/fragmentation of layered composite cathode and related capacity/voltage fading during cycling process. Nano Lett. 2013, 13, 3824–3830. [Google Scholar] [CrossRef] [PubMed]
  11. Bettge, M.; Li, Y.; Gallagher, K.; Zhu, Y.; Wu, Q.; Lu, W.; Bloom, I.; Abraham, D.P. Voltage fade of layered oxides: Its measurement and impact on energy density. J. Electrochem. Soc. 2013, 160, A2046–A2055. [Google Scholar] [CrossRef]
  12. Pearce, P.E.; Perez, A.J.; Rousse, G.; Saubanère, M.; Batuk, D.; Foix, D.; McCalla, E.; Abakumov, A.M.; Tendeloo, G.V.; Doublet, M.L.; et al. Evidence for anionic redox activity in a tridimensional-ordered Li-rich positive electrode β-Li2IrO3. Nat. Mater. 2017, 16, 580–586. [Google Scholar] [CrossRef]
  13. Miura, Y.; Yasui, Y.; Sato, M.; Igawa, N.; Kakurai, K. New-Ttype phase transition of Li2RuO3 with honeycomb structure. J. Phys. Soc. Jpn. 2007, 76, 033705. [Google Scholar] [CrossRef]
  14. Arunkumar, P.; Jeong, W.J.; Won, S.; Im, W.B. Improved electrochemical reversibility of over-lithiated layered Li2RuO3 cathodes: Understanding aliovalent Co3+ substitution with excess lithium. J. Power Sources 2016, 324, 428–438. [Google Scholar] [CrossRef]
  15. Takahashi, Y.; Kijima, N.; Hayakawa, H.; Awaka, J.; Akimoto, J. Single-crystal synthesis and structure refinement of Li2MoO3. J. Phys. Chem. Solids 2008, 69, 1518–1520. [Google Scholar] [CrossRef]
  16. Ma, J.; Gao, Y.R.; Wang, Z.X.; Chen, L. Structural and electrochemical stability of Li-rich layer structured Li2MoO3 in air. J. Power Sources 2014, 258, 314–320. [Google Scholar] [CrossRef]
  17. Ma, J.; Zhou, Y.N.; Gao, Y.R.; Yu, X.; Kong, Q.; Gu, L.; Wang, Z.; Yang, X.; Chen, L. Feasibility of using Li2MoO3 in constructing Li-rich high energy density cathode materials. Chem. Mater. 2014, 26, 3256–3262. [Google Scholar] [CrossRef]
  18. Self, E.C.; Zou, L.; Zhang, M.J.; Opfer, R.; Ruther, R.E.; Veith, G.M.; Song, B.; Wang, C.; Wang, F.; Huq, A.; et al. Synthesis and electrochemical and structural investigations of oxidatively stable Li2MoO3 and xLi2MoO3·(1 − x)LiMO2 composite cathodes. Chem. Mater. 2018, 30, 5061–5068. [Google Scholar] [CrossRef]
  19. Lee, J.; Urban, A.; Li, X.; Su, D.; Hautier, G.; Ceder, G. Unlocking the potential of cation-disordered oxides for rechargeable lithium batteries. Science 2014, 343, 519–522. [Google Scholar] [CrossRef]
  20. Kumakura, S.; Shirao, Y.; Kubota, K.; Komaba, S. Preparation and electrochemical properties of Li2MoO3/C composites for rechargeable Li-ion batteries. Phys. Chem. Chem. Phys. 2016, 18, 28556–28563. [Google Scholar] [CrossRef] [PubMed]
  21. Yu, Z.; Yu, T.; Li, W.; Hao, J.; Liu, H.; Sun, N.; Lu, M.; Ma, J. Improved electrochemical performances of carbon-coated Li2MoO3 cathode materials for Li-ion batteries. Int. J. Electrochem. Sci. 2018, 13, 4504–4511. [Google Scholar] [CrossRef]
  22. Yuan, B.; Liao, S.X.; Xin, Y.; Zhong, Y.; Shi, X.; Li, L.; Guo, X. Cobalt-doped lithium-rich cathode with superior electrochemical performance for lithium-ion batteries. RSC Adv. 2015, 5, 2947–2951. [Google Scholar] [CrossRef]
  23. Oz, E.; Demirel, S.; Altin, S. Fabrication and electrochemical properties of LiCo1−xRuxO2 cathode materials for Li-ion battery. J. Alloys Compd. 2016, 671, 24–33. [Google Scholar] [CrossRef]
  24. Tang, Z.; Wang, Z.; Li, X.; Peng, W. Preparation and electrochemical properties of Co-doped and none-doped Li[LixMn0.65(1−x)Ni0.35(1−x)]O2 cathode materials for lithium battery batteries. J. Power Sources 2012, 204, 187–192. [Google Scholar] [CrossRef]
  25. Song, J.; Shao, G.; Shi, M.; Ma, Z.; Song, W.; Wang, C.; Liu, S. The effect of doping Co on the electrochemical properties of LiFePO4/C nanoplates synthesized by solvothermal route. Solid State Ion. 2013, 253, 39–46. [Google Scholar] [CrossRef]
  26. Kim, Y. First principles investigation of the structure and stability of LiNiO2 doped with Co and Mn. J. Mater. Sci. 2012, 47, 7558–7563. [Google Scholar] [CrossRef]
  27. Becker, D.; Cherkashinin, G.; Hausbrand, R.; Jaegermann, W. Adsorption of diethyl carbonate on LiCoO2 thin films: Formation of the electrochemical interface. J. Phys. Chem. C 2014, 118, 962–967. [Google Scholar] [CrossRef]
  28. Guan, J.; Li, Y.; Guo, Y.; Su, R.; Gao, G.; Song, H.; Yuan, H.; Liang, B.; Guo, Z. Mechanochemical process enhanced cobalt and lithium recycling from wasted lithium-ion batteries. ACS Sustain. Chem. Eng. 2017, 5, 1026–1032. [Google Scholar] [CrossRef]
  29. Li, X.; Qu, M.; Yu, Z. Structural and electrochemical performances of Li4Ti5−xZrxO12 as anode material for lithium-ion batteries. J. Alloys Compd. 2009, 487, L12–L17. [Google Scholar] [CrossRef]
  30. Zhao, R.; Hung, I.M.; Li, Y.T.; Chen, H.; Lin, C.P. Synthesis and properties of Co-doped LiFePO4 as cathode material via a hydrothermal route for lithium-ion batteries. J. Alloys Compd. 2012, 513, 282–288. [Google Scholar] [CrossRef]
  31. Yabuuchi, N.; Tahara, Y.; Komaba, S.; Kitada, S.; Kajiya, Y. Synthesis and electrochemical properties of Li4MoO5-NiO binary system as positive electrode materials for rechargeable lithium batteries. Chem. Mater. 2016, 28, 416–419. [Google Scholar] [CrossRef]
  32. Kim, D.Y.; Ahn, H.J.; Kim, J.S.; Kim, I.P.; Kweon, J.H.; Nam, T.H.; Kim, K.W.; Ahn, J.H.; Hong, S.H. The Electrochemical properties of nano-sized cobalt powder as an anode material for lithium batteries. Electron. Mater. Lett. 2009, 5, 183–186. [Google Scholar] [CrossRef]
Figure 1. Flow chart of the process for preparing Li2Mo1−xCoxO3.
Materials 12 00843 g001
Figure 2. XPS spectra of Co in (a) the doped precursor, and (b) Li2Mo0.90Co0.10O3 and the XPS spectra of Mo in (c) Li2MoO3 and (d) Li2Mo0.90Co0.10O3.
Materials 12 00843 g002
Figure 3. (a) XRD patterns, (b) a(b)-parameters in the lattice, (c) c-parameters, and (d) unit cell volume of the synthesized Li2Mo1−xCoxO3 (x = 0, 0.05, 0.10, 0.15).
Materials 12 00843 g003
Figure 4. The SEM images of (a) Li2MoO3, (b) Li2Mo0.95Co0.05O3 and (c) Li2Mo0.90Co0.10O3.
Materials 12 00843 g004
Figure 5. The FTIR spectra of Li2MoO3 and Li2Mo0.90Co0.10O3.
Materials 12 00843 g005
Figure 6. The initial charge–discharge profiles of the synthesized Li2Mo1−xCoxO3 (x = 0, 0.05, 0.10, 0.15) between 1.5 and 4.5 V at 5 mA·g−1.
Materials 12 00843 g006
Figure 7. Cycling performances of the synthesized Li2Mo1−xCoxO3 (x = 0, 0.05, 0.10, 0.15) between 1.5 and 4.5 V at 5 mA·g−1.
Materials 12 00843 g007
Figure 8. Rate performances of Li2MoO3 and Li2Mo0.90Co0.10O3 at different current density.
Materials 12 00843 g008
Figure 9. CV curves of Li2MoO3 and Li2Mo0.90Co0.10O3 between 1.5 and 4.5 V at the 5th cycle.
Materials 12 00843 g009
Figure 10. (a) EIS plots of Li2MoO3 and Li2Mo0.90Co0.10O3 after 20 cycles between 1.5 and 4.5 V at 5 mA·g−1, (b) Z′ vs. ω−0.5 at low frequency of EIS plots and (c) equivalent circuit model.
Materials 12 00843 g010
Figure 11. XRD patterns of Li2MoO3 and Li2Mo0.90Co0.10O3 after 20 cycles.
Materials 12 00843 g011
Table 1. Fitting results of EIS plots.
SamplesRsRfRctDLi+ (cm2·s−1)
Li2MoO36.2132.73478.753.89 × 10−17
Li2Mo0.90Co0.10O35.8925.79105.701.94 × 10−16

