Effects of the Limestone Particle Size on the Sulfation Reactivity at Low SO2 Concentrations Using a LC-TGA

 ,
,
Abstract
:1. Introduction
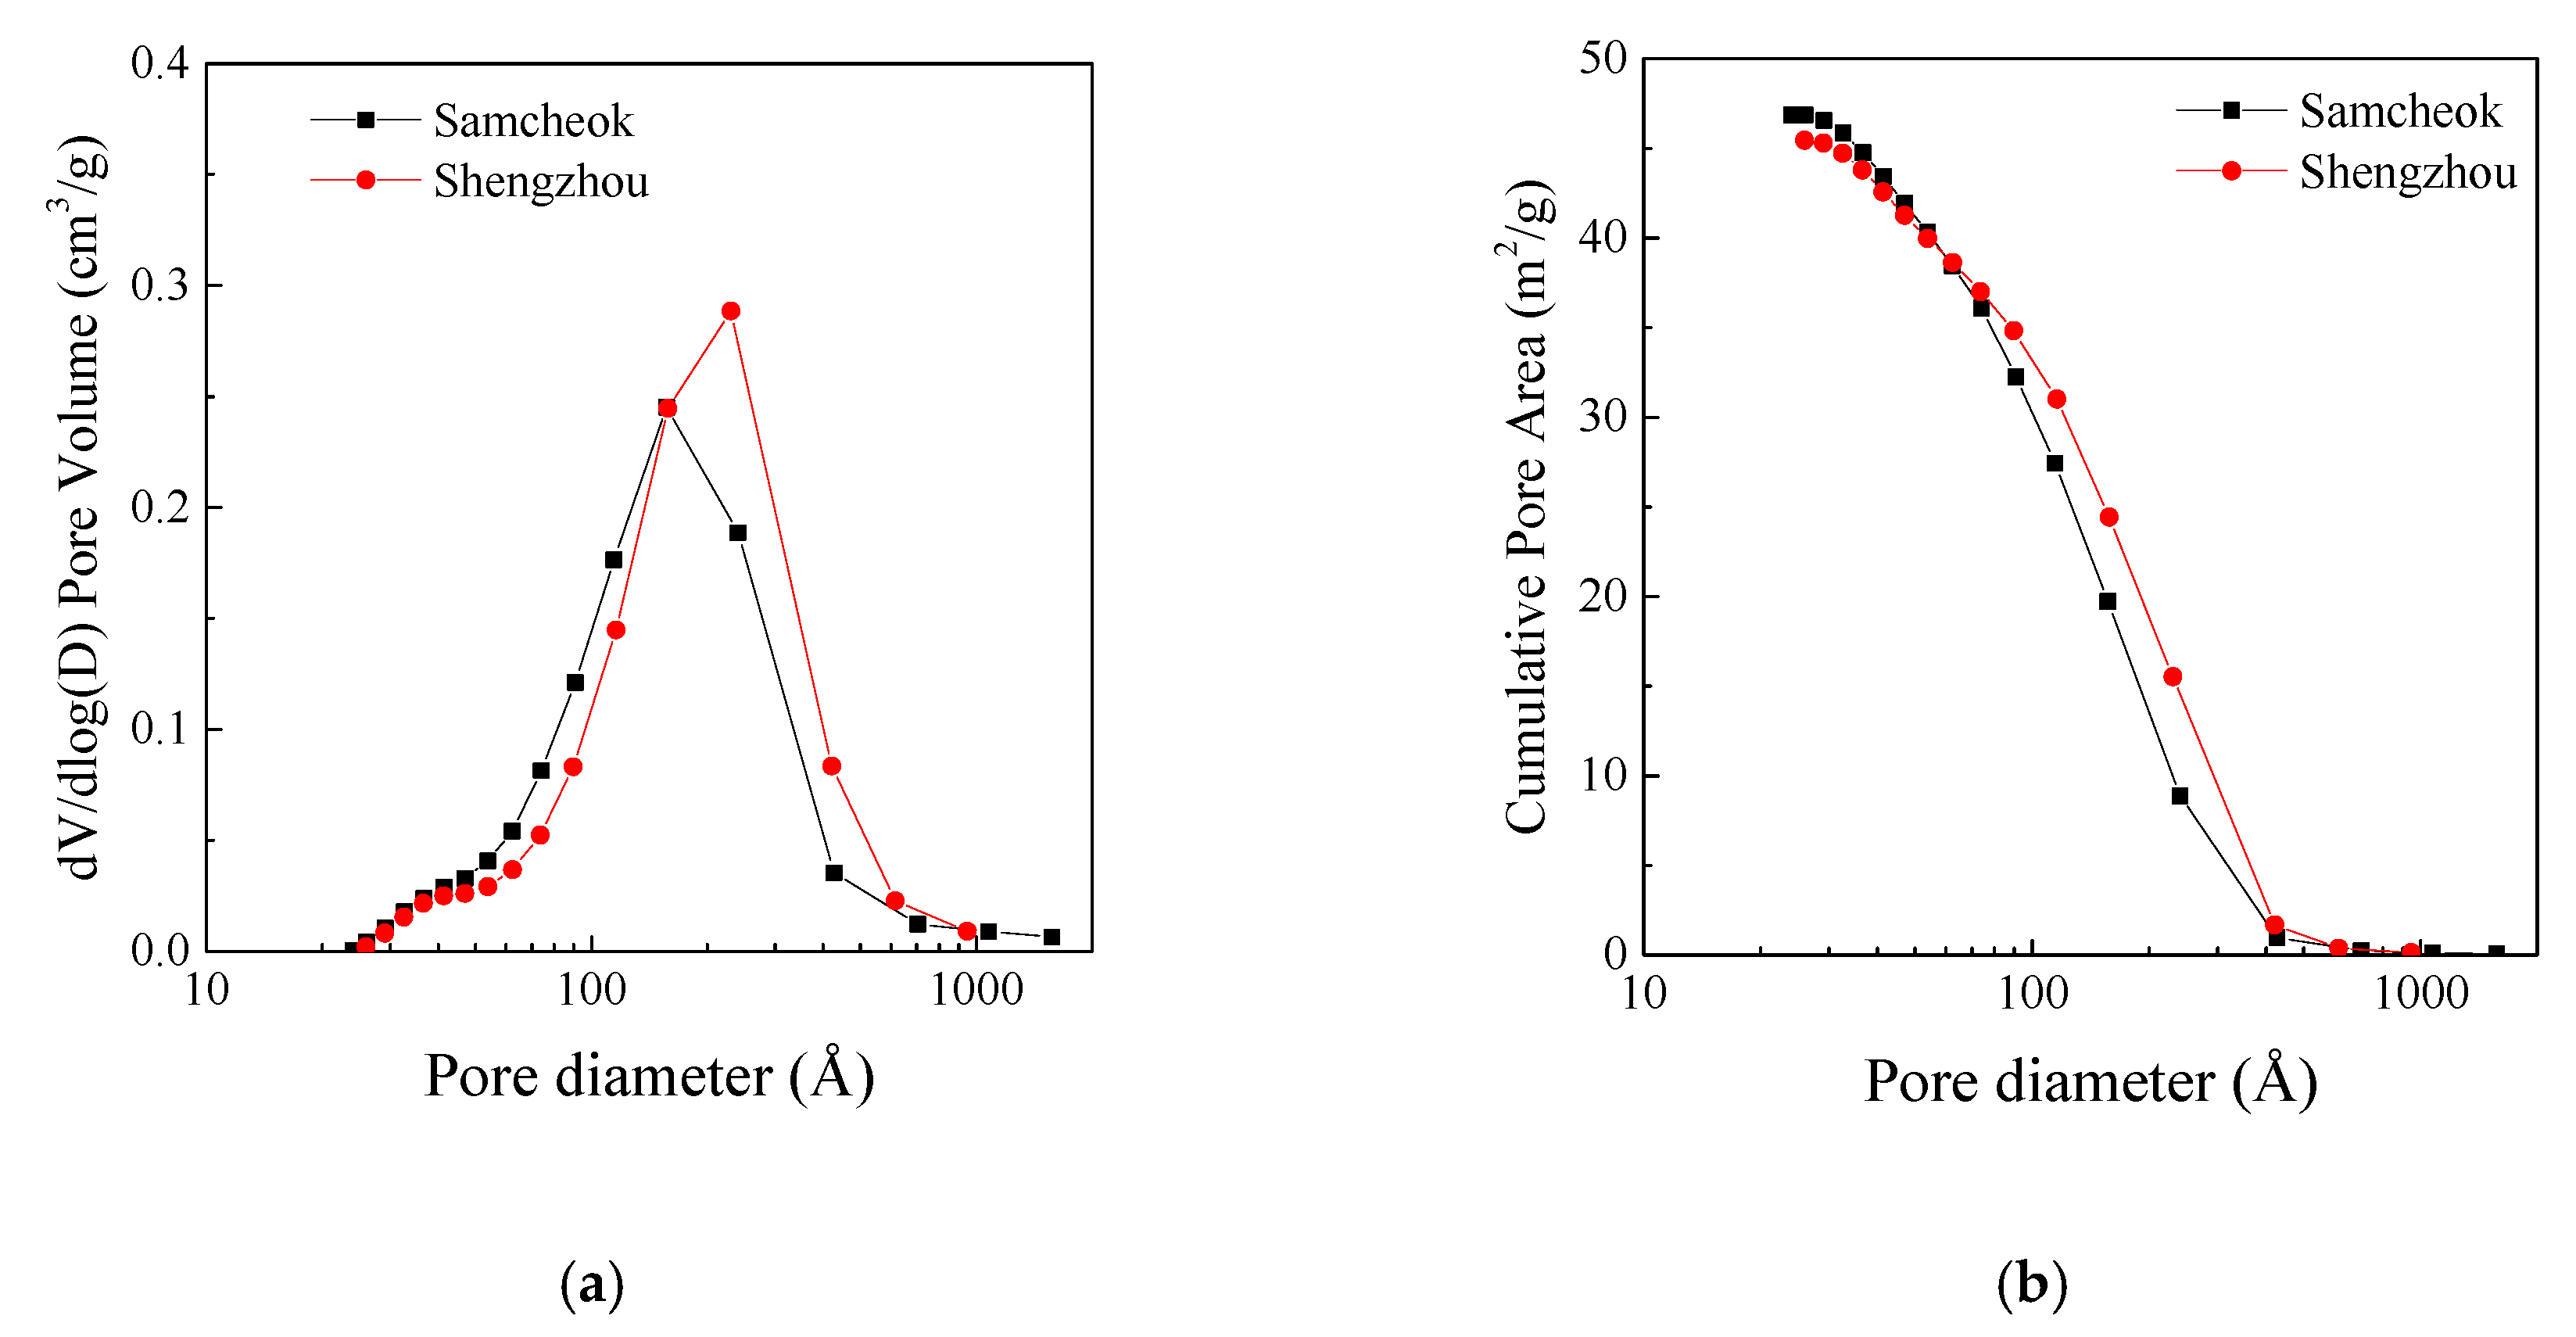
2. Materials and Methods
3. Results and Discussion
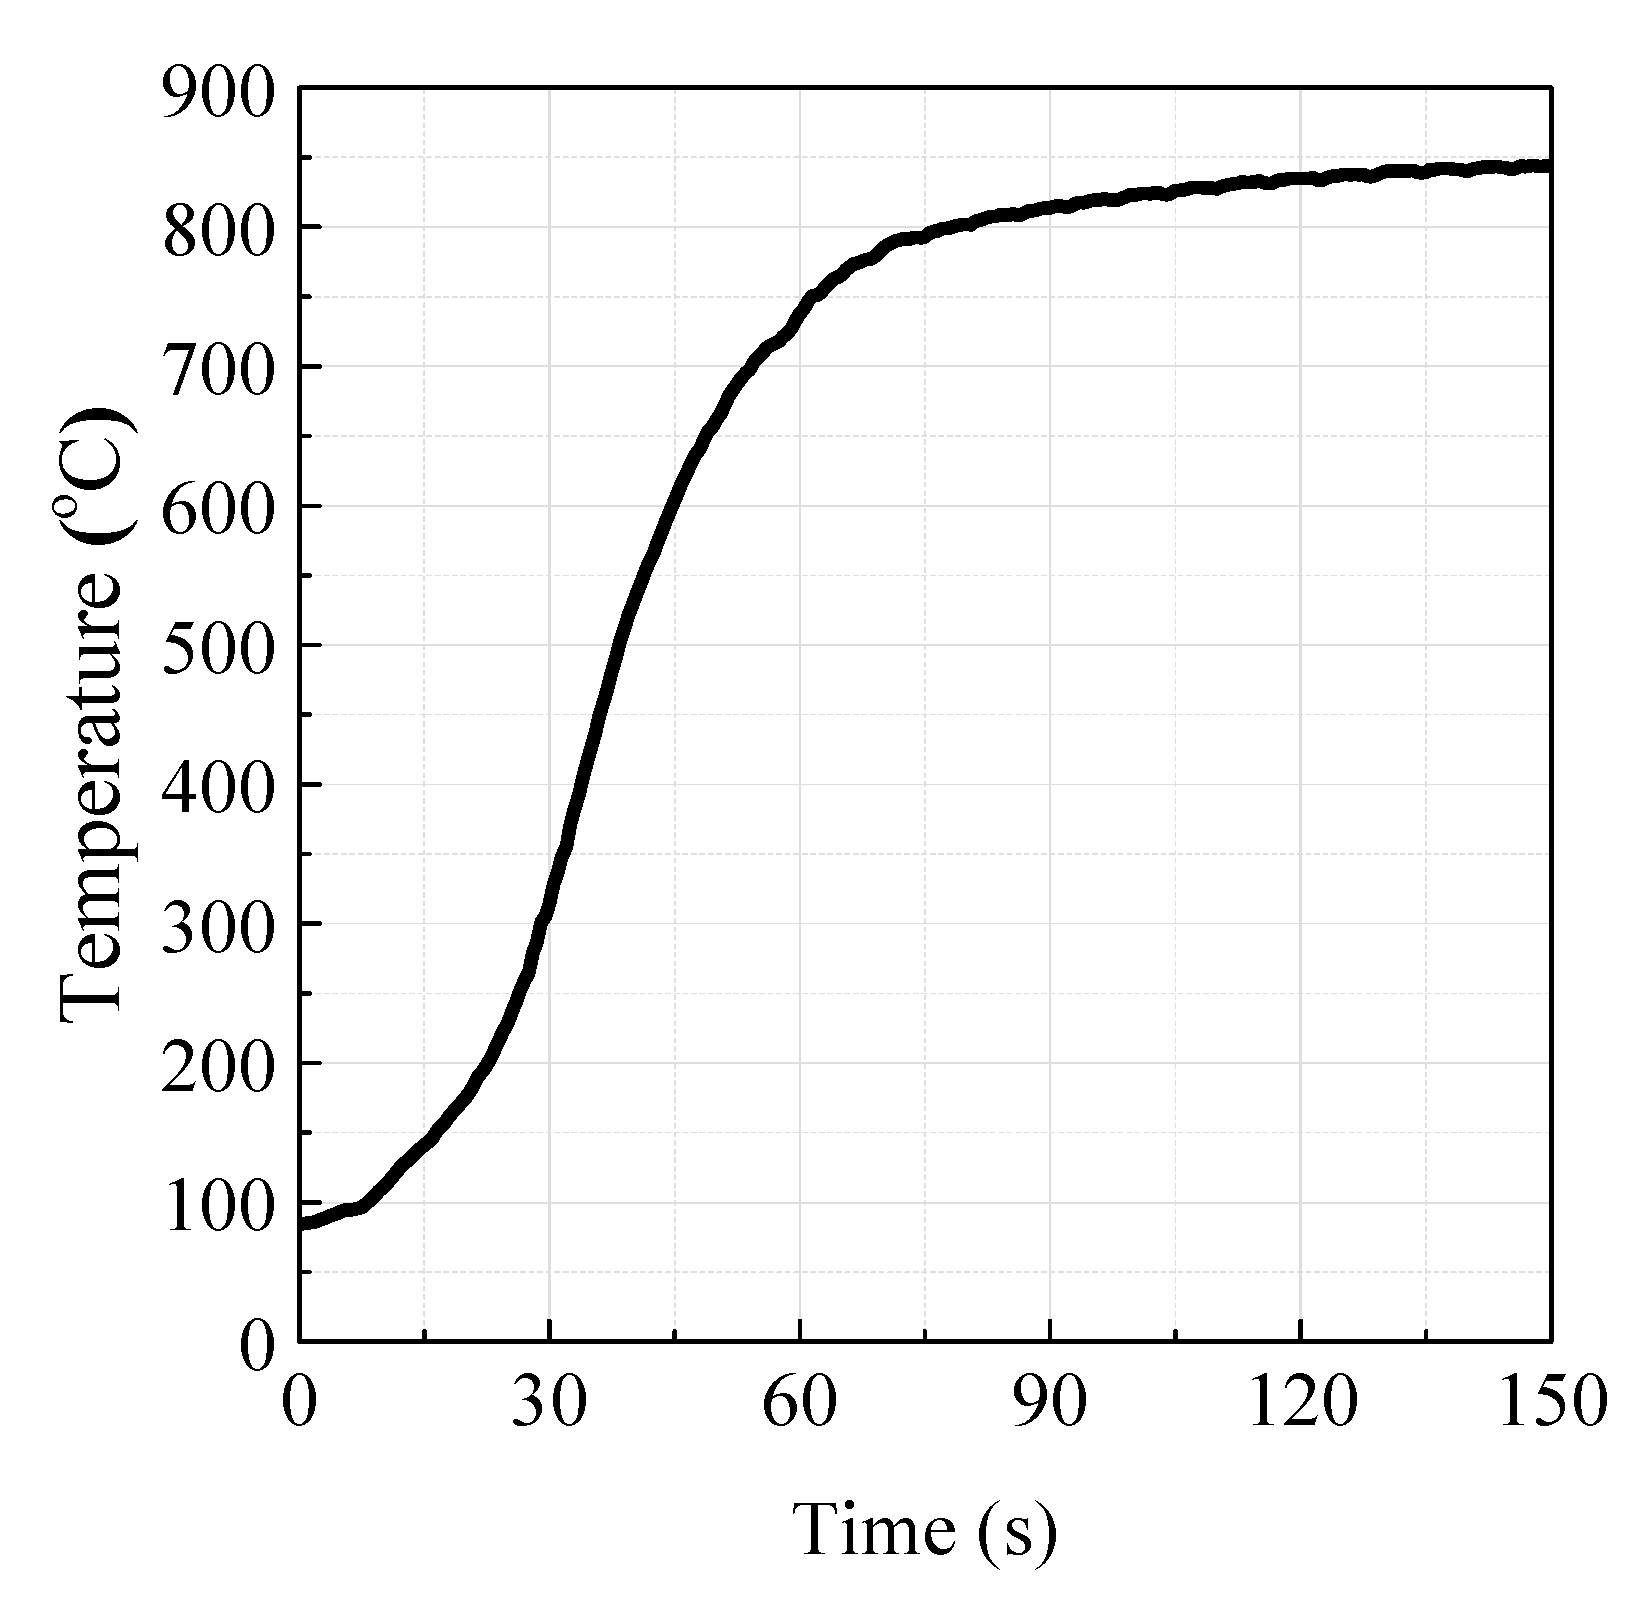
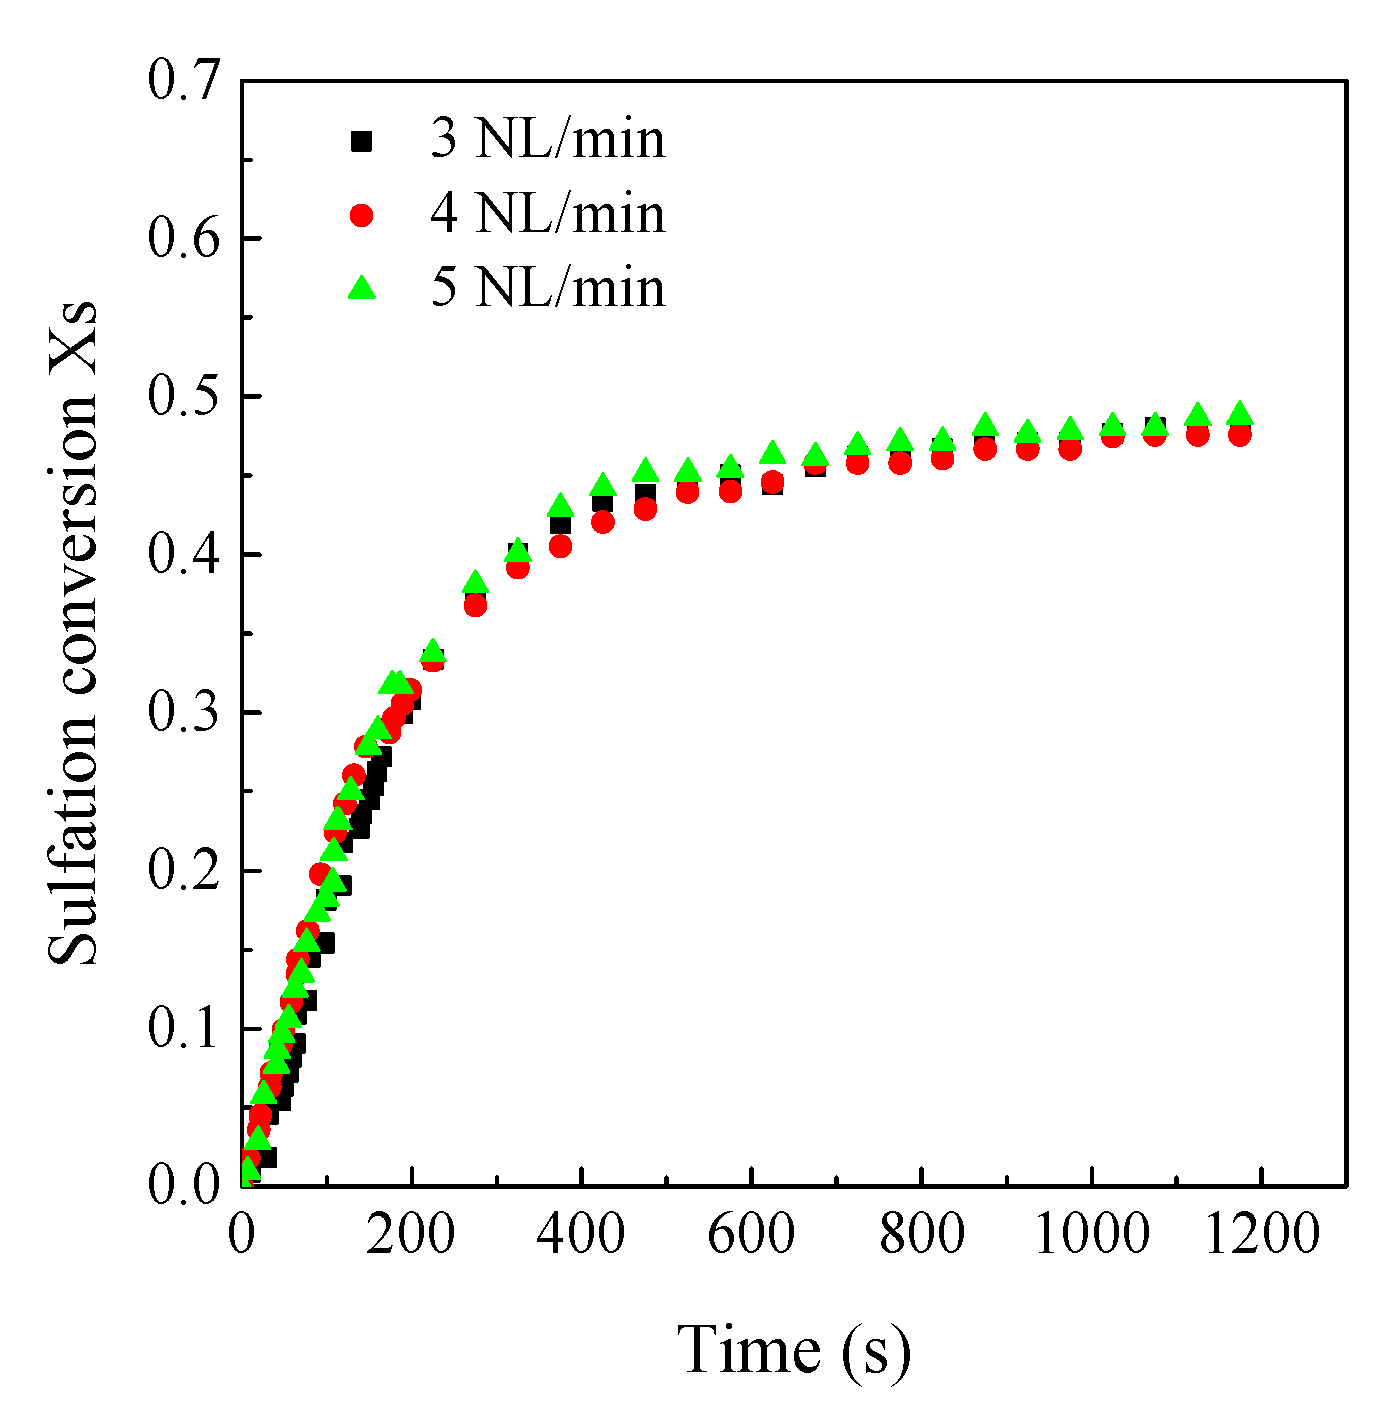
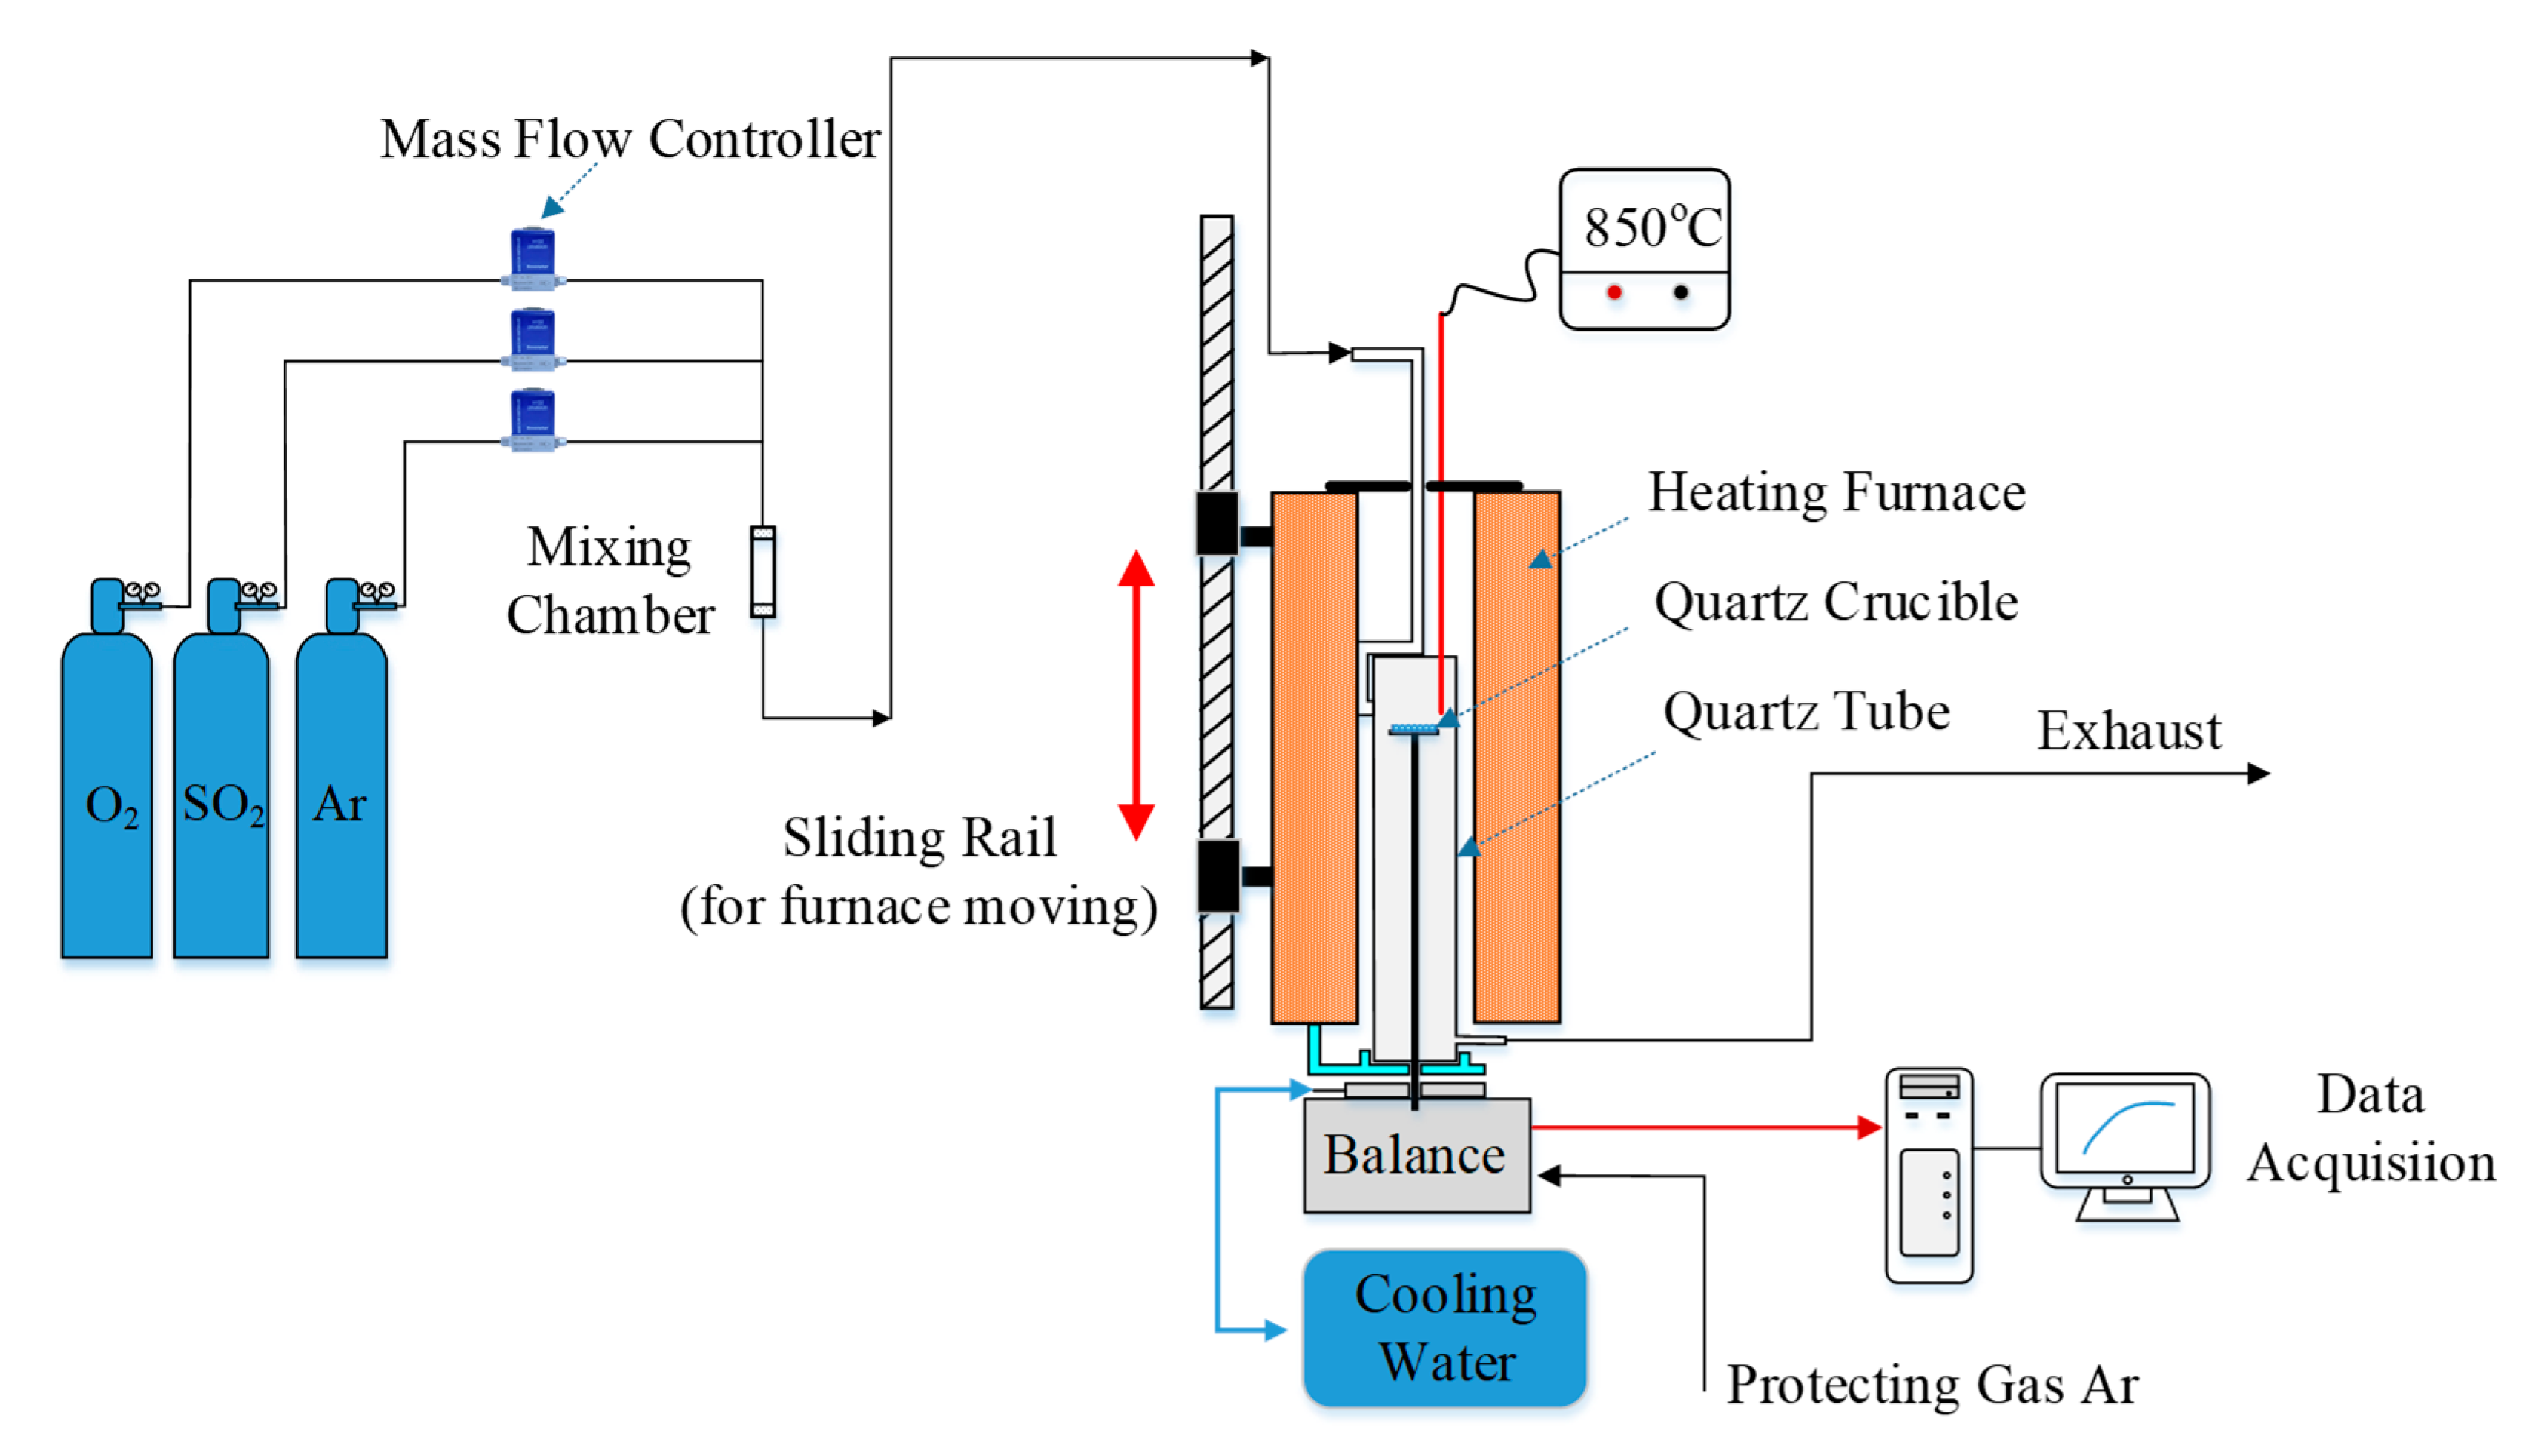
3.1. Test of the LC-TGA
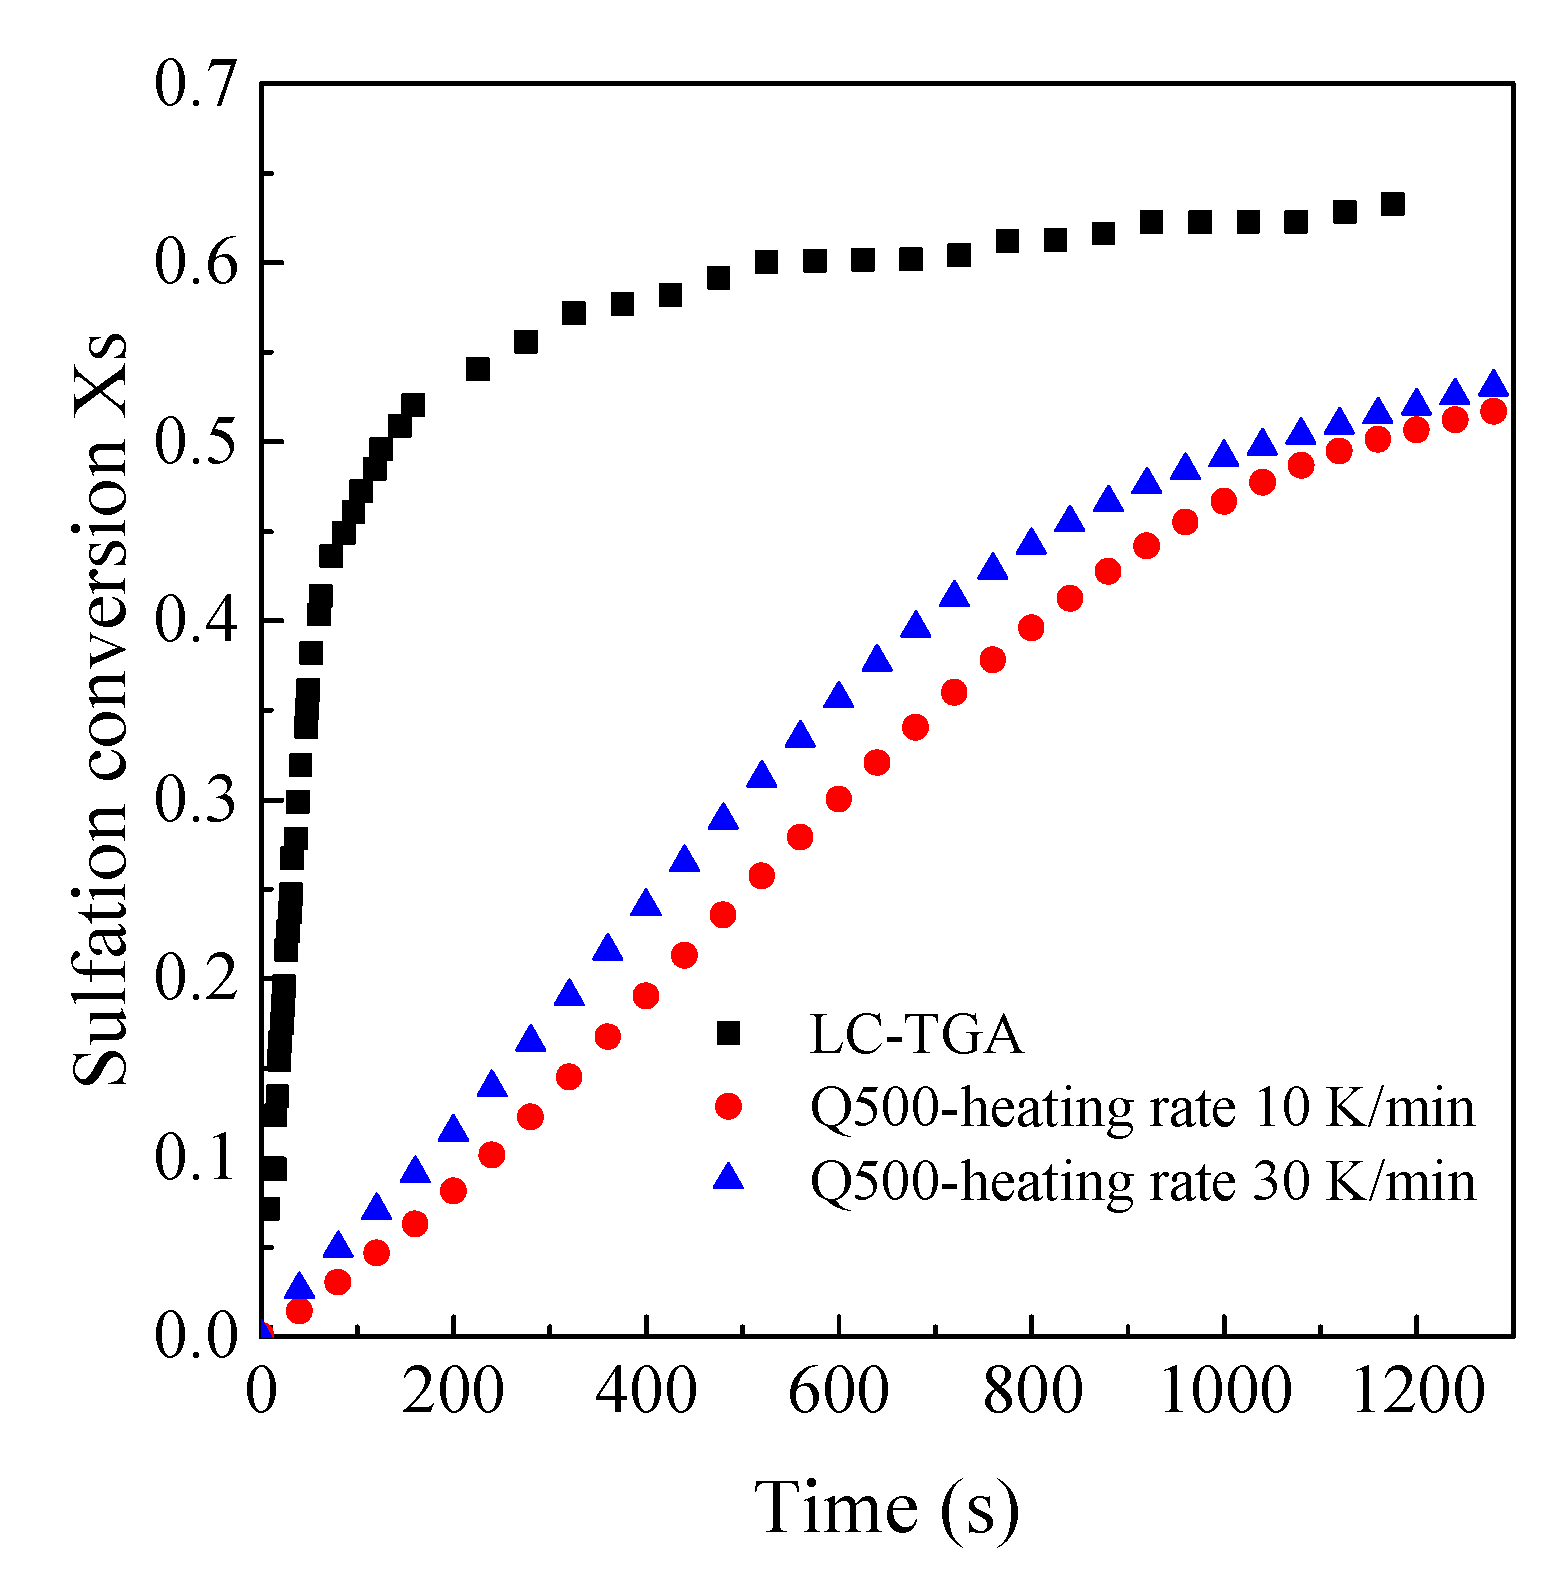
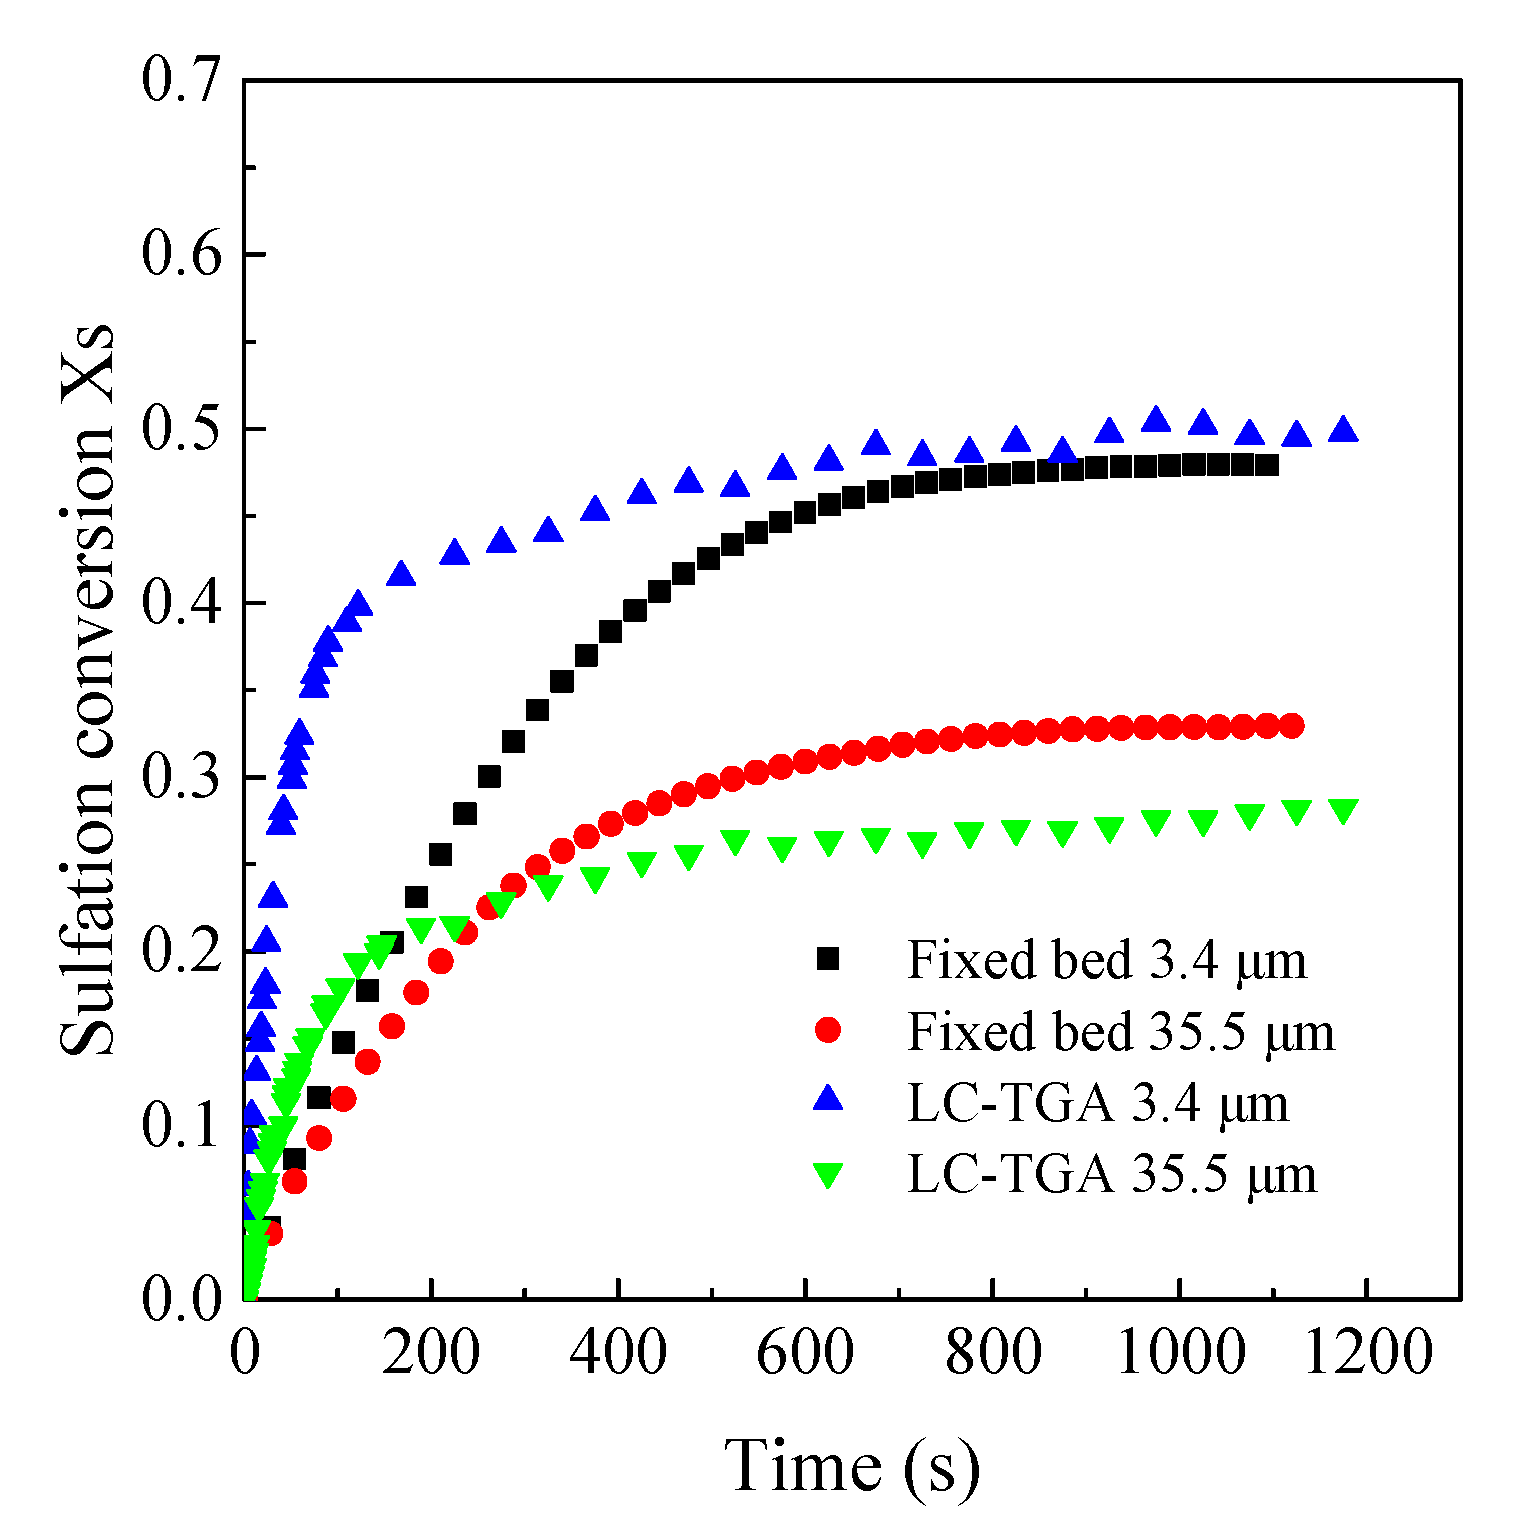
3.2. Comparison of Sulfation Conversion in Different Reactors
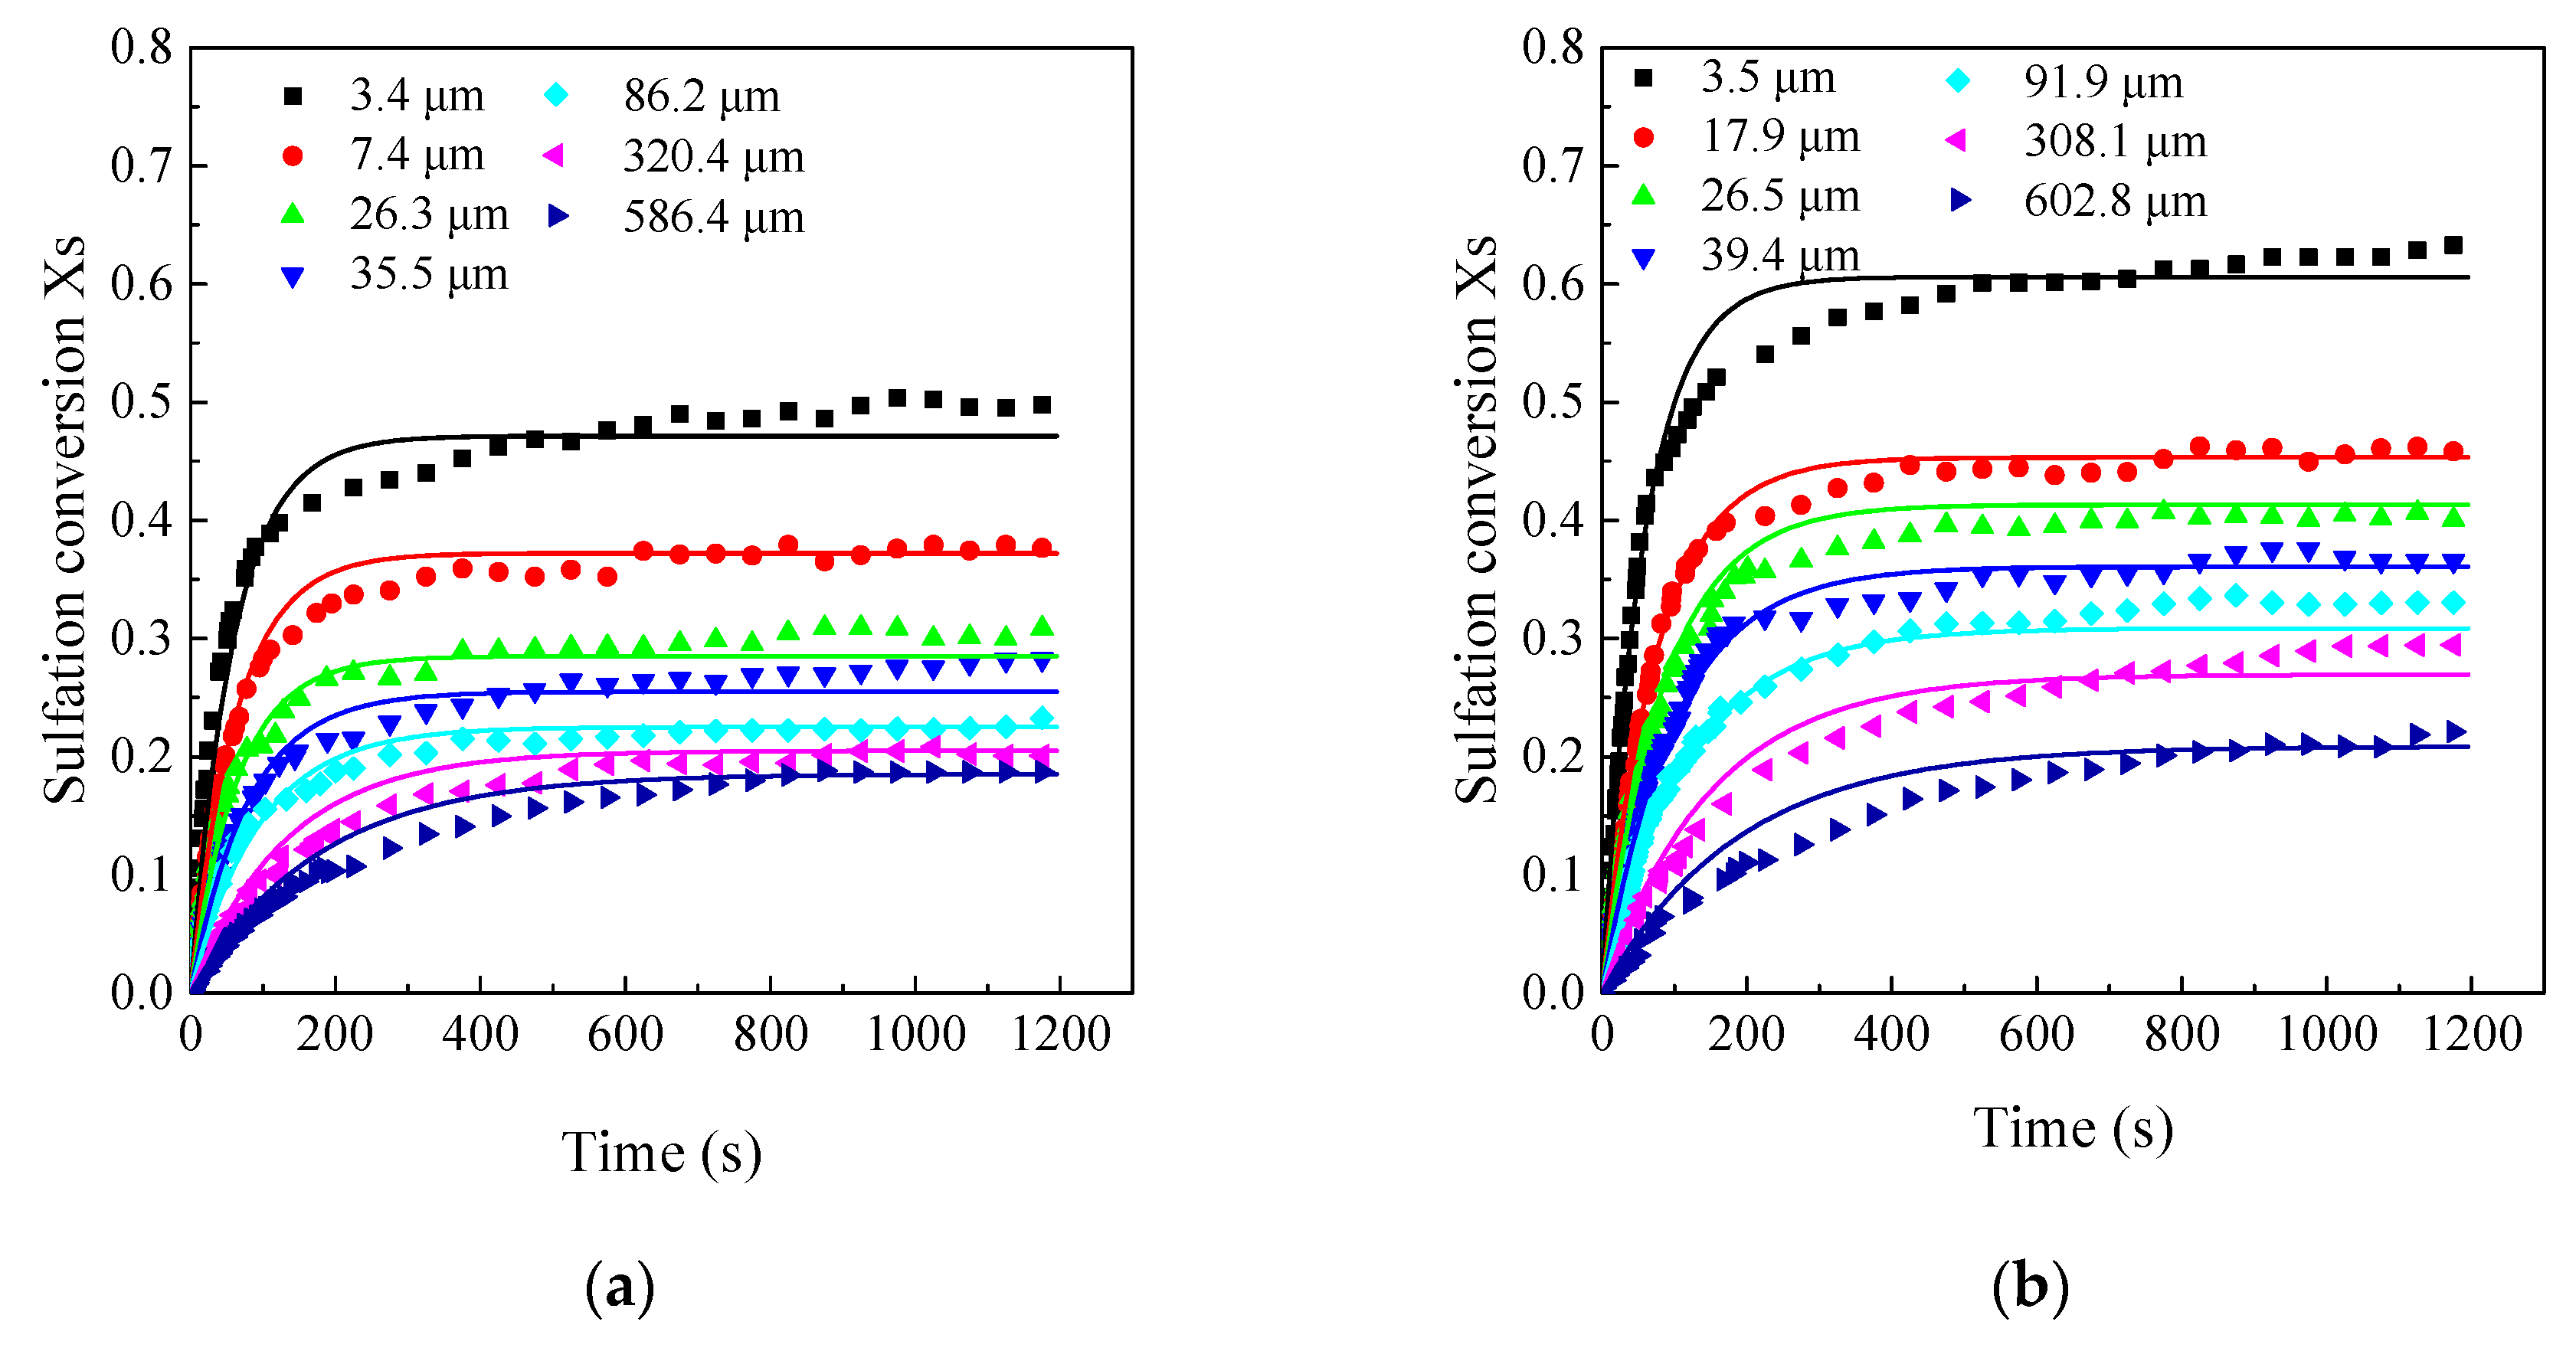
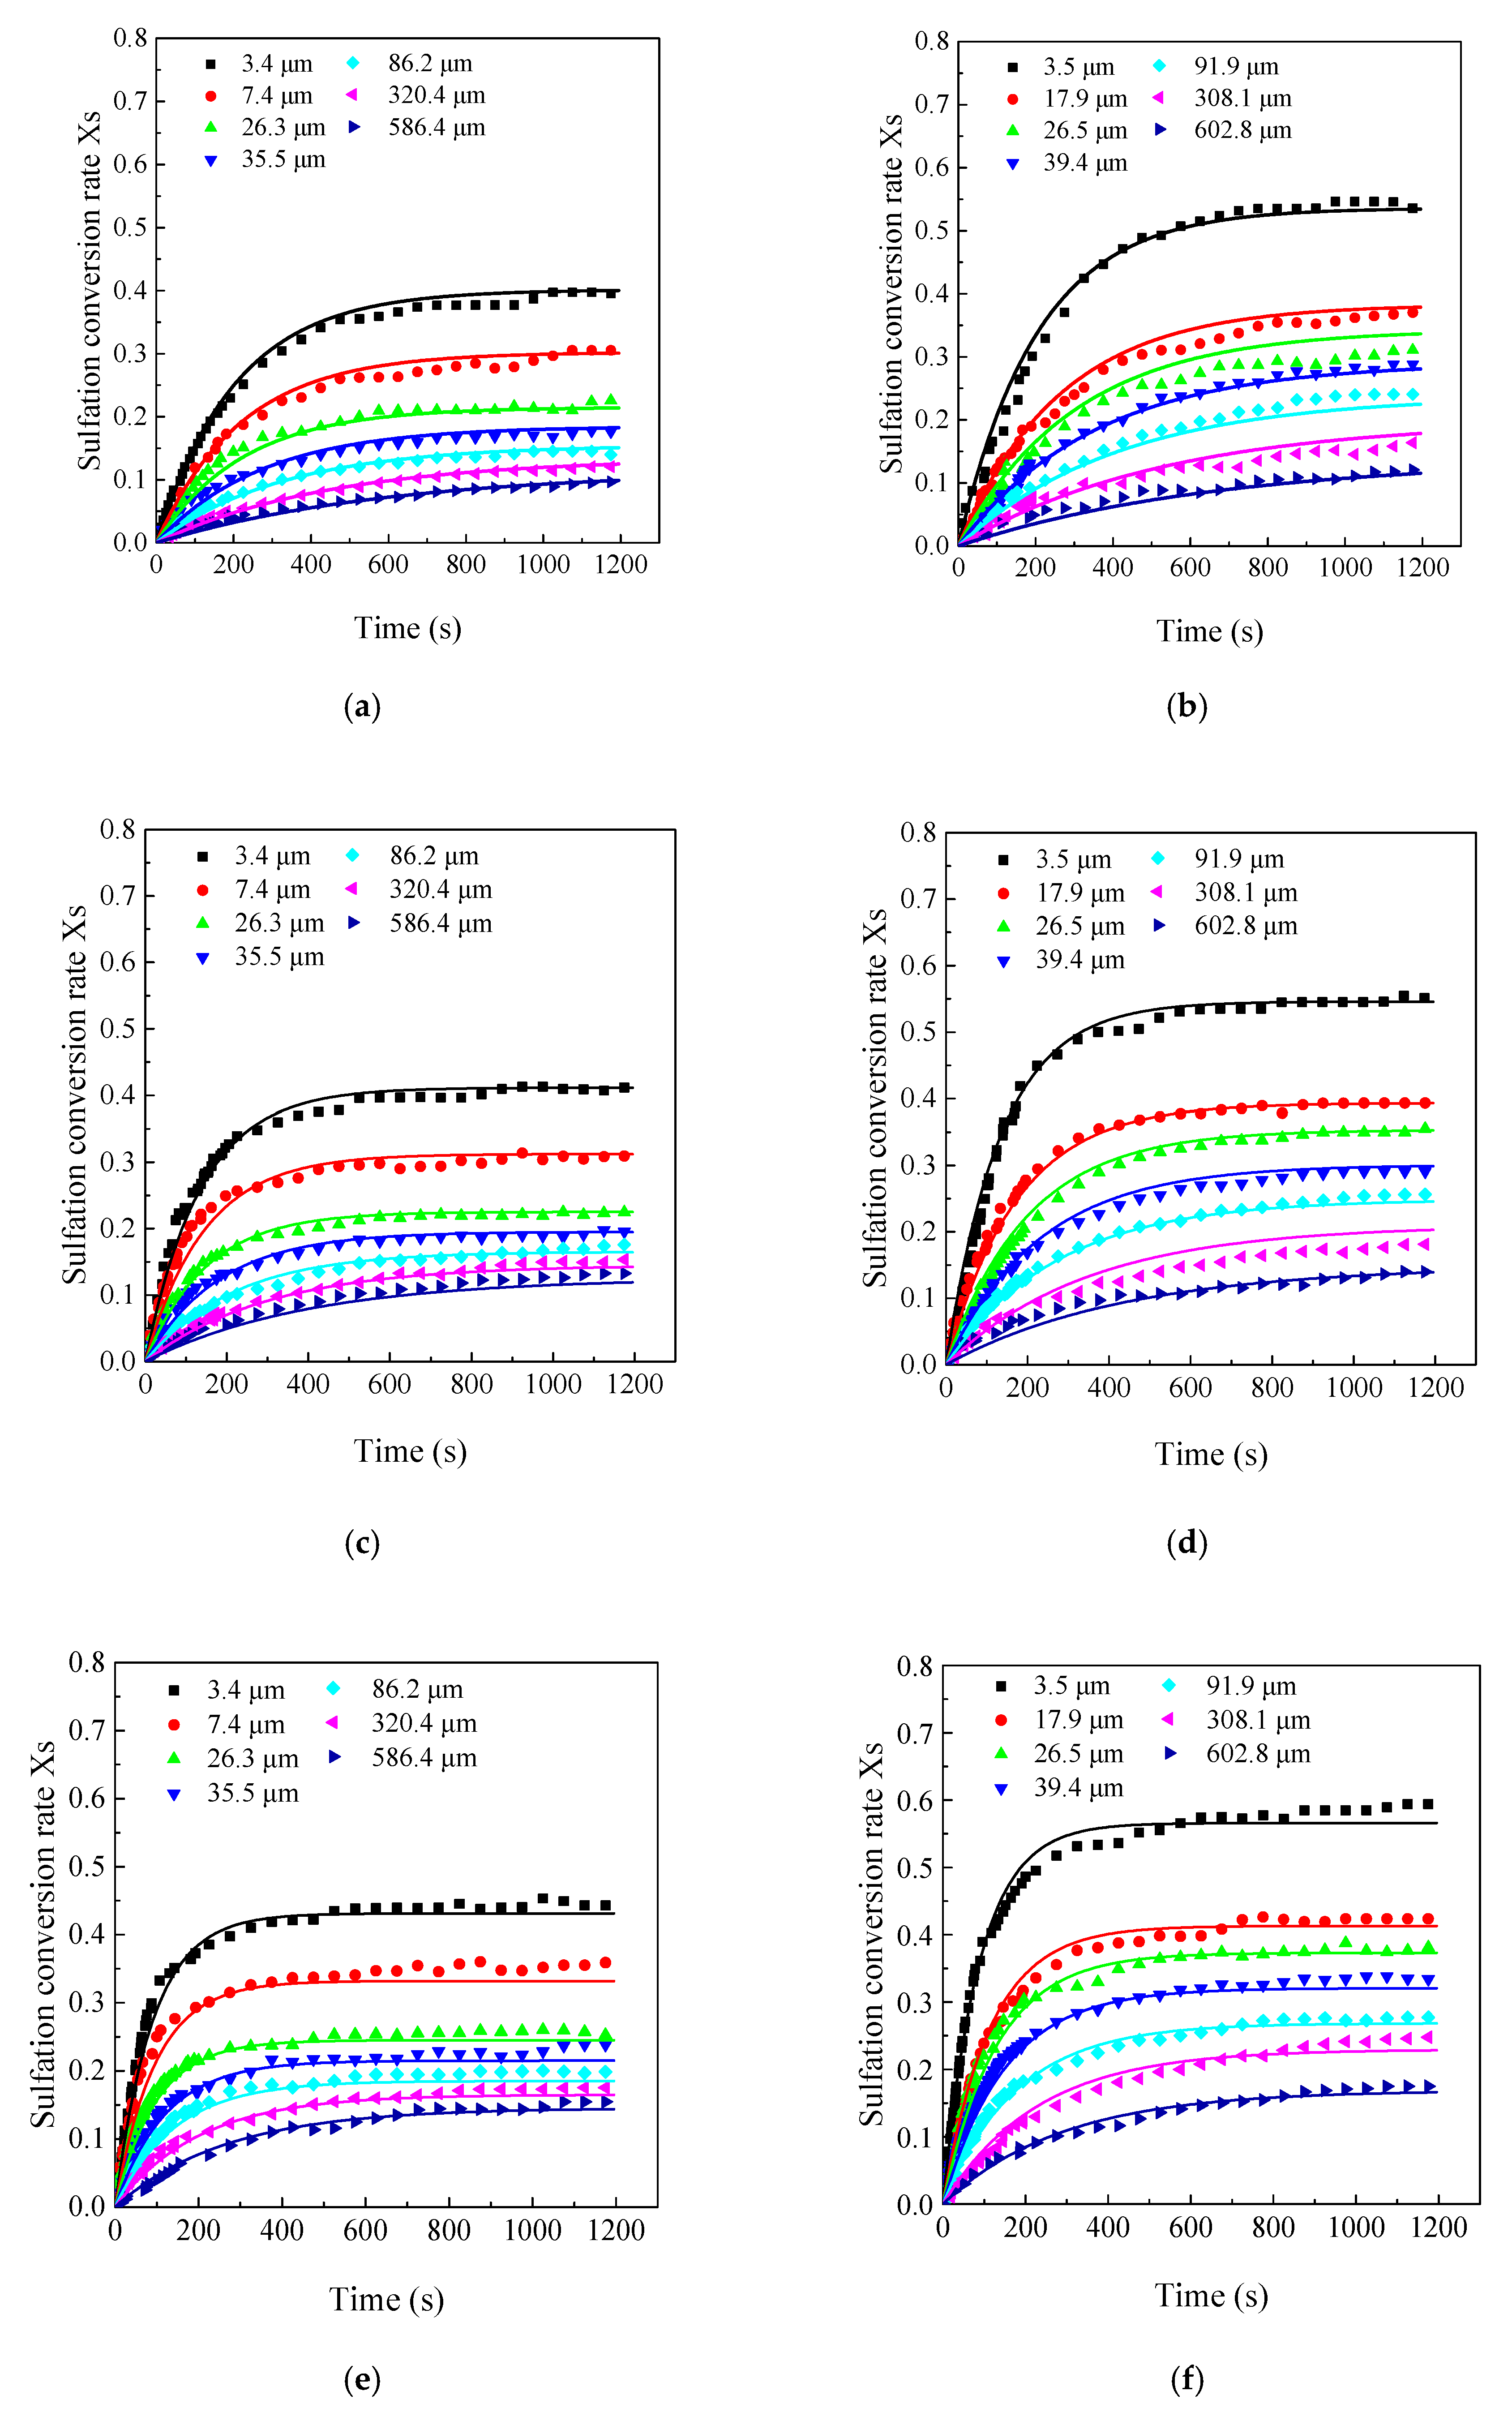
3.3. Effects of Limestone Particle Size on the CaO Sulfation Reactivity
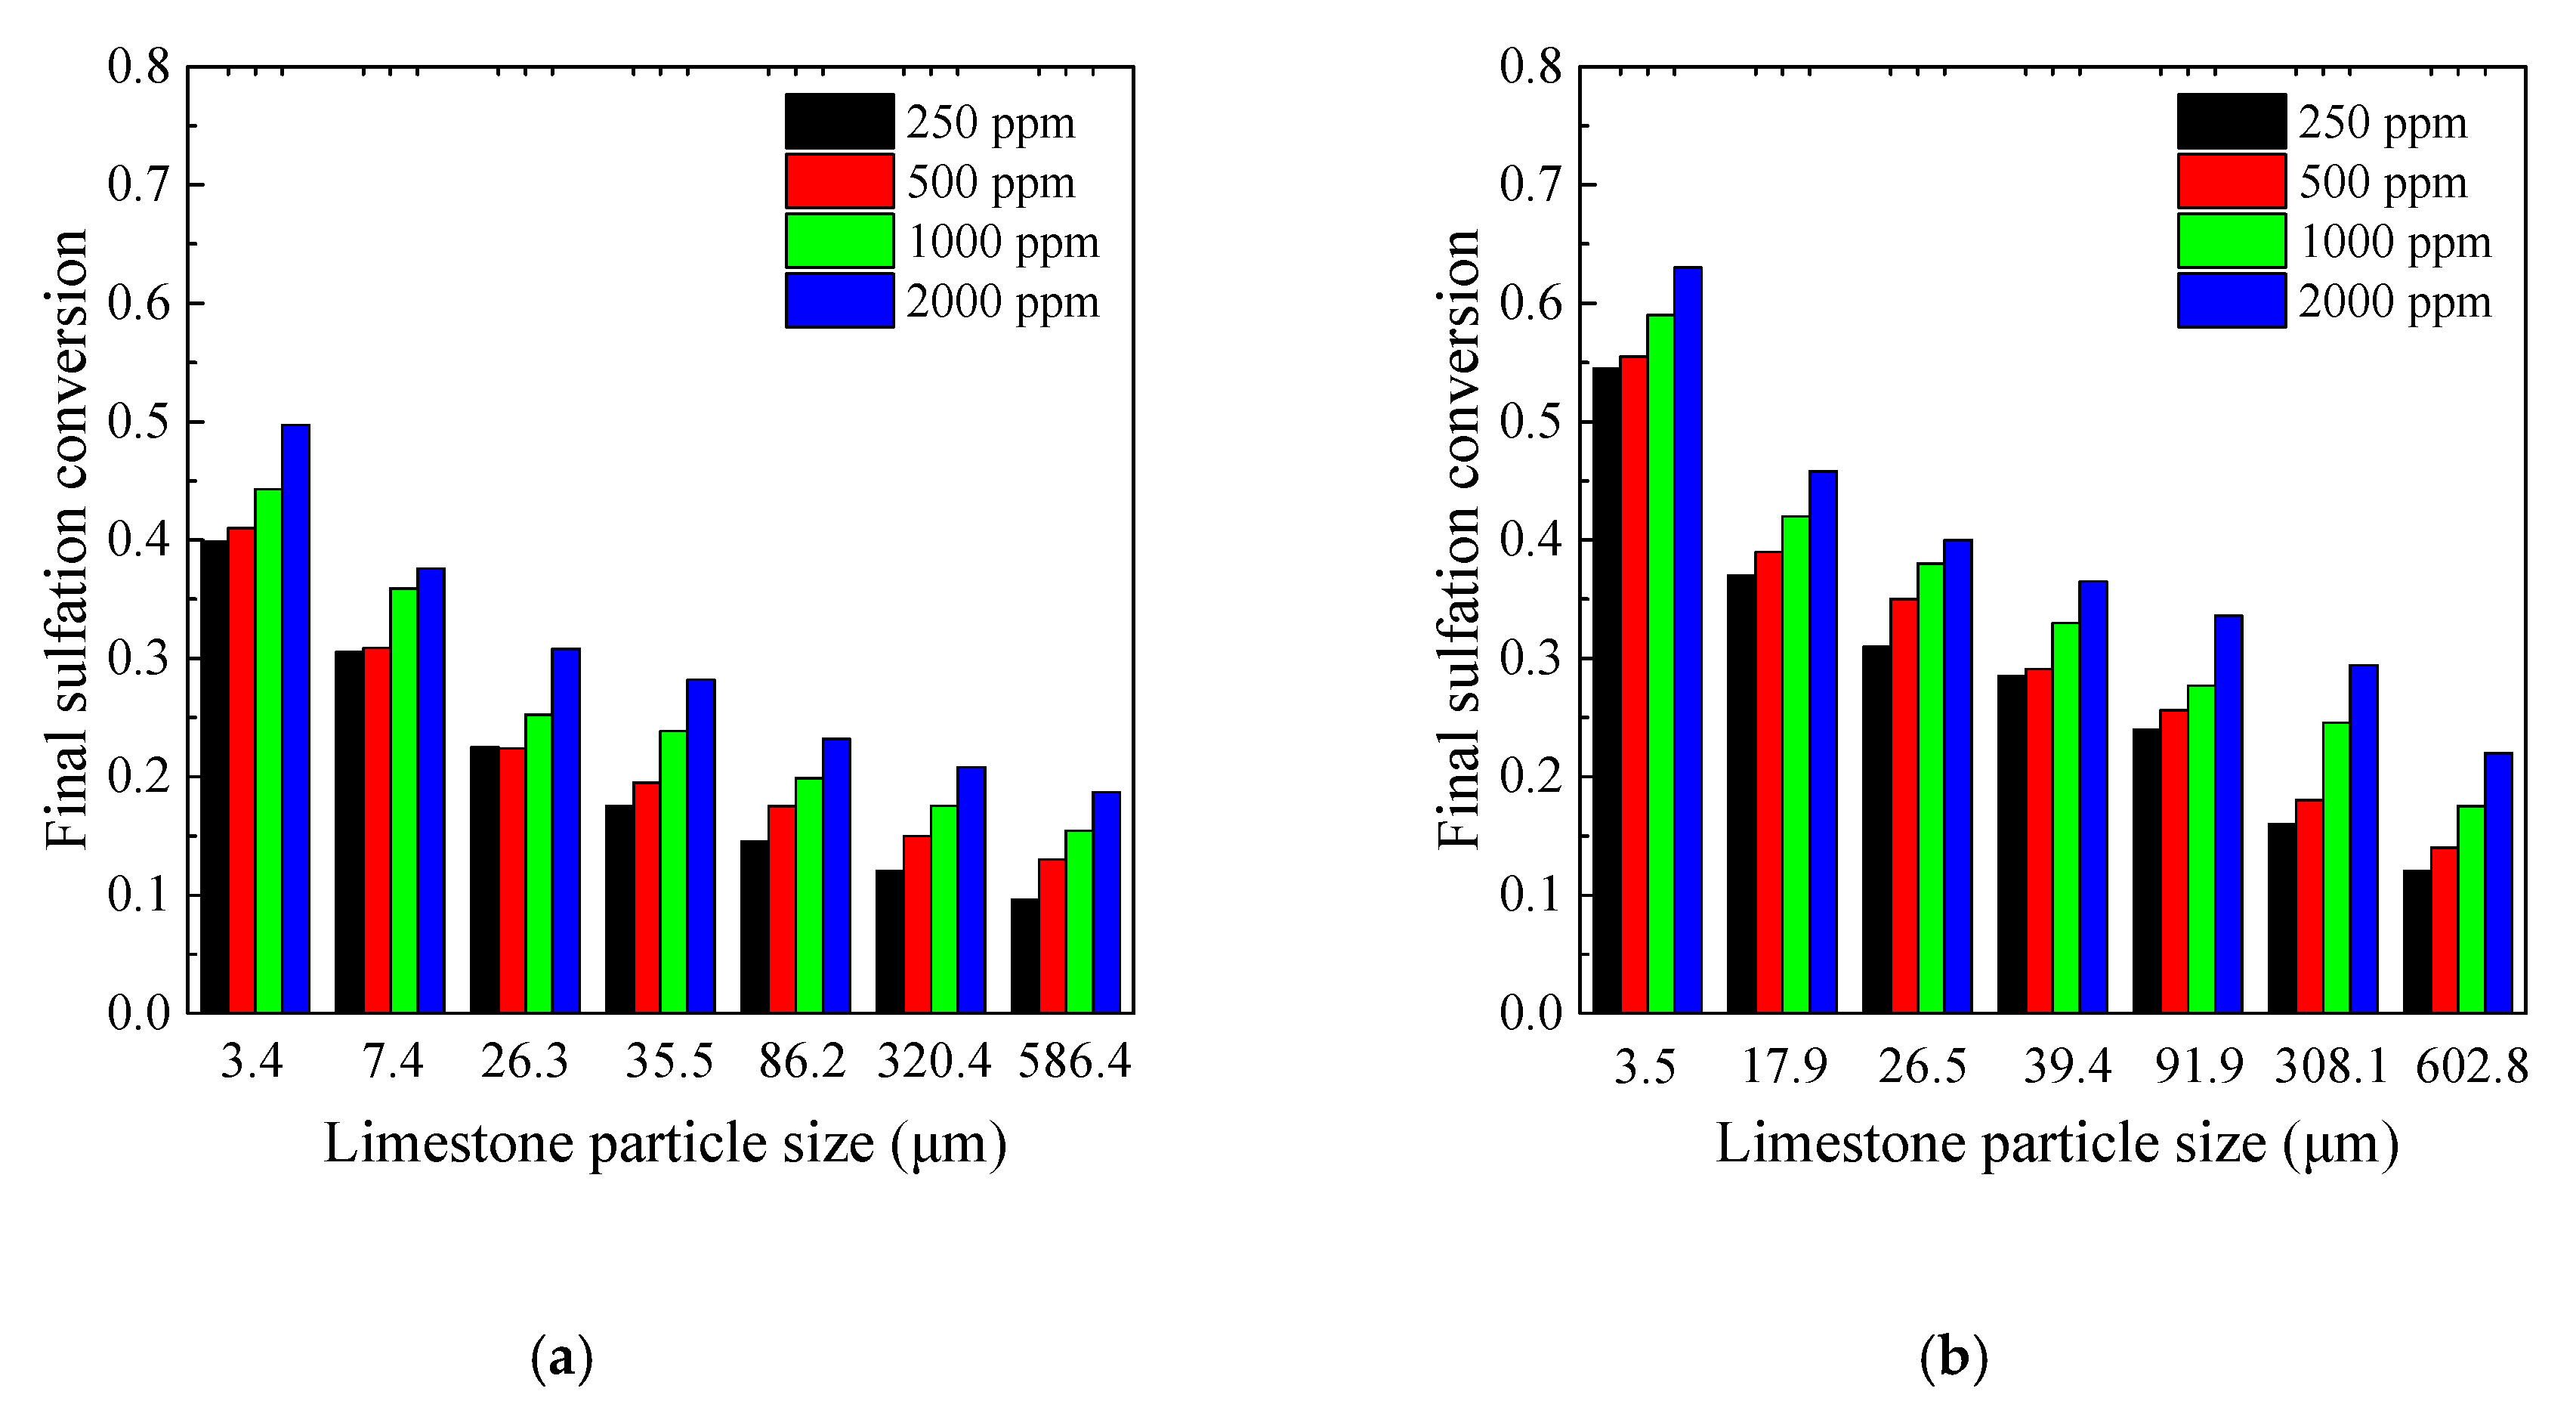
3.4. Effects of SO2 Concentration on the CaO Sulfation Reactivity
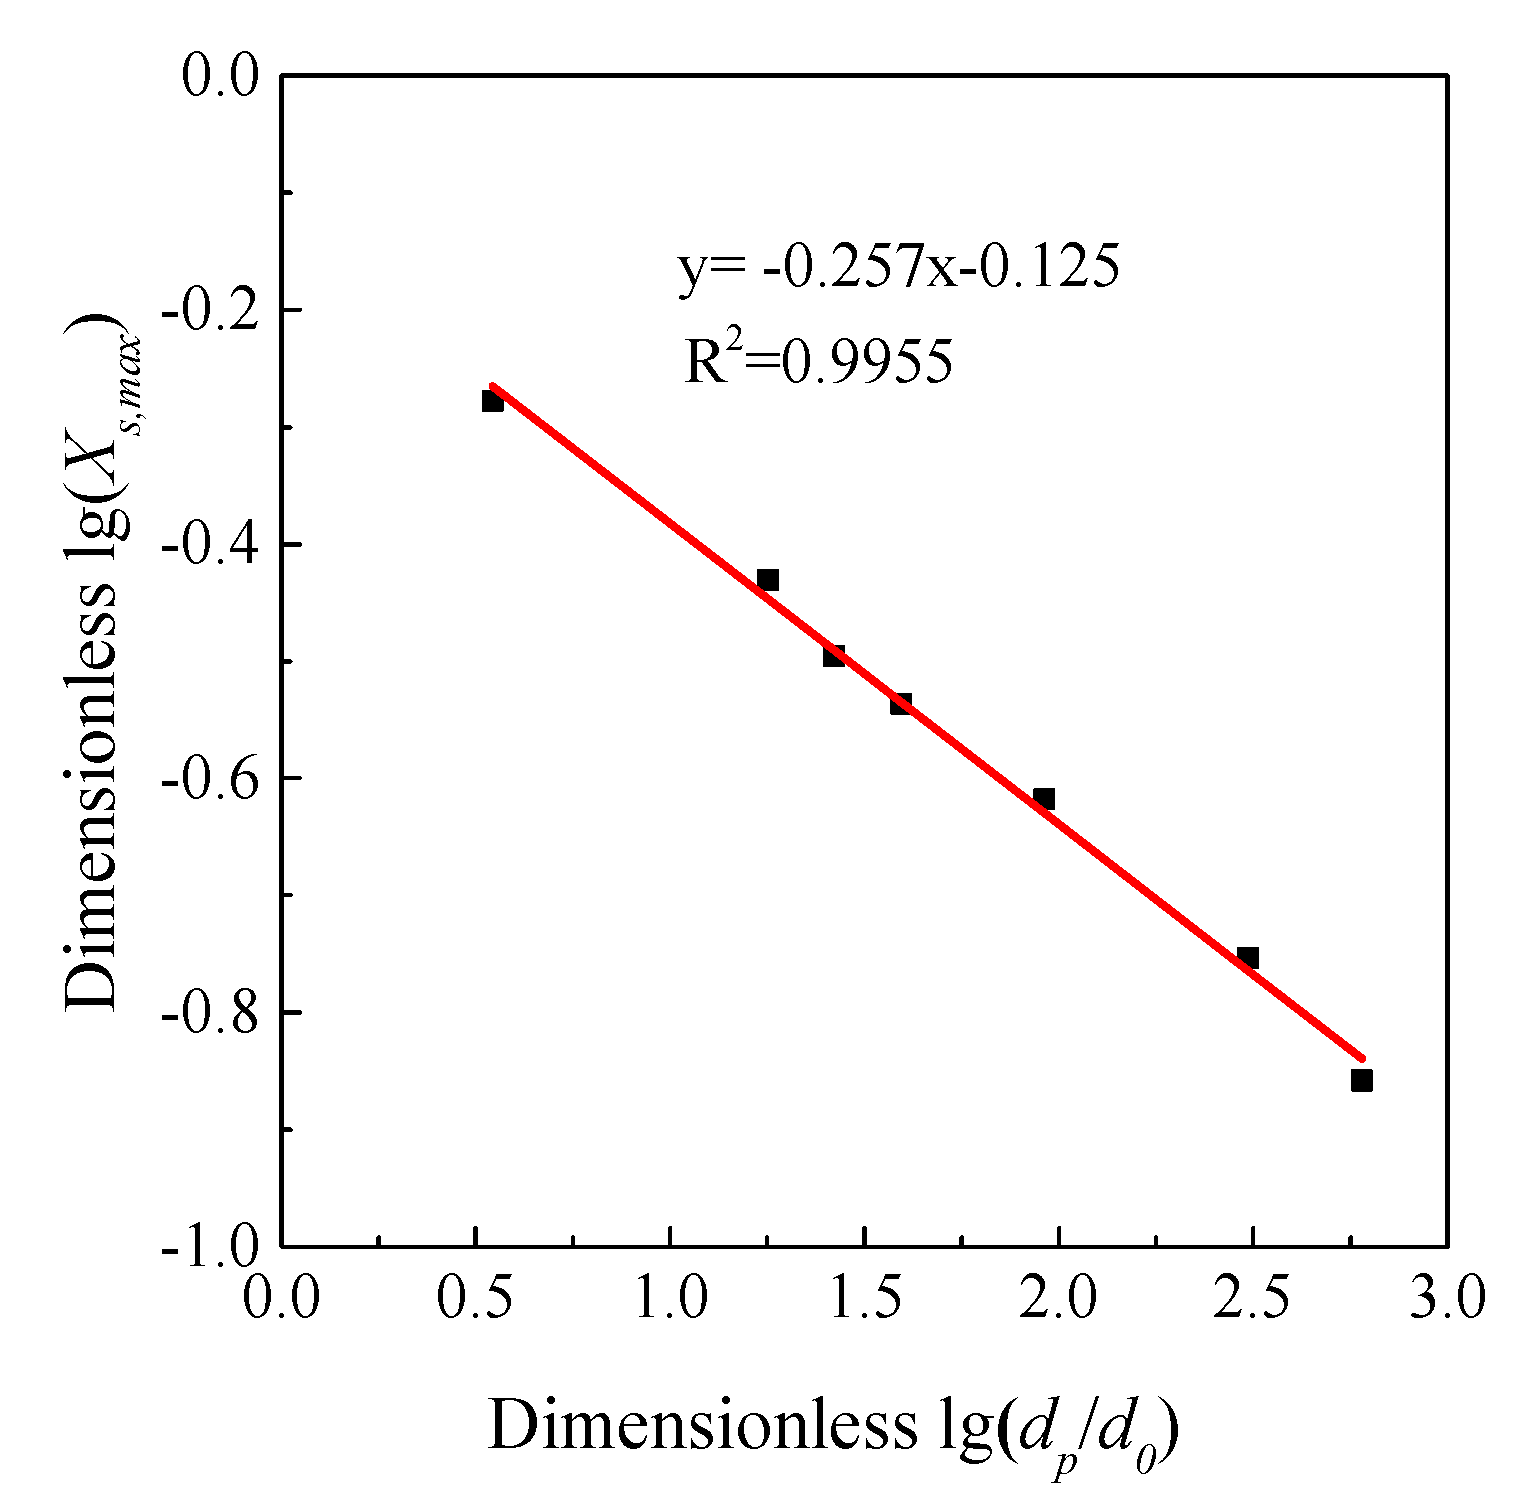
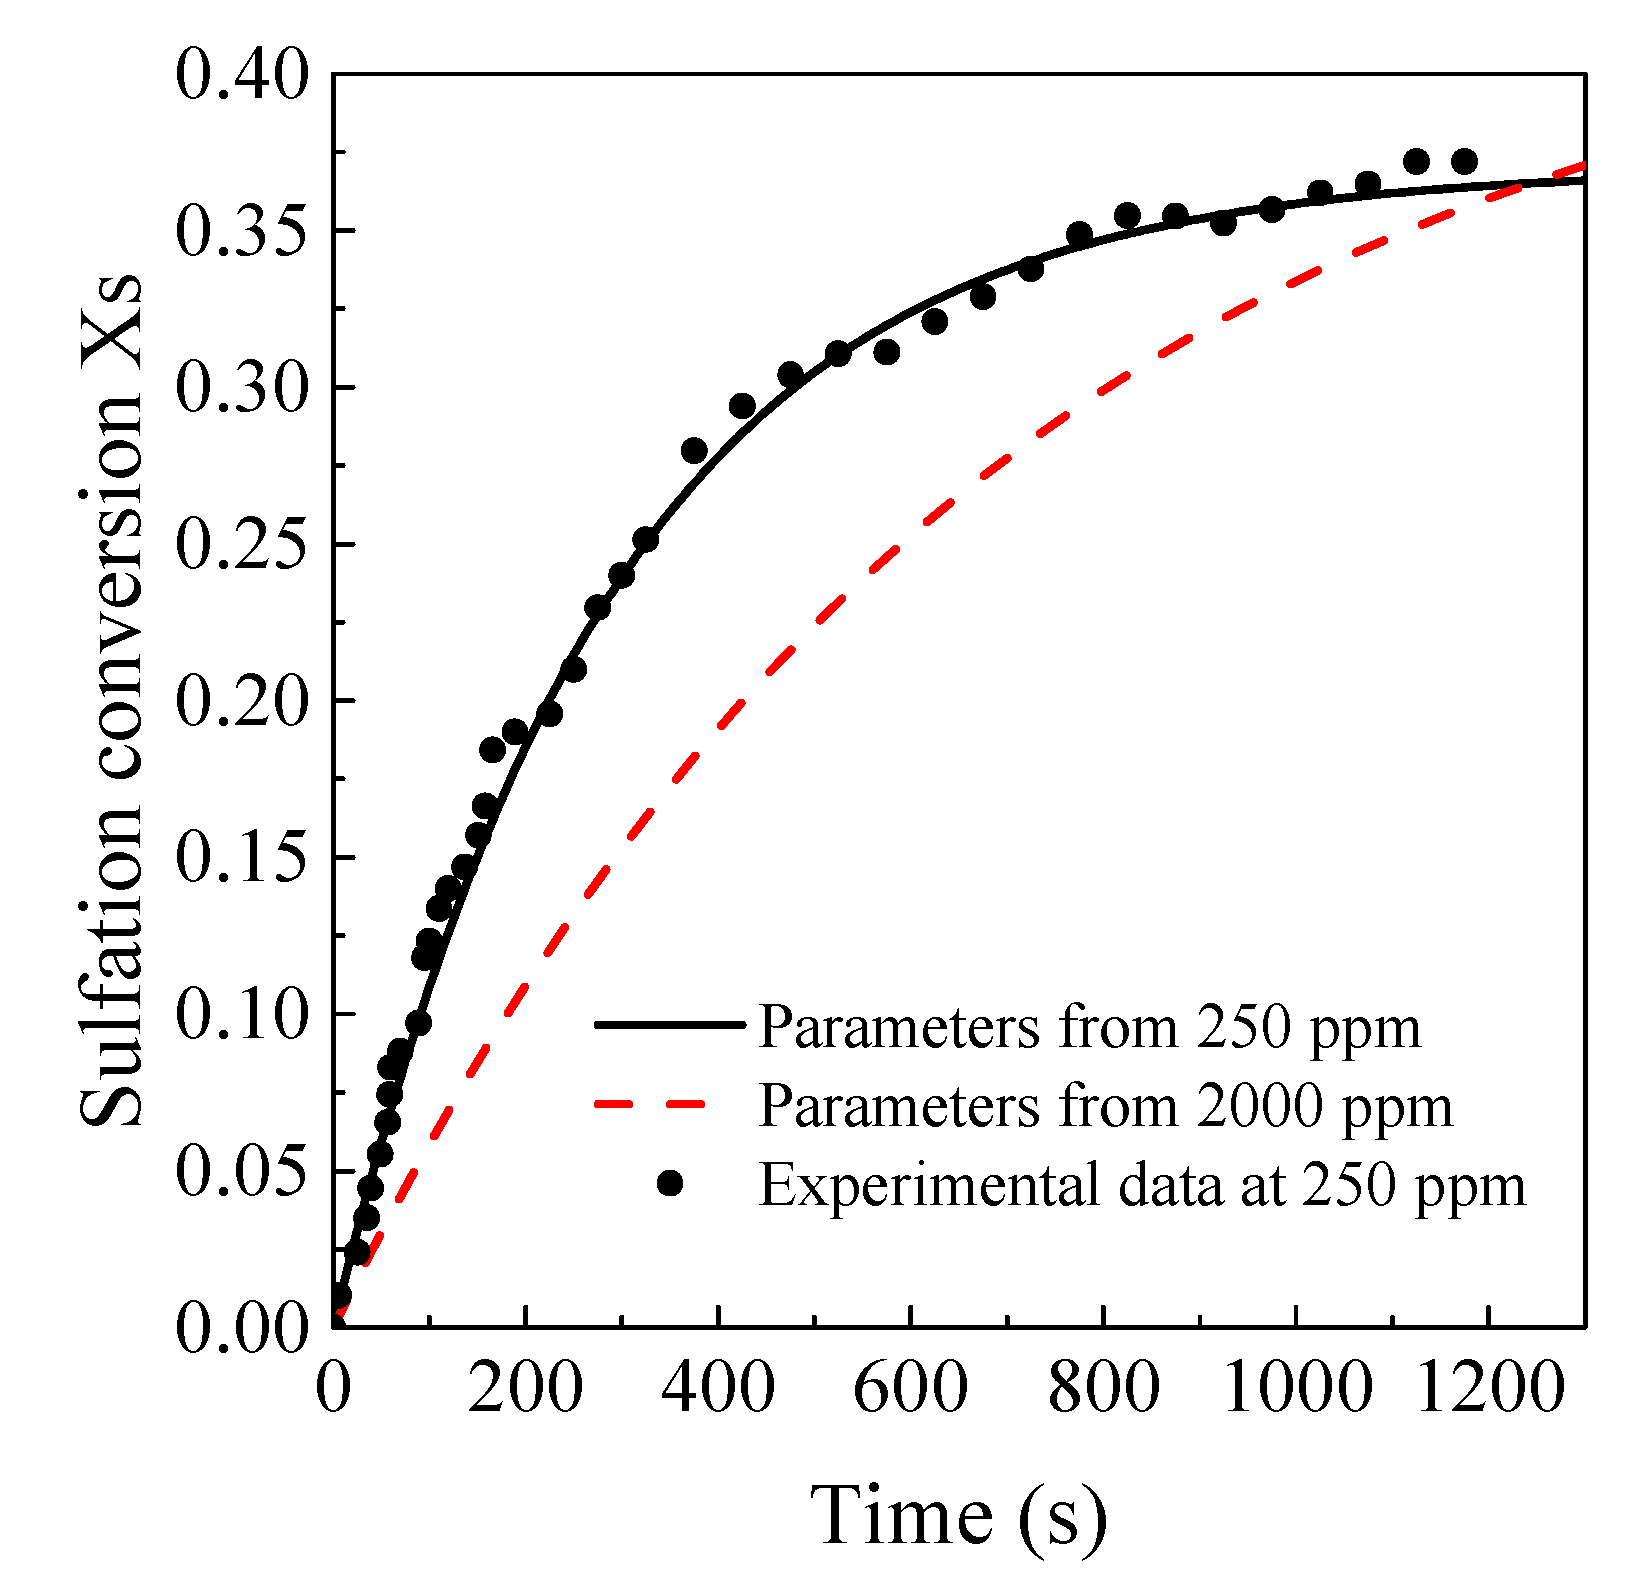
3.5. Model Prediction
4. Conclusions
Author Contributions
Funding
Acknowledgments
Conflicts of Interest
References
- Leckner, B. Fluidized bed combustion: Mixing and pollutant limitation. Prog. Energy Combust. Sci. 1998, 24, 31–61. [Google Scholar] [CrossRef]
- Cai, R.; Zhang, H.; Zhang, M.; Yang, H.; Lyu, J.; Yue, G. Development and application of the design principle of fluidization state specification in CFB coal combustion. Fuel Process. Technol. 2018, 174, 41–52. [Google Scholar]
- Yao, X.; Zhang, H.; Yang, H.; Liu, Q.; Wang, J.; Yue, G. An experimental study on the primary fragmentation and attrition of limestones in a fluidized bed. Fuel Process. Technol. 2010, 91, 1119–1124. [Google Scholar] [CrossRef]
- Ar, I.; Balci, S. Sulfation reaction between SO2 and limestone: Application of deactivation model. Chem. Eng. Process. 2002, 41, 179–188. [Google Scholar] [CrossRef]
- Lyngfelt, A.; Leckner, B. Sulphur capture in circulating fluidized-bed boilers: Can the efficiency be predicted? Chem. Eng. Sci. 1999, 54, 5573–5584. [Google Scholar] [CrossRef]
- Anthony, E.J.; Granatstein, D.L. Sulfation phenomena in fluidized bed combustion systems. Prog. Energy Combust. Sci. 2001, 27, 215–236. [Google Scholar] [CrossRef]
- Tarelho, L.A.C.; Matos, M.A.A.; Pereira, F.J.M.A. The influence of operational parameters on SO2 removal by limestone during fluidised bed coal combustion. Fuel Process. Technol. 2005, 86, 1385–1401. [Google Scholar] [CrossRef]
- Braganca, S.R.; Castellan, J.L. FBC desulfurization process using coal with low sulfur content, high oxidizing conditions and metamorphic limestones. Braz. J. Chem. Eng. 2009, 26, 375–383. [Google Scholar] [CrossRef] [Green Version]
- Lupiáñez, C.; Guedea, I.; Bolea, I.; Díez, L.I.; Romeo, L.M. Experimental study of SO2 and NOx emissions in fluidized bed oxy-fuel combustion. Fuel Process. Technol. 2013, 106, 587–594. [Google Scholar] [CrossRef]
- De Diego, L.F.; Rufas, A.; García-Labiano, F.; Abad, A.; Gayán, P.; Adánez, J. Optimum temperature for sulphur retention in fluidised beds working under oxy-fuel combustion conditions. Fuel 2013, 114, 106–113. [Google Scholar] [CrossRef]
- Wang, C.; Chen, L. The effect of steam on simultaneous calcination and sulfation of limestone in CFBB. Fuel 2016, 175, 164–171. [Google Scholar] [CrossRef]
- Hartman, M.; Coughlin, R.W. Reaction of sulfur dioxide with limestone and the influence of pore structure. Ind. Eng. Chem. Process Des. Dev. 1974, 13, 248–253. [Google Scholar] [CrossRef]
- Borgwardt, R.H.; Harvey, R.D. Properties of carbonate rocks related to sulfur dioxide reactivity. Environ. Sci. Technol. 1972, 6, 350–360. [Google Scholar] [CrossRef]
- Hartman, M.; Coughlin, R.W. Reaction of sulfur dioxide with limestone and the grain model. AIChE J. 1976, 22, 490–498. [Google Scholar] [CrossRef]
- Fan, L.S.; Jiang, P.; Agnihotri, R.; Mahuli, S.K.; Zhang, J.; Chauk, S.; Ghosh-Dastidar, A. Dispersion and ultra-fast reaction of calcium-based sorbent powders for SO2 and air toxics removal in coal combustion. Chem. Eng. Sci. 1999, 54, 5585–5597. [Google Scholar] [CrossRef]
- Pisupati, S.V.; Wasco, R.S.; Morrison, J.L.; Scaroni, A.W. Sorbent behaviour in circulating fluidized bed combustors: Relevance of thermally induced fractures to particle size dependence. Fuel 1996, 75, 759–768. [Google Scholar] [CrossRef]
- Saastamoinen, J.J. Particle-size optimization for SO2 capture by limestone in a circulating fluidized bed. Ind. Eng. Chem. Res. 2007, 46, 7308–7316. [Google Scholar] [CrossRef]
- Cai, R.; Ke, X.; Lyu, J.; Yang, H.; Zhang, M.; Yue, G.; Ling, W. Progress of circulating fluidized bed combustion technology in China: A review. Clean Energy 2017, 1, 36–49. [Google Scholar] [CrossRef]
- Mattisson, T.; Lyngfelt, A. A method of evaluating limestone reactivity with SO2 under fluidized bed combustion conditions. Can. J. Chem. Eng. 1998, 76, 762–770. [Google Scholar] [CrossRef]
- Borgwardt, R.H.; Bruce, K.R. Effect of specific surface area on the reactivity of CaO with SO2. AIChE J. 1986, 32, 239–246. [Google Scholar] [CrossRef]
- Adanez, J.; Gayan, P.; García-Labiano, F. Comparison of mechanistic models for the sulfation reaction in a broad range of particle sizes of sorbents. Ind. Eng. Chem. Res. 1996, 35, 2190–2197. [Google Scholar] [CrossRef]
- De las Obras-Loscertales, M.; de Diego, L.F.; García-Labiano, F.; Rufas, A.; Abad, A.; Gayán, P.; Adánez, J. Modeling of limestone sulfation for typical oxy-fuel fluidized bed combustion conditions. Energy Fuels 2013, 27, 2266–2274. [Google Scholar] [CrossRef]
- Zhang, X. Emission Standards and Control of PM2.5 from Coal-Fired Power Plant; IEA Clean Coal Centre: London, UK, 2016. [Google Scholar]
- Li, J.; Yang, H.; Wu, Y.; Lv, J.; Yue, G. Effects of the updated national emission regulation in China on circulating fluidized bed boilers and the solutions to meet them. Environ. Sci. Technol. 2013, 47, 6681–6687. [Google Scholar] [CrossRef]
- Chang, S.; Zhuo, J.; Meng, S.; Qin, S.; Yao, Q. Clean coal technologies in China: Current status and future perspectives. Engineering 2016, 2, 447–459. [Google Scholar] [CrossRef]
- Adanez, J.; Labiano, F.G.; Abánades, J.C.; De Diego, L.F. Methods for characterization of sorbents used in fluidized bed boilers. Fuel 1994, 73, 355–362. [Google Scholar] [CrossRef]
- Simons, G.A.; Garman, A.R.; Boni, A.A. The kinetic rate of SO2 sorption by CaO. AIChE J. 1987, 33, 211–217. [Google Scholar] [CrossRef]
- Zarkanitis, S.; Sotirchos, S.V. Pore structure and particle size effects on limestone capacity for SO2 removal. AIChE J. 1989, 35, 821–830. [Google Scholar] [CrossRef]
- Milne, C.R.; Silcox, G.D.; Pershing, D.W.; Kirchgessner, D.A. Calcination and sintering models for application to high-temperature, short-time sulfation of calcium-based sorbents. Ind. Eng. Chem. Res. 1990, 29, 139–149. [Google Scholar] [CrossRef]
- Laursen, K.; Duo, W.; Grace, J.R.; Lim, J. Sulfation and reactivation characteristics of nine limestones. Fuel 2000, 79, 153–163. [Google Scholar] [CrossRef]
- Abanades, J.C.; Anthony, E.J.; García-Labiano, F.; Jia, L. Progress of sulfation in highly sulfated particles of lime. Ind. Eng. Chem. Res. 2003, 42, 1840–1844. [Google Scholar] [CrossRef]
- Mahuli, S.K.; Agnihotri, R.; Chauk, S.; Ghosh-Dastidar, A.; Wei, S.H.; Fan, L.S. Pore-structure optimization of calcium carbonate for enhanced sulfation. AIChE J. 1997, 43, 2323–2335. [Google Scholar] [CrossRef]
- Rubiera, F.; Gracia-Labiano, F.; Fuertes, A.B.; Pis, J.J. Characterization of the reactivity of limestone with SO2 in a fluidized bed reactor. In Proceedings of the 11th International Conference on Fluidized Bed Combustion, Montreal, QC, Canada, 22–25 May 1991; pp. 1489–1495. [Google Scholar]


| Author | Method | Particle Size (μm) | Temperature (°C) | Atmosphere | SO2 Concentration (ppm) |
|---|---|---|---|---|---|
| Simons [27] | Fixed Bed Reactor | 1–78 | 850 | N2 + O2 + CO2 + H2O + SO2 | 297–315 |
| Zarkanitis [28] | TGA | 53–350 | 700–850 | N2 + O2 + SO2 | 3000–5000 |
| Milne [29] | Dispersed-Phase Isothermal Reactor | 4.1–49 | 980–1171 | N2 + O2 + SO2 | 1480 |
| Adánez [21,26] | TGA Bubbling Bed Reactor | 158–1788 | 800–900 | N2 + O2 + SO2 + CO2 | 2500 |
| Mattisson [19] | Fixed Bed Reactor | 45–2000 | 850 | N2 + O2 + SO2 + CO2 | 1500 |
| Fan [15] | Differential Bed Reactor | 7.5–150 (modified) | 900 | N2 + O2 + SO2 | 3900 |
| Laursen [30] | Fixed Bed | 212–355 | 850 | N2 + O2 + SO2 | 2250 |
| Abanades [31] | TGA | 70–1000 | 850 | N2 + O2 + SO2 | 500–5000 |
| Obras-Loscertales [22] | TGA Bubbling Bed Reactor | 200–630 | 800–950 | N2 + O2 + SO2 + CO2 | 1500–4500 |
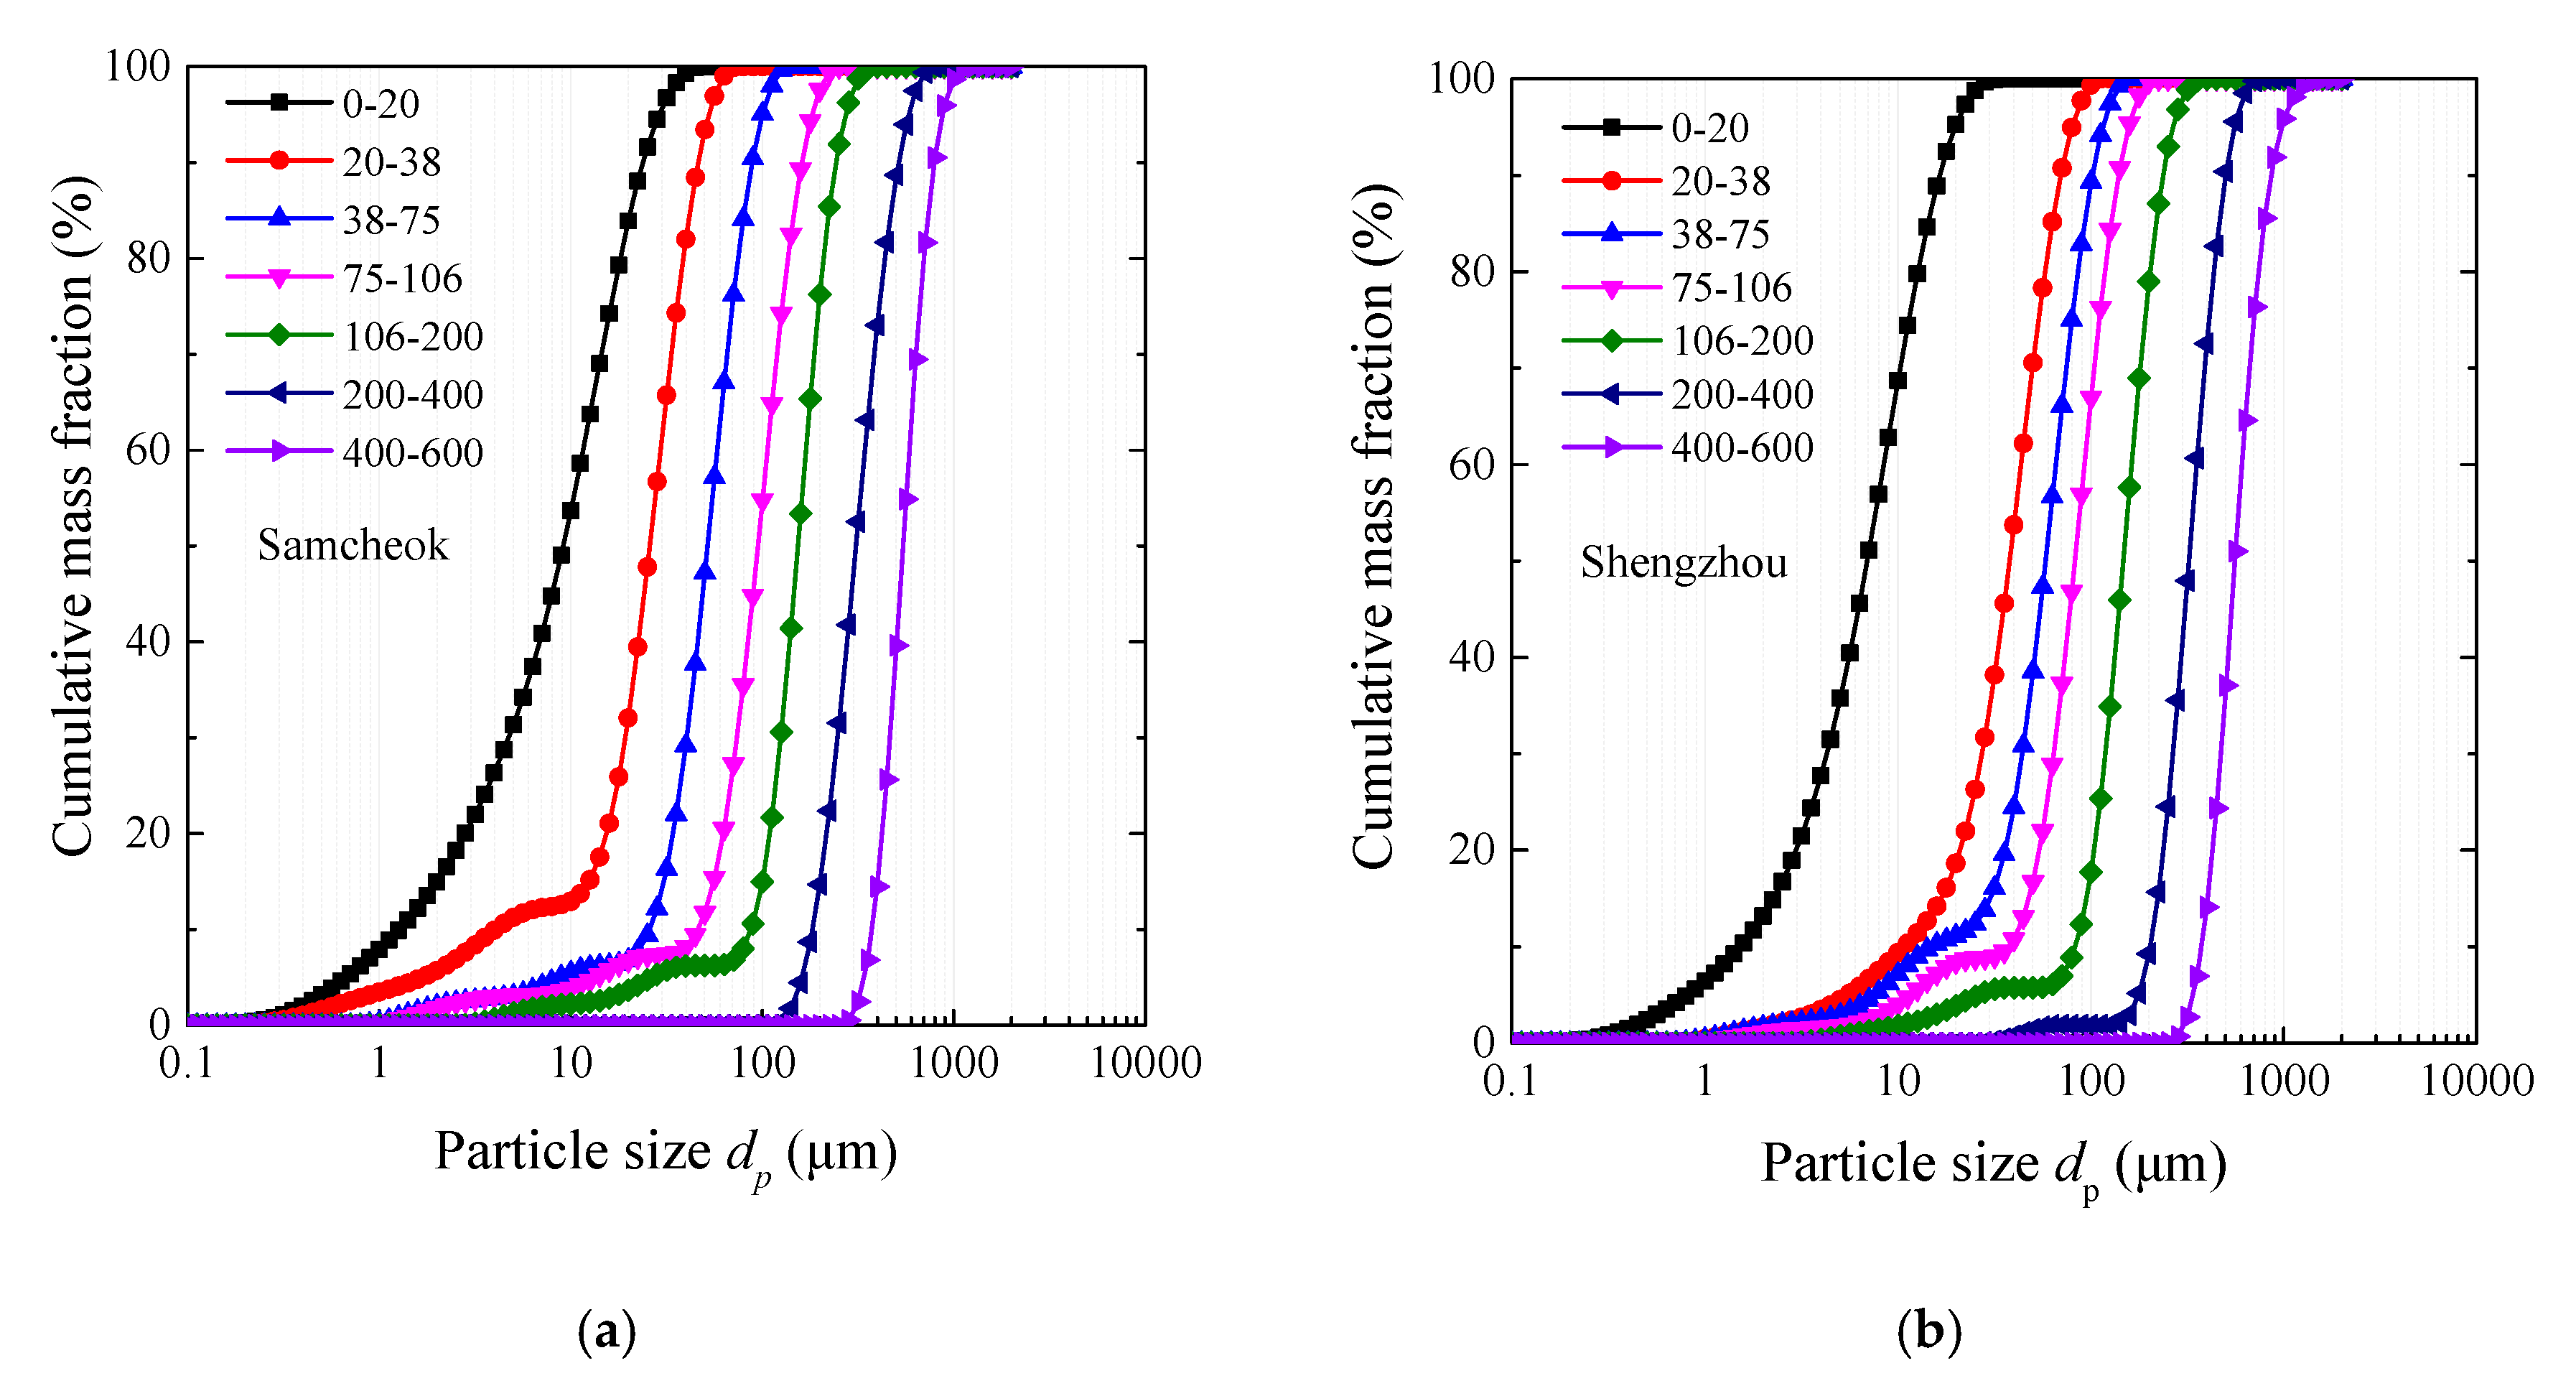
| Korea Samcheok | China Shengzhou | |||||||
|---|---|---|---|---|---|---|---|---|
| Particle Size (μm) | d10 | d50 | d90 | d32 | d10 | d50 | d90 | d32 |
| 0–23 | 1.4 | 10.3 | 26.7 | 3.4 | 1.7 | 7.8 | 18.4 | 3.5 |
| 20–38 | 4.5 | 29.1 | 51.9 | 7.4 | 10.8 | 37.9 | 69.7 | 17.9 |
| 38–75 | 29.1 | 58.2 | 99.3 | 26.3 | 16.7 | 65.4 | 114.0 | 26.5 |
| 75–106 | 52.0 | 106.5 | 180.7 | 35.5 | 42.8 | 93.6 | 158.0 | 39.4 |
| 106–200 | 98.2 | 172.6 | 271.3 | 86.2 | 93.5 | 165.4 | 265.1 | 91.9 |
| 200–400 | 205.8 | 346.2 | 577.9 | 320.4 | 228.1 | 362.4 | 560.0 | 308.1 |
| 400–600 | 421.4 | 609.7 | 886.1 | 586.4 | 421.9 | 627.2 | 963.3 | 602.8 |
| Parameters | LOI * | CaO | MgO | SiO2 | Al2O3 | Na2O | Fe2O3 | Others |
|---|---|---|---|---|---|---|---|---|
| Korea Samcheok | 42.40 | 52.82 | 2.42 | 0.92 | 0.58 | 0.16 | 0.37 | 0.32 |
| China Shengzhou | 42.75 | 55.92 | 0.21 | 0.38 | 0.20 | 0.16 | 0.06 | 0.21 |
| Shengzhou Limestone | |||||||||
| Particle size (μm) | d50 | 7.8 | 37.9 | 65.4 | 93.6 | 165.4 | 362.4 | 627.2 | |
| d32 | 3.5 | 17.9 | 26.5 | 39.4 | 91.9 | 308.1 | 602.8 | ||
| SO2 concentration (ppm) | 250 | Kc0 | 805.4 | 473.4 | 385.7 | 298.0 | 234.0 | 126.9 | 90.3 |
| Xs,max | 0.53 | 0.37 | 0.32 | 0.29 | 0.24 | 0.18 | 0.14 | ||
| 500 | Kc0 | 728.6 | 384.0 | 291.9 | 232.8 | 168.3 | 94.2 | 71.2 | |
| Xs,max | 0.54 | 0.39 | 0.34 | 0.30 | 0.25 | 0.21 | 0.15 | ||
| 1000 | Kc0 | 664.1 | 292.4 | 255.6 | 203.4 | 145.4 | 87.9 | 48.3 | |
| Xs,max | 0.59 | 0.41 | 0.36 | 0.32 | 0.27 | 0.24 | 0.19 | ||
| 2000 | Kc0 | 563.4 | 230.7 | 221.1 | 163.7 | 118.2 | 82.8 | 30.6 | |
| Xs,max | 0.62 | 0.44 | 0.39 | 0.37 | 0.32 | 0.27 | 0.22 | ||
| Samchoek Limestone | |||||||||
| Particle size (μm) | d50 | 10.3 | 29.1 | 58.2 | 106.5 | 172.6 | 346.2 | 609.7 | |
| d32 | 3.4 | 7.4 | 26.3 | 35.5 | 86.2 | 320.4 | 586.4 | ||
| SO2 concentration (ppm) | 250 | Kc0 | 732.6 | 487.4 | 381.2 | 251.4 | 184.4 | 117.1 | 90.1 |
| Xs,max | 0.39 | 0.29 | 0.21 | 0.17 | 0.15 | 0.14 | 0.11 | ||
| 500 | Kc0 | 673.9 | 415.4 | 311.0 | 213.0 | 145.8 | 100.5 | 58.7 | |
| Xs,max | 0.40 | 0.30 | 0.22 | 0.18 | 0.16 | 0.15 | 0.13 | ||
| 1000 | Kc0 | 560.4 | 327.5 | 290.1 | 205.4 | 130.7 | 87.9 | 41.3 | |
| Xs,max | 0.42 | 0.32 | 0.26 | 0.21 | 0.18 | 0.17 | 0.15 | ||
| 2000 | Kc0 | 437.9 | 262.8 | 177.2 | 166.4 | 108.6 | 66.4 | 36.3 | |
| Xs,max | 0.45 | 0.35 | 0.29 | 0.24 | 0.22 | 0.19 | 0.18 | ||
© 2019 by the authors. Licensee MDPI, Basel, Switzerland. This article is an open access article distributed under the terms and conditions of the Creative Commons Attribution (CC BY) license (http://creativecommons.org/licenses/by/4.0/).
Share and Cite
Cai, R.; Huang, Y.; Li, Y.; Wu, Y.; Zhang, H.; Zhang, M.; Yang, H.; Lyu, J. Effects of the Limestone Particle Size on the Sulfation Reactivity at Low SO2 Concentrations Using a LC-TGA. Materials 2019, 12, 1496. https://doi.org/10.3390/ma12091496
Cai R, Huang Y, Li Y, Wu Y, Zhang H, Zhang M, Yang H, Lyu J. Effects of the Limestone Particle Size on the Sulfation Reactivity at Low SO2 Concentrations Using a LC-TGA. Materials. 2019; 12(9):1496. https://doi.org/10.3390/ma12091496
Chicago/Turabian StyleCai, Runxia, Yiqun Huang, Yiran Li, Yuxin Wu, Hai Zhang, Man Zhang, Hairui Yang, and Junfu Lyu. 2019. "Effects of the Limestone Particle Size on the Sulfation Reactivity at Low SO2 Concentrations Using a LC-TGA" Materials 12, no. 9: 1496. https://doi.org/10.3390/ma12091496