Article

Colorimetric Detection of Mercury Ions in Water with Capped Silver Nanoprisms

1
Department of Zoology, Government College University, Lahore 54000, Pakistan
2
Department of Chemical Engineering, University of Waterloo, Waterloo, ON N2L 3G1, Canada
*
Author to whom correspondence should be addressed.
Materials 2019, 12(9), 1533; https://doi.org/10.3390/ma12091533
Submission received: 29 March 2019 / Revised: 6 May 2019 / Accepted: 7 May 2019 / Published: 10 May 2019
(This article belongs to the Special Issue Micro/Nano Materials for Clean Energy and Environment)

Abstract

:
The emission of mercury (II) from coal combustion and other industrial processes may have impacts on water resources, and the detection with sensitive but rapid testing methods is desirable for environmental screening. Towards this end, silver nanoprisms were chemically synthesized resulting in a blue reagent solution that transitioned towards red and yellow solutions when exposed to Hg2+ ions at concentrations from 0.5 to 100 µM. A galvanic reduction of Hg2+ onto the surfaces is apparently responsible for a change in nanoprism shape towards spherical nanoparticles, leading to the change in solution color. There were no interferences by other tested mono- and divalent metal cations in solution and pH had minimal influence in the range of 6.5 to 9.8. The silver nanoprism reagent provided a detection limit of approximately 1.5 µM (300 µg/L) for mercury (II), which compared reasonably well with other reported nanoparticle-based techniques. Further optimization may reduce this detection limit, but matrix effects in realistic water samples require further investigation and amelioration.

1. Introduction

Mercury has been emitted by various industrial processes over the past century, with artisanal gold mining and coal combustion as the two largest sources currently, at 775 and 558 Mg per year respectively [1]. For coal combustion, just under 30% of these emissions are in the divalent form [1], Hg2+, which tends to have a high water solubility and shorter lifetime in the environment resulting in more local deposition [2]. As a monitoring tool, it is desirable to measure mercury content in aqueous samples to identify water sources that may be impacted by mercury emissions, since the US EPA limit for drinking water is 0.01 µM (2 ppb) [3]. The most common laboratory methods, using cold vapor atomic fluorescence spectrometry or atomic absorption spectrometry, are sensitive and accurate but require specialized facilities and equipment [4]. For screening purposes, it is desirable to have simple and rapid measurement techniques that can be used in the field, even if their sensitivity, accuracy and selectivity may not be as good as laboratory instrumentation. Therefore, a variety of other mercury detection methods have been developed over the years, ranging from colorimetric to electrochemical methods [5]. Molecular-based optical methods for heavy metal ion detection [6] have been developed and extended to mercury, including a wide range of chemical-binding and fluorescence detection schemes [7]. Other examples for the detection of aqueous phase mercury (II) include a nanoparticle-functionalized carbon paper electrode [8], a gold nanoparticle-aptamer colorimetric method [9], and a gold nanozyme paper chip [10].
Nanoparticle (NP)-based detection of aqueous phase cations has been targeted for a range of metal analytes, including nickel using glutathione-functionalized gold [11] or silver [12] NPs, lead using glutathione-functionalized gold nanostars [13], and cobalt using glutathione-modified silver NP spherical, plate and rod shapes [14]. The detection mechanism in these reports has been based on the induction of NP aggregation by the cations, resulting in a color or spectral change in the solution. Likewise, DNA-functionalized gold NPs have been shown to detect Hg2+ [15] through a similar aggregation mechanism.
Indeed, a variety of gold and silver nanoparticle applications for colorimetric Hg2+ detection has been a focus of research in recent years [16]. The aggregation or disaggregation of gold nanoparticles (AuNPs), functionalized or capped with various surface ligands, has been used to generate a spectral shift or color change in the presence of Hg2+ [16]. Silver nanoparticles (AgNPs) can likewise undergo a spectral shift due to aggregation, but the reduction of Hg2+ by Ag oxidation is also cited as a mechanism for color change [16]. A color change with silver nanoprisms, capped with 1-dodecanethiol, was induced by Hg2+ in the presence of added iodide anions and attributed to a morphological transformation in the nanoprisms [17]. Limits of detection for the nanoparticle-based methods vary widely depending on the specific formulation and measurement method (e.g. instrumental versus visual), but they tend to fall within the range of 10 nM to 55 µM mercury (II) ions for AgNPs [16].
A variety of different AgNP synthesis methods have been reported in the context of mercury (II) ion detection. Biological “green” synthesis has been used for AgNPs that shift in colour from yellow to colorless in the presence of mercury ions [18]. Some AgNP detection methods for mercury ion have employed various surface modifications including oligonucleotides [19], glutathione [20], and leaf extracts [21], for example. Chemically-synthesized AgNPs with a cytosine triphosphate cap demonstrated a similar decrease in yellow colour in the presence of mercury [22]. Another chemically-synthesized AgNP with a gelatin functionalization likewise showed a color change from yellow to colorless for Hg2+ concentrations as low as 25 nM [23]. A different color change, from orange to yellow, was created using AgNPs aggregated by the combination of mercury and lysine [24].
The majority of reports have been based on spherical AgNPs, and the blue-shift in absorbance generally results in the disappearance of the initial yellow color. A few researchers have used non-spherical nanoparticles such as one using triangular nanoplates assembled into thin films which resulted in a blue color [25]. A nanoprism formulation had a Hg2+ detection limit as low as 3.3 nM but required the presence of added iodide [17]. For visual detection, there are some advantages of having a more intense starting color such as the blue color attributed to silver nanoplates and nanoprisms, since the blue-shift caused by mercury may result in a more visible color change from blue to yellow or colorless.
Therefore, in this work, a simple chemical synthesis technique was adopted from earlier work with silver nanoprisms [26] to formulate non-spherical AgNPs with a visually-intense blue starting color. A straightforward capping method using polyvinylpyrrolidone was used to stabilize the AgNPs in solution in a form that may be more commercially suitable for shelf-life (versus DNA and similar functionalizations), and that avoided the need for other reagents such as iodide. The response of these AgNPs was tested to measure the spectral response to Hg2+ in water, and the sensitivity and response to other metal cations were determined.

2. Materials and Methods

Analytical grade (or of the highest purity available) chemicals were used. Solutions were prepared with ultra-pure water of typical resistivity 18.2 MΩ·cm. All chemicals were purchased from Sigma Aldrich (Canada) including sodium borohydride (NaBH4, 99.99%), hydrogen peroxide (H2O2 30%), silver nitrate (AgNO3, 99.99%), trisodium citrate dihydrate (C6H5O7Na3 2H2O, 99.99%), HNO3 and polyvinylpyrrolidone (PVP, Mw = 40,000), and the metal salts BaCl2, CdCl2, Cd(NO3)2, CoCl2·6H2O, CuSO4, FeCl2, HgCl2, KCl, K2CrO4, MgSO4, MnSO4, NaCl and Pb(NO3)2. The metal ion stock solutions were prepared by dissolving a measured amount of salts in 100 mL deionized water and diluting further as necessary.
Silver nanoprisms were synthesized as follows. Sodium citrate (5.5 mM) was prepared in 100 mL deionized water, followed by adding 340 μL of AgNO3 (30 mM) and 560 μL H2O2 (30%). Then 2.3 mL NaBH4 (100 mM) was added and vigorously stirred. After 2 min, the colorless solution turned yellow and then rapidly darkened until a stable blue color was developed after 5 min. PVP was added at the final concentration of 0.03% as a capping agent to further stabilize the silver nanoprisms in solution. The synthesized AgNPs were stored in the dark and used as a stock solution [27]. The silver nanoprism solution absorbance was set by dilution to approximately 0.6 at 665 nm for use in mercury detection.
The synthesized silver nanoprisms were characterized using UV-visible spectrophotometry (HP 8542 Diode Array, Agilent Technologies, Santa Clara, CA, USA), energy-dispersive spectroscopy (EDX), transmission electron microscopy (TEM, Philips CM10, Amsterdam, The Netherlands), dynamic light scattering (DLS) and zeta potential. The colloidal solutions were centrifuged at 10,000 g and washed three times with deionized water. The washed samples were prepared by drying nanoparticles on a carbon tape. The elemental analysis of the nanoparticles was performed by energy dispersive X-ray (EDX) attached to the scanning electron microscope (model FEI/Philips XL30 FEG ESEM, Amsterdam, The Netherlands). The TEM samples were prepared by drop-coating the aqueous solution of nanoprisms onto a carbon coated copper grid (200 mesh), followed by air-drying for 2 h. TEM characterization was performed using a Philips CM10.
A Zetasizer Nano ZS90 (Malvern Instruments Ltd, Malvern, UK) was used to measure particle size distribution by DLS, polydispersity index, and zeta potential, using triplicate runs with 10 measurements in each, and the Dispersion Technology software 5.1. For this analysis, a refractive index of 1.5 was used and the viscosity was assumed to be equal to that of the dispersant liquid.
The PVP capped nanoprisms were tested with various metal ions in aqueous solution with pH ranging from 5.8 to 9.7. The pH-dependent response was tested by dissolving the previously mentioned heavy metal salts in buffer (5 mM phosphate buffered saline). For the detection of Hg2+, solutions of different concentrations were mixed with the AgNP reagent in a 1:1 ratio in a buffer solution and left at room temperature for 30 min, after which the absorption spectra were measured. The comparison of the nanoparticle response to Hg2+ versus other metal ions (Ba2+, Cd2+, Co2+, Cu2+, Fe2+, K+, Mg2+, Mn2+, Na+, Pb2+, Zn2+) was investigated under the same conditions. EDTA (ethylenediaminetetraacetic acid) chelation was used as a negative control to confirm the reaction with mercury (II) by binding the metal ions in solution. The mercury ions were mixed with 10 mM of EDTA solution before the addition of the AgNPs.

3. Results and Discussion

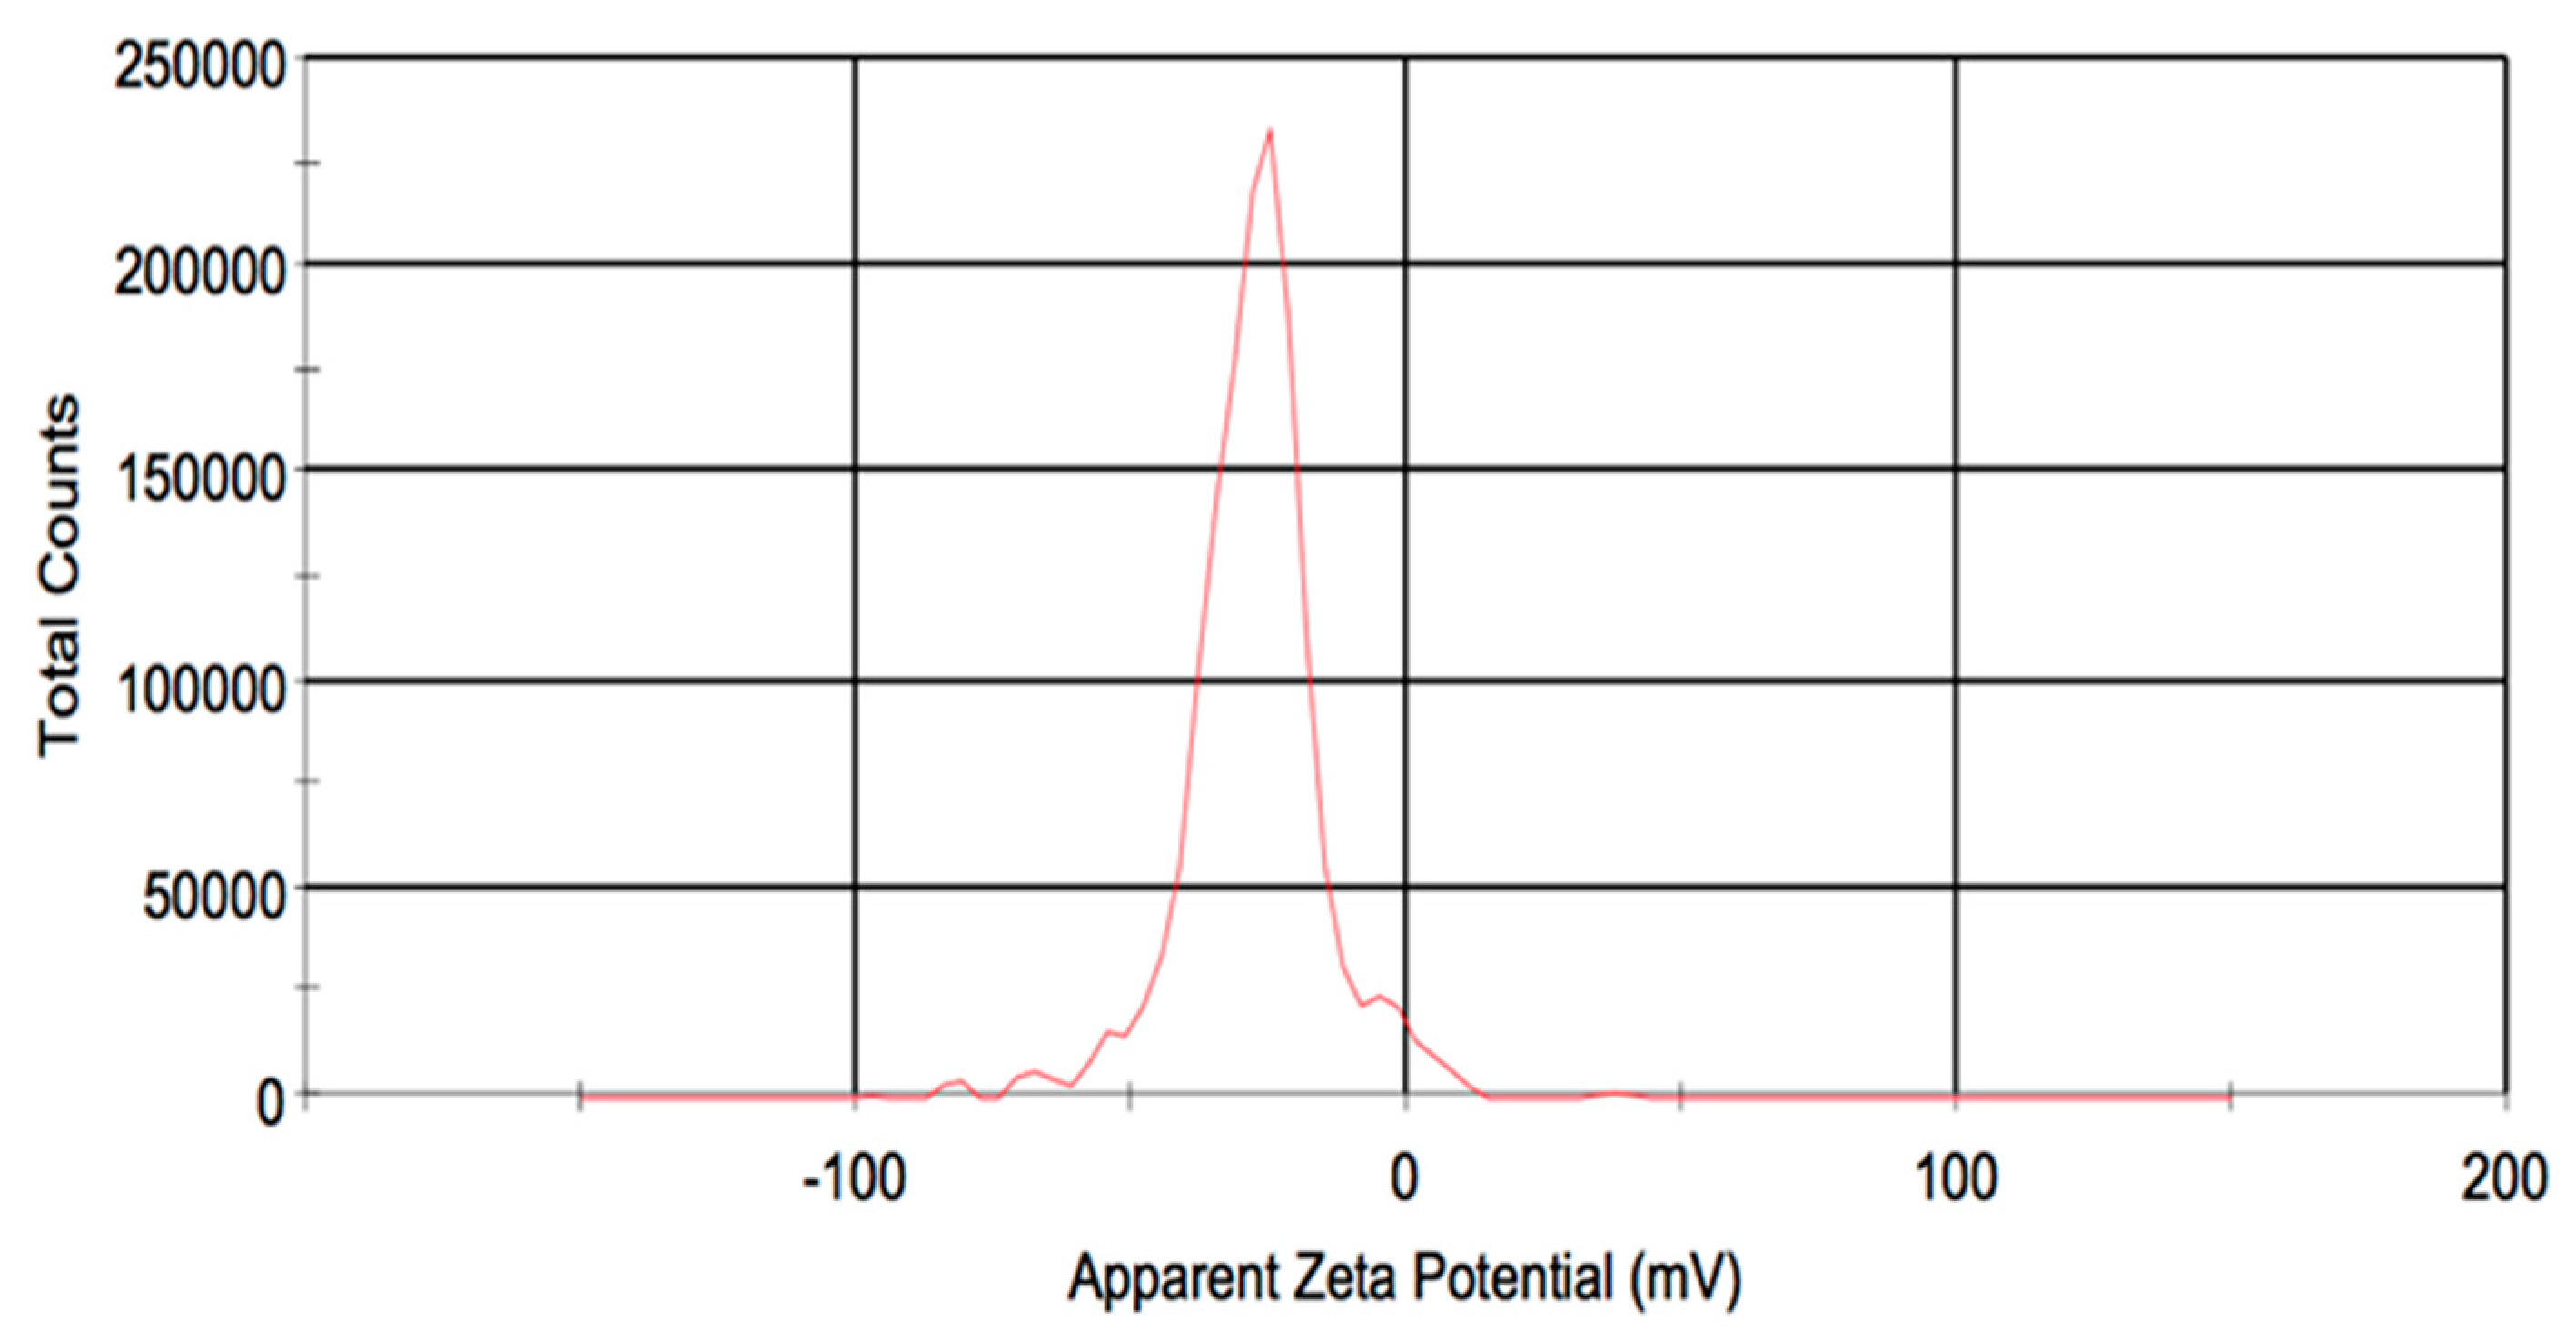
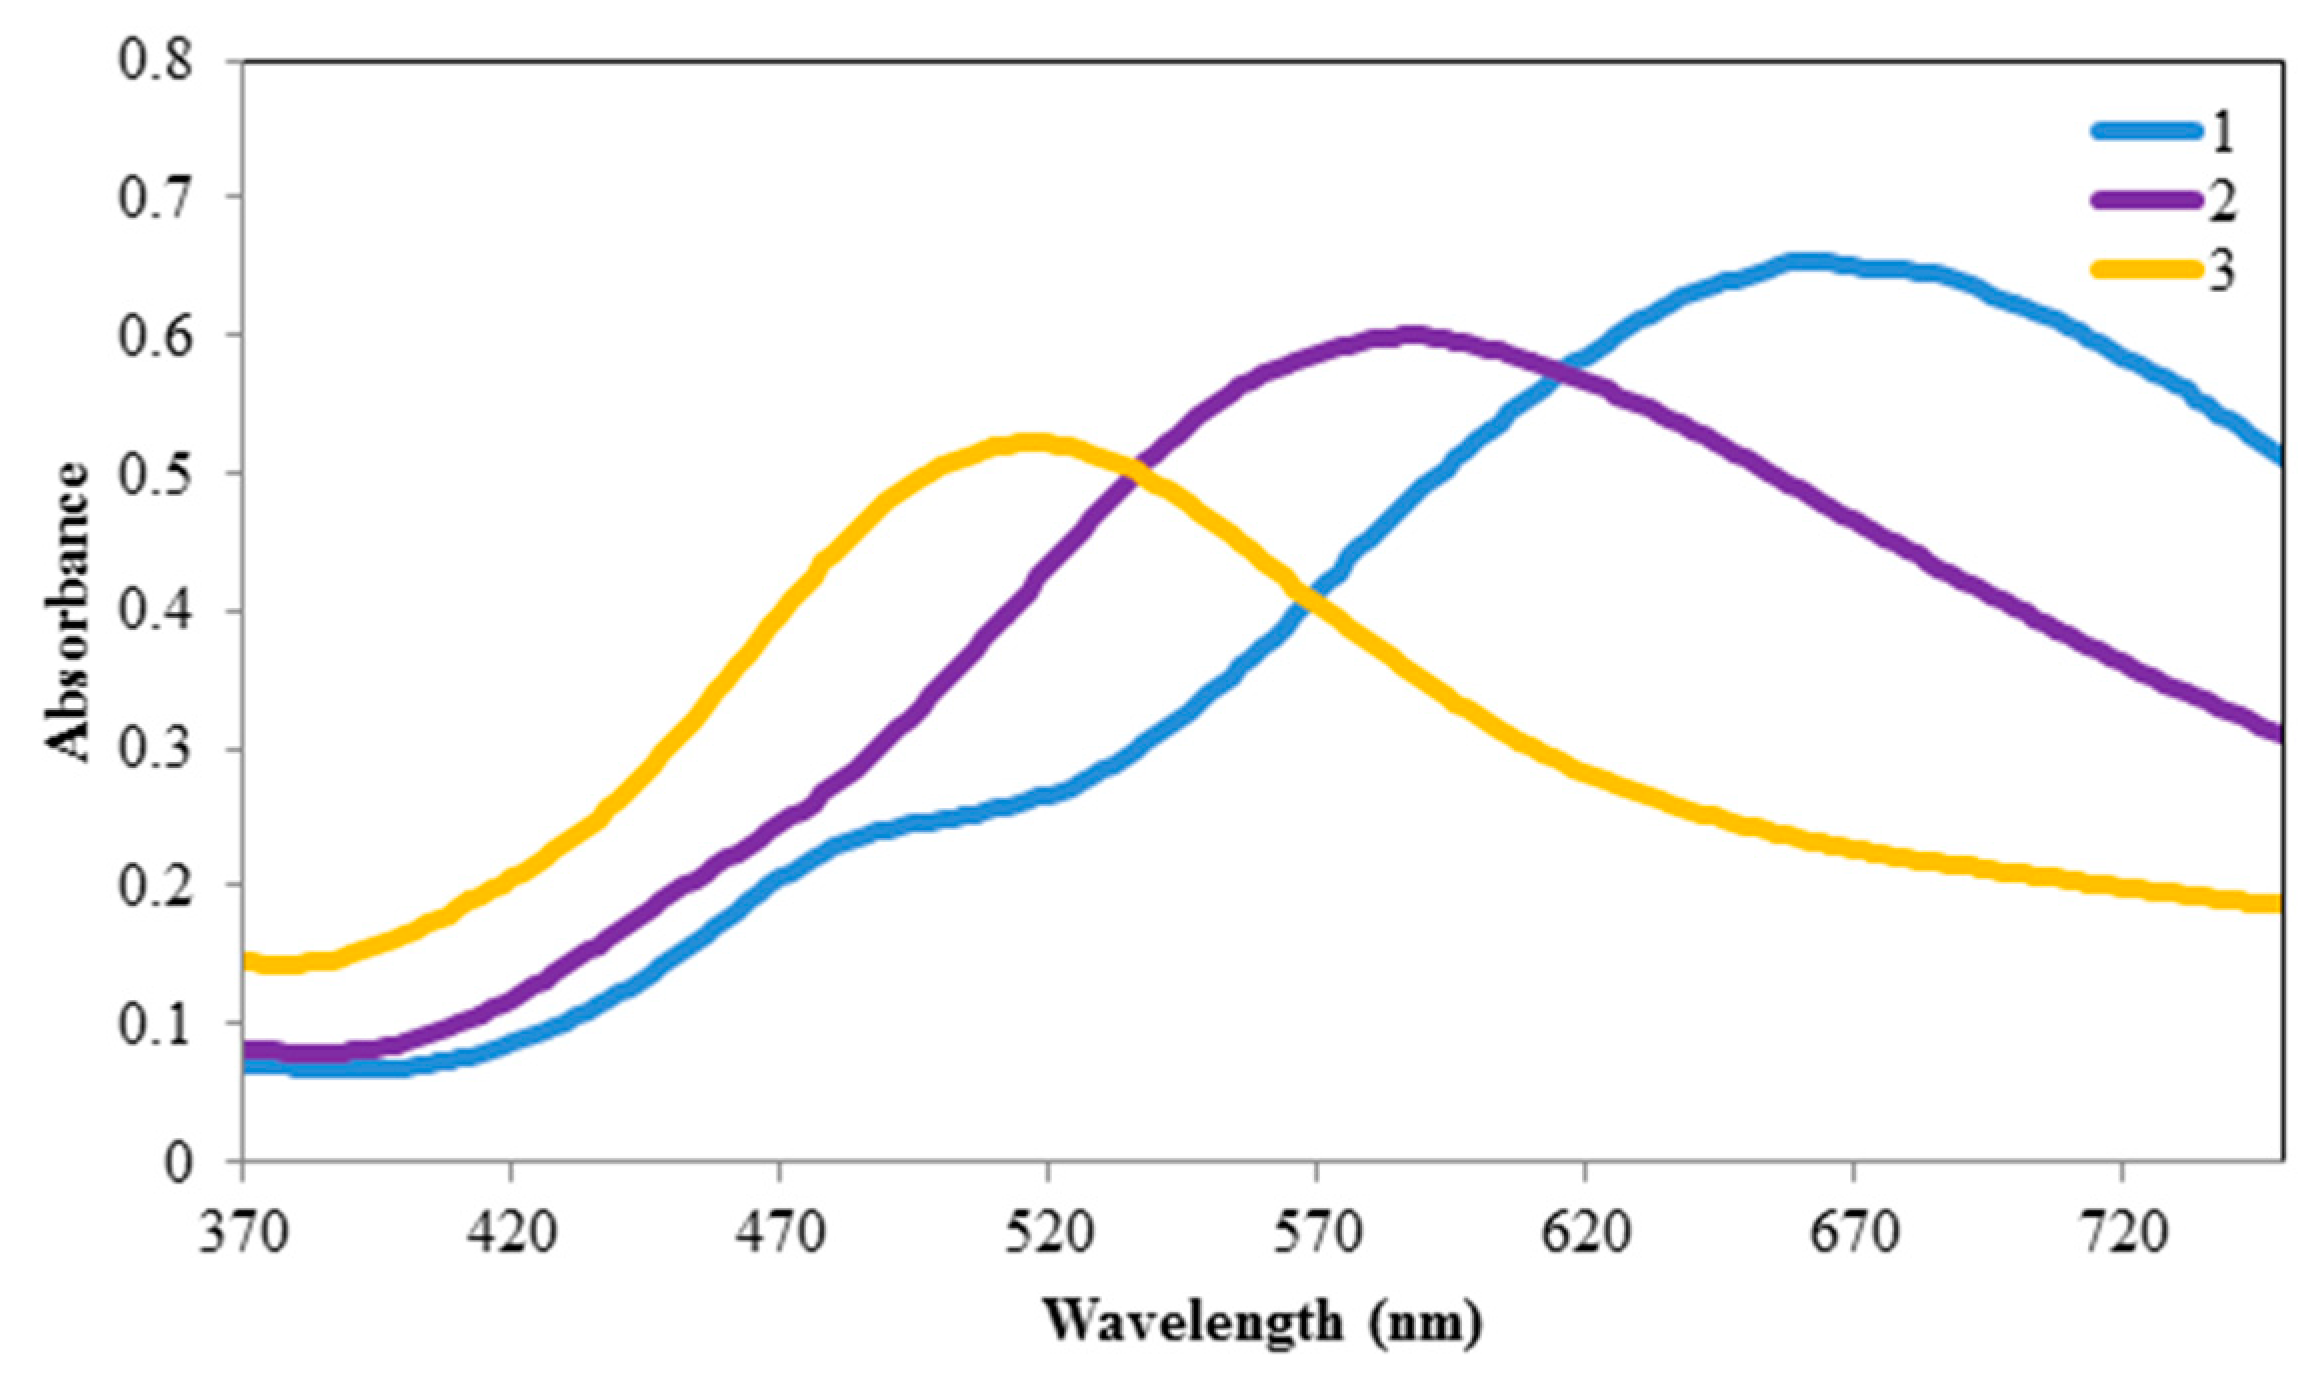
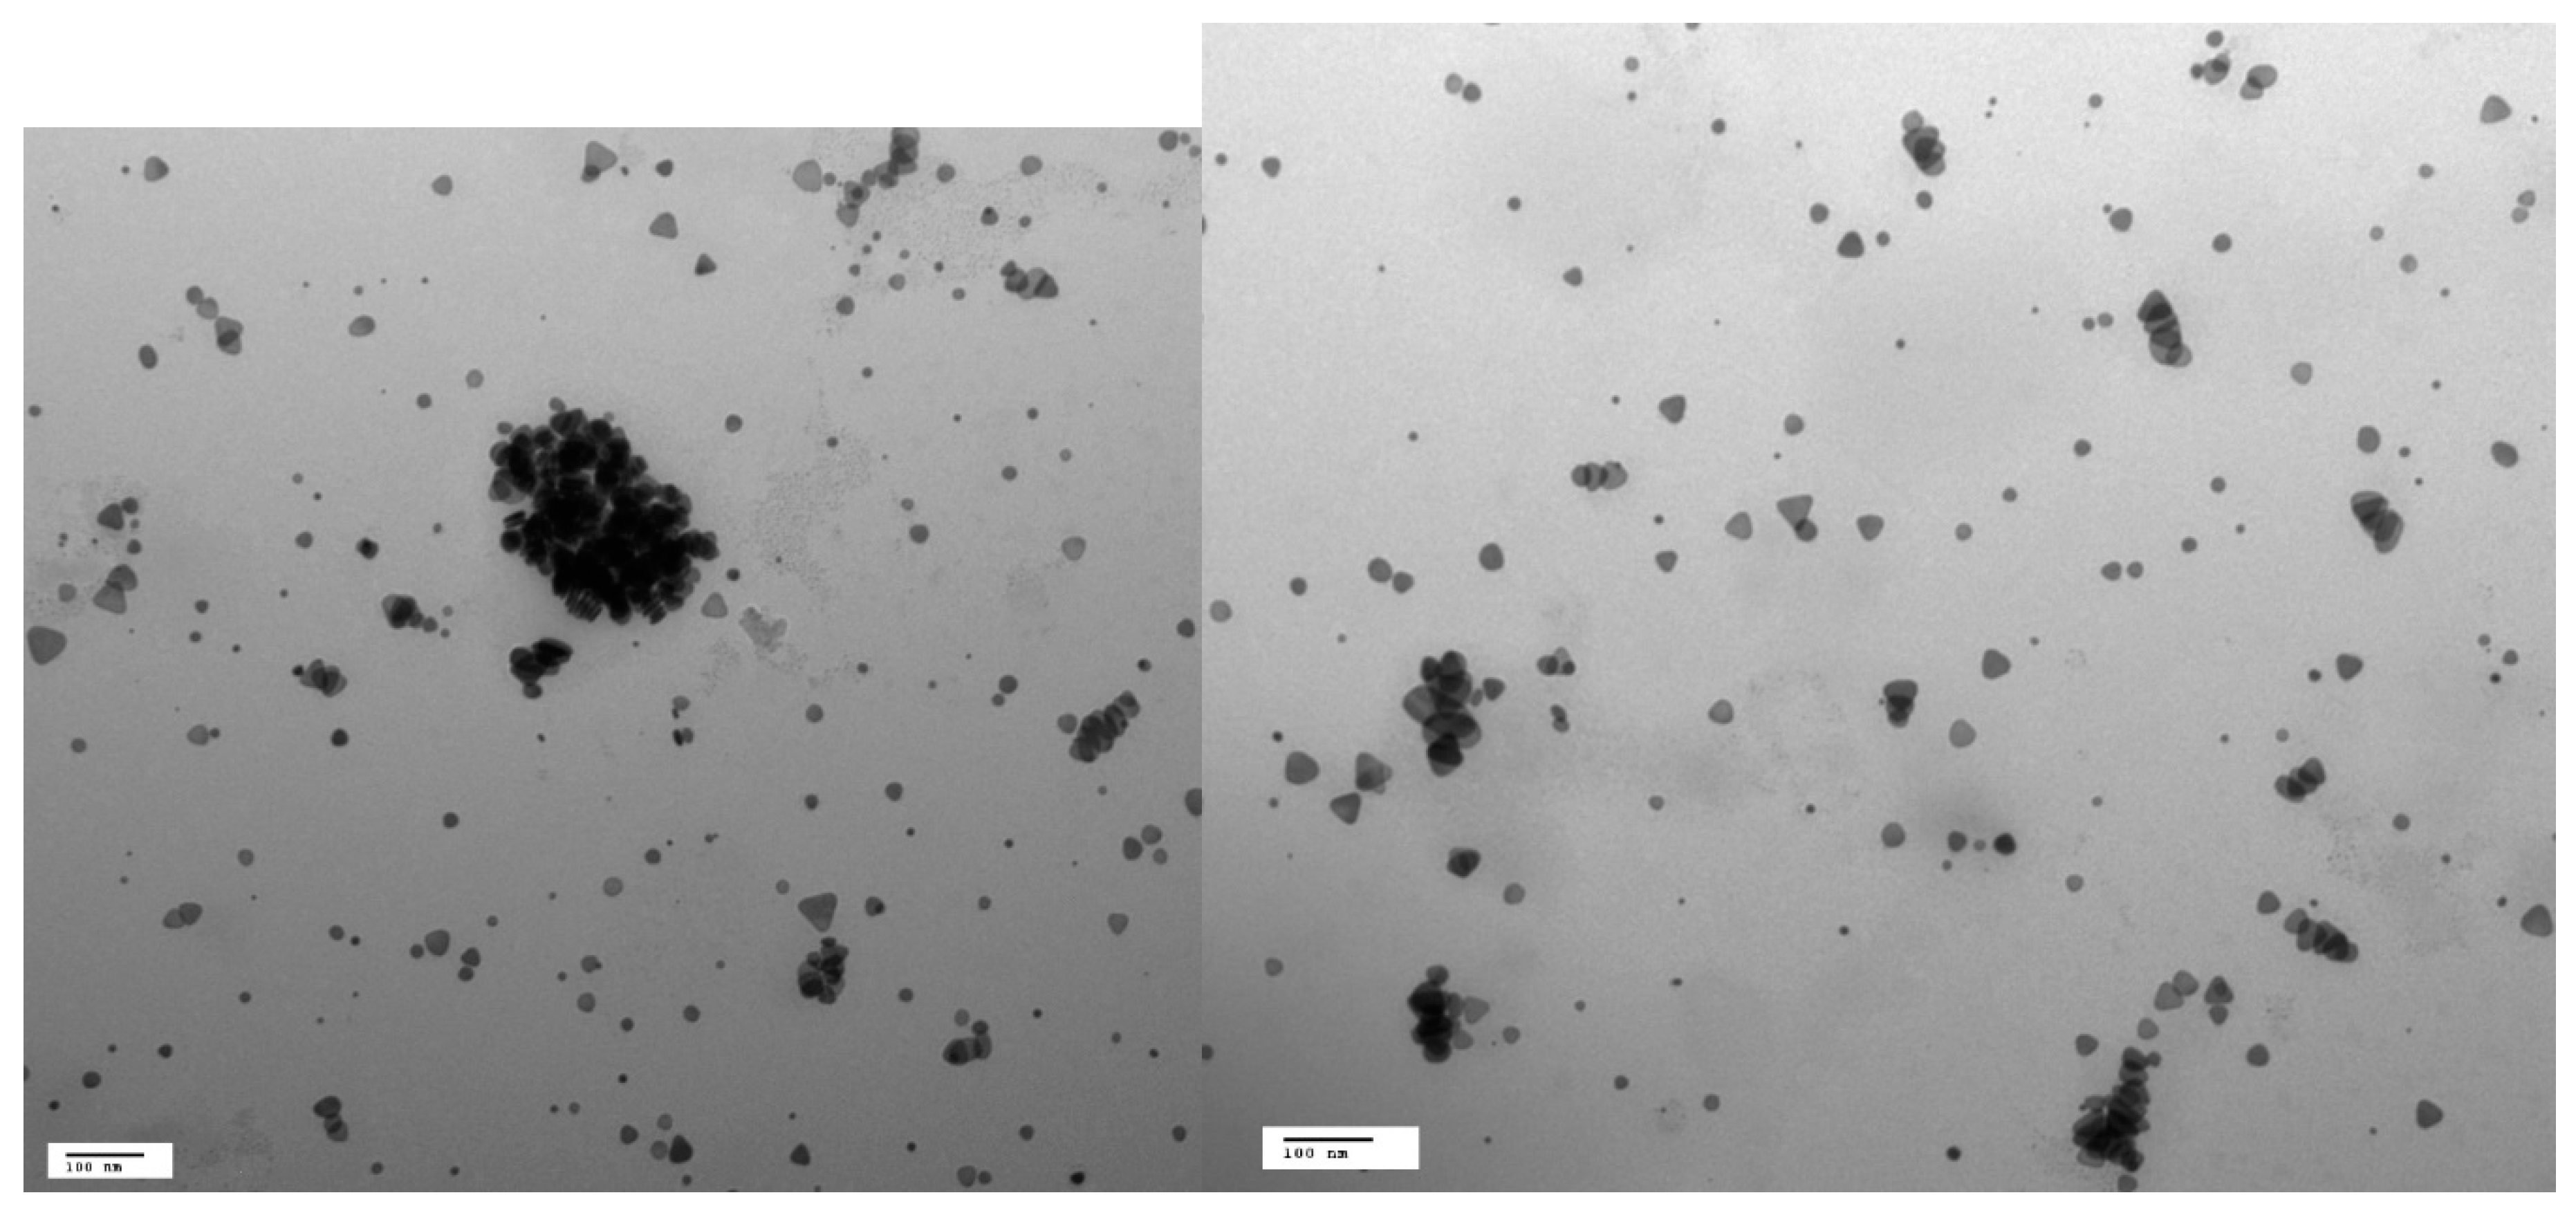
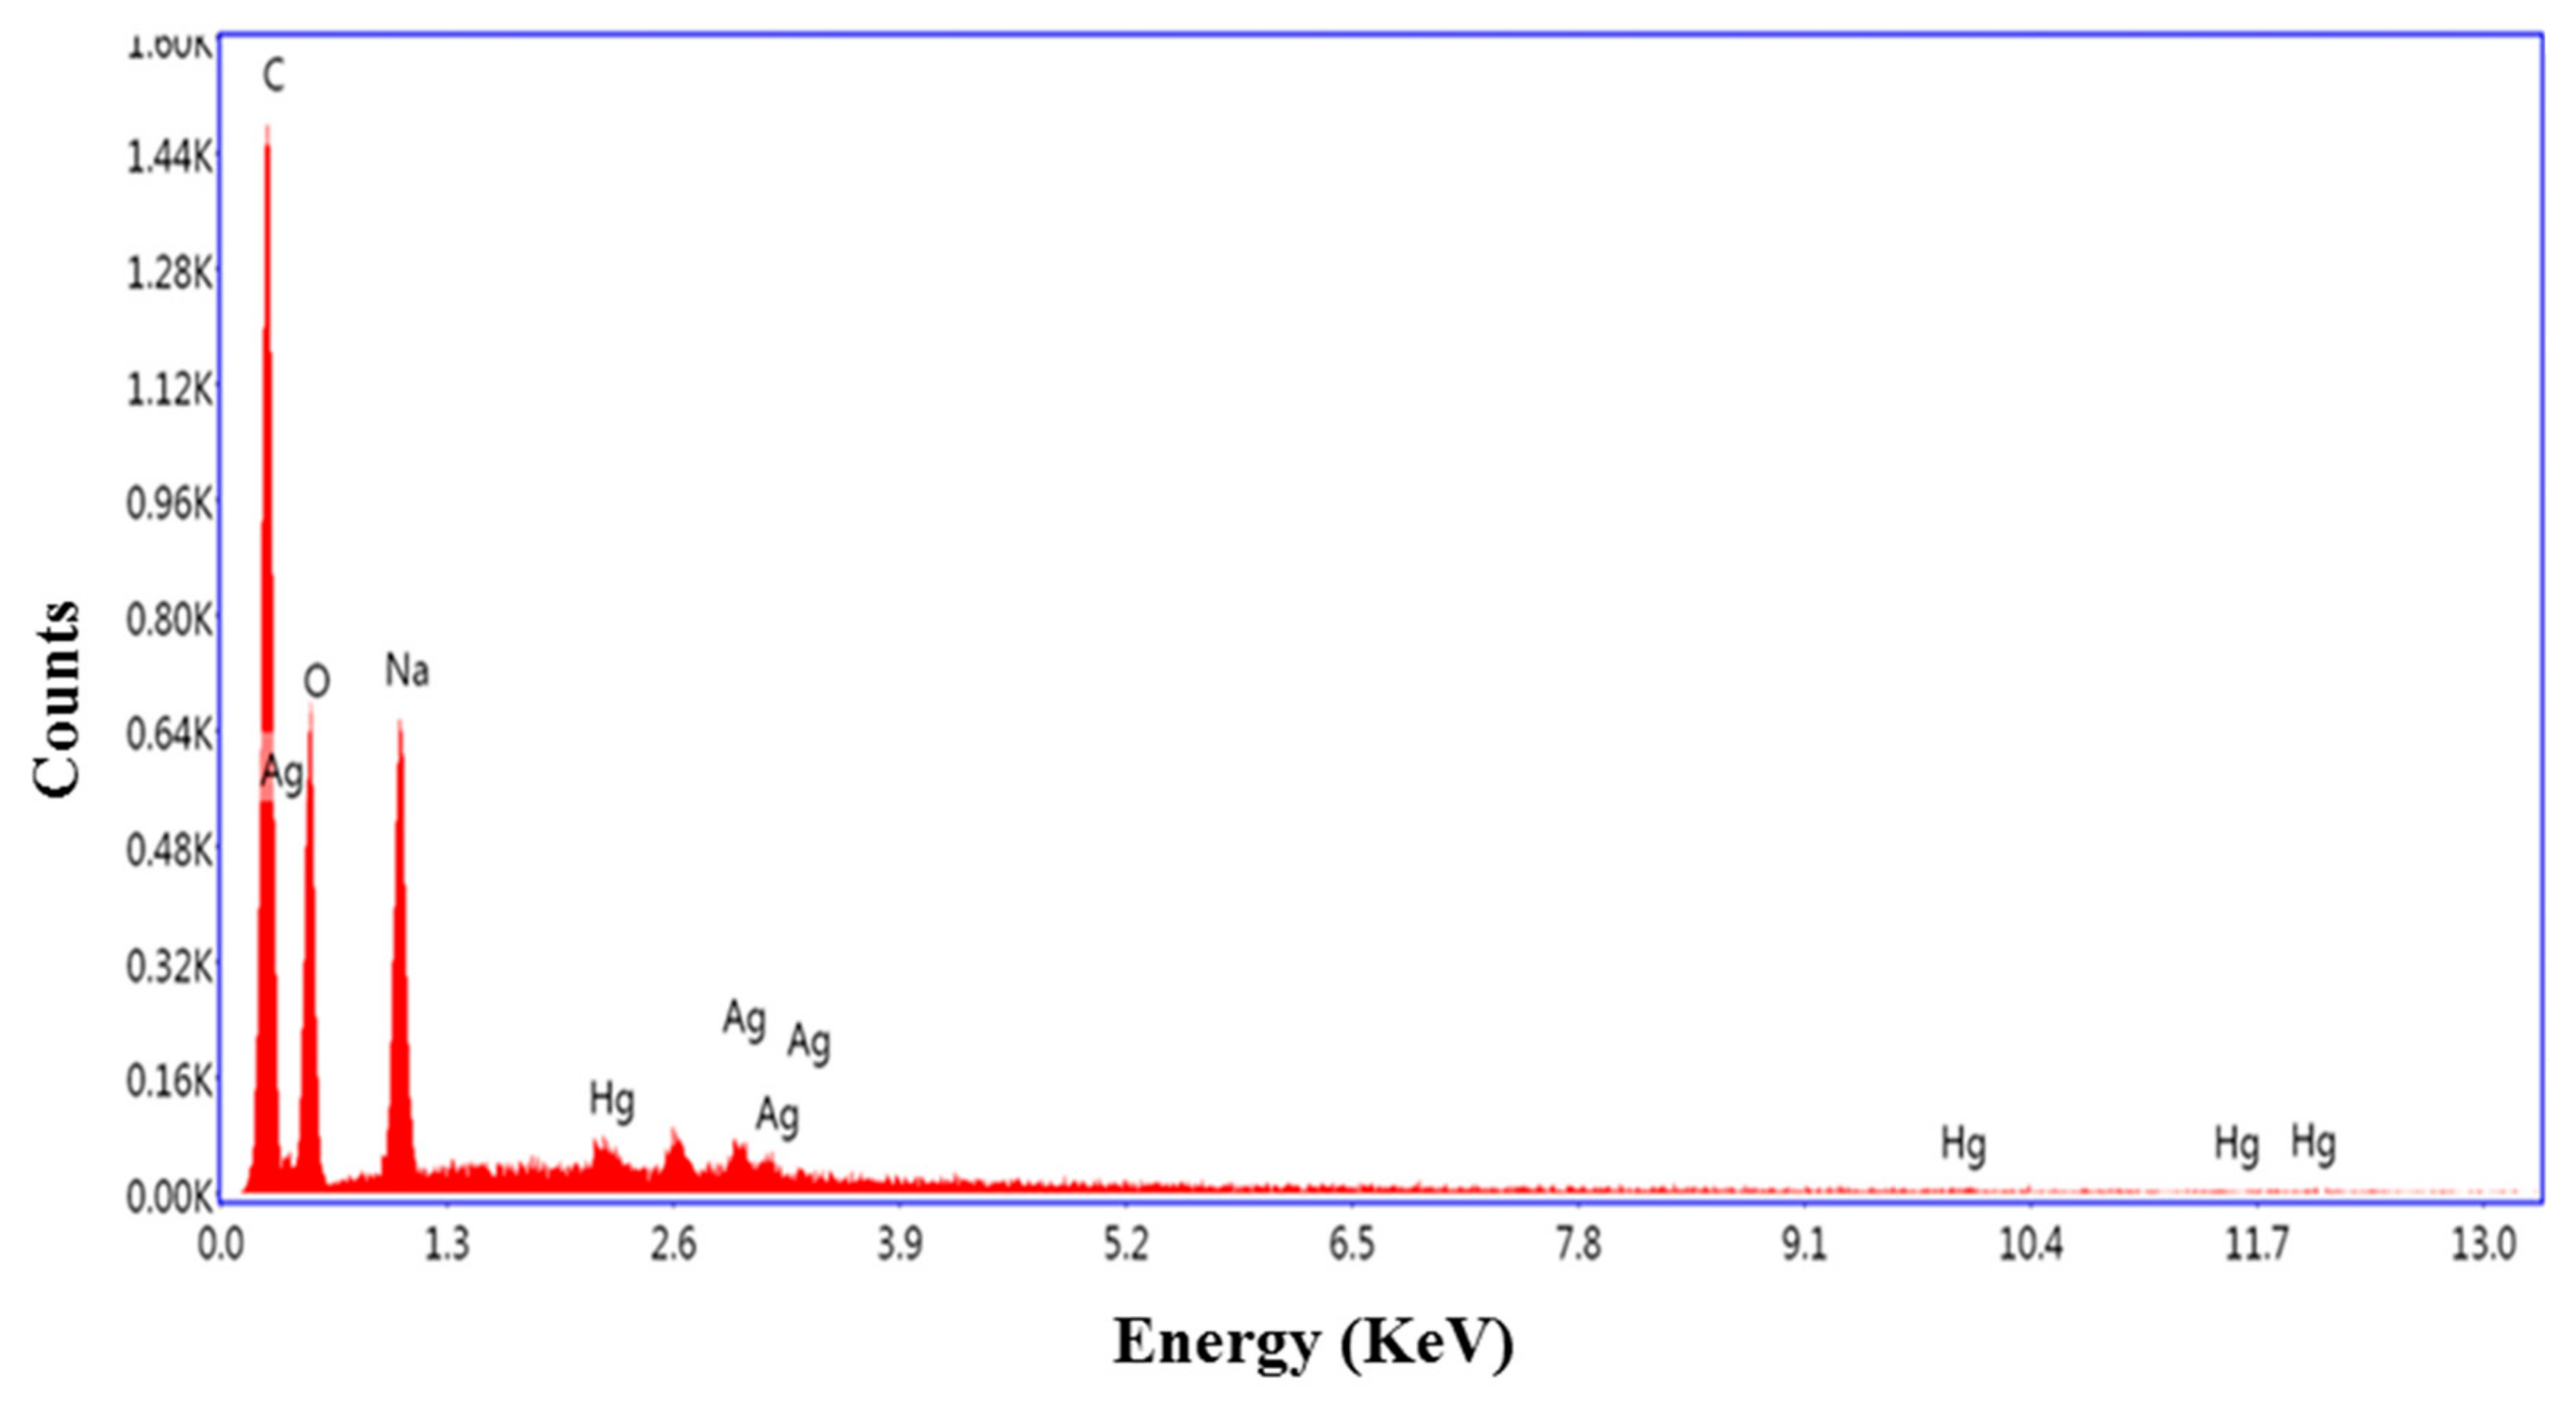
3.1. Characterization of the Nanoparticles

Silver nanoprisms were prepared as described using the chemical reduction of silver nitrate to form nanospheres and a yellowish color in solution. This is followed by the transition of the solution to a blue color as the hydrogen peroxide induces anisotropic oxidation of portions of the nanoparticles into Ag+ ions, with a concurrent transformation of the spheres into nanoprisms [28].
To verify the nature of the prepared colloidal suspension, the surface plasmon resonance (SPR) peak is seen in the absorbance spectrum (Figure 1). The spectral measurements of the colloidal solution clearly reflect a mixture of shapes since it features a small shoulder at around 450–475 nm (typical for nanospheres, with out-of-plane dipole resonance), and a more intense band at around 665 nm which has been reported previously for nanoprisms [26] with the in-plane dipole resonance of flatter shapes [29].
The morphology suggested by the spectral measurement is verified by TEM imaging, where the AgNPs (Figure 2A) appear as a mixture of larger nanoprisms with a size of approximately 20 to 50 nm, and some smaller nanospheres, as was also shown in prior work using a similar synthesis method [26]. The particle size distribution profile was determined by DLS (Figure 2B), with an average size of 34.5 ± 6 nm, which was in reasonable agreement with the TEM results shown here and in other work. The polydispersity index reported by the instrument was lower than 0.3 in all cases, which is indicative of a relatively monodisperse system. The particles were determined to be negatively charged with a zeta potential of −27.6 ±2 mV (Figure 3).
Elemental analysis of the AgNPs was performed using EDX (energy-dispersive X-ray spectroscope). The EDX spectrum (not shown) clearly indicated that the prepared samples were pure silver with no contaminating substances other than a peak corresponding to carbon, which can be attributed to the carbon-coated tape sample substrate, and possibly the PVP capping agent.

3.2. Spectral Shifts in the Presence of Hg+

The AgNPs were used to detect Hg2+ using the shift of the maximum absorption wavelength after a 30 min incubation time. As shown in Figure 4, the AgNPs in the absence of mercury were characterized by a blue color and peak at 665 nm (curve 1). When Hg2+ was added (curves 2 and 3) the peak absorbance wavelength blue-shifted to shorter wavelengths, resulting in a more reddish visual color (see Figure 9 for color photograph).
Thus, a blue-shift of the absorbance peak was observed in these experiments with a color change from blue (peak around 650 nm) to purple (peak around 530 nm) and eventually to yellow (peak around 450 nm) at high mercury concentrations. Some previous work has attributed the color shift to conformational changes in surface ligands, and/or aggregation of nanoparticles [15,19]. Other work has noted the reduction of Hg2+ onto the silver in the presence of H2O2 [20], and morphological changes to nanoprisms in the presence of iodide [17].
In this work, there was some evidence for aggregation, as indicated in the TEM images in Figure 5. However, the induction of aggregation by the divalent mercury cation is difficult to reconcile with the lack of response to other divalent cations, as discussed below. However, as can also be seen in Figure 5, the corners of some of the prismatic AgNPs were rounded or possibly removed upon interaction with Hg2+, similar to morphological changes noted by others [17]. This resulted in a mixture of shapes, as illustrated in Figure 5, with relatively fewer and smaller prismatic shapes as compared to the image in Figure 2. These morphological changes and the lack of response to other cations (discussed below) suggest that aggregation did not play the only role in the spectral response and color change.
The sharp edges of the nanoprisms are more likely prone to attack and in the presence of Hg2+ electrons could be initially extracted from the “corner” areas of the Ag nanoprisms resulting in the shape transformation. Unlike other reports of nanoprism morphology changes induced by Hg2+ [17], the response measured here did not require the addition of iodide and a thiol. The combination of silver or gold with mercury can lead to bimetallic colloids or amalgam formation, and this also leads to a blue shift of the absorption peak [30,31], although one report shows a slight red-shift in the presence of hydrogen peroxide [32]. An analysis of the AgNPs after exposure to mercury ion performed by EDX confirmed the presence of Hg in the colloids (Figure 6). Here, the Hg2+ detection appears to also be achieved by forming an Ag/Hg amalgam upon reduction of the mercury ion to elemental mercury by silver. The PVP AgNP capping agent may act as an electron donor, and the mercury reduction might also be supported by the PVP reduction abilities [33]. However, in the presence of the strong oxidizing agent (H2O2) used in the preparation of the nanoprisms, the continued presence of active reducing agents seems uncertain. Therefore, a galvanic replacement reaction, whereby a more reactive metal is dissolved and replaced by a less reactive one, seems more likely and this can occur rapidly at the nanoscale [34].

3.3. Sensitivity and Selectivity

The effect of pH on mercury detection was tested with 5 µM Hg2+ and the extent of the absorbance wavelength peak shift was quantified. As shown in Figure 7, the response of the AgNPs was relatively insensitive to pH ranging from 6.5 to 9.79, confirming that the PVP capped AgNPs exhibited excellent stability towards changes in pH in the neutral range [35]. A pH of 7.2 was selected to subsequently determine the sensitivity and selectivity since a commercialized test kit could readily incorporate a pH adjustment to neutral pH if necessary.
To evaluate the sensitivity of the nanoprisms to Hg2+ concentration, the absorption spectra of the AgNP solutions were measured under the optimized conditions, using different Hg2+ concentrations added to the solution, with incubation for 30 min. Figure 8A shows that increasing concentrations of Hg2+ resulted in a larger blue shift of the absorbance peak, as attributed to the morphology changes illustrated earlier. Therefore, the extent of the peak shift could potentially be employed as a quantitative analysis for Hg2+. This change in peak wavelength versus Hg2+ concentration (0.5–100 µM) relationship is shown in Figure 8B. A linear relationship was obtained over the range of 0 to 5 µM with a correlation coefficient of 0.993 (Figure 8B inset). The results indicate that this AgNP material could be used to detect Hg2+ at a detection limit of approximately 1.5 µM (approximately 300 µg/L), based on three standard deviations. Although not the most sensitive detection limit ever reported, it compares favorably with the range of 10 nM to 55 µM for other AgNPs reported in one review [16]. The standard deviations shown in Figure 8B suggest that the AgNPs may not be suitable for accurate quantification of Hg2+ at lower concentrations, but they may serve the purpose of rapid screening and “yes/no” detection of Hg2+ above some minimum threshold. Further improvements in sensitivity may be possible with optimization of the concentrations and ratios of AgNPs to sample solutions.
If a galvanic replacement reaction between Hg2+ and Ag0 is responsible for the detection mechanism and not just aggregation, as discussed earlier, then the AgNPs should not be reactive towards other cations in solution. To determine and verify the response of the nanoprisms towards Hg2+, the effects of Ba2+, Cd2+, Co2+, Cu2+, Fe2+, K+, Mg2+, Mn2+, Na+, Pb2+, and Zn2+ were determined individually under the selected test conditions. The results shown in Figure 9 indicated that Hg2+ alone caused a significant effect on the silver nanoparticles, as determined by spectroscopy (some examples of which color are shown in the Figure 9 inset). A 100-fold higher concentration of the other metal ions also had no significant effect on the SPR peak shift (not shown). These results indicate that the AgNPs exhibited a very high reactivity toward Hg2+ ions only, and provide further evidence that the interaction between the AgNPs and Hg2+ is primarily driven by a galvanic reaction. The standard reduction potentials for Hg2+ and Ag+ are 0.85 and 0.80 V, respectively, while those of the other species tested here are all <0.80 V [36]. Therefore, of all these metals only Hg2+ can potentially be reduced by silver, lending support to the hypothesis that a galvanic reaction is primarily responsible for the nanoprism morphology changes and SPR blue-shift, rather than aggregation effects alone. There are very few, if any, metals of environmental significance with a reduction potential >0.80 V, suggesting that the silver nanoprisms will always be selective towards mercury, in the absence of any other interfering effects that remain to be discovered. Mixtures of the other metal cations and Hg2+ were not tested but should be in future work to ensure that surface complexation by other metals will not inhibit or affect the AgNP interactions. Likewise, since these experiments were carried out with HgCl2 only, the effects of other counter-ions such as nitrate would be of interest to explore.
To further explore the nature of the nanoprism/metal interactions, negative control experiments were performed using the metal ion chelator EDTA. The various metal ions and Hg (II) were mixed with 10 mM EDTA and then allowed to interact with the prismatic silver reagent for 30 min. No color change was noted under these conditions, confirming that the previously measured effects are due to free Hg2+ and that chelated ions may not be detectable via this method.
Furthermore, some tests were completed in 0.2 µm filtered municipal tap water to assess the potential interference from other typical water species, with the results shown in Figure 10. Unlike the linear response in pure water and buffer solutions, AgNP responses in the tap water matrix showed a complex non-linear response to increasing Hg2+ concentrations. Further work remains to be pursued to determine the reasons behind this difference, but the presence of the oxidant hypochlorite (approximately 0.5 mg/L), alkalinity, or organic carbon such as humic substances may play a role. Matrix effects continue to be a challenge for many nanoparticle-based detection methods [37].

4. Conclusions

The technique explored in this study, using PVP-capped prismatic silver nanoparticles, provides a rapid, reasonably sensitive and very specific detection method for aqueous Hg2+ samples and may be potentially suitable for remote field and environmental analysis where more advanced instrumentation is not readily available. A galvanic reduction of Hg onto the silver leads to a loss of prismatic size and shape and a blue-shift in the absorbance spectrum, as suggested by TEM, the EDX spectrum, and the lack of sensitivity to other metal ions. The minimum detection limit for this reagent was found to be approximately 1.5 µM under controlled conditions, which may be suitable for environmental screening purposes but not for drinking water testing which requires a 0.01 µM or lower detection limit. The response of the AgNPs to Hg2+ alone was confirmed through experiments with a variety of other common metals ions in solution. Interactions with other cations and anions may alter the response to Hg2+, as shown in testing with a municipal water sample and this requires further study to identify the interference mechanisms. Using these prismatic silver nanoparticles may offer a useful approach for the detection of Hg2+ in aqueous environmental samples, but additional optimization work is required to lower the detection limit further and to ascertain how to minimize water matrix effects.

Author Contributions

Conceptualization, F.T. and S.T.; methodology, F.T., S.T., and R.A.; investigation, F.T. and R.A.; resources, W.A.A.; writing—original draft preparation, F.T. and R.A..; writing—review and editing, S.T., A.Y. and W.A.A.; supervision, A.Y. and W.A.A.; project administration, W.A.A. and S.T.; funding acquisition, W.A.A.

Funding

This research was funded in part by the Ontario Centers of Excellence Voucher for Innovation and Productivity I program. F. Tanvir was supported by an International Research Support Initiative Program grant offered by the Higher Education Commission (HEC) Islamabad, Pakistan.

Conflicts of Interest

The authors declare no conflict of interest. The funders had no role in the design of the study; in the collection, analyses, or interpretation of data; in the writing of the manuscript, or in the decision to publish the results.

References

  1. Streets, D.G.; Horowitz, H.M.; Lu, Z.; Levin, L.; Thackray, C.P.; Sunderland, E.M. Global and regional trends in mercury emissions and concentrations, 2010–2015. Atmos. Environ. 2019, 201, 417–427. [Google Scholar] [CrossRef]
  2. Zhang, L.; Wang, S.; Wu, Q.; Wang, F.; Lin, C.J.; Zhang, L.; Hui, M.; Yang, M.; Su, H.; Hao, J. Mercury transformation and speciation in flue gases from anthropogenic emission sources: A critical review. Atmos. Chem. Phys. 2016, 16, 2417–2433. [Google Scholar] [CrossRef]
  3. US EPA. Available online: https://safewater.zendesk.com/hc/en-us/articles/212076077-4-What-are-EPA-s-drinking-water-regulations-for-mercury- (accessed on 18 April 2019).
  4. Leopold, K.; Foulkes, M.; Worsfold, P. Methods for the determination and speciation of mercury in natural waters—A review. Anal. Chim. Acta 2010, 663, 127–138. [Google Scholar] [CrossRef]
  5. Martín-Yerga, D.; González-García, M.B.; Costa-García, A. Electrochemical determination of mercury: A review. Talanta 2013, 116, 1091–1104. [Google Scholar] [CrossRef] [PubMed]
  6. Uglov, A.N.; Bessmertnykh-Lemeune, A.; Guilard, R.; Averin, A.D.; Beletskaya, I.P. Optical methods for the detection of heavy metal ions. Russ. Chem. Rev. 2014, 83, 196. [Google Scholar] [CrossRef]
  7. Chen, G.; Guo, Z.; Zeng, G.; Tang, L. Fluorescent and colorimetric sensors for environmental mercury detection. Analyst 2015, 140, 5400–5443. [Google Scholar] [CrossRef]
  8. Bui, M.P.N.; Brockgreitens, J.; Ahmed, S.; Abbas, A. Dual detection of nitrate and mercury in water using disposable electrochemical sensors. Biosens. Bioelectron. 2016, 85, 280–286. [Google Scholar] [CrossRef] [PubMed] [Green Version]
  9. Wang, Y.; Yang, F.; Yang, X. Colorimetric biosensing of mercury (II) ion using unmodified gold nanoparticle probes and thrombin-binding aptamer. Biosens. Bioelectron. 2010, 25, 1994–1998. [Google Scholar] [CrossRef]
  10. Han, K.N.; Choi, J.S.; Kwon, J. Gold nanozyme-based paper chip for colorimetric detection of mercury ions. Sci. Rep. 2017, 7, 2806. [Google Scholar] [CrossRef] [PubMed] [Green Version]
  11. Fu, R.; Li, J.; Yang, W. Aggregation of glutathione-functionalized Au nanoparticles induced by Ni 2+ ions. J. Nanopart. Res. 2012, 14, 929. [Google Scholar] [CrossRef]
  12. Li, H.; Cui, Z.; Han, C. Glutathione-stabilized silver nanoparticles as colorimetric sensor for Ni2+ ion. Sens. Actuators B Chem. 2009, 143, 87–92. [Google Scholar] [CrossRef]
  13. D’Agostino, A.; Taglietti, A.; Bassi, B.; Donà, A.; Pallavicini, P. A naked eye aggregation assay for Pb 2+ detection based on glutathione-coated gold nanostars. J. Nanopart. Res. 2014, 16, 2683. [Google Scholar]
  14. Sung, H.K.; Oh, S.Y.; Park, C.; Kim, Y. Colorimetric detection of Co2+ ion using silver nanoparticles with spherical, plate, and rod shapes. Langmuir 2013, 29, 8978–8982. [Google Scholar] [CrossRef]
  15. Lee, J.S.; Han, M.S.; Mirkin, C.A. Colorimetric detection of mercuric ion (Hg2+) in aqueous media using DNA-functionalized gold nanoparticles. Angew. Chem. Int. Ed. 2007, 46, 4093–4096. [Google Scholar] [CrossRef] [PubMed]
  16. Zarlaida, F.; Adlim, M. Gold and silver nanoparticles and indicator dyes as active agents in colorimetric spot and strip tests for mercury (II) ions: A review. Microchim. Acta 2017, 184, 45–58. [Google Scholar] [CrossRef]
  17. Chen, L.; Fu, X.; Lu, W.; Chen, L. Highly sensitive and selective colorimetric sensing of Hg2+ based on the morphology transition of silver nanoprisms. ACS Appl. Mater. Interfaces 2012, 5, 284–290. [Google Scholar] [CrossRef]
  18. Farhadi, K.; Forough, M.; Molaei, R.; Hajizadeh, S.; Rafipour, A. Highly selective Hg2+ colorimetric sensor using green synthesized and unmodified silver nanoparticles. Sens. Actuators B Chem. 2012, 161, 880–885. [Google Scholar] [CrossRef]
  19. Wang, Y.; Yang, F.; Yang, X. Colorimetric detection of mercury (II) ion using unmodified silver nanoparticles and mercury-specific oligonucleotides. ACS Appl. Mater. Interfaces 2010, 2, 339–342. [Google Scholar] [CrossRef] [PubMed]
  20. Alam, A.; Ravindran, A.; Chandran, P.; Khan, S.S. Highly selective colorimetric detection and estimation of Hg2+ at nano-molar concentration by silver nanoparticles in the presence of glutathione. Spectrochim. Acta A 2015, 137, 503–508. [Google Scholar] [CrossRef] [PubMed]
  21. Manivel, P.; Ilanchelian, M. Selective and Sensitive Colorimetric Detection of Hg 2+ at Wide pH Range Using Green Synthesized Silver Nanoparticles as Probe. J. Clust. Sci. 2017, 28, 1145–1162. [Google Scholar] [CrossRef]
  22. Zhan, L.; Yang, T.; Zhen, S.J.; Huang, C.Z. Cytosine triphosphate-capped silver nanoparticles as a platform for visual and colorimetric determination of mercury (II) and chromium (III). Microchim. Acta 2017, 184, 3171–3178. [Google Scholar] [CrossRef]
  23. Jeevika, A.; Shankaran, D.R. Functionalized silver nanoparticles probe for visual colorimetric sensing of mercury. Mater. Res. Bull. 2016, 83, 48–55. [Google Scholar] [CrossRef]
  24. Li, L.; Gui, L.; Li, W. A colorimetric silver nanoparticle-based assay for Hg (II) using lysine as a particle-linking reagent. Microchim. Acta 2015, 182, 1977–1981. [Google Scholar] [CrossRef]
  25. Detsri, E. Novel colorimetric sensor for mercury (II) based on layer-by-layer assembly of unmodified silver triangular nanoplates. Chin. Chem. Lett. 2016, 27, 1635–1640. [Google Scholar] [CrossRef]
  26. Tanvir, F.; Yaqub, A.; Tanvir, S.; Anderson, W. Poly-l-arginine coated silver nanoprisms and their anti-bacterial properties. Nanomaterials 2017, 7, 296. [Google Scholar] [CrossRef]
  27. Panzarasa, G. Just What Is It That Makes Silver Nanoprisms so Different, so Appealing? J. Chem. Educ. 2015, 92, 1918–1923. [Google Scholar] [CrossRef]
  28. Torres, V.; Popa, M.; Crespo, D.; Moreno, J.M.C. Silver nanoprism coatings on optical glass substrates. Microelectron. Eng. 2007, 84, 1665–1668. [Google Scholar] [CrossRef]
  29. D’Agostino, A.; Taglietti, A.; Desando, R.; Bini, M.; Patrini, M.; Dacarro, G.; Cucca, L.; Pallavicini, P.; Grisoli, P. Bulk surfaces coated with triangular silver nanoplates: Antibacterial action based on silver release and photo-thermal effect. Nanomaterials 2017, 7, 7. [Google Scholar] [CrossRef]
  30. Rex, M.; Hernandez, F.E.; Campiglia, A.D. Pushing the limits of mercury sensors with gold nanorods. Anal. Chem. 2006, 78, 445–451. [Google Scholar] [CrossRef]
  31. Kamali, K.Z.; Pandikumar, A.; Jayabal, S.; Ramaraj, R.; Lim, H.N.; Ong, B.H.; Bien, C.S.D.; Kee, Y.Y.; Huang, N.M. Amalgamation based optical and colorimetric sensing of mercury (II) ions with silver@ graphene oxide nanocomposite materials. Microchim. Acta 2016, 183, 369–377. [Google Scholar] [CrossRef]
  32. Wang, G.L.; Zhu, X.Y.; Jiao, H.J.; Dong, Y.M.; Li, Z.J. Ultrasensitive and dual functional colorimetric sensors for mercury (II) ions and hydrogen peroxide based on catalytic reduction property of silver nanoparticles. Biosens. Bioelectron. 2012, 31, 337–342. [Google Scholar] [CrossRef]
  33. Wu, C.; Mosher, B.P.; Lyons, K.; Zeng, T. Reducing ability and mechanism for polyvinylpyrrolidone (PVP) in silver nanoparticles synthesis. J. Nanosci. Nanotechnol. 2010, 10, 2342–2347. [Google Scholar] [CrossRef]
  34. Wang, Y.; Wen, G.; Ye, L.; Liang, A.; Jiang, Z. Label-free SERS study of galvanic replacement reaction on silver nanorod surface and its application to detect trace mercury ion. Sci. Rep. 2016, 6, 19650. [Google Scholar] [CrossRef] [Green Version]
  35. Badawy, A.M.E.; Luxton, T.P.; Silva, R.G.; Scheckel, K.G.; Suidan, M.T.; Tolaymat, T.M. Impact of environmental conditions (pH, ionic strength, and electrolyte type) on the surface charge and aggregation of silver nanoparticles suspensions. Environ. Sci. Technol. 2010, 44, 1260–1266. [Google Scholar] [CrossRef]
  36. Haynes, W.M. The CRC Handbook of Chemistry and Physics, 97th ed.; CRC Press/Taylor & Francis: Boca Raton, FL, USA, 2017; p. 192+. [Google Scholar]
  37. Metreveli, G.; Philippe, A.; Schaumann, G.E. Disaggregation of silver nanoparticle homoaggregates in a river water matrix. Sci. Total Environ. 2015, 535, 35–44. [Google Scholar] [CrossRef]
Figure 1. Absorbance spectrum of the as-prepared silver nanoparticle (AgNP) reagent solution before exposure to mercury (II) ion.
Materials 12 01533 g001
Figure 2. (A) TEM micrograph with 100 nm scale bar, and (B) particle size distribution profile of silver nanoparticles measured by dynamic light scattering (DLS).
Materials 12 01533 g002
Figure 3. Surface charge distribution of Ag nanoprisms as measured by zeta potential.
Materials 12 01533 g003
Figure 4. Absorbance spectra of the AgNPs in the absence (1, right) and presence of 2.5 µM (2, center) and 5 μM (3, left) HgCl2, after exposure for 30 min.
Materials 12 01533 g004
Figure 5. TEM images, with 100 nm scale bar, of AgNPs after reaction with 10 µM Hg2+ for 30 min.
Materials 12 01533 g005
Figure 6. Elemental analysis, performed by energy dispersive X-ray spectroscopy (EDX), of Ag nanoparticles after exposure to mercury, indicating the formation of Ag-Hg amalgams.
Materials 12 01533 g006
Figure 7. Influence of pH on the extent of the SPR peak shift at 5 µM of Hg2+ in 5 mM phosphate buffered saline.
Materials 12 01533 g007
Figure 8. (A) UV−visible absorption spectra of the AgNPs after the addition of Hg2+ at various concentrations, with the peak shifting from the right (for 0 µM) to left as Hg2+ concentration increases up to 100 µM. (B) Peak wavelength of the AgNPs at varying concentrations of Hg2+ (0−100 µM), where the inset graph shows a linear regression for the range of 0 to 5 µM. The error bars show standard deviations (three measurements).
Materials 12 01533 g008
Figure 9. Effect of various metal ions (5 µM) dissolved in 5 mM phosphate buffered saline pH 7.2 on the net SPR shift, showing high reactivity with only Hg2+. Inset: photograph of AgNP solutions, showing color change with Hg2+ and lack of significant response to phosphate-buffered saline (PBS), deionized water (Control), and the other ions Cd2+, Pb2+ and CrO42- (labelled “Cr”) at 10 µM.
Materials 12 01533 g009
Figure 10. Silver nanoprism solution absorbance peak as a function of Hg2+ concentration in deionized (DI) water (upper curve) and municipal tap water (lower curve), showing non-linear blue-shift in the tap water matrix.
Materials 12 01533 g010

